Article

Spatiotemporal Patterns of Ozone and Cardiovascular and Respiratory Disease Mortalities Due to Ozone in Shenzhen

1
Faculty of Health, Medicine and Life Sciences, Maastricht University, MD 6200 Maastricht, The Netherlands
2
China National Environmental Monitoring Centre, Beijing 100012, China
3
Key Laboratory of Land Surface Pattern and Simulation, Institute of Geographic Sciences and Natural Resources Research, Chinese Academy of Sciences, Beijing 100101, China
4
Shenzhen Center for Disease Control and Prevention, Shenzhen 518055, China
*
Author to whom correspondence should be addressed.
These authors contributed equally to this work.
Sustainability 2017, 9(4), 559; https://doi.org/10.3390/su9040559
Submission received: 22 December 2016 / Revised: 29 March 2017 / Accepted: 31 March 2017 / Published: 7 April 2017

Abstract

:
In order to explore the temporal-spatial patterns and possible health effects of ozone in Shenzhen, daily concentrations of ozone and the daily mortality caused by cardiovascular and respiratory diseases were collected. Using Geographic Information System (GIS) and SPSS, the spatial and temporal patterns of ozone in Shenzhen were illustrated. Using a generalized additive model (GAM), the associations between ozone and cardiovascular and respiratory diseases causing mortality were analyzed, adjusted for meteorological factors and other major air pollutants including fine particulate matter (PM2.5), nitrogen dioxide (NO2) and carbon monoxide (CO), and stratified by lag, age, and gender. The results showed that, during 2013, ozone was the second main air pollutant in Shenzhen apart from PM2.5, with average daily concentrations of 95.9 µg/m3 and 76.8 µg/m3 for the ozone 1-h mean and the daily ozone 8-h maximum concentration, respectively. The daily level of ozone had a higher concentration from September to October, and relatively low concentration from May to June. Obviously, a higher concentration was found in central parts of Shenzhen with the largest population, indicating higher risks. The excess risk (ER) percentage of the cardio-respiratory mortality rate showed a clearly accumulative effect at L03, with the highest ER percentage of 1.08 (0.88–1.27) per 10 µg/m3 increase in the ozone 8-h maximum concentration for all the population. Males were found to be more sensitive to ozone compared with females, and the elderly were more susceptible to ozone exposure than younger people.

1. Introduction

Ozone is a secondary pollutant which is not directly emitted into the atmosphere but is created and destroyed by chemical reactions of other emitted species. Ozone is formed in the atmosphere by photo-chemical reactions in the presence of sunlight and precursor pollutants, such as the oxides of nitrogen (NOx) and volatile organic compounds (VOCs). It is destroyed by reactions and then is deposited to the ground. Various other toxic photochemical oxidants arising from similar sources, including nitric acid and hydrogen peroxide, could also influence ozone formation [1].
Through epidemiologic and experimental studies, ground level ozone exposure has been solidly proved to be associated with total mortality, hospital admissions, respiratory symptoms, cough, chest pain, wheezing, asthma, airways inflammation, bronchitis, and cardiopulmonary disease [2,3,4,5]. For the association of ozone exposure and cardiovascular disease, the evidence was less conclusive, more heterogeneous, and subject to substantial uncertainty according to a recent review [6], and the mechanisms of ozone associated with cardiovascular diseases were also less clear because ozone reacts with respiratory tissues firstly. However, there have been epidemiological studies continually identifying that ozone could enhance cardiovascular related morbidity, probably through its pro-inflammatory effects on the lung [7,8,9,10]. Many factors could influence health effects caused by ozone, including the concentration and duration of the exposure [11], and the susceptibility of the subject itself. Other confounders like the meteorological conditions, other air pollutants and even individual behavior could also influence the association between health impact and ozone [12,13]. According to former research, ozone is more likely to reach unhealthy levels under hot and dry weather [14]. With global warming, ozone pollution, particularly in hot coastal regions, will become riskier for public health. The association between daily mortality and ozone levels has been proved to be independent of the effects of particulate matter, but not for NOx and CO, which could accelerate the formation or decomposition of ozone and thus influence the concentration [15]. Controlling these confounders in ozone related epidemiological studies is crucial to identifying its health risks.
Ground level ozone has become the secondary ambient air pollutant, following fine particulate matter (PM2.5), in many southern cities in China. However, recent studies on air pollution and health have mainly focused on the primary pollutants such as nitrogen oxides (NOx) and fine particulate matter [16,17,18,19,20,21,22]; less focus has been put on ozone research and related health risks assessment. With the increasing emphasis on primary air pollutants control (mainly NOx and SO2), it is possible to experience an increase in the ozone concentration in China [23]. Hence, it is necessary to explore the ozone distribution pattern and its health risks to provide scientific evidence on a strategic approach to control ozone pollution, and more importantly to facilitate health precaution strategies.
In this study, we carried out a systemic analysis on temporal-spatial patterns of ozone in Shenzhen and explored the associations between ozone and cardiovascular-respiratory disease-caused mortality, adjusted for meteorological factors and other air pollutants (PM2.5, NO2 and CO), and stratified by lag days, gender and age. The objectives were to identify the spatial and temporal patterns of ozone and to elucidate the health risks caused by ozone pollution.

2. Materials and Methods

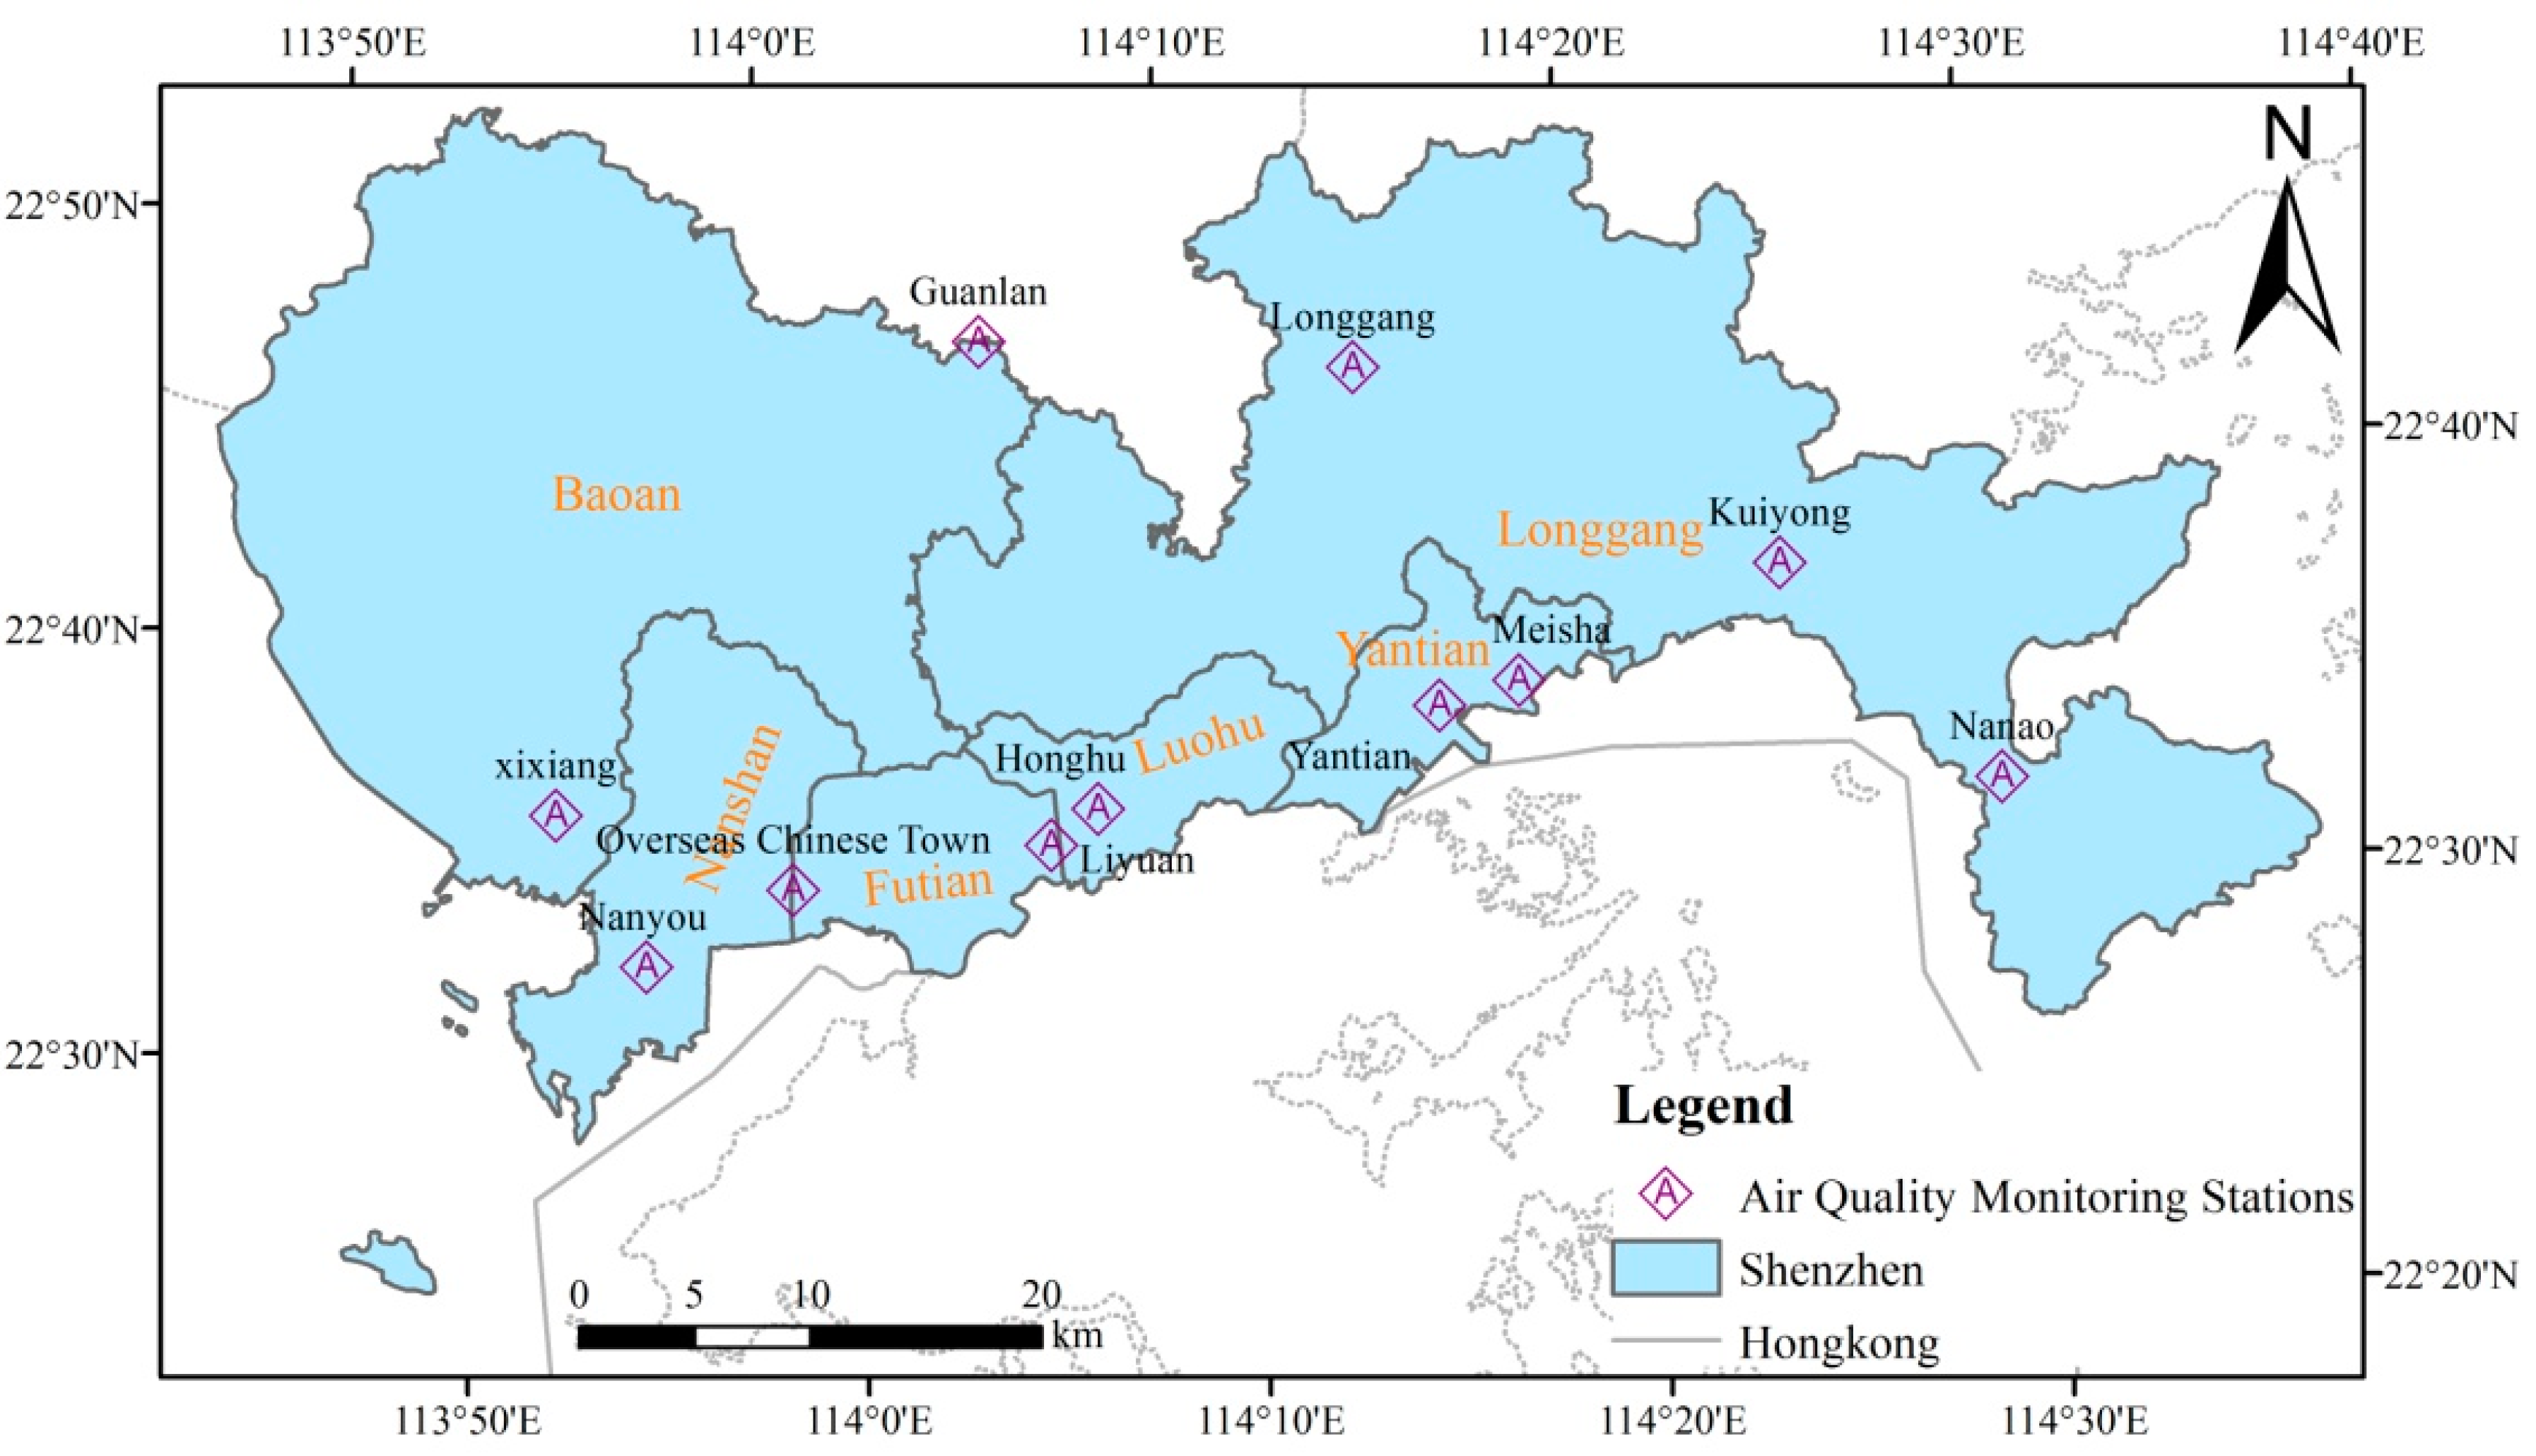
2.1. Study Area and Population

Shenzhen is a coastal city in the south of the Guangdong province in China, located in the Pearl River Delta. It has a subtropical oceanic climate, with warm weather and abundant rainfall. The annual average temperature is 22.4 °C, the average monthly temperature is 15.4 °C in January and 28.9 °C in July. Shenzhen has become China’s most crowded city and is the fifth most densely populated city in the world, with a population density of 17,150 per square km. According to the Ministry of Environmental Protection of China, air quality is relatively good in Shenzhen and it is ranked seventh among the 74 first-stage cities implementing the National Ambient Air Quality Standard (NAAQS, GB3095-2012) in 2013. However, Shenzhen has been experiencing elevated levels of air pollution in recent years because of rapid economic development, particularly concerning ozone pollution.

2.2. Data Sources

2.2.1. Mortality Data

Cardiovascular and respiratory disease-caused mortality data from 1 January to 31 December 2013, was obtained from death certificates recorded at the Shenzhen Center for Disease Control and Prevention. The causes of death are coded according to the International Classification of Disease revision 10 (ICD-10). In this study, cardiovascular disease-caused death (CVD) (I00-I99) and respiratory disease-caused death (RD) (J00-J98) were identified.

2.2.2. Air Pollutants and Meteorological Data

In 2013, Shenzhen introduced the NAAQS. Air quality data was provided by the Shenzhen Environmental Monitoring Center and the China National Environmental Monitoring Center. The daily ambient air concentration of ozone was provided as the daily 1-h mean value and the daily 8-h maximum value, measured from eleven state-controlled monitoring stations in Shenzhen. Daily mean concentrations of PM2.5, nitrogen dioxide (NO2), and carbon monoxide (CO) were also obtained from Shenzhen monitoring stations.
The location of these monitoring stations is presented in Figure 1. According to the technical guidelines of the Chinese government, the location of these monitoring stations must not be in the direct vicinity of traffic intersections or of major industrial polluters, and should also be located at a sufficient distance from any other emitting source. Thus, the monitoring data reflect the general background urban air pollution level in the urban area of Shenzhen. It is significant to note that the Nan’ao (NA) station in the east part is in the tourist area with a sparse population and the Overseas Chinese Town (Huaqiaocheng, HQC) station is in the downtown area with the densest population.
To control for the effects of weather on mortality, meteorological data (daily mean temperature, relative humidity, air/barometric pressure and wind speed, etc.) was obtained from the Meteorological Bureau of Shenzhen Municipality. The meteorological data were measured at a fixed-site station located in the study area. This station belongs to the Meteorological Bureau of Shenzhen Municipality, the monitoring standard is consistent with international WMO (World Meteorological Organization) standard, and no data was missing.

2.3. Data Analysis

In order to quantify the association between daily levels of ozone and daily mortality, adjusted by confounders in the multivariable modeling, consistent with other time-series studies [21,22,24], we used the generalized additive model (GAM) with penalized splines to analyze the risk of cardio-respiratory mortality attributable to ozone pollution. Because the daily mortality was small and typically followed a Poisson distribution, the core analysis was a GAM with log link and Poisson error that accounted for smooth fluctuations in the daily mortality.
Before conducting the model analyses, there were two steps in the procedure of the model building and model fit: development of the best base model (without a pollutant) and development of the main model (with a pollutant). The latter was achieved by adding the ozone to the final cause-specific best base model, assuming a linear relationship between the logarithmic mortality number and the ozone concentration.
First, we constructed the basic pattern of mortality number excluding ozone. We incorporated smoothed spline functions of time, weather conditions and the other air pollutants, which can include non-linear and non-monotonic links between mortality and time/weather conditions, offering a flexible modelling tool. The day of the week was also included in the basic models.
After we established the basic models, we introduced the ozone and analyzed its association with mortality. To compare the relative quality of the mortality predictions across these non-nested models, Akaike’s Information Criterion (AIC) was used as a measure of how well the model fit the data. Smaller AIC values indicated the preferred model. Briefly, we fit the following log-linear generalized additive models to obtain the estimated pollution log-relative rate β in the study district:
log [ E ( Yt ) ] = α + i = 1 q β i ( Xi ) + j = 1 p fj ( Zj , df ) + Wt ( week )
Here E(Yt) represents the expected number of mortality at day t; β represents the log-relative rate of mortality associated with a unit increase of ozone; Xi indicates the concentrations of pollutants at day t; and Wt(week) is the dummy variable for the day of the week. j = 1 p fj ( Zj , df )   is the non-parametric spline function of calendar time, temperature, barometric pressure, wind speed and humidity. A detailed introduction of the GAM has been previously described in Wood’s book [25]. We initialized the df as 9 df/year for time; 6 df for temperature, barometric pressure, and PM2.5; 7 df for humidity, NO2 and CO; and 8 df for wind speed. We also discussed lag effects of the air pollutants, and for the lag effects model we examined the effect of air pollutants with different lag (L) structures of single-day lag (distributed lag; from L0 to L3, L0 corresponds to the current-day pollution, and L1 refers to the previous-day concentration) and multi-day lag (moving average lag; L01 to L03, L03 corresponds to the four-day moving average of the pollutant concentration of the current and the previous three days). The meteorological factors and other confounding air pollutants used in the lag models (distributed lag model, moving average model) were the current day data.
Pearson correlation coefficients among the variables were analyzed using SPSS 22.0 (IBM Company 2013, North Castle, NY, USA). Temporal changes of ozone were summarized by Origin 9.0 (Origin Lab, Northampton, MA, USA). In the Macroscopic regional scale, the spatial distribution of the ozone concentration followed the basic assumption of “the first law of geography”, namely, the regional concentrations in nearby areas are more similar than in areas farther away. Therefore, inverse distance weighted (IDW) model interpolation analysis was used to analyze spatial distributions of ozone. Spatial differences of ozone were presented by ArcGIS 10.2 (Esri, Redlands, CA, USA) using IDW.
All other statistical analyses were conducted in R3.1.0 (R Foundation for Statistical Computing, Vienna, Austria) using the MGCV package (R Development Core Team, 2014). The results obtained were expressed as the excess risk (ER) percentage change in the number of mortalities caused by cardiovascular and respiratory diseases per 10 μg/m3 increases of ozone concentrations (ER = ( e δ C 1 ) × 100 , where δC is the increased amount of air pollutants, in this study we used 10 μg/m3).

3. Results

3.1. Statistical Results

Table 1 summarizes the distribution of the annual mean, percentage value on the daily mortality caused by cardiovascular and respiratory diseases, concentrations of ozone 1-h mean and ozone 8-h maximum, confounding air pollutants, and meteorological factors of Shenzhen during the study period.
During the study period, the mean daily temperature and humidity were 23.1 °C and 74.8%, respectively. The mean daily temperature ranged from 9.8 °C to 31.2 °C, and the mean daily humidity ranged from 24% to 100%, reflecting the subtropical oceanic climate of Shenzhen. For the confounding air pollutants, the daily NO2 concentration ranged from 14 µg/m3 to 111 µg/m3, the daily CO concentration ranged from 700 µg/m3 to 1966 µg/m3, and the daily PM2.5 concentration ranged from 20 µg/m3 to 135 µg/m3 with the average being 39.6 µg/m3. Average concentrations of ozone were 95.9 µg/m3 for the 1-h mean and 76.8 µg/m3 for the daily 8-h maximum ozone concentration, and the average values were higher than the median values for both the concentration of ozone 1-h mean and the daily 8-h maximum ozone concentration, indicating a larger contribution of high ozone concentration days to the annual average concentration of ozone. 4646 residents died from cardiovascular diseases and 626 died from respiratory diseases in Shenzhen in 2013. The daily mortality for cardiovascular-respiratory diseases ranged from 4 to 30.

3.2. Correlation Coefficients

Meteorological conditions can alter the formation and removal of ozone and thus influence the concentration [12]. Pearson correlation coefficients among ozone and meteorological factors are presented in Table 2. A significant positive correlation was found between ozone and barometric pressure, which is in line with the former research [26]. Significant negative correlations were found between ozone and other meteorological factors (temperature, humidity and wind speed).
The health impact of ozone has also been proved to be influenced by meteorological factors. High temperature and ozone might have a synergistic effect on health while the opposite effect occurs for mild temperature when exposed to a high ozone concentration [14]. Therefore, the health effect analysis in this study was adjusted by those meteorological confounders. Ambient NO2 and CO could influence the formation and decomposition of ozone, and significant positive correlations between those two air pollutants and ozone are found in Table 2. Although the health effect of ozone exposure was independent from particulate matter [15], we included PM2.5 as a confounder because it was the major air pollutant in Shenzhen and was contributing to significant air pollution-related mortalities [27].

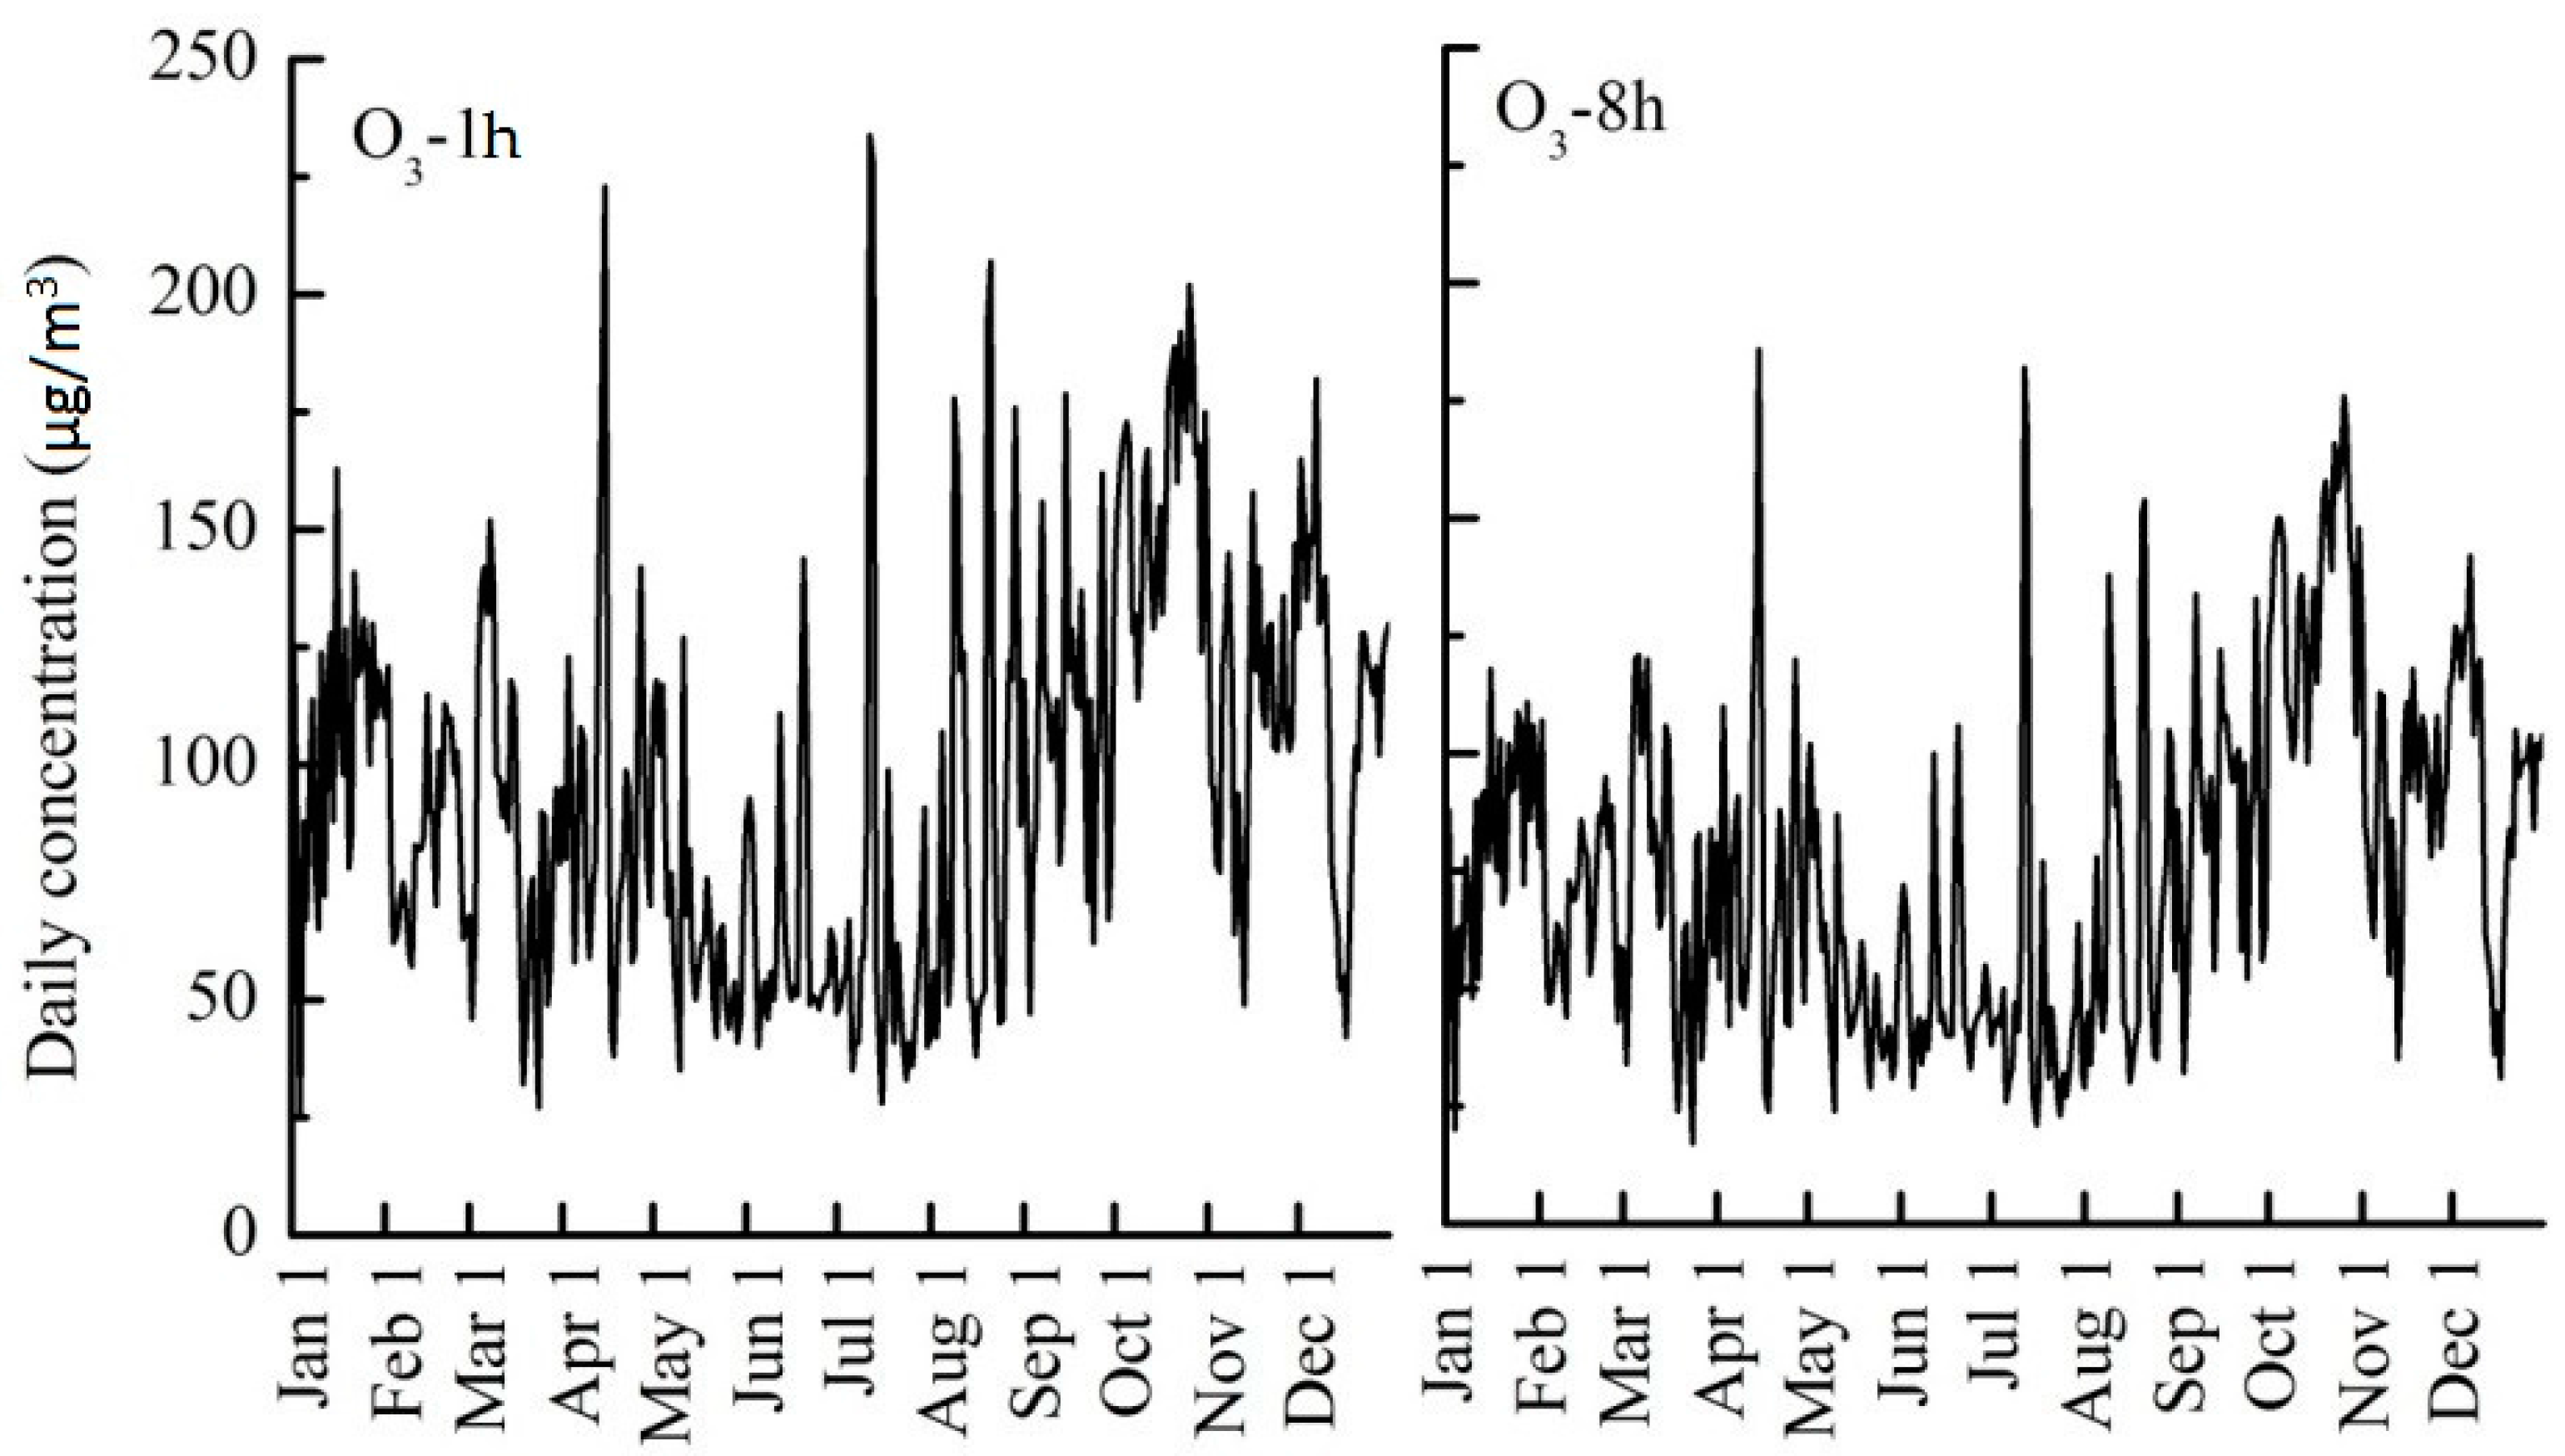
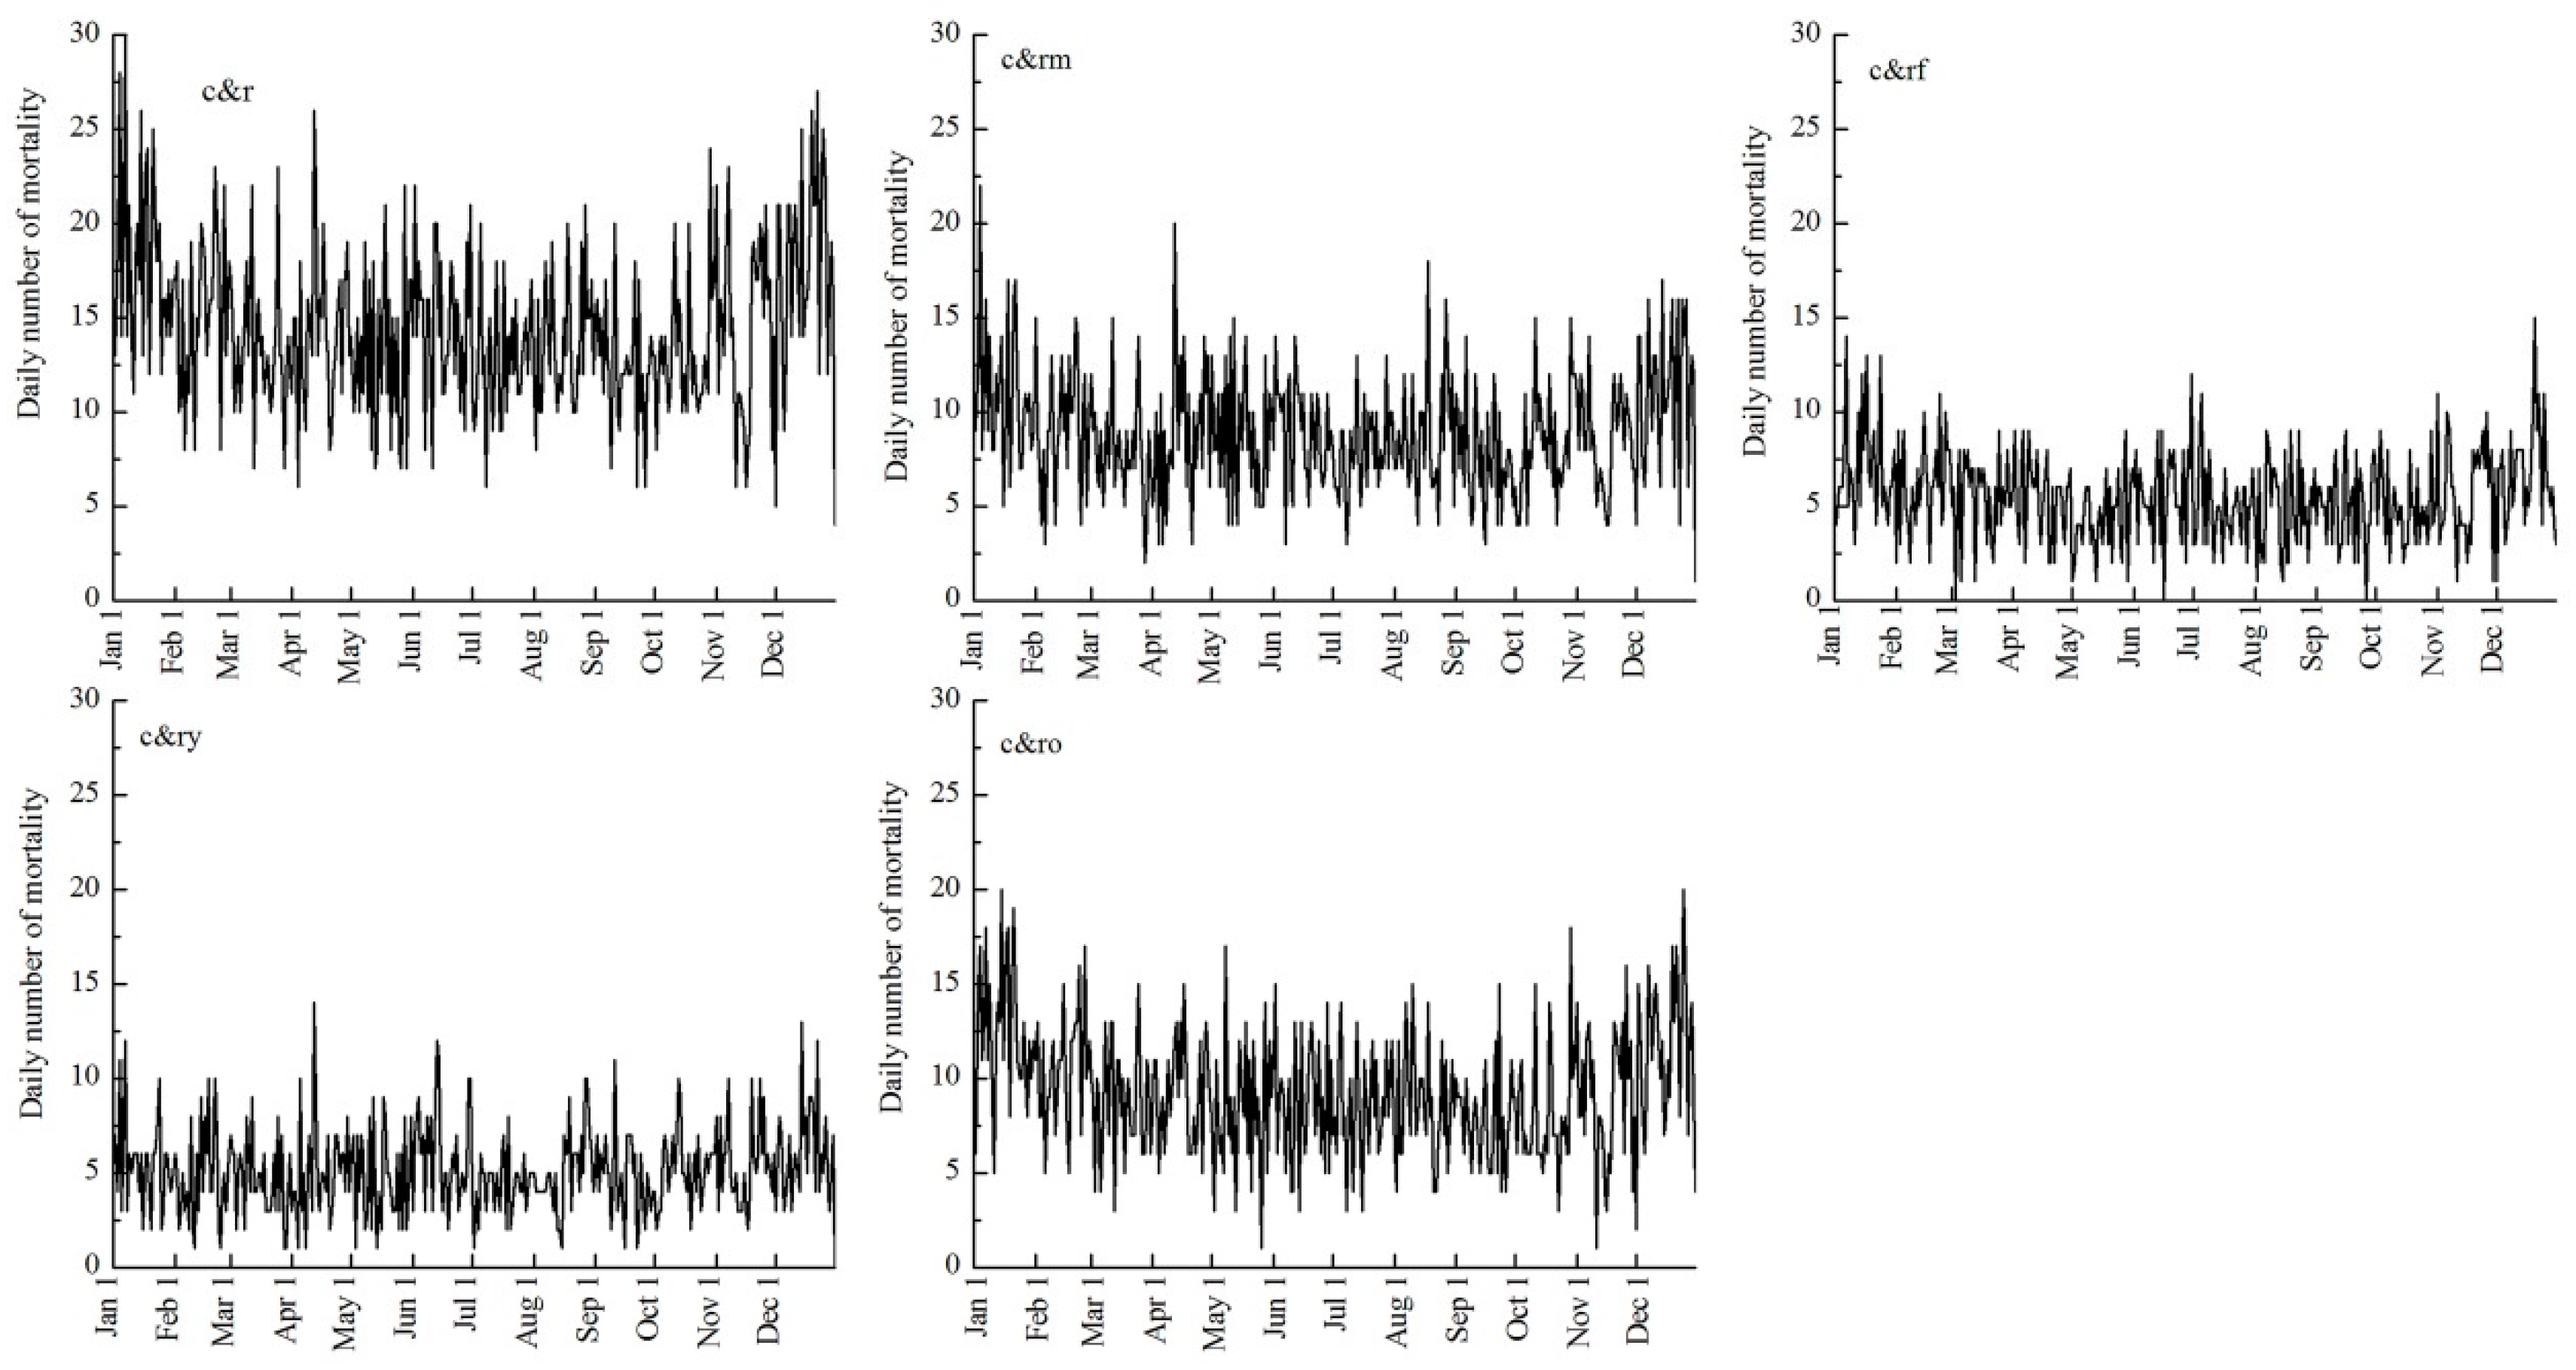
3.3. Temporal Changes

During 2013, the average daily concentrations were 95.9 µg/m3 ranging from 26 to 234 μg/m3 for the ozone 1-h mean and 76.8 µg/m3 ranging from 17 to 186 μg/m3 for the daily 8-h maximum ozone concentration. According to the NAAQS, the Technical Regulation on Ambient Air Quality Index (on trial) (HJ633-2012) (TRAAQI), and the Technical Regulation for Ambient Air Quality Assessment (on trial) (HJ663-2013) (TRAAQA), ozone was the second main air pollutant in Shenzhen, with 30 days as a primary pollutant and 4 days as a non-attainment pollutant in the year.
Figure 2 shows the daily characteristics of the 1-h ozone concentration and the daily 8-h maximum ozone concentration in Shenzhen. The daily level of ozone had a higher value during September to October, while there was a relative lower daily concentration from May to June.
According to the daily mortality in Figure 3, males had higher rate cardiovascular and respiratory disease-caused mortality than females, and the elderly group (65+) had significantly higher mortality rate compared to the younger. For the total cardiovascular and respiratory disease-caused mortality, a slightly higher number was found between December to January, while no obvious seasonal patterns of the mortality were found among the males, the females, the younger or the elderly group.

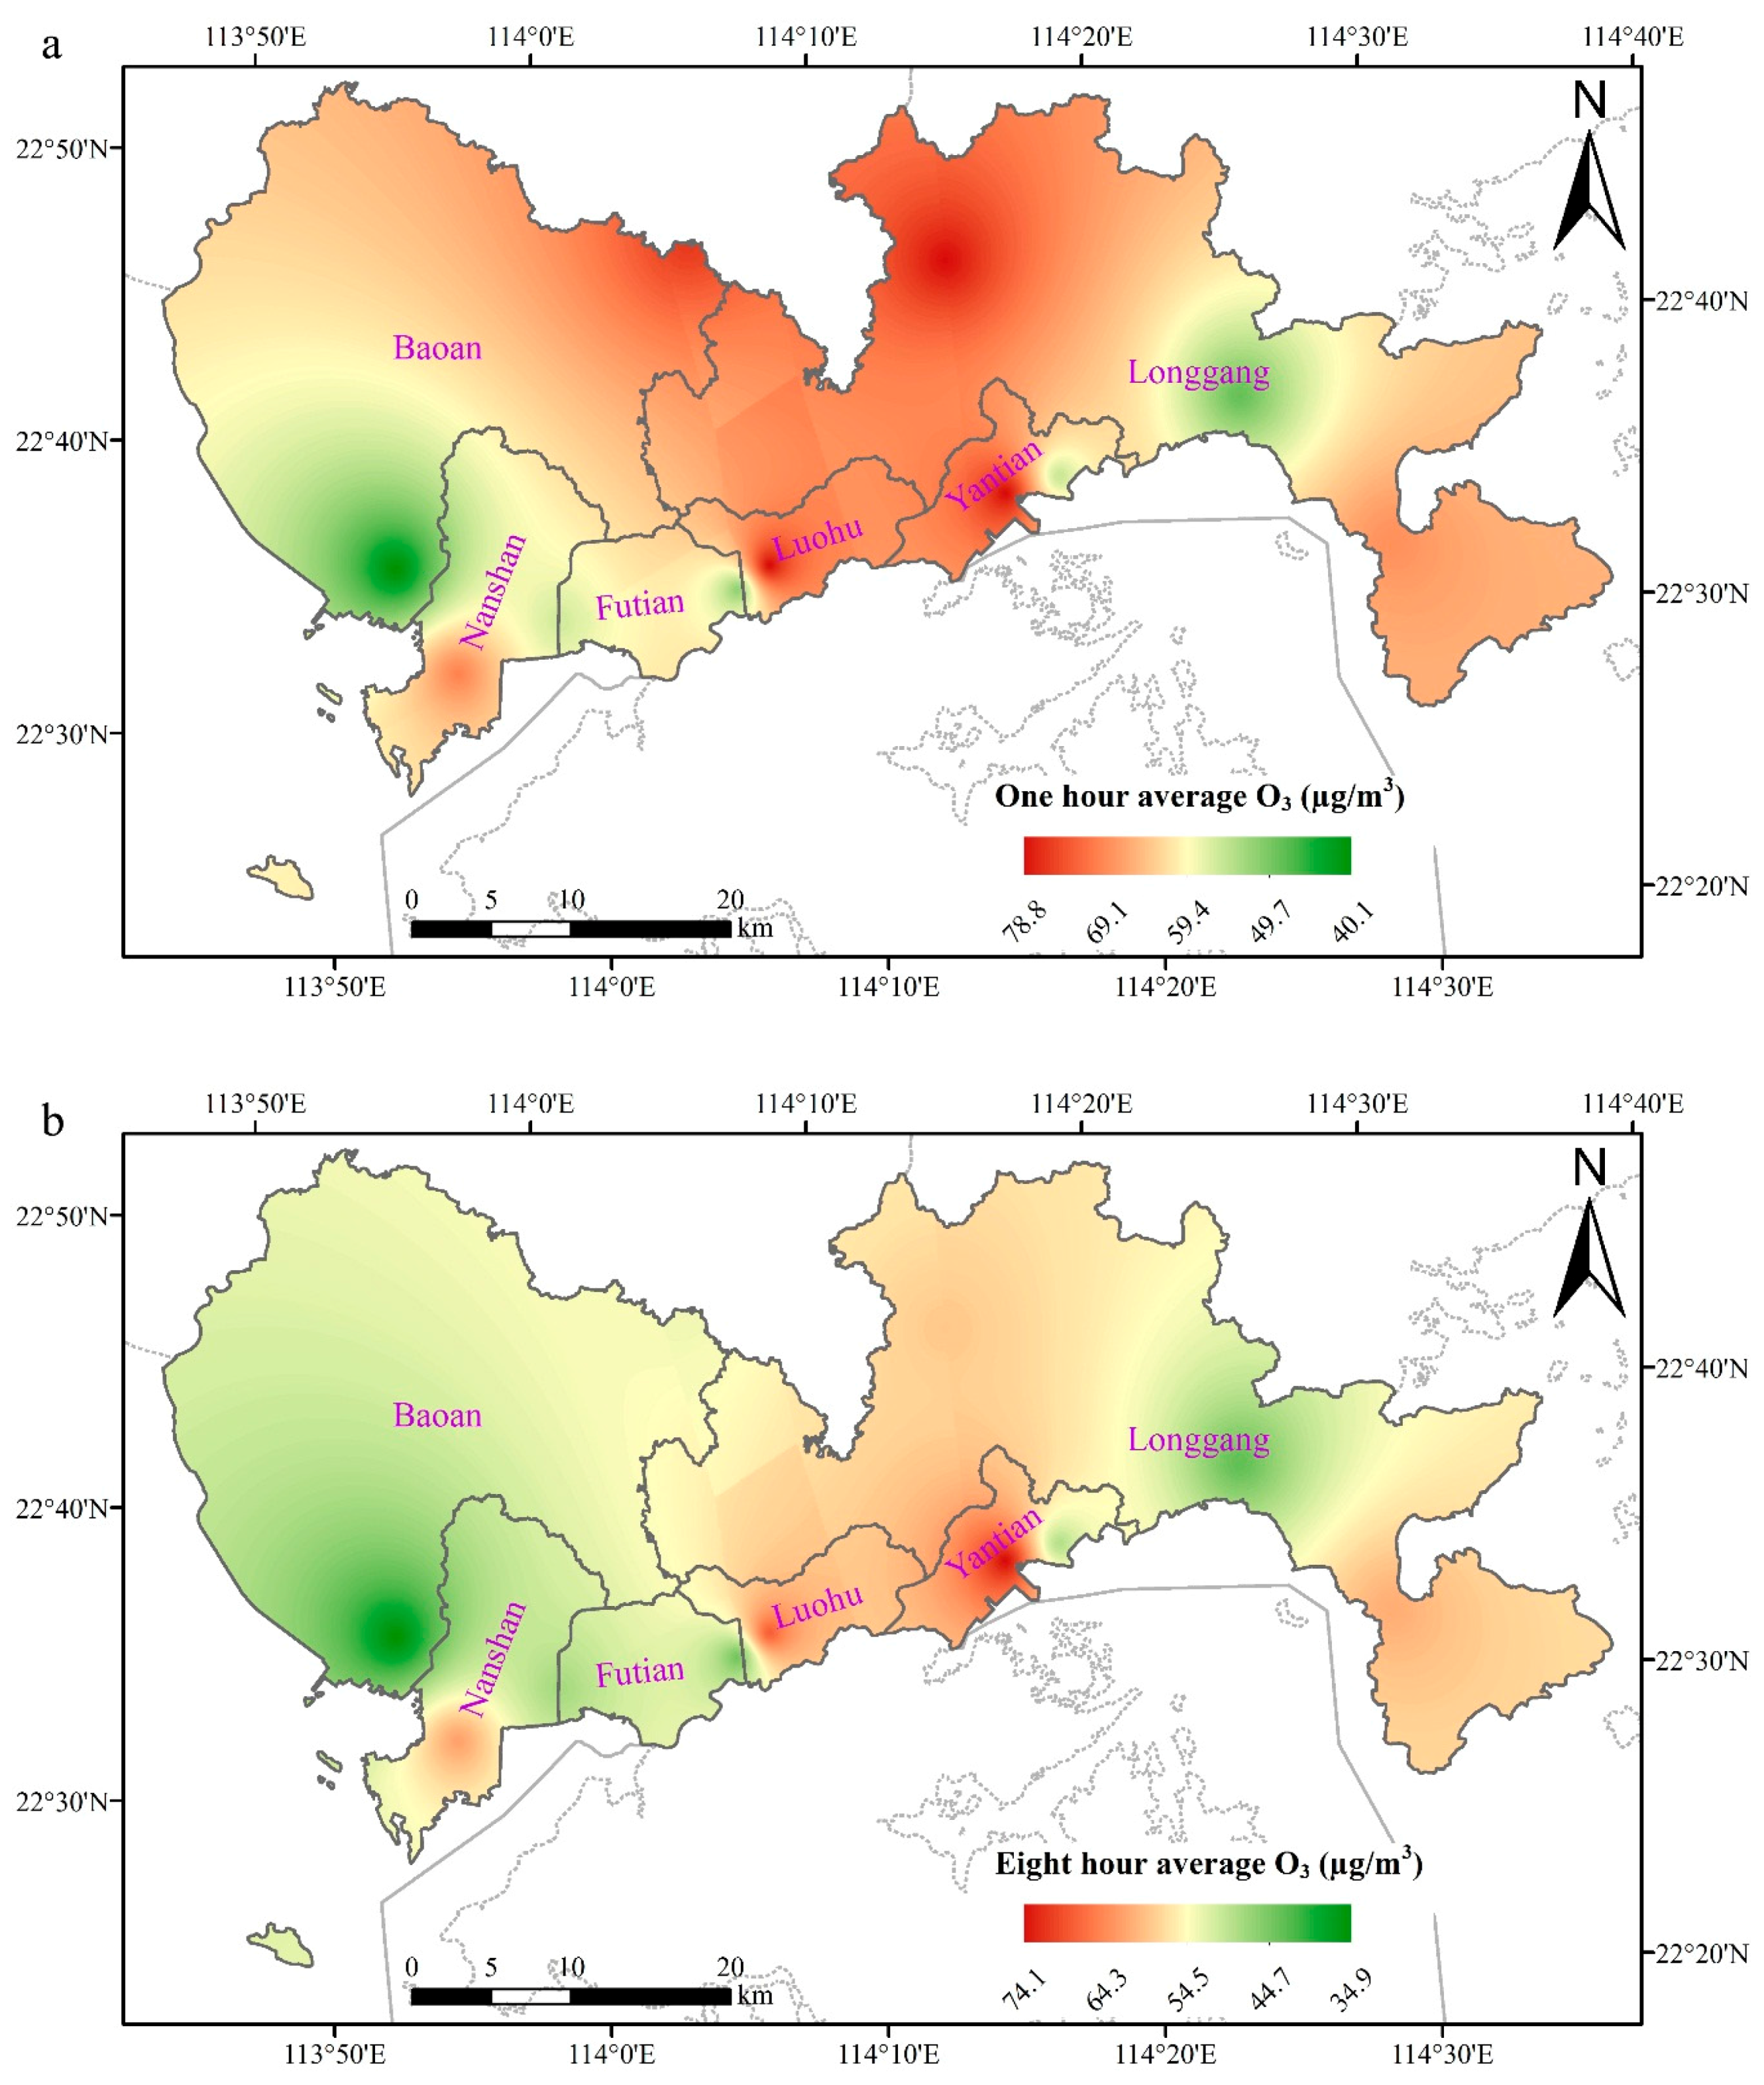
3.4. Spatial Differences

To represent spatial differences of ozone in Shenzhen more directly, we analyzed monthly and hourly ozone concentrations at HQC and NA sites, in the downtown and tourist areas of Shenzhen, respectively. These two parts of the city serve distinct and quite different urban functions, and differences in air quality might indicate that they were affected by different pollutant emission sources.
Figure 4 presents the spatial distribution of ozone in Shenzhen during 2013. The highest concentration could be found in Yantian, which might be attributable to the high emission from the major cargo port in Shenzhen (Yantian port). The Luohu district where Honghu and Liyuan are located is the city center with intense traffic and human activities, which could explain the high ozone concentration found there. Meanwhile, an obvious higher concentration was also found in the downtown of Shenzhen (HQC) and tourist area (NA). According to NAAQS, TRAAQI, and TRAAQA, annual concentrations of ozone at all the monitoring stations met grade II national air quality standard.

3.5. Temporal Differences between Different Urban Function Areas

In the temporal differences, we considered monthly differences and hourly differences of ozone for the above two different city function areas.
Figure 5a shows the monthly average concentration of ozone at HQC and NA from January to November in 2013. Both the downtown and tourist areas had the highest monthly average 1-h ozone level in January and the lowest concentration in July. The daily 8-h maximum ozone concentration showed the highest values in January and October, and the lowest level in July in the tourist area, while the downtown area had the peak value in October and lowest level in July. The ozone concentration in the tourist area was higher than that that in downtown area.
Figure 5b shows the average hourly ozone concentrations at HQC and NA in the study period. The 1-h ozone level showed the same hourly trend in the downtown and tourist areas, with the highest concentration at 16:00 and lowest level at 8:00. The daily 8-h maximum ozone concentration also presented similar hourly patterns in the two different areas, which had peak values at 19:00 and the lowest levels at 11:00.

3.6. Health Effects

Table 3 presents the excess risk percentage (ER, 95% confidence interval) of the daily cardio-respiratory mortality with every 10 μg/m3 increase in ozone concentration. To identify a possible time-delay of ozone exposure-health effects on mortality, we analyzed the lag effects of ozone. Changes on ER in cardiovascular and respiratory disease-caused mortality with a 10 μg/m3 increase of ozone for single-day measures, 1–3 days prior to the mortality (L0–L3), and moving average measures from day 0 and day 1 to day 3 prior to mortality (L01–L03) are also listed in Table 3. During the modelling, lag effects of more than 3 days for ozone were also taken into consideration, but little relationship was found, so we only included the lag till lag 3 (L0–L3) and the cumulative lag 0–3 (L01–L03). In this study, we took the daily mortality caused by cardiovascular disease and respiratory disease as one group, and gender and age differences were also taken into consideration. Other major air pollutants and the meteorological conditions were adjusted in the model because these either can influence the health impact of ozone or can simultaneously pose significant health risks [14].
Generally speaking, the association between cardio-respiratory mortality and the daily 8-h maximum ozone exposure was more obvious than the ozone 1-h concentration with higher excess risk (ER) percentages; the ER percentage was higher at L2 for single day lag for both 8-h maximum and ozone 1-h concentration, and most of the ER percentages reached the highest points at L03, indicating the cumulative effect. In terms of the gender and age stratification, we found significant higher risks for the male group and the elderly group (65 years and older), and the association between cardio-respiratory mortality and ozone exposure was less evidenced for the females and particularly less for the younger group (0–65 years). The highest risk was found at L03 with the ER percentage of 1.08 (0.88–1.27) per 10 μg/m3 increase in the 8-h maximum ozone concentration for cardio-respiratory mortality of all population, at L03 with the ER percentage of 1.14 (0.90–1.38) for the male group, at L2 with the ER percentage of 1.28 (1.00–1.48) for the female group, and at L03 with the ER percentage of 1.59 (1.35–1.83) for the elderly group.

4. Discussion

This study illustrated the spatial and temporal patterns of ozone pollution in Shenzhen, and analyzed its health risks focusing on cardiovascular and respiratory disease-caused mortality, adjusted for meteorological factors and major air pollutants. Age and gender were also stratified in the risk study to identify the susceptible group.
The ozone concentration was obviously higher in September and October, and lower from May to June. Anthropogenic activities can largely explain the highest ozone concentrations in the harbor and the city center, while a higher ozone concentration was also identified in the tourist area (NA) with less population. This was not the only case in Shenzhen. With the increasing emission of the air pollutants in the city center where the emissions were high, ozone could be decomposed together with its precursors, transferred to downwind areas and then formed into ozone again.
Meteorological factors were found to relate to the ozone concentration through its formation and decomposition [26]. Barometric pressure was found to positively correlate with both O3 1-h and O3 8-h in this study, while, in opposition to former research, temperature was negatively associated with ozone concentration [28]. This might be because the months with high temperature were accompanied with high humidity (the rainy season from May to August in Shenzhen), which can influence ultraviolet radiation and thus slow down the formation of ozone. The relationships between meteorological factors and ozone were complex and highly dependent on the range of those factors and the type of the weather clusters, and even the weather frequency change [26]. With the increase of climate change, the frequency of the weather clusters and extreme weather are predicted to increase and thus the health precaution of ozone pollution could become even more challenging.
In terms of health damage, cardiovascular and respiratory mortality risk of ozone exposure was found among all the population at cumulative lags both for 1-h and daily 8-h maximum ozone concentrations, with the highest ER percentage of 1.08 (0.88–1.27). Ozone is highly oxidant and toxic. Numerous epidemiology studies have shown the association between ozone exposure and respiratory and cardiovascular diseases [2,5,29]. Inhaled ozone could cause decreased lung function and increased airway hyper-reactivity, particularly for those with preexisting conditions [11,30]. A recent study using the rat experiment model suggested that ozone exposure could lead to significant perturbations of coronary vascular functions possibly related to intracellular redox disturbances [31]. Some other studies, using human volunteers, identified that exposure to ozone could cause adverse systemic inflammation and cardiac autonomic effects through changes in heart rate variability and C-reactive protein, and thus contribute to cardiovascular mortality [7,10]. Though the mechanism is not conclusive yet, elevated ozone concentration could lead to respiratory and cardiovascular diseases according to many epidemiological studies [2,3,4,32,33,34,35]. Our study came to a similar conclusion, with identified susceptible groups being the elderly and males.
Because of largely existing pre-conditions or deprived immune systems, elderly people are more vulnerable to ozone exposure than the younger generation [36]. The elderly group (65 years and older) showed the highest cardio-respiratory mortality risk with an ER percentage of 1.59 (1.35–1.83) per daily 8-h maximum ozone concentration increasing by 10 μg/m3 in this study. From a gender perspective, animal experimental research and meta-analysis have shown that women were more susceptible to inflammatory lung disease induced by air pollution and show worse adverse pulmonary health outcomes than men [36,37]. By contrast, our research found a more obvious negative association between ozone exposure and cardiovascular and respiratory mortality among males than females. This could be explained by the fact that men are more apt to be exposed to ozone because of their work outside in China. Elevated ozone exposure could affect the health of any individual, but in our research, no obvious exposure-effect correlations between ozone exposure and cardiovascular and respiratory disease-caused mortality among the younger group (0–65 years) were found. We speculated that the excess risk (ER) was estimated with less precision because of the smaller numbers of deaths in this age group compared with the elderly group. For all the sub groups, the associations of elevated ozone exposure and cardiovascular and respiratory mortality were much better proved among the cumulative lags for 8-h exposure. Susceptible individuals for ozone exposure were males and the elderly in Shenzhen.
The health risk caused by ozone exposure is influenced by the emissions of precursor chemical species, meteorology and population themselves [12,14,36,37]. Precursor chemicals mainly are methane (CH4) and carbon monoxide (CO), which, with the emissions of nitrogen oxides (NOx = NO + NO2), contribute to a general hemispheric ‘background’ of ozone. Temperature and humidity are the two major meteorological factors influencing the formation and concentration of ozone, and more directly, intervening the formation of clot through the activation or suppression of the fibrinolytic pathway [12,14,38]. In this research, we analyzed the association between ozone concentration and cardiovascular and respiratory disease-caused mortality confounded by those air pollutants. However, other confounders including socio-economic position and individual behavior could also influence the health effects of ozone. Because of the data limitation, we did not include those confounders.

5. Conclusions

In conclusion, ozone was the second main air pollutant in Shenzhen. The daily concentration of ozone was higher from September to October, while there was a relative low daily concentration from May to June. Obviously, a higher ozone concentration was found in the harbor and city center, while the tourist area, which was distant from the city center or industrial area, also had a considerably high ozone concentration, indicating the regional transmission. The ozone level showed same hourly trend in the downtown and tourist areas and the ozone 8-h maximum had peak values around 19:00 and the lowest levels around 11:00. The excess risk (ER) in the cardiovascular and respiratory disease-caused mortality would increase with the concentration level increase of ozone, particularly for the ozone 8-h maximum concentration. When the ozone concentration increased, males in the cardiovascular-respiratory disease mortality group seemed to be more sensitive than females, and people older than 65 years seemed to be affected more easily than younger people. Our findings provide additional information about the ozone distribution and health risk patterns and thus provide scientific evidence for coping strategies for health protection.

Acknowledgments

The authors would like to thank all the staff members at the Shenzhen Centre for Disease Control and Prevention for their strong support of this study. We thank the Shenzhen Environmental Monitoring Center and Meteorological Bureau of Shenzhen Municipality for providing data. The present study was supported by the National Natural Science Foundation of China (No. 41401101 & No. 41371118).

Author Contributions

For this article, Li Wang, Fengyi Zhang and Wuyi Wang conceived the study; Yu Bai and Xiaojian Liu analyzed the data; Li Wang and Fengyi Zhang wrote the paper; and all of the authors contributed to the discussion section.

Conflicts of Interest

The authors declare no conflict of interest.

References

  1. Hao, Y.; Balluz, L.; Strosnider, H.; Wen, X.J.; Li, C.; Qualters, J.R. Ozone, fine particulate matter, and chronic lower respiratory disease mortality in the United States. Am. J. Respir. Crit. Care Med. 2015, 192, 337–341. [Google Scholar] [CrossRef] [PubMed]
  2. Peng, R.D.; Samoli, E.; Pham, L.; Dominici, F.; Touloumi, G.; Ramsay, T.; Burnett, R.T.; Krewski, D.; Le Tertre, A.; Cohen, A.; et al. Acute effects of ambient ozone on mortality in Europe and North America: Results from the APHENA study. Air Qual. Atmos. Health 2013, 6, 445–453. [Google Scholar] [CrossRef] [PubMed]
  3. Pride, K.R.; Peel, J.L.; Robinson, B.F.; Busacker, A.; Grandpre, J.; Bisgard, K.M.; Yip, F.Y.; Murphy, T.D. Association of short-term exposure to ground-level ozone and respiratory outpatient clinic visits in a rural location—Sublette County, Wyoming, 2008–2011. Environ. Res. 2015, 137, 1–7. [Google Scholar] [CrossRef] [PubMed]
  4. Shahi, A.M.; Omraninava, A.; Goli, M.; Soheilarezoomand, H.R.; Mirzaei, N. The effects of air pollution on cardiovascular and respiratory causes of emergency admission. Emergency 2014, 2, 107–114. [Google Scholar] [PubMed]
  5. Petito, B.C.; Goodman, J.E.; Sax, S.N.; Loftus, C.T. Providing perspective for interpreting cardiovascular mortality risks associated with ozone exposures. Regul. Toxicol. Pharmacol. 2015, 72, 107–116. [Google Scholar] [CrossRef] [PubMed]
  6. Arjomandi, M.; Wong, H.; Donde, A.; Frelinger, J.; Dalton, S.; Ching, W.; Power, K.; Balmes, J.R. Exposure to medium and high ambient levels of ozone causes adverse systemic inflammatory and cardiac autonomic effects. Am. J. Physiol. Heart Circ. Physiol. 2015, 308, H1499–H1509. [Google Scholar] [CrossRef] [PubMed]
  7. Brook, R.D.; Franklin, B.; Cascio, W.; Hong, Y.; Howard, G.; Lipsett, M.; Luepker, R.; Mittleman, M.; Samet, J.; Smith, S.C., Jr.; et al. Air pollution and cardiovascular disease: A statement for healthcare professionals from the Expert Panel on Population and Prevention Science of the American Heart Association. Circulation 2004, 109, 2655–2671. [Google Scholar] [CrossRef] [PubMed]
  8. Cole, M.P.; Freeman, B.A. Promotion of cardiovascular disease by exposure to the air pollutant ozone. Am. J. Physiol. Lung Cell. Mol. Physiol. 2009, 297, L205–L208. [Google Scholar] [CrossRef] [PubMed]
  9. Devlin, R.B.; Duncan, K.E.; Jardim, M.; Schmitt, M.T.; Rappold, A.G.; Diaz-Sanchez, D. Controlled exposure of healthy young volunteers to ozone causes cardiovascular effects. Circulation 2012, 126, 104–111. [Google Scholar] [CrossRef] [PubMed]
  10. Hazucha, M.J.; Bates, D.V.; Bromberg, P.A. Mechanism of action of ozone on the human lung. J. Appl. Physiol. 1989, 67, 1535–1541. [Google Scholar] [PubMed]
  11. The United States Environmental Protection Agency (EPA). 2013 Final Report Integrated Science Assessment of Ozone and Related Photochemical Oxidants; EPA: Washington, DC, USA, 2013.
  12. Adams, W. Effects of ozone exposure at ambient air pollution episode levels on exercise performance. Sports Med. 1987, 4, 395–424. [Google Scholar] [CrossRef] [PubMed]
  13. Kahle, J.J.; Neas, L.M.; Devlin, R.B.; Case, M.W.; Schmitt, M.T.; Madden, M.C.; Diaz-Sanchez, D. Interaction effects of temperature and ozone on lung function and markers of systemic inflammation, coagulation, and fibrinolysis: A crossover study of healthy young volunteers. Environ. Health Perspect. 2015, 123, 310–316. [Google Scholar] [CrossRef] [PubMed]
  14. Gryparis, A.; Forsberg, B.; Katsouyanni, K.; Analitis, A.; Touloumi, G.; Schwartz, J.; Samoli, E.; Medina, S.; Anderson, H.R.; Niciu, E.M.; et al. Acute effects of ozone on mortality from the “air pollution and health: A European approach” project. Am. J. Respir. Crit. Care Med. 2004, 170, 1080–1087. [Google Scholar] [CrossRef] [PubMed]
  15. Chen, Y.; Ebenstein, A.; Greenstone, M.; Li, H. Evidence on the impact of sustained exposure to air pollution on life expectancy from China’s Huai River policy. Proc. Natl. Acad. Sci. USA 2013, 110, 12936–12941. [Google Scholar] [CrossRef] [PubMed]
  16. Lee, H.; Honda, Y.; Hashizume, M.; Guo, Y.L.; Wu, C.F.; Kan, H.; Jung, K.; Lim, Y.H.; Yi, S.; Kim, H. Short-term exposure to fine and coarse particles and mortality: A multicity time-series study in East Asia. Environ. Pollut. 2015, 207, 43–51. [Google Scholar] [CrossRef] [PubMed]
  17. Wang, L.; Wei, B.; Li, Y.; Li, H.; Zhang, F.; Rosenberg, M.; Yang, L.; Huang, J.; Krafft, T.; Wang, W. A study of air pollutants influencing life expectancy and longevity from spatial perspective in China. Sci. Total Environ. 2014, 487, 57–64. [Google Scholar] [CrossRef] [PubMed]
  18. Xiong, Q.; Zhao, W.; Gong, Z.; Zhao, W.; Tang, T. Fine Particulate Matter Pollution and Hospital Admissions for Respiratory Diseases in Beijing, China. Int. J. Environ. Res. Public Health 2015, 12, 11880–11892. [Google Scholar] [CrossRef] [PubMed]
  19. Yang, C.; Chen, A.; Chen, R.; Qi, Y.; Ye, J.; Li, S.; Li, W.; Liang, Z.; Liang, Q.; Guo, D.; et al. Acute effect of ambient air pollution on heart failure in Guangzhou, China. Int. J. Cardiol. 2014, 177, 436–441. [Google Scholar] [CrossRef] [PubMed]
  20. Zhang, F.; Li, L.; Krafft, T.; Lv, J.; Wang, W.; Pei, D. Study on the association between ambient air pollution and daily cardiovascular and respiratory mortality in an urban district of Beijing. Int. J. Environ. Res. Public Health 2011, 8, 2109–2123. [Google Scholar] [CrossRef] [PubMed]
  21. Zhang, F.; Wang, W.; Lv, J.; Krafft, T.; Xu, J. Time-series studies on air pollution and daily outpatient visits for allergic rhinitis in Beijing, China. Sci. Total Environ. 2011, 409, 2486–2492. [Google Scholar] [CrossRef] [PubMed]
  22. Anger, A.; Dessens, O.; Xi, F.; Barker, T.; Wu, R. China’s air pollution reduction efforts may result in an increase in surface ozone levels in highly polluted areas. Ambio 2016, 45, 254–265. [Google Scholar] [CrossRef] [PubMed]
  23. Bhaskaran, K.; Gasparrini, A.; Hajat, S.; Smeeth, L.; Armstrong, B. Time series regression studies in environmental epidemiology. Int. J. Epidemiol. 2013, 42, 1187–1195. [Google Scholar] [CrossRef] [PubMed]
  24. Wood, S. Gerneralized Additive Models: An Introduction with R; Chapman &Hall/CRC: Boca Raton, FL, USA, 2006. [Google Scholar]
  25. Austin, E.; Zanobetti, A.; Coull, B.; Schwartz, J.; Gold, D.R.; Koutrakis, P. Ozone trends and their relationship to characteristic weather patterns. J. Expo. Sci. Environ. Epidemiol. 2015, 25, 532–542. [Google Scholar] [CrossRef] [PubMed]
  26. Zhang, F.; Liu, X.; Zhou, L.; Yu, Y.; Wang, L.; Lu, J.; Wang, W.; Krafft, T. Spatiotemporal patterns of particulate matter (PM) and associations between PM and mortality in Shenzhen, China. BMC Public Health 2016, 16, 215. [Google Scholar] [CrossRef] [PubMed]
  27. Lacour, S.A.; de Monte, M.; Diot, P.; Brocca, J.; Veron, N.; Colin, P.; Leblond, V. Relationship between ozone and temperature during the 2003 heat wave in France: Consequences for health data analysis. BMC Public Health 2006, 6, 261. [Google Scholar] [CrossRef] [PubMed]
  28. Farhat, S.C.; Almeida, M.B.; Silva-Filho, L.V.; Farhat, J.; Rodrigues, J.C.; Braga, A.L. Ozone is associated with an increased risk of respiratory exacerbations in patients with cystic fibrosis. Chest 2013, 144, 1186–1192. [Google Scholar] [CrossRef] [PubMed]
  29. Mudway, I.S.; Kelly, F.J. Ozone and the lung: A sensitive issue. Mol. Aspects Med. 2000, 21, 1–48. [Google Scholar] [CrossRef]
  30. Paffett, M.L.; Zychowski, K.E.; Sheppard, L.; Robertson, S.; Weaver, J.M.; Lucas, S.N.; Campen, M.J. Ozone Inhalation Impairs Coronary Artery Dilation via Intracellular Oxidative Stress: Evidence for Serum-Borne Factors as Drivers of Systemic Toxicity. Toxicol. Sci. 2015, 146, 244–253. [Google Scholar] [CrossRef] [PubMed]
  31. de Almeida, S.P.; Casimiro, E.; Calheiros, J. Short-term association between exposure to ozone and mortality in Oporto, Portugal. Environ. Res. 2011, 111, 406–410. [Google Scholar] [CrossRef] [PubMed]
  32. Goudarzi, G.; Geravandi, S.; Foruozandeh, H.; Babaei, A.A.; Alavi, N.; Niri, M.V.; Khodayar, M.J.; Salmanzadeh, S.; Mohammadi, M.J. Cardiovascular and respiratory mortality attributed to ground-level ozone in Ahvaz, Iran. Environ. Monit. Assess. 2015, 187, 487. [Google Scholar] [CrossRef] [PubMed]
  33. Jia, X.; Song, X.; Shima, M.; Tamura, K.; Deng, F.; Guo, X. Acute effect of ambient ozone on heart rate variability in healthy elderly subjects. J. Expo. Sci. Environ. Epidemiol. 2011, 21, 541–547. [Google Scholar] [CrossRef] [PubMed]
  34. Xu, X.; Sun, Y.; Ha, S.; Talbott, E.O.; Lissaker, C.T. Association between ozone exposure and onset of stroke in Allegheny County, Pennsylvania, USA, 1994–2000. Neuroepidemiology 2013, 41, 2–6. [Google Scholar] [CrossRef] [PubMed]
  35. Bell, M.L.; Zanobetti, A.; Dominici, F. Who is more affected by ozone pollution? A systematic review and meta-analysis. Am. J. Epidemiol. 2014, 180, 15–28. [Google Scholar] [CrossRef] [PubMed]
  36. Cabello, N.; Mishra, V.; Sinha, U.; DiAngelo, S.L.; Chroneos, Z.C.; Ekpa, N.A.; Cooper, T.K.; Caruso, C.R.; Silveyra, P. Sex differences in the expression of lung inflammatory mediators in response to ozone. Am. J. Physiol. Lung Cell. Mol. Physiol. 2015, 309, L1150–L1163. [Google Scholar] [CrossRef] [PubMed]
  37. Sanderson, M.G. Effect of Climate Change on Isoprene Emissions and Surface Ozone Levels. Geophys. Res. Lett. 2003. [Google Scholar] [CrossRef]
  38. Welty, L.J. Are the Acute Effects of Particulate Matter on Mortality in the National Morbidity, Mortality, and Air Pollution Study the Result of Inadequate Control for Weather and Season? A Sensitivity Analysis using Flexible Distributed Lag Models. Am. J. Epidemiol. 2005, 162, 80–88. [Google Scholar] [CrossRef] [PubMed]
Figure 1. Distribution of 11 state-controlled air quality monitoring sites in Shenzhen.
Sustainability 09 00559 g001
Figure 2. Daily concentration of ozone in Shenzhen.
Sustainability 09 00559 g002
Figure 3. Daily mortality.
Sustainability 09 00559 g003
Figure 4. Spatial distribution of O3-1h (a) and O3-8h (b) in Shenzhen.
Sustainability 09 00559 g004
Figure 5. Average monthly (a) and hourly (b) concentrations of ozone at Overseas China Town (HQC) and Nan’ao (NA) monitoring stations.
Sustainability 09 00559 g005
Table 1. Statistical characteristic of air pollutants, meteorological factors and daily mortality.
ItemsAveSDMin25%Mid75%Max
c&r14.44.44.012.014.017.030.0
c&r-m8.93.31.07.09.011.022.0
c&r-f5.52.50.04.05.07.015.0
c&r-y5.12.30.04.05.06.014.0
c&r-o9.33.51.07.09.012.020.0
T (°C)23.15.29.819.424.227.731.2
H (%)74.815.524.067.078.087.0100.0
P (hPa)1005.26.2986.81000.51005.11010.81019.2
W (m/s)2.10.80.31.62.02.55.5
NO2 (μg/m3)39.615.714.028.036.047.0111.0
CO (μg/m3)1207.2221.3700.01030.01200.01344.31966.6
O3-1h (μg/m3)95.941.326.060.090.0121.3234.0
O3-8h (μg/m3)76.834.917.047.074.0100.0186.0
PM2.5 (μg/m3)39.624.89.020.035.052.0135.0
c&r: cardiovascular and respiratory disease-caused mortality; c&r-m: male group for cardiovascular and respiratory disease-caused mortality; c&r-f: female group for cardiovascular and respiratory disease-caused mortality; c&r-y: 0–65 years age group for cardiovascular and respiratory disease caused-mortality; c&r-o: over 65 years of age group for cardiovascular and respiratory disease-caused mortality; T: temperature; H: humidity; P: barometric pressure; W: wind speed; NO2: nitrogen dioxide; CO: carbon monoxide; O3-1h: 1-h ozone concentration; O3-8h: daily 8-h maximum ozone concentration; PM2.5: fine particulate matter (similarly hereinafter).
Table 2. Correlation coefficients for air pollutants and meteorological factors.
HeadlineT (°C)H (%)P (hPa)W (m/s)NO2COO3-1hO3-8hPM2.5
T (°C)1
H (%)0.377 **1
P (hPa)−0.818 **−0.534 **1
W (m/s)0.009−0.003−0.1031
NO2−0.381 **−0.270 **0.346 **−0.471 **1
CO−0.493 **−0.295 **0.473 **−0.0770.345 **1
O3-1h−0.115 *−0.574 **0.298 **−0.163 **0.367 **0.314 **1
O3-8h−0.139 **−0.601 **0.328 **−0.106 **0.291 **0.311 **0.980 **1
PM2.5−0.503 **−0.589 **0.544 **−0.159 **0.565 **0.617 **0.604 **0.615 **1
* correlation is significant at the 0.05 level; ** correlation is significant at the 0.01 level (two-tailed).
Table 3. Excess risk (ER) percentage for the daily cardiovascular and respiratory disease-caused mortality with every 10 μg/m3 increase in ozone concentration.
Itemsc&rc&r-mc&r-fc&r-yc&r-o
ER (95% CI)ER (95% CI)ER (95% CI)ER (95% CI)ER (95% CI)
O3-1hL0−0.34 (−0.46–0.22)0.30 (0.14–0.45)−1.31 (−1.51–−1.11)−1.70 (−1.91–−1.40)0.35 (0.20–0.51)
L10.64 (0.54–−0.75)0.62 (0.49–0.76)0.68 (0.5–0.85)0.72 (0.55–0.90)0.55 (0.41–0.69)
L20.58 (0.48–0.69)0.30 (0.18–0.42)1.07 (0.92–1.23)0.46 (0.30–0.63)0.66 (0.53–0.77)
L30.17 (0.07–0.26)0.15 (0.02–0.27)0.21 (0.06–0.36)0.04 (−0.12–0.20)0.28 (0.16–0.40)
L010.36 (0.21–0.50)0.76 (0.58–0.94)−0.24 (−0.47–−0.01)−0.44 (−0.68–−0.21)0.72 (0.53–0.90)
L020.71 (0.56–0.88)0.80 (0.61–0.99)0.62 (0.38–0.86)0.07 (−0.18–0.31)1.01 (0.83–1.20)
L030.69 (0.53–0.84)0.78 (0.58–0.97)0.59 (0.34–0.85)0.03 (−0.23–0.28)1.00 (0.81–1.19)
O3-8hL0−0.15 (−0.30–0.00)0.45 (0.26–0.64)−1.06 (−1.31–−0.85)−2.02 (−0.23–0.29)0.79 (0.81–1.20)
L10.59 (0.45–0.72)0.49 (0.32–0.65)0.77 (0.55–0.98)0.88 (0.66–1.10)0.37 (0.20–0.53)
L20.83 (0.70–0.95)0.57 (0.41–0.72)1.28 (1.00–1.48)0.47 (0.27–0.70)1.04 (0.89–1.19)
L30.45 (0.33–0.56)0.43 (0.28–0.58)0.47 (0.28–0.66)0.04 (−0.15–0.23)0.67 (0.53–0.82)
L010.41 (0.24–0.59)0.73 (0.51–0.95)−0.04 (−0.32–0.24)−0.55 (−0.84–−0.26)0.84 (0.53–0.82)
L020.95 (0.77–1.30)1.00 (0.77–1.23)0.91 (0.61–1.21)−0.01 (−0.31–0.30)1.40 (1.17–1.63)
L031.08 (0.88–1.27)1.14 (0.90–1.38)1.01 (0.70–1.32)0.03 (−0.29–0.34)1.59 (1.35–1.83)

