Article

Screening Indicators for the Sustainable Child Development Index (SCDI)

Institute of Environmental Technology, Technische Universität Berlin, Straße des 17. Juni 135, 10623 Berlin, Germany
*
Author to whom correspondence should be addressed.
Sustainability 2017, 9(4), 518; https://doi.org/10.3390/su9040518
Submission received: 21 December 2016 / Revised: 22 March 2017 / Accepted: 24 March 2017 / Published: 29 March 2017
(This article belongs to the Section Social Ecology and Sustainability)

Abstract

:
Since children are the key stakeholders supporting and being affected by sustainable development, the framework for the Sustainable Child Development Index (SCDI) was proposed. It addresses social, economic and environmental dimensions of sustainable development by considering seven relevant themes of child development, i.e., health, education, safety, economic status, relationship, environmental aspects and participation. However, an indicator set for initiating the SCDI is still missing. In this study, indicators for the themes, subthemes and criteria of SCDI are identified from literature and then analyzed regarding data availability. Sixty-six indicators with statistical data covering at least 100 countries are selected as the indicator set for the SCDI. The results indicate that data availability is best for indicators describing the themes of health and education, and worst for indicators addressing the themes of relationship and participation. Furthermore, 21 subthemes and 50 criteria described by indicators with limited data availability are identified for future indicator and data development. By providing an initial indicator set and screening the indicators with regard to data availability, the practicality of the SCDI framework is expected. Furthermore, the indicator set can serve as a potential indicator pool for other child and sustainable development related studies.

1. Introduction

Children are the stakeholders inheriting and shaping future society. The International Union for Conservation of Nature and Natural Resource [1] claimed that “we have not inherited the Earth from our parents, we have borrowed it from our children”. This claim emphasizes the important relationship between inter-generational equity, children and sustainable development (SD). Child development (CD) is affected by external circumstances, and children are more vulnerable to violence, diseases and environmental pollution than adults [2]. Furthermore, children’s basic rights such as to express their own opinions and to have access to education can be impeded by adults [2,3]. Disregarding and violating these basic rights can lead to irreversible and severe effects on CD and consequently on future society.
Many studies on CD are available and many schemes and indexes for assessing CD have been developed. The Handbook of Child Well-Being [4] indicates that the studies related to CD and well-being have undergone some relevant movements: multi-dimensional topics (for example, child rights) are increasingly addressed and new themes (for example, participation) are included. Accordingly, several indexes for CD were developed [5,6]. One famous example, the Child Development Index (CDI) [7,8], was proposed to evaluate countries’ performance on CD considering health, education and nutrition. It was designed to mirror the Human Development Index (HDI) [9] with particular focus on children. Other government-supported institutions and NGOs proposed alternative indexes focusing more on well-being by considering additional topics, such as relationships with family, school and community, safety, or social engagement [10,11,12,13,14]. However, though these indexes are advanced compared to former ones focusing on single topics only, some limitations still remain. For instance, they do not address topics related to environmental aspects, such as water availability or resource consumption. Generally, a consistent classification of topics as well as a description of interdependencies between different topics is still a challenge.

1.1. The SCDI Framework and Potential Application

To address some of those gaps, for example, lack of considering environmental aspects, inconsistent classification scheme, and missing description of interdependencies between topics, Chang et al. [15] proposed the Sustainable Child Development Index (SCDI) framework in the context of SD. This index is designed to be an aggregated score that presents countries’ performance with regard to SD by considering relevant topics and indicators addressing environmental, economic and social dimensions. The performance can be treated as the potential towards SD by emphasizing intergenerational equality and the completed picture of SD. In addition, the SCDI can compare the performance for countries on CD and monitor the trends on improvements and declines of the performance for countries as well as specific topics by continuously updating the indicators over a defined time frame (e.g., on a four-year basis, such as done for CDI [7,8]). Therefore, the SCDI can support decision makers to formulate or adjust strategies on child as well as sustainable development policies, and, similar to HDI, is a communication tool in order to inform the condition on CD to policy makers, communities, academies, public and private organizations. As all indexes, the SCDI aims at summarizing a large amount of information from the included indicators to a manageable, meaningful message [16,17].
The SCDI framework considers seven themes, which, based on a literature review, were identified as relevant for CD: health, education, safety, economic status, relationship, and participation plus environmental aspects. Each theme is specified by subthemes and criteria. Figure 1 displays the overall structure of the SCDI. For example, the theme health includes 17 subthemes like child mortality, nutrition and risk behavior. Subthemes are further described by criteria, which are measured by indicators. The subtheme child mortality contains three criteria, such as neonatal-, infant-, and under-five mortality. The criterion under-five mortality is assessed by the indicator under-five mortality rate. As an index for SD, the SCDI also reflects the Sustainable Development Goals (SDGs). SDGs were adopted in 2015 by 193 countries and target at holistically tackling development needs, eradicating poverty in all its forms, improving human rights and gender equality, and considering SD in environmental, social and economic dimensions [18,19]. There are some links between SDGs and the identified relevant topics in the SCDI framework [15,18]. For example, the goal “ensure healthy lives and promote well-being for all” is associated with the subthemes child mortality, mental health, maternal mortality, immunization, etc.; the goal “ensure access to affordable, reliable, sustainable and modern energy for all” links to the subtheme renewable energy consumption; and the goal “ensure inclusive and quality education for all and promote lifelong learning” relates to the subthemes gender equality, access to all levels of education, and provision for vocational training.
The SCDI framework provides a consistent classification scheme for topics relevant for CD and includes environmental aspects, which was not yet considered in previous studies on CD but relevant in SDGs. Furthermore, the subthemes and criteria are allocated to the outcome and the contextual level. The outcome level considers topics reflecting the status of CD, such as the subtheme school attainment. The contextual level considers topics, such as the subtheme parents’ educational qualification, which can potentially affect the outcomes. For instance, growing up in a relatively low parents’ educational qualification family may, but does not inevitably, lead to negative effects on children’s school attainment. This indicates the topics on contextual level are connected with the topics on outcome level, but should not be considered as direct measures of the outcome. Thus, this two-level differentiation reveals the interdependency between subthemes and criteria. This is crucial to avoid overstressing or neglecting the outcomes and the influences of contexts on CD [15].
This SCDI framework was the first step for developing a SCDI (illustrated in the first three blocks in Figure 1) and was discussed in detail in Chang et al. [15]. The second step—the main task of this paper—is to provide an indicator set for constructing the SCDI to measure CD on country level and to screen the data availability for indicators for the identified topics. It is illustrated in the fourth block in Figure 1 and further explained in Section 1.2. The development of normalization and aggregation approaches needed for determining the SCDI is a topic for the future research (see also discussion). The SCDI is planned to be designed as the arithmetic average of normalized indicators for each of the relevant themes. By normalization, indicator scores measured on different scales are adjusted to a common scale, i.e., the units of indicators are removed. Therefore, an aggregation of different indicators to their corresponding subthemes and thus themes is possible. Finally, arithmetic average scores of the themes are calculated for summarizing the relative CD performance of countries.

1.2. Research Objective

Currently, many indicators related to CD are available in the literature and considered in existing indexes. However, according to Fernandes et al. [20], who reviewed the leading research on the measurement of CD and well-being through indexes, common classification of indicators used in the indexes is lacking. One indicator can be classified into different topics. For instance, the school enrolment indicators were assigned to address education in many indexes [13,14,21], but were allocated to participation in some other indexes [22,23]. Consequently, allocating an indicator to a specific topic is not always straightforward. That indicates a robust classification system needs to be developed. Moreover, some studies did not clarify the data availability of indicators, or did not specify the indicators needed for measuring the topics [10,24,25,26,27,28]. Consequently, such indexes may not be applied in practice, as data for one or more indicators are simply not available on country level. To foster the implementation of the SCDI, developing an indicator set based on sufficiently available data is necessary.
Hence, the objective of this study is to transparently provide an initial indicator set for developing the SCDI and to screen the indicators for the identified topics of the SCDI framework with regard to data availability. Such an analysis of the indicators is needed because the SCDI is designed to assess countries’ performance on CD in the context of SD and the assessment can be only implemented if data are available. Indicators that already have available data are proposed as an initial indicator set to put the SCDI in practice. The indicator set is the basis for further development of the SCDI, facilitating a quantitative assessment of the relevant topics of sustainable child development and thus the implementation of the SCDI. In addition, according to the analysis of the indicators, the topics described by indicators with limited data are underlined for future indicator and data development. Moreover, the indicator set can serve as a basic indicator pool to support decision makers and researchers for formulating or adjusting development indexes related to child as well as sustainable development policies and studies.
The succeeding sections present the research materials and methods (Section 2), results, including the provision of the indicator set and the analysis of the indicators for the topics with regard to data availability (Section 3), followed by research discussion (Section 4) and conclusion (Section 5).

2. Materials and Methods

For identifying an initial indicator set for the SCDI framework, a review and analysis of indicators were conducted. The approach started with collecting indicators that reflected the identified subthemes and criteria of the SCDI framework. It was checked if statistical data were available on country level. Then, the data availability for the indicator was classified in different data availability levels—depending on the number of countries for which data were provided. Through this indicator analysis, indicators with sufficient data availability (at least medium data availability, further explained in the following paragraphs) were selected as an initial indicator set. The subthemes and criteria described by indicators with limited data availability on country level are identified. The result was an initial indicator set, which now allows assessing CD in the context of SD on country level. An overview of the research approach is shown in Figure 2. A detailed description is provided in the following.
Indicators for the defined subthemes and criteria of the SCDI framework were collected from seven peer-reviewed publications [13,28,29,30,31,32,33], three book sections [22,23,24], five studies from Non-Governmental Organizations (NGOs) specialized in CD research [8,10,14,27,34], as well as 14 reports from government-supported institutes [11,12,21,26,35,36,37,38,39,40,41,42,43,44] and 11 international databases established by government-supported institutions [45,46,47,48,49,50,51,52,53,54,55]. For example, the reports and database of United Nations Office on Drugs and Crime (UNODC) [50] and the United Nations Children's Fund (UNICEF) [45] were used as the key references of the theme safety. By considering studies and databases from an academic, organizational and governmental background, a comprehensive set of indicators can be provided.
After completing the indicator collection, it was checked if statistical data were available for the indicators on country level in the international, accessible databases or studies that are highly involved in development research, such as United Nations Children’s Fund (UNICEF), World Health Organization (WHO) and World Bank. In this study, these international databases and reports are considered as the fundamental data sources because they frequently update statistics and clearly provide the data sources and calculation methods. As the statistical data were taken from these renowned references, a high data quality is assumed and thus the data are suitable for investigating data availability further. We established a scheme to describe different data availability levels and to define a level considered as sufficient for initiating the SCDI. For the scheme, the number of countries considered in the UNICEF database (195) was taken as a reference: if one indicator had statistical data for all 195 countries, the indicator was classified into the top data availability level. In total, seven data availability levels were defined: top, very high, high, medium, low, very low and no available statistical data (on country level). The defined data availability levels are listed in Table 1. For example, an indicator with statistical data covering 160 countries was not classified to the top and very high data availability level, but included in the high data availability level. If an indicator has no available statistical data at country level (e.g., on regional level) from international databases, then the indicator is assigned to the no available statistical data level.
The data availability level scheme provided an overview on the data availability of the indicators identified for the subthemes and criteria of the SCDI framework, and indicated which subthemes and criteria could currently be assessed in all countries or in just a few. These results were used for proposing an initial indicator set for the SCDI framework. In concrete terms, we proposed to consider those indicators, which were allocated to at least the medium data availability level (from top to medium data availability levels). It implied that data for the indicators are available at least in 100 countries, representing more than 50% of the countries listed in the UNICEF database. The subthemes and criteria described by indicators with low and very low data availability, and no available statistical data (hereafter defined as limited data availability) are concerned as the topics that need more development of indicator and data (e.g., data collection and methodological improvement for indicators) before being considered in the SCDI.

3. Results

In total, 154 indicators were collected for the subthemes and criteria of the SCDI. For 139 indicators, statistical data were found on country level in international open-source databases. For the other 15 indicators, statistical data were not found on country level (e.g., regional level) or were not accessible in international open-source databases. A detailed list of all the 139 indicators identified for the topics as well as all the corresponding data coverage (and data sources) are provided in the Supplementary Materials, Table S1. The following sections provide the results of the analysis of the data availability of these 154 indicators. Based on the results, an initial indicator set for the SCDI and the topics concerned with limited data availability are stated. An initial indicator set is proposed (in Section 3.1). A detailed description of the findings of the data availability analysis is given in Section 3.2.

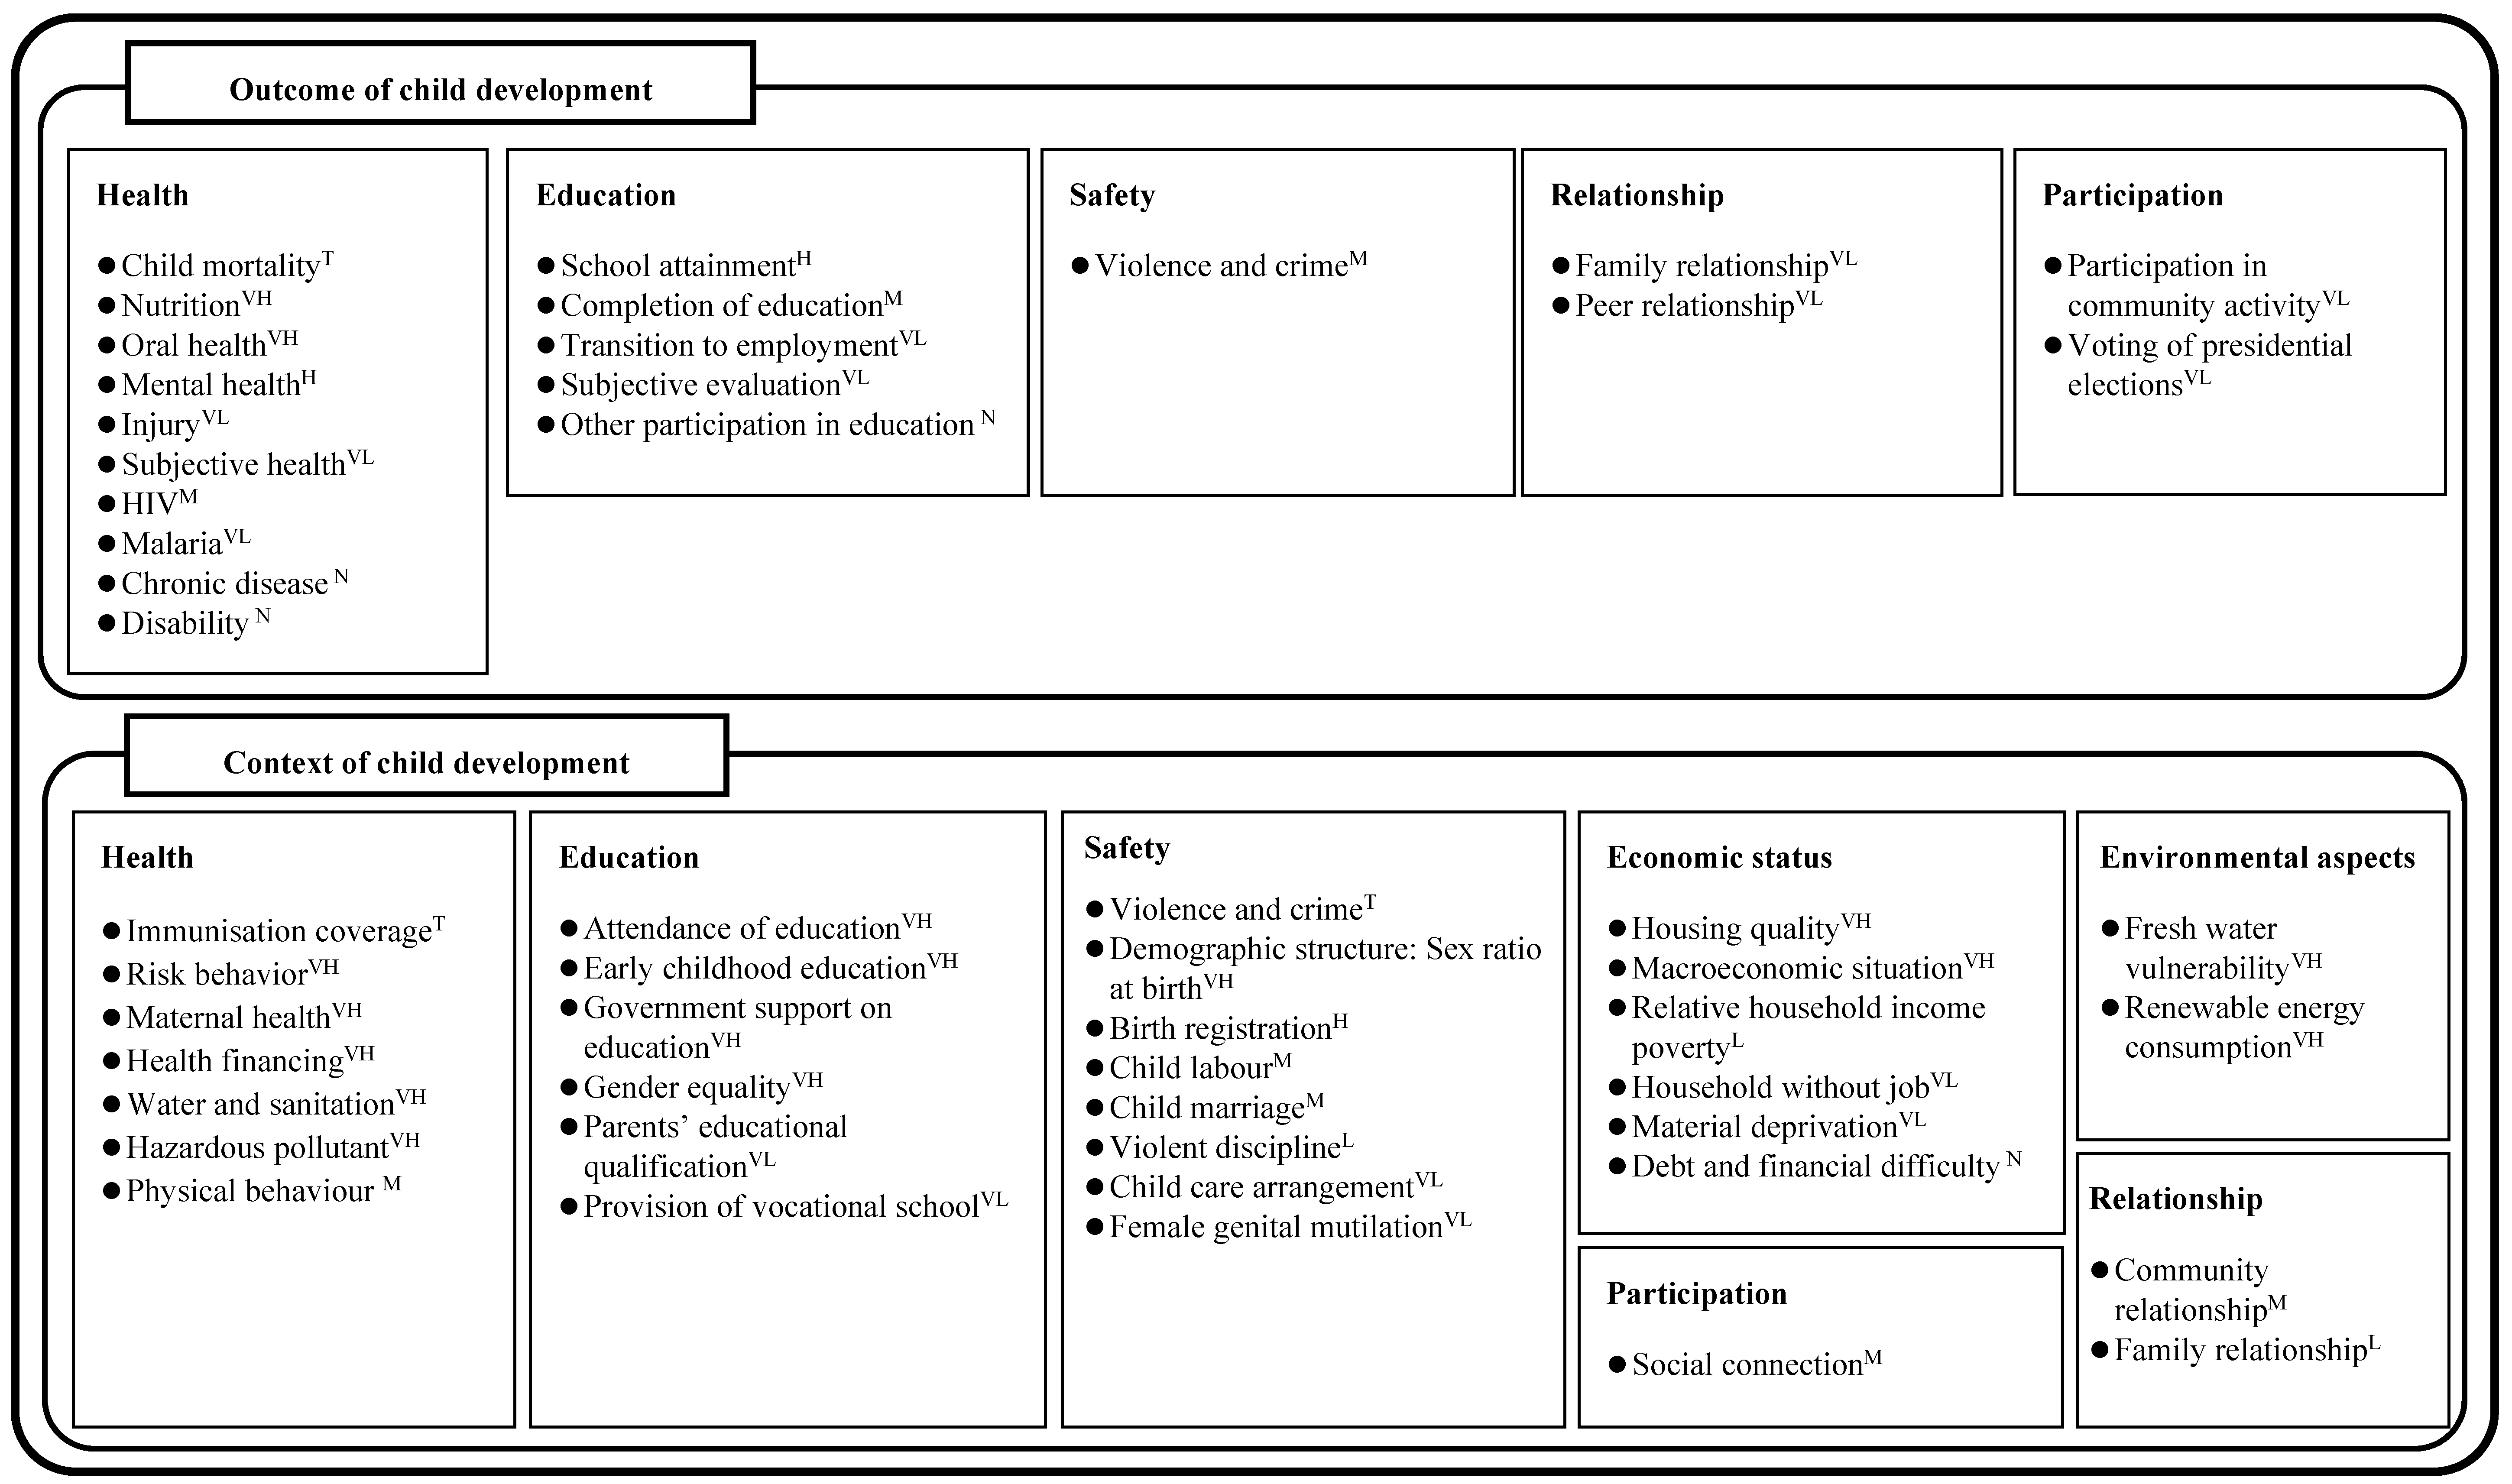
3.1. Selection of the Initial Indicator Set

According to the results of the indicator collection, Table 2 summarizes the accumulative numbers of indicators, criteria, subthemes, and themes structured in different data availability levels. The accumulative numbers of indicators and topics for a specific data availability level cover the indicators and topics considered in the better data availability level(s). For example, the at least high data availability level includes the indicators from top, very high, to high data availability level. Table 2 shows that only a few (seven) indicators have top data availability; that is, the data are available for 195 countries. It also shows that only a few topics are covered by these seven indicators with top data availability. A trade-off between the data availability for the indicators for the SCDI framework and its comprehensiveness (regarding the considered topics) is revealed in Table 2. If all themes and subthemes identified in the SCDI framework should be considered in developing a future SCDI, the data availability would be low, meaning that data of many indicators measured in a SCDI would only be available for few countries. On the other hand, if good data availability would be a criterion for selecting indicators considered in the SCDI, only few indicators would be used and thus only few subthemes and themes would be addressed. For example, if the criterion for including an indicator in a SCDI is, that data should be available in all countries (the top data availability level), the SCDI would only consider two themes (health and safety), three subthemes, child mortality, immunization coverage, and violence and crime, and the respective seven criteria (neonatal mortality, infant mortality, under-five mortality, Measles containing vaccine (MCV) immunization, Diphtheria tetanus toxoid and pertussis (DTP3) immunization, Polio (Pol3) immunization, and criminal victimization).
To develop an initial indicator set for the SCDI framework, a compromise between data availability and coverage of topics is needed. It is proposed to consider indicators with at least medium data availability for the proposed indicator set; that is, data cover at least 100 countries. In addition, it means that more than 50% of all subthemes and criteria identified in the SCDI framework are included. For example, 29 out of 50 subthemes, and 59 out of 109 criteria are taken into account. Furthermore, all seven themes are considered. As a result, 66 indicators are proposed for the initial indicator set of SCDI. This indicator set is presented in Table 3.
Moreover, the identified relevant topics in the SCDI are associated with some SDGs. The corresponding SDGs and SDG targets for the initial SCDI indicator set are listed in the Supplementary Materials, Table S2. Moreover, the overlap between the initial SCDI indicator set and the SDG indicator set is checked and presented in Table S2 as well. The results show that 39 out of the 66 SCDI indicators (59%) are also considered as SDG indicators. That indicates the SCDI indicator set has compatibility with the SDG indicator set. Nonetheless, the results do not imply that the indicators of the initial SCDI indicator set which are not suggested as SDG indicators have low relevance of SD. These SCDI indicators respond to SDGs and SDG targets. Besides, the SDG indicators are classified into three tiers with regard to data availability and the level of methodological development [56]. This classification can also serve as a reference to support the data availability we analyzed for the initial SCDI indicator set. In the SDG framework, Tier I considers the indicators that have clear established methodologies, and data regularly produced by countries. Tier II includes the indicators that have clear established methodologies, but data are not regularly produced by countries. Tier III addresses the indicators that have no firmly established methodologies. Among the 39 indicators (both considered in the initial SCDI indicator set and the SDG indicator set), 30 (77%) are assigned to Tier I, and the other nine are categorized to Tier II. None of the indicators of the initial indicator set are classified as Tier III indicators. That shows the indicator set provides indicators that have both good data availability and sound methodological development. As revealed in the SDG indicator classification, further research for indicator and data improvement is needed for those indicators without regularly updated data at country level and firmly established methodologies. Few collected SCDI indicators (e.g., Number of people covered by health insurance or a public health system per 1000 population) were found as Tier III indicators due to the lack of statistical data at country level. This outcome points out that the ongoing SDG indicator development with regard to Tier III indicators could also be beneficial for the future SCDI indicator development.

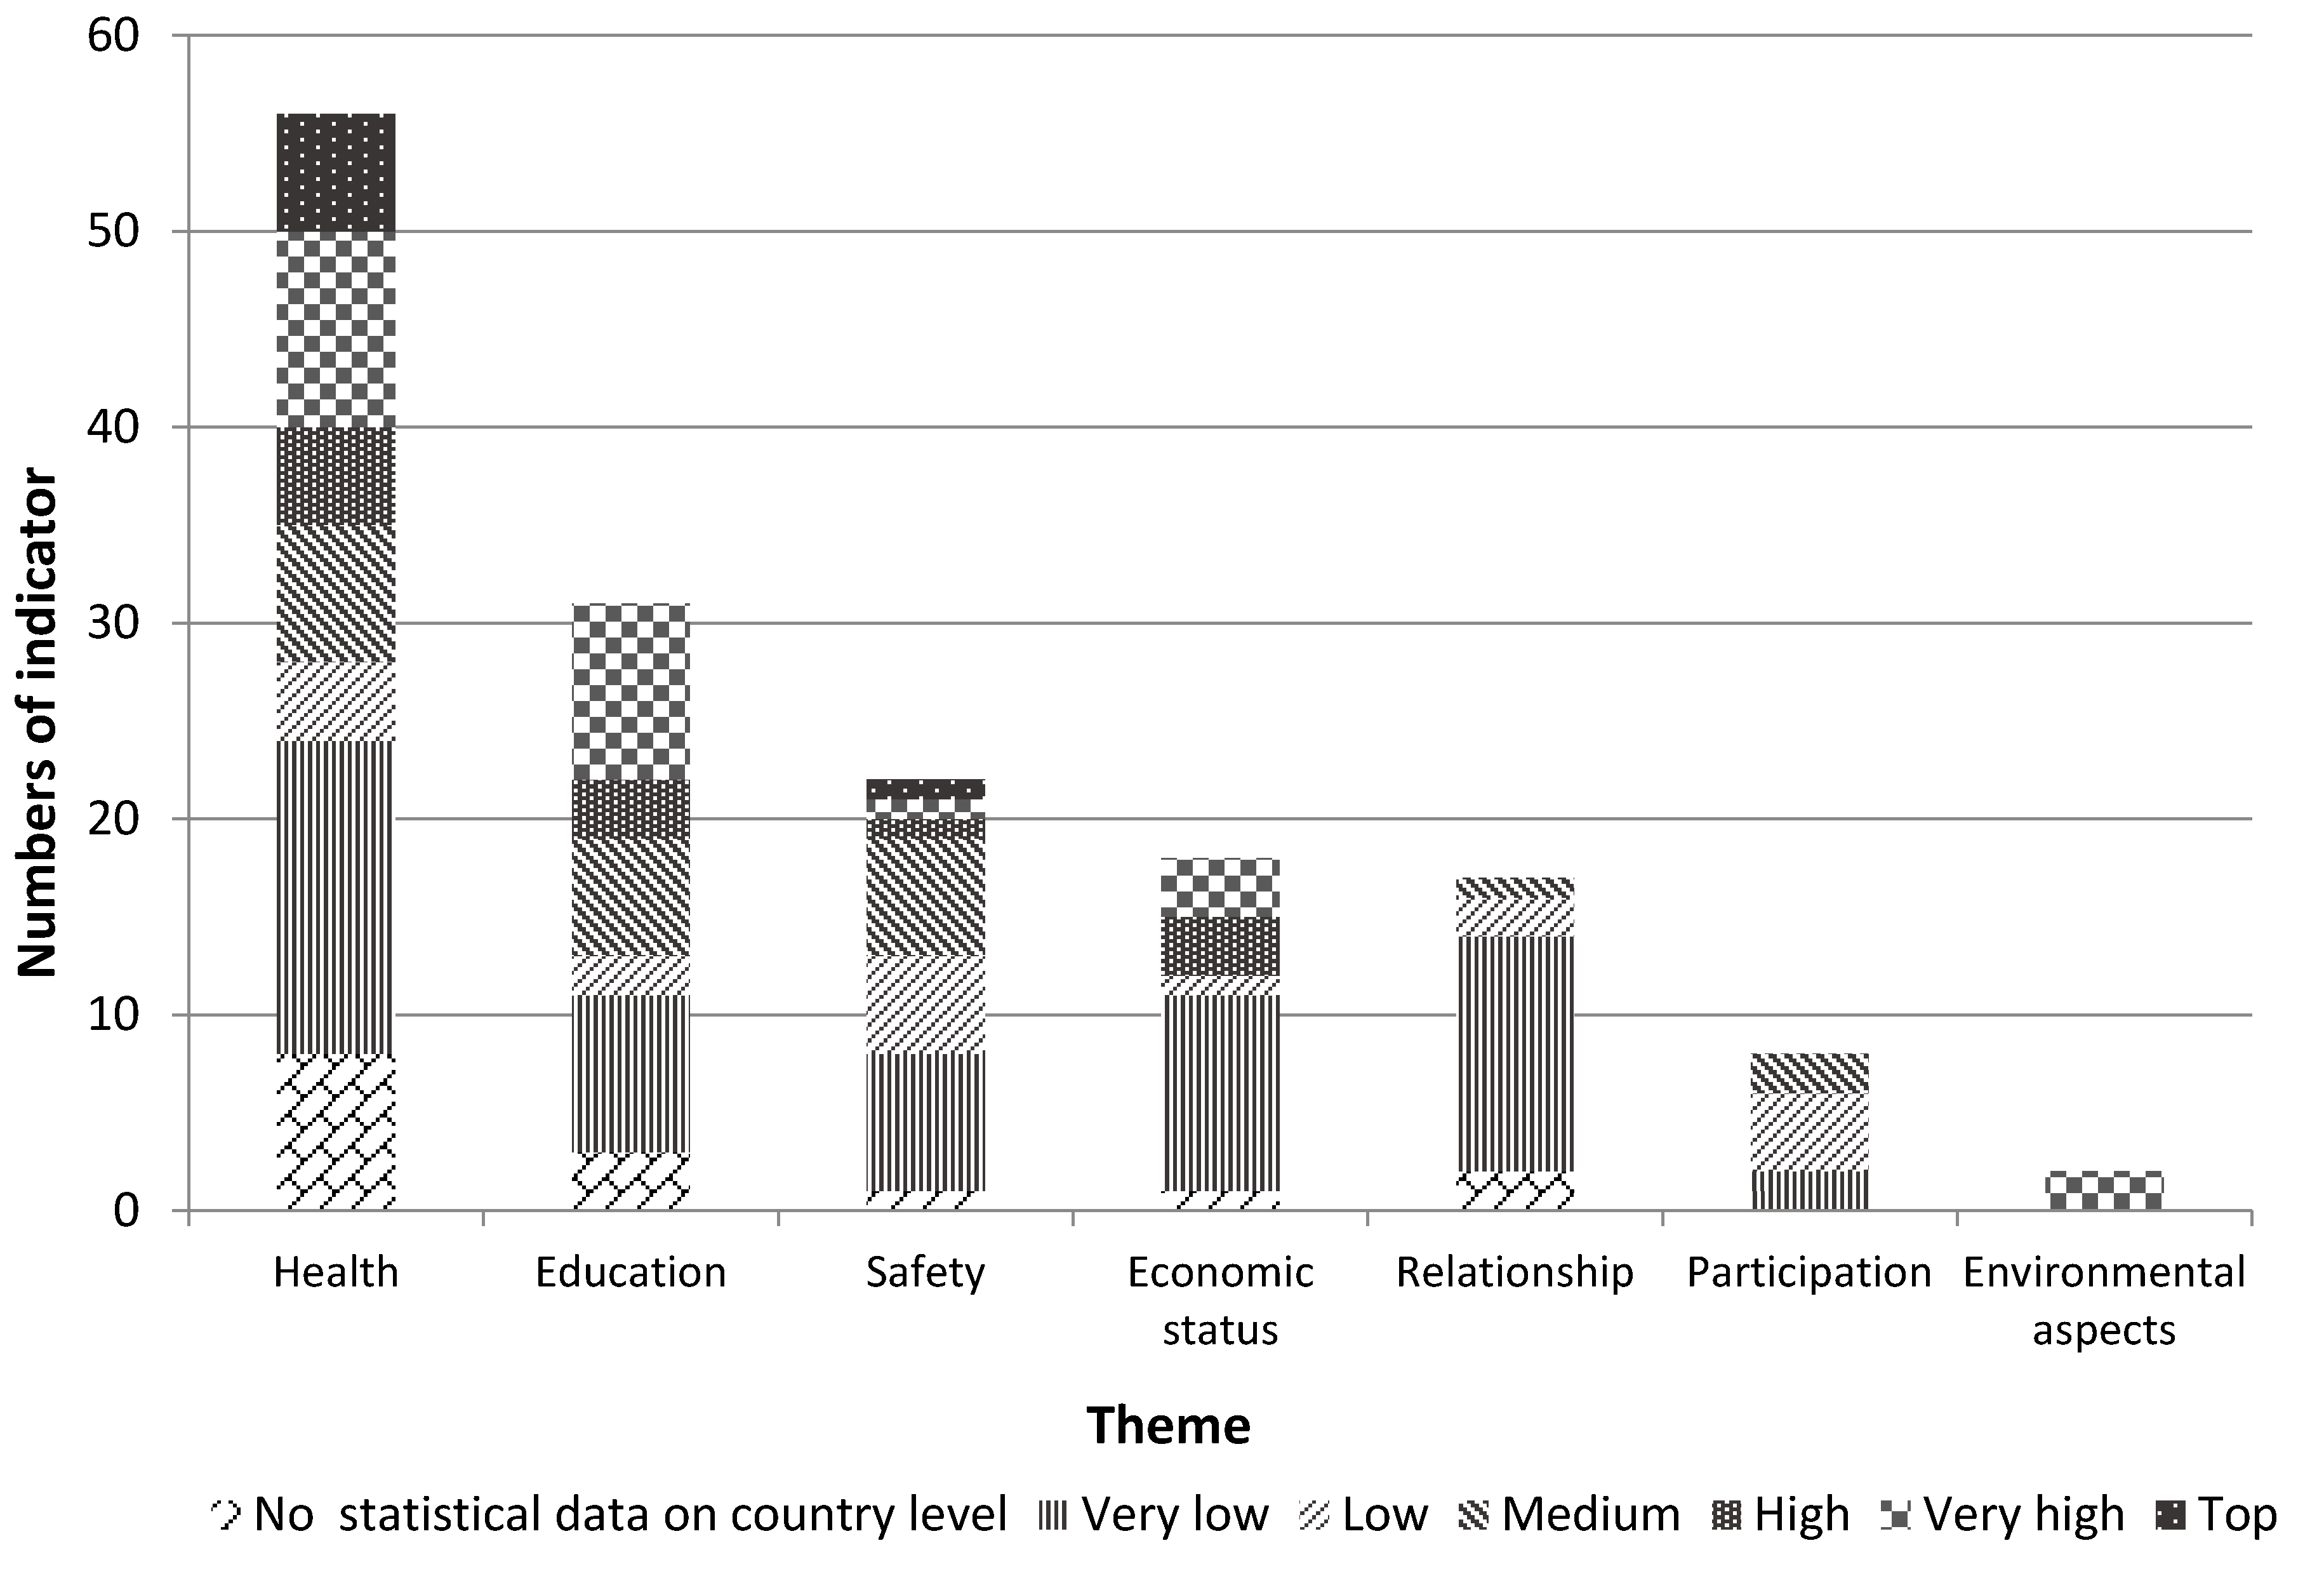
3.2. Analysis of Indicators for the SCDI

The key messages gained from the analysis of indicators for the SCDI are summarized in the following bullet points, and are then explained in detail.
  • The data availability of indicators differs among the different topics, for example data availability for the theme health is high, but for the theme relationship is low.
  • The share of indicators differs for the different topics of the SCDI framework, for instance most indicators are available for the theme health.
It is shown that data availability varies significantly for the topics of the SCDI framework. Figure 3 shows the results of the analysis of data availability for the 154 indicators collected for the seven themes of the SCDI framework, such as health, safety, relationship. It is displayed that only for six indicators in the theme health and one indicator in the theme safety, data are available for all countries, that is, on top data availability level. In general, health and education are the themes that have most indicators with better data availability. For example, Figure 3 displays that for the themes health and education, there are large shares of the indicators from top to medium data availability levels. On the other hand, the indicators for the themes relationship and participation are mainly considered in the medium, low, very low data availability levels. This finding indicates that the indicators of the themes relationship and participation have a worse data availability to evaluate CD. Thus, the development of data collection of theme relationship and participation shall be noticed and further improved. Besides, some indicators of the theme health, economic status and relationship show worse data availability because their associated data source are especially limited to certain countries, for example Organization for Economic Co-operation and Development (OCED) and European countries [12,38,41,49,51]. The themes health, education, relationship include many indicators that have no statistical data at country level. For example, the indicators that assess chronic diseases, disability and illicit drug use have statistical data only on regional level from international databases. In addition, some indicators were conceptually proposed for the SCDI framework for addressing subjective-evaluated topics, e.g., reading pleasure and satisfaction to family, without collecting data in practice. A detailed list of numbers of indicators for different themes in different data availability levels is shown in the Supplementary Materials, Table S3.
It is also shown that most indicators are available for the theme health. The theme health covers over one third of the collected indicators (37%). The key reason may be that health was the main theme in early CD related studies, having more indicators developed than other themes. That indicates the indicators are concentrated on the theme health. While measuring CD, it shall be noticed not to overuse the indicators of the theme health. Education is another theme of large share of the indicators (20%). The themes economic status (12%), relationship (11%) and participation (5%) obtain minor share of indicators. This reveals a need for further indicator development of the three themes. Besides, currently, only two indicators are selected for the theme environment aspects. As the theme was newly proposed in Chang et al. [15] for assessing CD in the context of SD, more indicators associated to resource accessibility are needed for a more comprehensive coverage of environmental aspects in the SCDI framework.
Besides, the theme health holds the largest share of the initial indicator set (43%) followed by the theme education (26%). Other themes, for example relationship, participation, and environmental aspects, individually represent 1–3% of the indicator set. It indicates that though the identified seven themes are covered in an initial indicator set, the portion of themes relationship, participation, and environmental aspects is relatively small. The minor share of these themes shall be considered when implementing and interpreting the SCDI. Besides, the result also responds to the fact that health and education are the themes that have the most indicators with sufficient data availability; that is, at least medium data availability (also shown in Figure 3).
As described in Section 2, the indicators for the SCDI topics were screened with regard to data availability. An overview of the themes and subthemes of the SCDI framework including their data availability is provided in Figure 4. In Figure 4, bold wording and bullet correspondingly indicate the themes and subthemes. Superscripts note the highest data availability level that indicators have in each subtheme. T, VH, H, M, L, VL, and N corresponding to top, very high, high, medium, low, very low data availability level, and no statistical data on country level, respectively. The detailed lists of corresponding criteria of the subthemes are provided in the Supplementary Materials, Table S4. The subthemes and criteria which are described by indicators with limited data availability are identified and recommended to conduct further indicator and data development, e.g., data collection and methodological improvement of indicators. Four subthemes and 11 criteria were recognized as the topics described by indicators lacking statistical data available on country level from international databases. The four subthemes are chronic diseases, disability, other participation in education, as well as debt and financial difficulty. The 11 criteria are depression, emotional and behavior difficulty, maternal smoking, health insurance coverage, family smoking, illicit drug use, parents reading to children, reading pleasure, extracurricular subjects, satisfaction of family, and satisfaction of community. Additionally, 17 subthemes and 39 criteria only have indicators assigned to low and very low data availability levels. These subthemes and criteria are also provided in Table S1. In total, 21 subthemes (marked with superscripts L, VL, and N in Figure 4) and 50 criteria described by indicators with limited data availability are considered in the SCDI framework, but for now are not included in the initial indicator set in order to facilitate implementation of the SCDI. The challenge of data availability shall be noticed and addressed by indicator and data development measures, such as methodology development and data collection.
To be noticed, addressing economic status as a purely contextual theme is a modification of the SCDI framework proposed by Chang et al. [15]. The indicators for the theme economic status refer to the background of economy in which children grow up and live with. For instance, housing quality, macroeconomic situation, and household income poverty are the factors to influence development of children, but not the direct performance acted by children. Thus, the theme economic status shall be allocated only on contextual level. The subthemes and criteria of the theme economic status separated on the two levels in the original SCDI framework are put together on contextual level. To sum up, the SCDI framework contains seven themes, 50 subthemes, and 109 criteria. It includes five themes (health, educational, safety, relationship, and participation) addressing the outcome level and seven themes (the previous five themes, economic status, and environment aspects) addressing the contextual level (see Figure 4).

4. Discussion

This study provides an initial indicator set for the SCDI and identifies the SCDI topics described by indicators with limited data availability. This contribution can serve as the basis for further developing the SCDI in the context of SD to allow a comparison of countries in terms of their relative performance, and for fostering indicator and data development for the topics with limited data availability.
Nevertheless, some research challenges remain, such as the limited consideration of indicators in specific themes, such as environmental aspects and participation, and inconsistent reference years of statistical data for the indicators. For instance, among all 154 identified indicators, there are only eight for the theme participation, and two for the theme environmental aspects. The limited inclusion of indicators may lead to insufficient and biased evaluation of sustainable child development. Since participation is a relatively new topic in evaluation of sustainable child development, existing indicators with available data are few. The theme environment aspects was newly proposed in Chang et al. [15] for assessing CD in the context of SD. Freshwater vulnerability and renewable energy consumption were selected as the two relevant subthemes for the theme environmental aspects in the SCDI framework; nevertheless, other potential topics (such as soil quality and erosion) that are specifically related to resource accessibility and intergenerational equality usually have limited statistical data on country level. The databases need to be developed and more indicators addressing resource accessibility need to be considered in the SCDI framework for a more comprehensive coverage in order to emphasize intergenerational equality.
Besides, reference years of statistical data for the indicators are not identical. Statistical data of indicators for most of the subthemes (e.g., child mortality and attendance of education) are updated annually. On the other hand, indicators for few subthemes (e.g., renewable energy consumption and mental health) are updated on a four-year basis. Considering the indicators with lower update frequency, the SCDI is thus suggested being updated on a four-year basis (i.e., over a longer period than one year). This suggested updating period is also in line with the CDI. As the SCDI is designed for assessing and monitoring the improvements or declines of CD for countries, this arrangement for updating frequency could be also reasonable as longer time frames may be needed to make the trend of the country’s performance regarding sustainable child development visible.
Currently, there are no commonly used or widely suggested methods to normalize and aggregate multi-dimensional indicators for computing one index. In order to construct a SCDI, defining proper normalization and aggregation methods as well as weighting choices is the next step for this research (also see Figure 1). Sensitivity analysis will also be conducted to test the robustness of a SCDI.
Moreover, the indicators were collected based on the identified relevant subthemes and criteria summarized in Chang et al. [15]. Thus, the SCDI framework and indicators will have to be continuously revised and updated when additional literature and statistical data with regard to sustainable child development become available. In accordance with the indicator analysis considering data availability, the subthemes (e.g., family relationship and parents’ educational qualification) that have indicators only with limited data availability (see Figure 4) have priority in indicator and data development. The ongoing SDG indicator development is also beneficial and can be taken as reference for supporting SCDI indicator development.
In addition, the SCDI and the proposed initial indicator set will be tested in exemplary case studies to investigate the validity and potential to be integrated into existing sustainability assessment approaches. Since the indicator set is proposed considering good data availability and reliable data, it can serve as a supplementary indicator pool to support researchers for developing or adjusting development indicators and indexes related to child as well as sustainable development policies and studies (e.g., the HDI families and CDI).

5. Conclusions

In total, 154 indicators are identified for the topics of the Sustainable Child Development Index (SCDI) framework with statistical data on country level and then analyzed regarding data availability. Among the collected indicators, 66 indicators with statistical data covering at least 100 countries are proposed as an initial indicator set. The indicator analysis also shows that the theme health has the largest share of collected indicators and obtains many indicators with good data availability. On the other hand, most of the indicators of the themes relationship and participation have limited data availability. Moreover, 21 subthemes and 50 criteria described by indicators with limited data availability at this point of time are underlined to call on indicator and data development.
The contribution of this paper is the provision of an indicator set for initiating the SCDI that can clearly measure the relevant topics of sustainable child development and has available statistical data to support a quantitative assessment. Therefore, the practicality of the SCDI framework is expected. Such a detailed analysis is required to transparently describe the development of the SCDI. In addition, the individual indicators of the set can also serve as a basic indicator pool for being applied and adapted in other CD and SD related studies. It is expected to support decision makers to draw up strategies on child as well as sustainable development policies, and serve as a communication tool to stakeholders. The next steps will focus on the development of calculation methods such as normalization and aggregation for the SCDI.

Supplementary Materials

The following are available online at www.mdpi.com/2071-1050/9/4/518/s1, Table S1: 139 indicators collected for Sustainability Child Development Index, Table S2: The relation of the initial indicator set of the SCDI to the SDG indicator development, Table S3: Numbers of indicators of the themes in different data availability levels, Table S4: Subthemes and criteria of the SCDI framework.

Acknowledgments

We acknowledge support by the German Research Foundation and the Open Access Publication Funds of Technische Universität Berlin.

Author Contributions

Ya-Ju Chang is the leading author of the article. The research including literature and indicator analysis was completed by Ya-Ju Chang. Annekatrin Lehmann and Matthias Finkbeiner provided substantial contribution to the design of the study. All authors proofread and approved the final manuscript.

Conflicts of Interest

The authors declare no conflict of interest.

References

  1. International Union for Conservation of Nature and Natural Resource. World Conservation Strategy—Living Resource Conservation for Sustainable Development; International Union for Conservation of Nature Resource: Gland, Switzerland, 1980. [Google Scholar]
  2. UNICEF (United Nations Children’s Fund). A Post-2015 World Fit for Children—Sustainable Development Starts and Ends with Safe, Healthy and Well-Educated Children; United Nations Children’s Fund: New York, NY, USA, 2013. [Google Scholar]
  3. Halleröd, B.; Rothstein, B.; Daoud, A.; Nandy, S. Bad governance and poor children: A comparative analysis of government efficiency and severe child deprivation in 68 low- and middle-income countries. World Dev. 2013, 48, 19–31. [Google Scholar] [CrossRef]
  4. Ben-Arieh, A.; Casas, F.; Frønes, I.; Korbin, J.E. The Handbook of Child Well-Being—Theories, Methods and Policies in Global Perspective, 1st ed.; Springer: Dordrecht, The Netherlands, 2014. [Google Scholar]
  5. Ben-Arieh, A. From Child Welfare to Children Well-Being: The Child Indicators Perspective. In From Child Welfare to Child Well-Being—An International Perspective on Knowledge in the Service of Policy Making; Kamerman, S.B., Phipps, S., Ben-Arieh, A., Eds.; Springer: Dordrecht, The Netherlands, 2010; Volume 1, pp. 9–22. [Google Scholar]
  6. Ben-Arieh, A. The child indicators movement: Past, present, and future. Child Indic. Res. 2008, 1, 3–16. [Google Scholar] [CrossRef]
  7. The Save the Children Fund. The Child Development Index—Holding Governments to Account Children’s Wellbeing; The Save the Children Fund: London, UK, 2008. [Google Scholar]
  8. The Save the Children Fund. The Child Development Index 2012—Progress, Challenges and Inequality; The Save the Children Fund: London, UK, 2012. [Google Scholar]
  9. UNDP (United Nations Development Programme). Human Development Report 2014; UNDP: New York, NY, USA, 2014. [Google Scholar]
  10. Children’s Society. The Good Childhood Report 2013; Children’s Society: London, UK, 2013. [Google Scholar]
  11. Foundation for Child Development. Child and Youth Well-Being Index (CWI); Foundation for Child Development: New York, USA, 2011. [Google Scholar]
  12. UNICEF (United Nations Children’s Fund). An Overview of Child Well-Being in Rich Countries; UNICEF: Florence, Italy, 2007. [Google Scholar]
  13. Bradshaw, J.; Hoelscher, P.; Richardson, D. An Index of Child Well-being in the European Union. Soc. Indic. Res. 2007, 80, 133–177. [Google Scholar] [CrossRef]
  14. The Annie E Casey Foundation. The New KIDS COUNT Index; The Annie E Casey Foundation: Baltimore, MD, USA, 2012. [Google Scholar]
  15. Chang, Y.-J.; Schneider, L.; Finkbeiner, M. Assessing Child Development: A Critical Review and the Sustainable Child Development Index (SCDI). Sustainability 2015, 7, 4973–4996. [Google Scholar] [CrossRef]
  16. Singh, R.K.; Murty, H.R.; Gupta, S.K.; Dikshit, A.K. An overview of sustainability assessment methodologies. Ecol. Indic. 2012, 15, 281–299. [Google Scholar] [CrossRef]
  17. Ciegis, R.; Ramanauskiene, J.; Startiene, G. Theoretical reasoning of the use of indicators and indices for sustainable development assessment. Eng. Econ. 2009, 63, 33–40. [Google Scholar]
  18. United Nations Sustainable Development Goals. Available online: https://sustainabledevelopment.un.org/sdgs (accessed on 17 June 2016).
  19. United Nations. The Sustainable Development Goals Report 2016; United Nations: New York, NY, USA, 2016. [Google Scholar]
  20. Fernandes, L.; Mendes, A.; Teixeira, A.A.C. A review essay on the measurement of child well-being. Soc. Indic. Res. 2012, 106, 239–257. [Google Scholar] [CrossRef]
  21. Federal Interagency Forum on Child and Family Statistics. America’s Children: Key National Indicators of Well-Being 2013; U.S. Government Printing Office: Washington, DC, USA, 2013.
  22. Land, K.C.; Lamb, V.L.; Meadows, S. Conceptual and Methodological Foundations of the Child and Youth Well-Being Index. In The Well-Being of America’s Children—Developing and Improving the Child and Youth Well-Being Index; Land, K.C., Ed.; Springer: Dordrecht, The Netherlands, 2012; pp. 13–27. [Google Scholar]
  23. Land, K.C.; Lamb, V.L.; Meadows, S.; Zheng, H.; Fu, Q. The CWI and Its Components: Empirical Studies and Findings. In The Well-Being of America’s Children—Developing and Improving the Child and Youth Well-Being Index; Land, K.C., Ed.; Springer: Dordrecht, The Netherlands, 2012; pp. 29–75. [Google Scholar]
  24. Lee, B.J. Mapping Domains and Indicators of Children’s Well-Being. In The Handbook of Child Well-Being—Theories, Methods and Policies in Global Perspective; Ben-Arieh, A., Casas, F., Frønes, I., Korbin, J.E., Eds.; Springer: Dordrecht, The Netherlands, 2014; pp. 2797–2805. [Google Scholar]
  25. Ontario Agency for Health Protection and Promotion. Measuring the Health of Infants, Children and Youth for Public Health in Ontario: Indicators, Gaps and Recommendations for Moving Forward; Ontario Agency for Health Protection and Promotion: Toronto, ON, Canada, 2013. [Google Scholar]
  26. Köhler, L. A Child Health Index for the North-Eastern Parts of Göteborg; Nordic School of Public Health: Göteborg, Sweden, 2010. [Google Scholar]
  27. Moore, K.A.; Mbwana, K.; Theokas, C.; Lippman, L.; Bloch, M.; Vandivere, S.; O’Hare, W. Child Well-Being: An Index Based on Data of Individual Children; Child Trends.: Washington, DC, USA, 2011. [Google Scholar]
  28. Lee, B.J.; Kim, S.S.; Ahn, J.J.; Yoo, J.P. Developing an index of child well-being in Korea. In Proceedings of the 4th International Society of Child Indicators Conference, Seoul, Korea, 11–15 February 2013. [Google Scholar]
  29. Niclasen, B.; Köhler, L. National indicators of child health and well-being in Greenland. Scand. J. Public Health 2009, 37, 347–356. [Google Scholar] [CrossRef] [PubMed]
  30. Cho, E.Y.-N. A clustering approach to comparing children’s wellbeing accross countries. Child Indic. Res. 2014, 7, 553–567. [Google Scholar]
  31. Erbstein, N.; Hartzog, C.; Geraghty, E.M. Putting youth on the map: A pilot instrument for assessing youth well-being. Child Indic. Res. 2013, 6, 257–280. [Google Scholar] [CrossRef] [PubMed]
  32. Hanafin, S.; Brooks, A.-M.; Carroll, E.; Fitzgerald, E.; GaBhainn, S.N.; Sixsmith, J. Achieving consensus in developing a national set of child well-being indicators. Soc. Indic. Res. 2007, 80, 79–104. [Google Scholar] [CrossRef]
  33. Berger, M.; Van Der Ent, R.; Eisner, S.; Bach, V.; Finkbeiner, M. Water accounting and vulnerability evaluation (WAVE): Considering atmospheric evaporation recycling and the risk of freshwater depletion in water footprinting. Environ. Sci. Technol. 2014, 48, 4521–4528. [Google Scholar] [CrossRef] [PubMed]
  34. Child Trends. World Family Mapping: Family Change and Child Well-Being Outcomes; Child Trends: Bethesda, MD, USA, 2014. [Google Scholar]
  35. Ministry of Social Development. Children and Young People: Indicators of Wellbeing in New Zealand 2008; Ministry of Social Development: Wellington, New Zealand, 2008.
  36. Australian Institute of Health and Welfare. Headline Indicators for Children’s Health, Development and Wellbeing 2011; Australian Institute of Health and Welfare: Canberra, Australia, 2011. [Google Scholar]
  37. European Union Community Health Monitor Programme. Child Health Indicators of Life and Development; Rigby, M., Köhler, L., Eds.; European Union Community Health Monitoring Programme: Luxemburg, 2002. [Google Scholar]
  38. WHO (World Health Organization) Regional Office for Europe. Social Determinants of Health and Well-Being among Young People; WHO Regional Office for Europe: Copenhagen, Denmark, 2012. [Google Scholar]
  39. UNICEF (United Nations Children’s Fund). The State of the World’s Children 2014 in Numbers: Every Child Counts; UNICEF: New York, NY, USA, 2014. [Google Scholar]
  40. WHO (World Health Organization). Preventing Suicide: A Global Imperative; WHO: Luxembourg, 2014. [Google Scholar]
  41. OECD (Organization for Economic Co-operation and Development). PISA 2012 Results in Focus; OECD: Paris, France, 2013. [Google Scholar]
  42. WHO (World Health Organization). Global Status Report on Noncommunicable Diseases 2014; WHO: Geneva, Switzerland, 2014. [Google Scholar]
  43. European Centre for the Development of Vocational Training. The Benefits of Vocational Education and Training; Publications Office of the European Union: Luxemburg, 2011. [Google Scholar]
  44. Legatum Institute. The Legatum Prosperity Index 2016; The Legatum Institute Foundation: London, UK, 2016. [Google Scholar]
  45. UNICEF (United Nations Children’s Fund). Childinfo: Monitoring the Situation of Children and Women. Available online: http://www.childinfo.org/ (accessed on 11 March 2017).
  46. Malmö University. Oral Health Database. Available online: http://www.mah.se/capp/ (accessed on 25 August 2016).
  47. WHO (World Health Organization). Global Health Observatory (GHO) Data. Available online: http://www.who.int/gho/en/ (accessed on 10 March 2017).
  48. UNESCO (United Nations Educational, Scientific and Cultural Organization). UIS.Stat. Available online: http://data.uis.unesco.org/ (accessed on 11 August 2016).
  49. OECD (Organization for Economic Co-operation and Development). OECD Family Database. Available online: http://www.oecd.org/els/family/database.htm (accessed on 21 October 2015).
  50. UNODC (United Nations Office on Drugs and Crime). Data and Analysis Statistics. Available online: https://www.unodc.org/unodc/en/data-and-analysis/statistics/index.html (accessed on 12 March 2017).
  51. European Commission. Eurostat. Available online: http://ec.europa.eu/eurostat/data/database (accessed on 19 October 2015).
  52. World Bank. World Bank Open Data. Available online: http://data.worldbank.org/ (accessed on 11 March 2017).
  53. CIA (Central Intelligence Agency). Sex Ratio at Birth. Available online: https://www.cia.gov/library/publications/the-world-factbook/fields/2018.html (accessed on 20 March 2017).
  54. ITU (International Telecommunication Union). ITU—Statistics. Available online: http://www.itu.int/en/ITU-D/Statistics/Pages/stat/default.aspx (accessed on 19 March 2017).
  55. UNDP (United Nations Development Programme). Income Gini Coefficient. Available online: http://hdr.undp.org/en/content/income-gini-coefficient (accessed on 11 March 2016).
  56. UN (United Nations). Tier Classification for Global SDG Indicators; UN: New York, NY, USA, 2016. [Google Scholar]
  57. UNICEF (United Nations Children’s Fund). The State of the World’s Children 2016: A Fair Chance for Every Child; UNICEF: New York, NY, USA, 2016. [Google Scholar]
  58. UNICEF (United Nations Children’s Fund). The State of the World’s Children 2015: Reimagine the Future, Innovation for Every Child; UNICEF: New York, NY, USA, 2014. [Google Scholar]
Figure 1. The structure of the SCDI (exemplary criteria and indicator are presented for the subtheme child mortality, adapted from Chang et al. [15]).
Sustainability 09 00518 g001
Figure 2. Research approach of the study.
Sustainability 09 00518 g002
Figure 3. Numbers of the indicators in different data availability levels, by themes of the SCDI framework
Sustainability 09 00518 g003
Figure 4. The overall framework of Sustainable Child Development Index (adapted from Chang et al. [15]).
Sustainability 09 00518 g004
Table 1. Scheme of data availability levels of indicators.
Data Availability Level
TopVery HighHighMediumLowVery LowNo Available Statistical Data
Numbers of covered country195195 > N ≥ 175175 > N ≥ 150150 > N ≥ 100100 > N ≥ 5050 > N ≥ 10
Table 2. Accumulative numbers of covered indicators and topics in different data availability levels.
Data Availability LevelCovered IndicatorsCovered Topics
Top data availability72 themes,
3 subthemes,
7 criteria
At least very high data availability345 themes,
19 subthemes,
29 criteria
At least high data availability445 themes,
22 subthemes,
41 criteria
At least medium data availability667 themes,
29 subthemes,
59 criteria
At least low data availability847 themes,
33 subthemes,
70 criteria
At least very low data availability1397 themes,
46 subthemes,
98 criteria
No statistical data at country level1547 themes,
50 subthemes,
109 criteria
Table 3. Initial indicator set based on at least medium data availability.
ThemeSubthemeCriteriaIndicatorData AvailabilitySource
Covered CountriesLevel
HealthNutritionLow birth weightPercentage of infants born with low birth weight (<2500 g)187Very highUNICEF Childinfo [45]
Overweight and obesityOverweight (including obesity, %)146Medium
Breast feedingExclusive breastfeeding < six months (%)167High
UnderweightUnderweight (moderate and severe, %)148Medium
WastingChildren under five below minus two standard deviations from median weight-for-height (%)147Medium
StuntingChildren under five below minus two standard deviations from median height-for-age (%)147Medium
Child mortalityInfant mortalityInfant mortality rate (probability of dying between birth and age one per 1000 live births)195Top
Under-five mortalityUnder-five mortality rate (probability of dying by age five per 1000 live births)195Top
Neonatal mortalityNeonatal mortality rate (during the first 28 completed days, per 1000 live births)195Top
Oral healthDental treatmentsDMFT (decayed, missing or filled teeth) among 12-year-olds180Very highMalmö University Oral Health Database [46]
Mental healthSuicideSuicide rate, 15–29 year-olds, per 100,000171Very highWHO [40]
Hazardous pollutantHousehold and ambient air pollutionMortality rate attributed to household and ambient air pollution (per 100,000 population)172HighWHO [47]
PM2.5 air pollutionPM2.5 air pollution, population exposed to levels exceeding WHO guideline value (% of total)187Very high
Immunization coverageMeasles containing vaccine (MCV) immunizationMeasles (MCV) immunization coverage among one-year-olds (%)195TopUNICEF [45]
Diphtheria tetanus toxoid and pertussis (DTP3) immunizationDiphtheria tetanus toxoid and pertussis (DTP3) immunization coverage among one-year-olds (%)195Top
Polio (Pol3) immunizationPolio (Pol3) immunization coverage among one-year-olds (%)195Top
Hepatitis B (HepB3) immunizationHepatitis B (HepB3) immunization coverage among one-year-olds (%)185Very high
Bacillus Calmette-Guérin (BCG) immunizationBacilleCalmette-Guérin (vaccine against tuberculosis) immunization coverage among one-year-olds (%)164High
Risk behaviorAlcohol usePercentage of 15–19 years old heavy episodic drinkers189Very highWHO; World Bank [47,52]
Adolescent fertilityAdolescent fertility rate (per 1000 girls aged 15–19 years)184Very high
Physical behaviorPhysical activityComparable estimates of prevalence of insufficient physical activity (adolescents 11–17 years)120MediumWHO [42]
Maternal healthAntenatal carePercentage of women aged 15–49 years attended at least once during pregnancy by skilled health personnel (doctor, nurse or midwife)149MediumUNICEF Childinfo [45]
Maternal mortalityMaternal mortality ratio (MMR, maternal deaths per 100,000 live births)183Very high
Skilled attendant at birthPercentage of births attended by skilled health personnel (doctor, nurse or midwife)168High
Health expenditurePublic health expenditurePublic health expenditure as % of total health expenditure190Very highWHO; World Bank [47,52]
Water and sanitationAccess to improved sanitation facilitiesImproved sanitation facilities (% of population with access)191Very highUNICEF; WHO; World Bank [45,47,52]
Access to improved drinking-water sourcesPopulation using improved drinking-water sources (%)193Very high
HIVHIV prevalence among youthEstimated percentage of young men and women (aged 15–24) living with HIV128MediumUNICEF [57,58]
EducationSchool attainmentOverall literacyYouth literacy rate, population 1–24 years, both sexes (%)151HighUNESCO [48]
RepetitionRepetition rate in primary education (all grades), both sexes (%)165High
Completion of educationPrimary school completionGross graduation ratio from primary education, both sexes107Medium
Secondary school completionGross graduation ratio from lower secondary education, both sexes (%)114Medium
Tertiary school completionGross graduation ratio from first degree programmes (ISCED 6 and 7) in tertiary education, both sexes (%)120Medium
Attendance of educationEnrolment in primary schoolGross enrolment ratio, primary, both sexes (%)191Very high
Enrolment in secondary schoolGross enrolment ratio, secondary, both sexes (%)188Very high
Enrolment in tertiary schoolGross enrolment ratio, tertiary, both sexes (%)175Very highUNESCO [48]
Early childhood educationEnrolment of kindergartenGross enrolment ratio, pre-primary, both sexes (%)187Very high
Government support on educationPublic expenditure on educationGovernment expenditure on education as % of GDP179Very high
Gender equalityGender equality in enrolmentGross enrolment ratio, pre-primary, gender parity index (GPI)176Very high
Gross enrolment ratio, primary, gender parity index (GPI)190Very high
Gross enrolment ratio, secondary, gender parity index (GPI)187Very high
Gross enrolment ratio, tertiary, gender parity index (GPI)177Very high
Gender equality in graduationGross graduation ratio from primary education, gender parity index (GPI)134Medium
Gross graduation ratio from lower secondary education, gender parity index (GPI)134Medium
Gross graduation ratio from first degree programmes (ISCED 6 and 7) in tertiary education, gender parity index (GPI)137Medium
Gender equality in youth literacyYouth literacy rate, population 1–24 years, gender parity index (GPI)152High
SafetyViolence and crimeJuvenile delinquencyJuveniles held in prisons, penal institutions or correctional institutions108MediumUNODC [50]
Juveniles brought into formal contact with the police and/or criminal justice system, all crimes108Medium
Criminal victimizationIntentional homicide count and rate per 100,000 population195Top
Assault and major assault rates in different countries (police recorded assaults/100,000 population)128Medium
Sexual violence against childrenTotal sexual offences against children at the national level, police-recorded offences, rate per 100,000 children aged 17 or under102Medium
Birth registrationRegistration of newbornsBirth registration rate166HighUNICEF [45]
Child laborChildren involved in child laborPercentage of children five-14 years old involved in child labor112Medium
Child marriageChildren married or in unionPercentage of women aged 20–24 years who were first married or in union before ages 18123Medium
Demographic structureSex ratioSex ratio at birth191Very highCIA [53]
Economic statusHousing qualityElectricity coverageAccess to electricity (% of population)191Very highWorld Bank [52]
Macroeconomic situationOverall unemploymentUnemployment, total (% of total labor force) (modeled ILO estimate)170High
Youth unemploymentYouth unemployment rate (% of total labor force ages 15–24)170High
Macroeconomic situationIncome equality at societal levelIncome Gini coefficient156HighUNDP [55]
National incomeGNI per capita, Purchasing power parity (current international $)183Very highWorld Bank [52]
National debtsPublic debt as percentage of GDP179Very highCIA [53]
RelationshipCommunity relationshipSocial capitalSocial Capital Ranking140MediumLegatum Institute [44]
ParticipationSocial media connectionInternet access in homeProportion of households with internet access at home138MediumITU [54]
Access to public mediaProportion of households with computer126Medium
Environmental aspectsFreshwater vulnerabilityRisk of depleting freshwater resourcesWater depletion index (WDI)192Very highBerger et al. [33]
Renewable energy consumptionConsumption of renewable energyRenewable energy consumption (% of total final energy consumption)180Very highWorld Bank [52]

