
A Bi-Band Binary Mask Based Land-Use Change Detection Using Landsat 8 OLI Imagery


Abstract
:1. Introduction
2. Materials and Methods
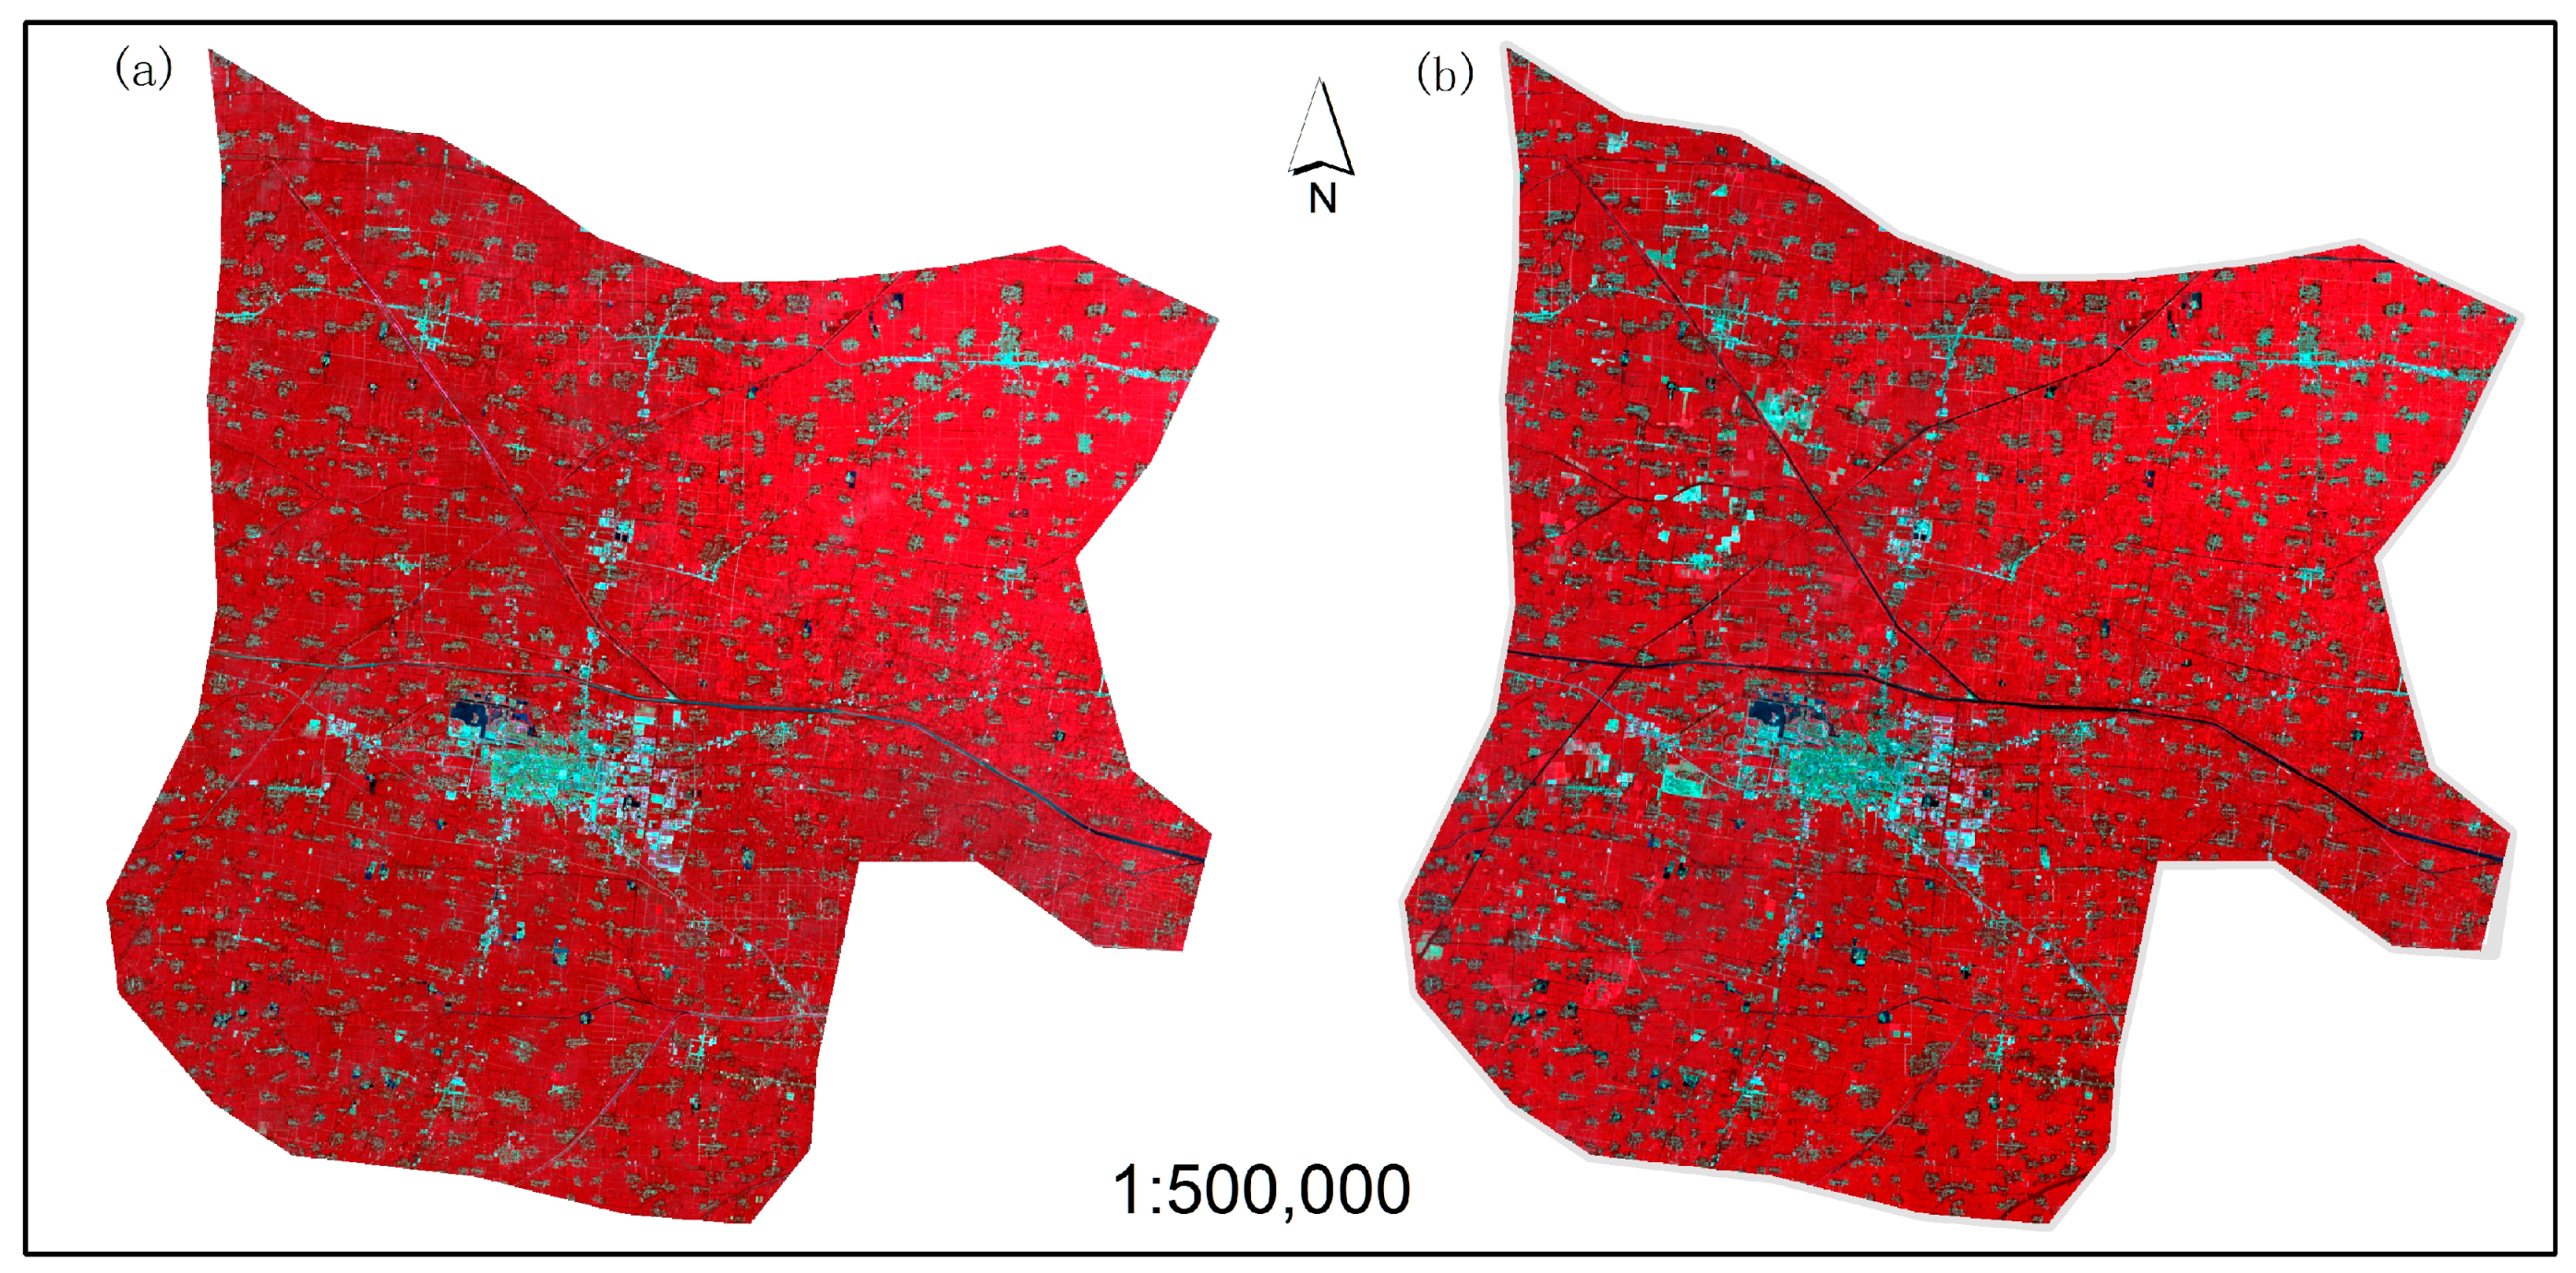
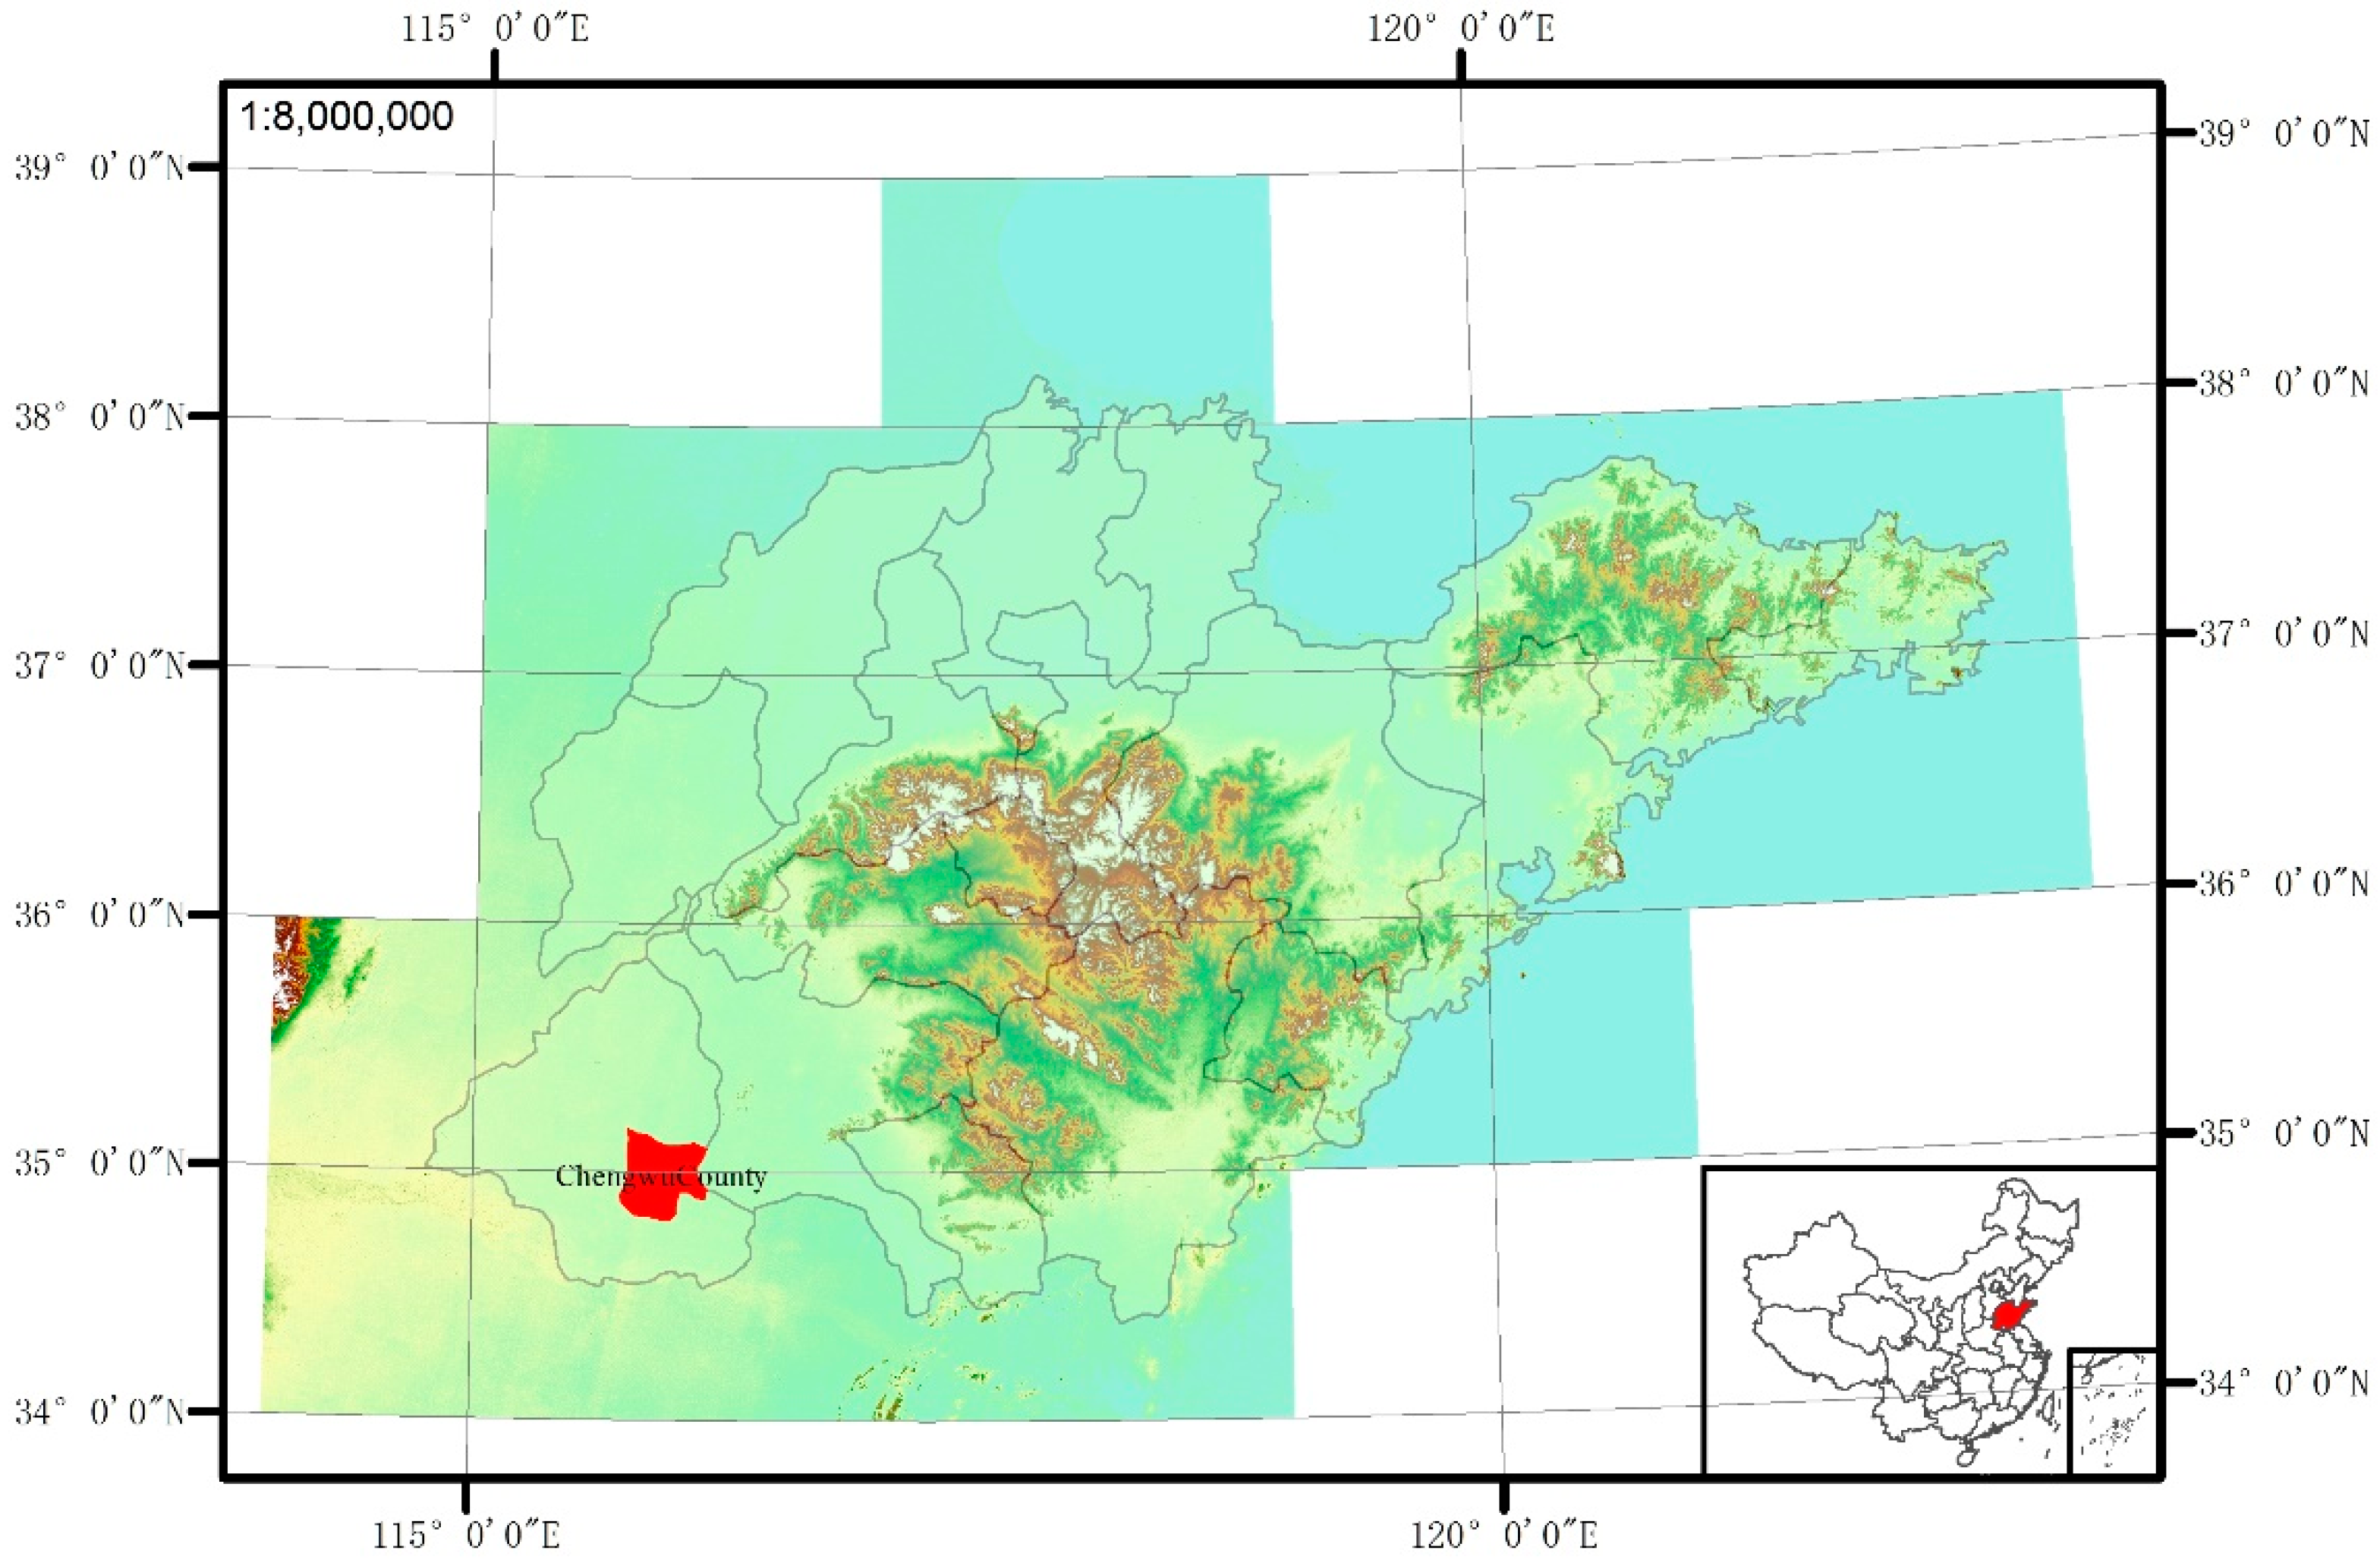
2.1. Study Area
2.2. Dataset and Preprocessing
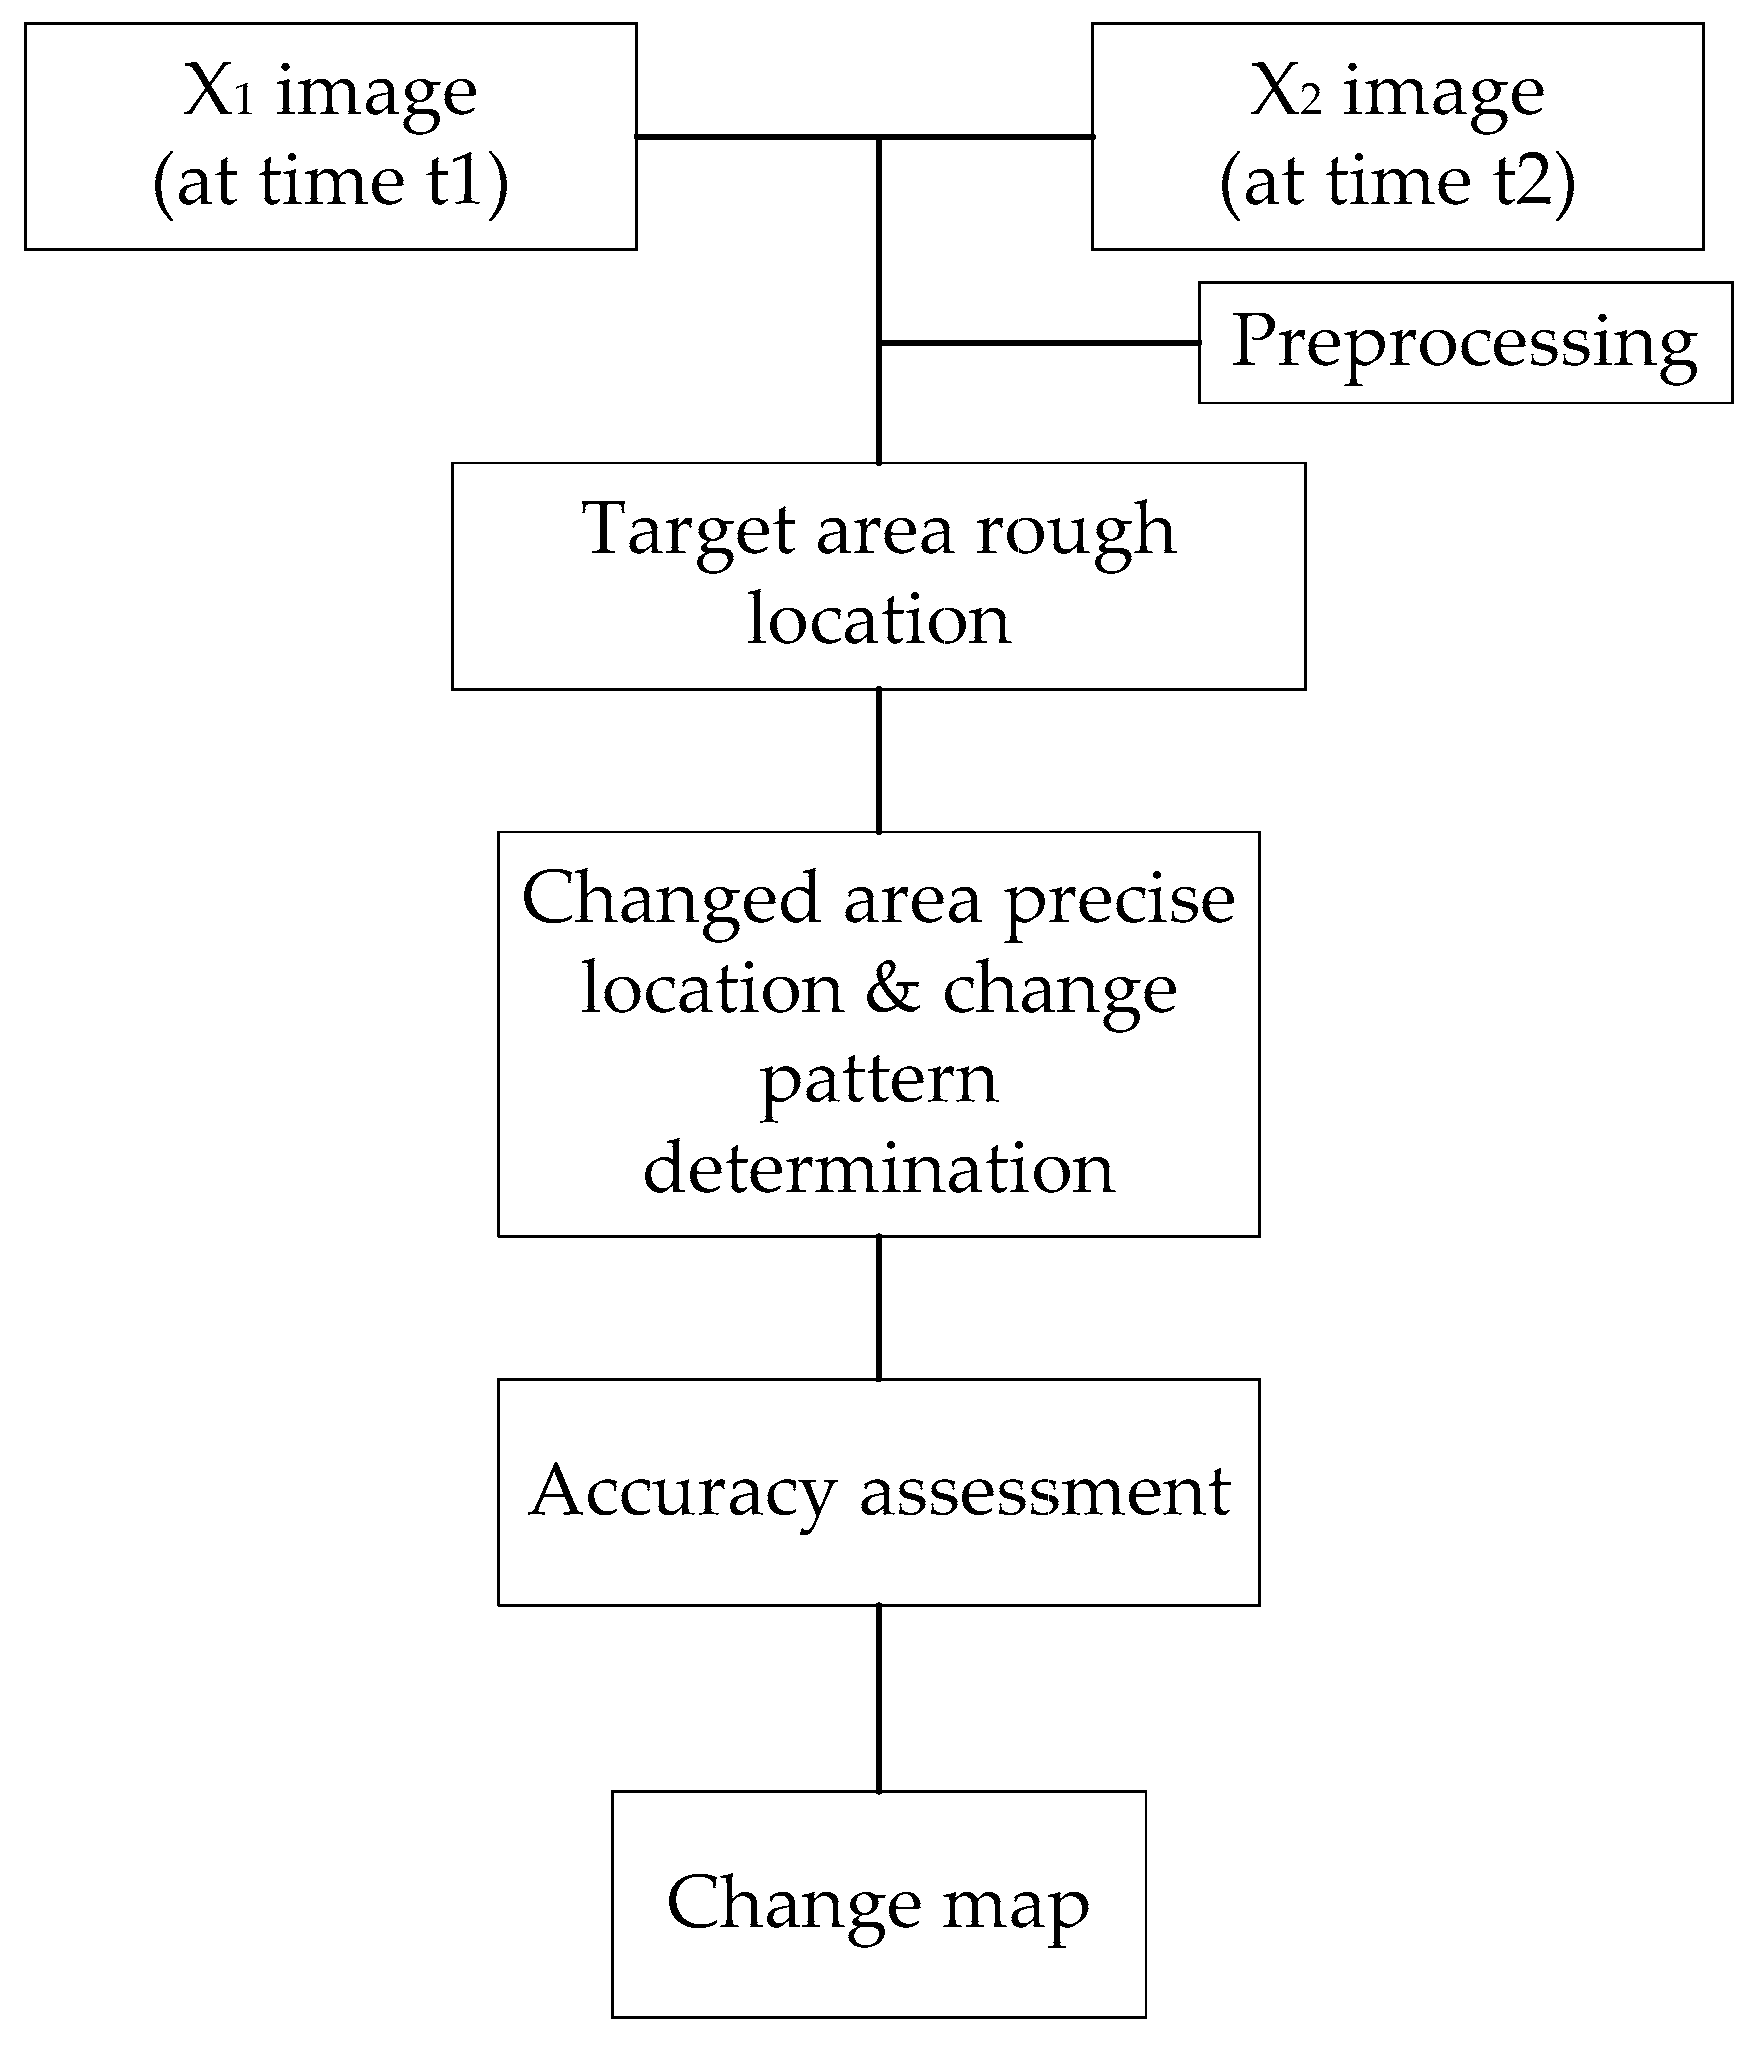
2.3. Methods
2.3.1. Target Area Rough Location
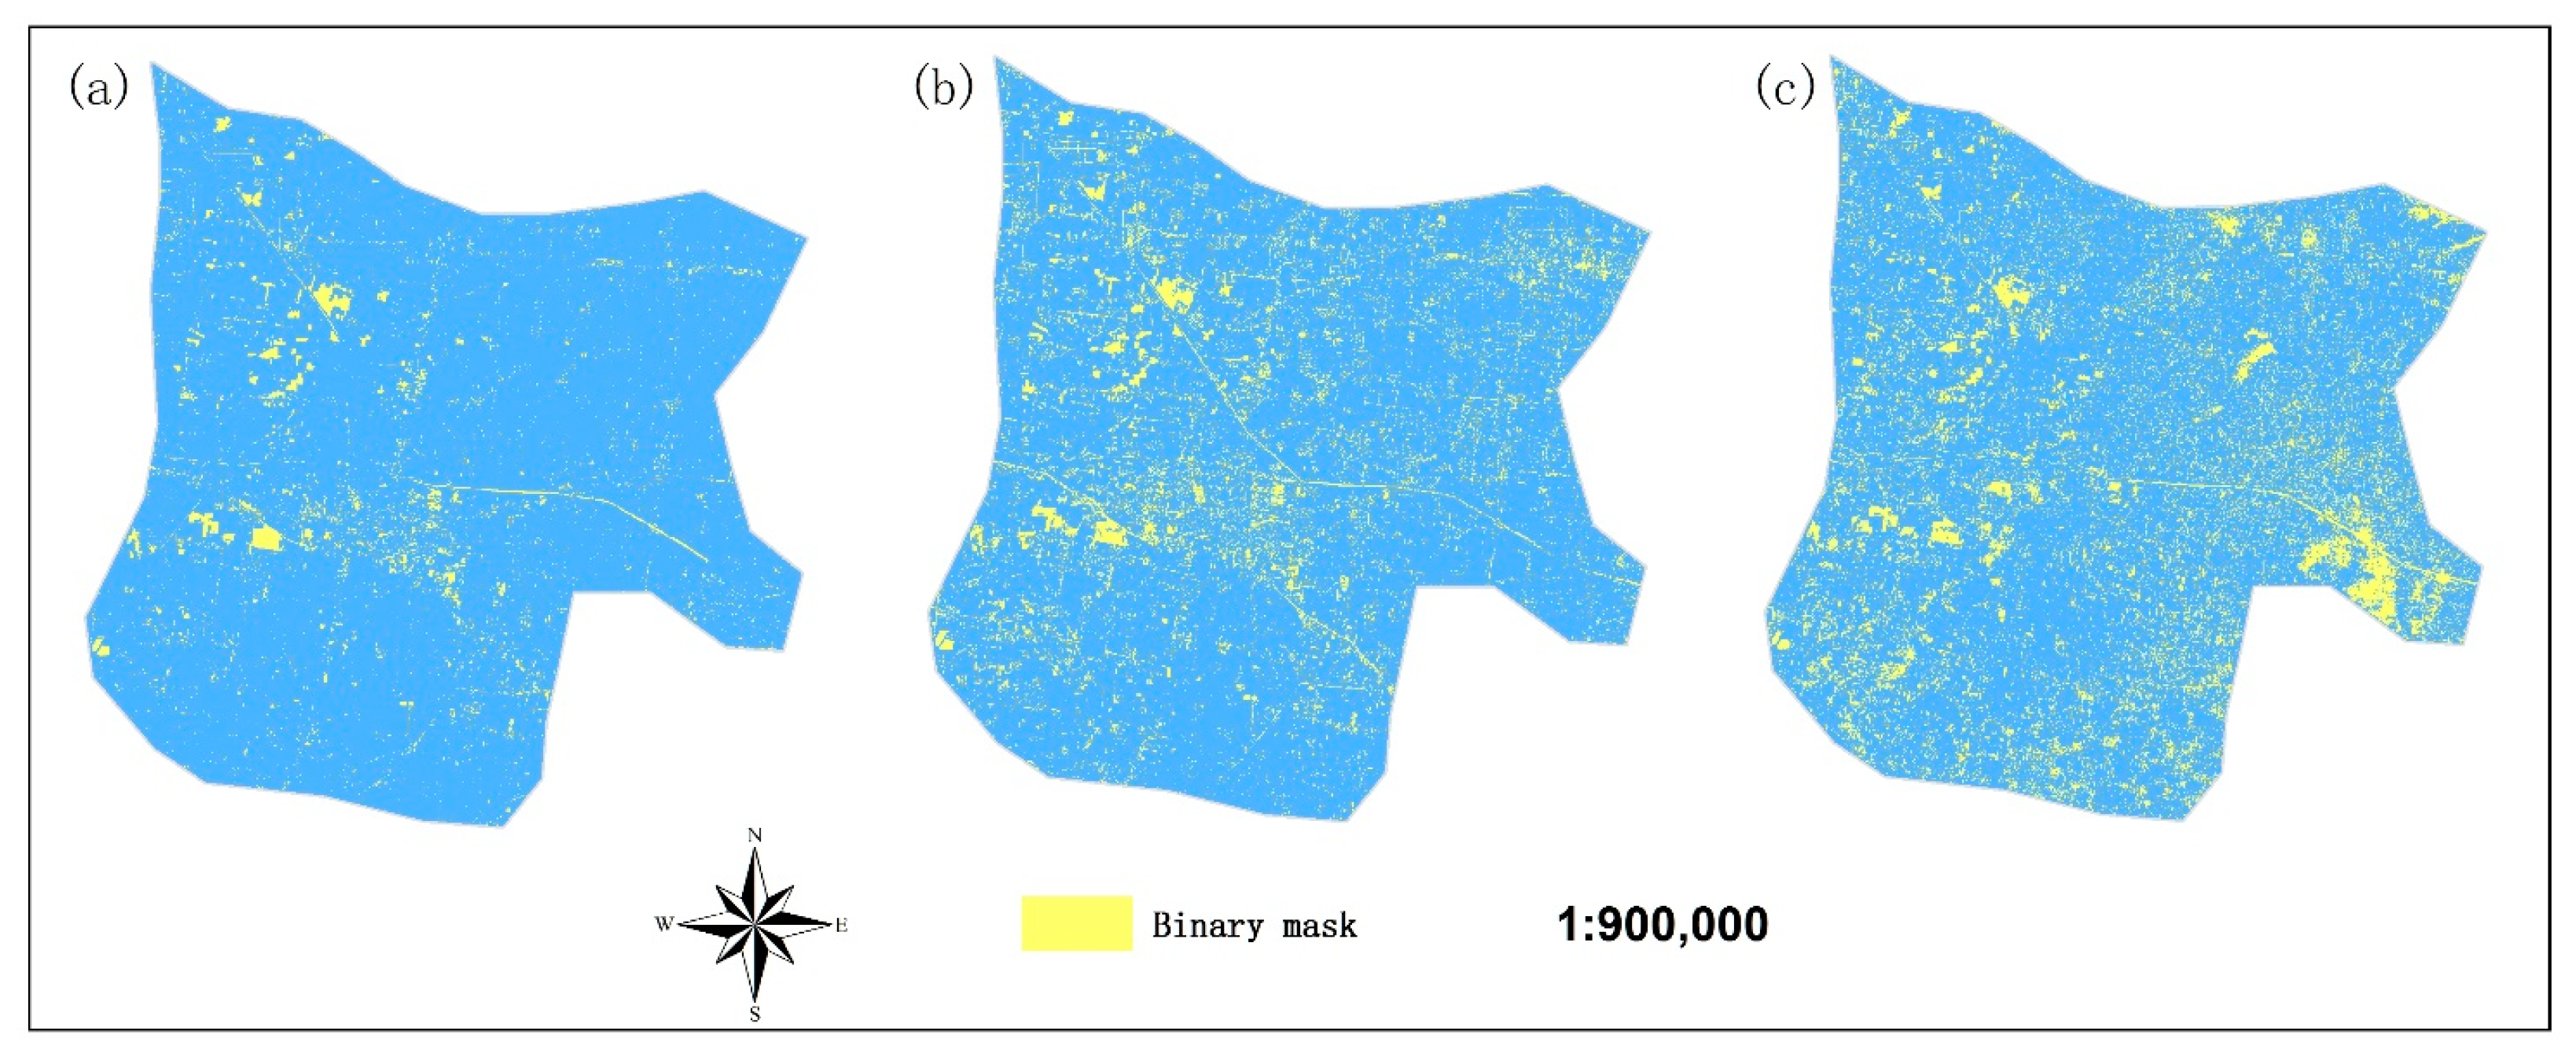
2.3.2. The NDVI Difference Binary Mask and Univariate Image Difference Binary Mask
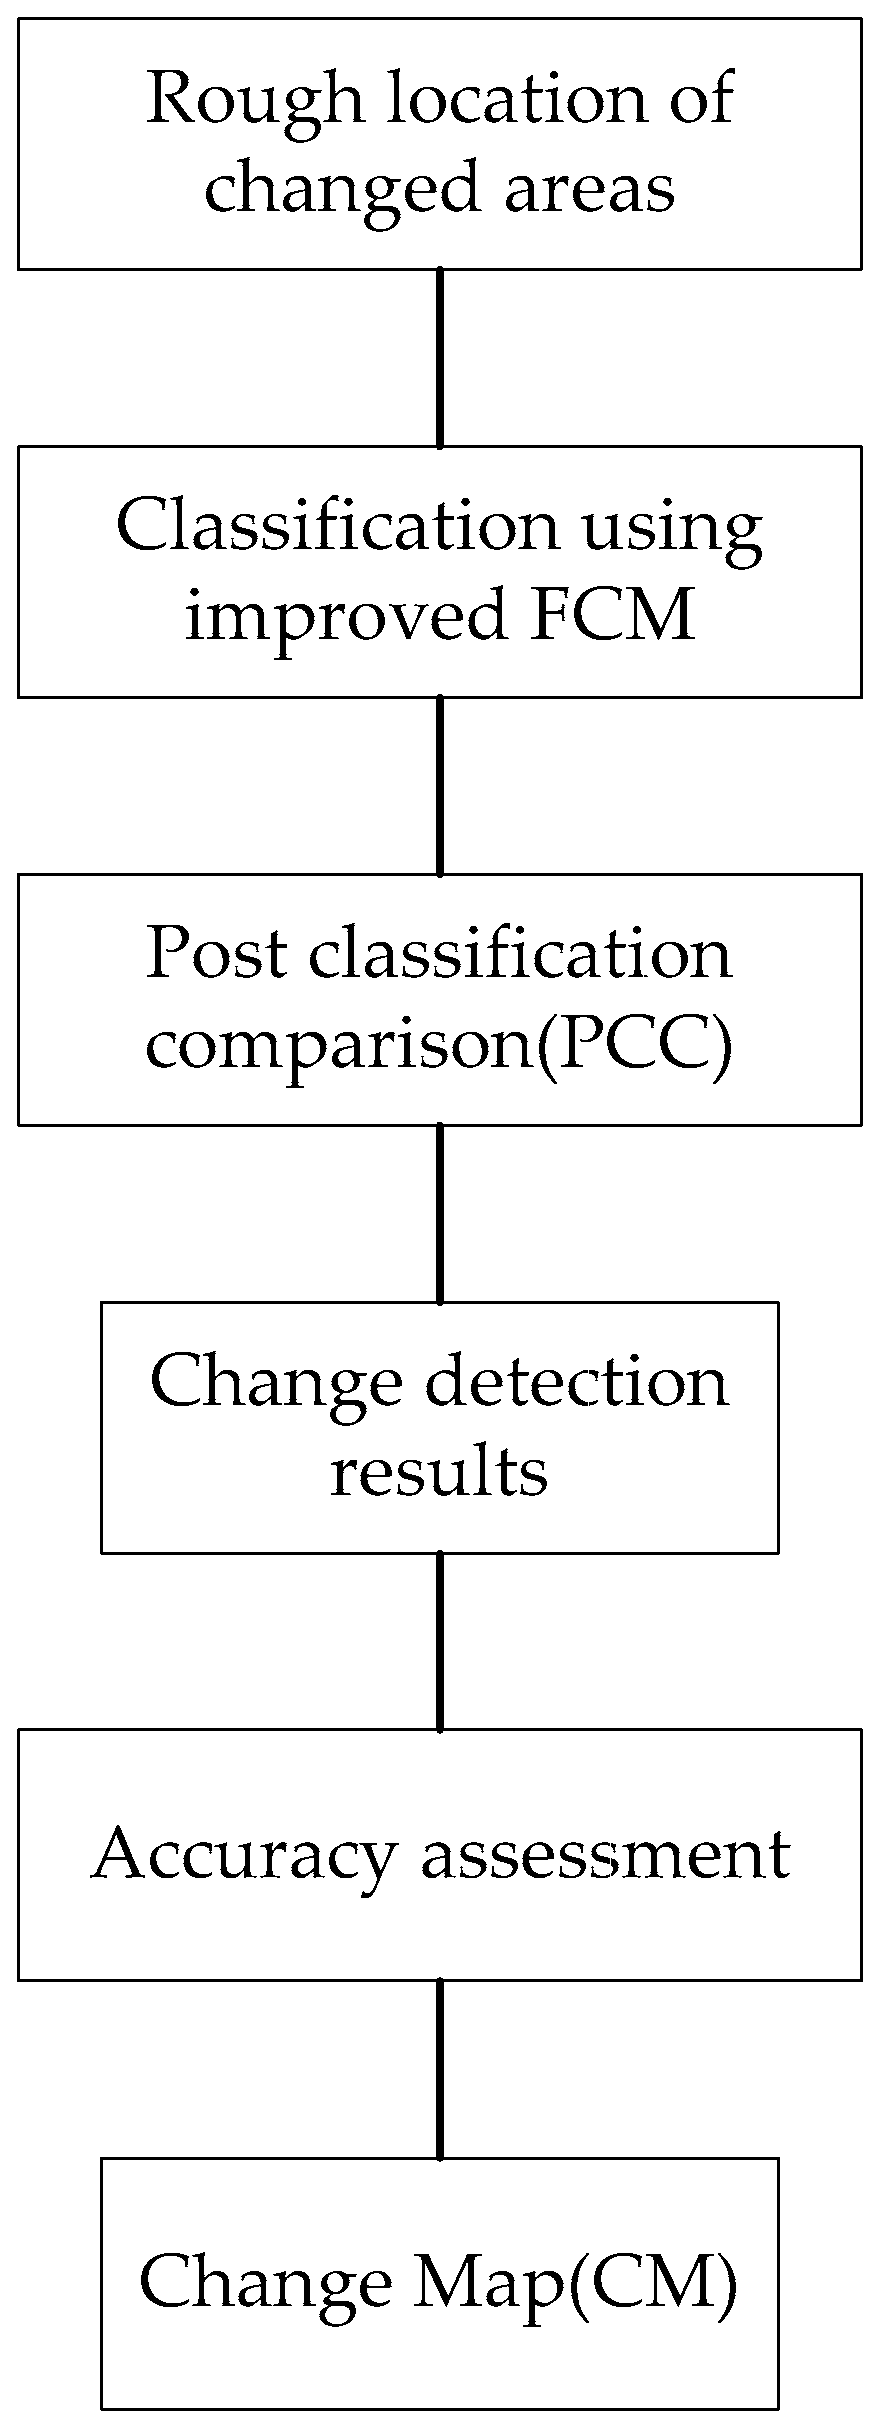
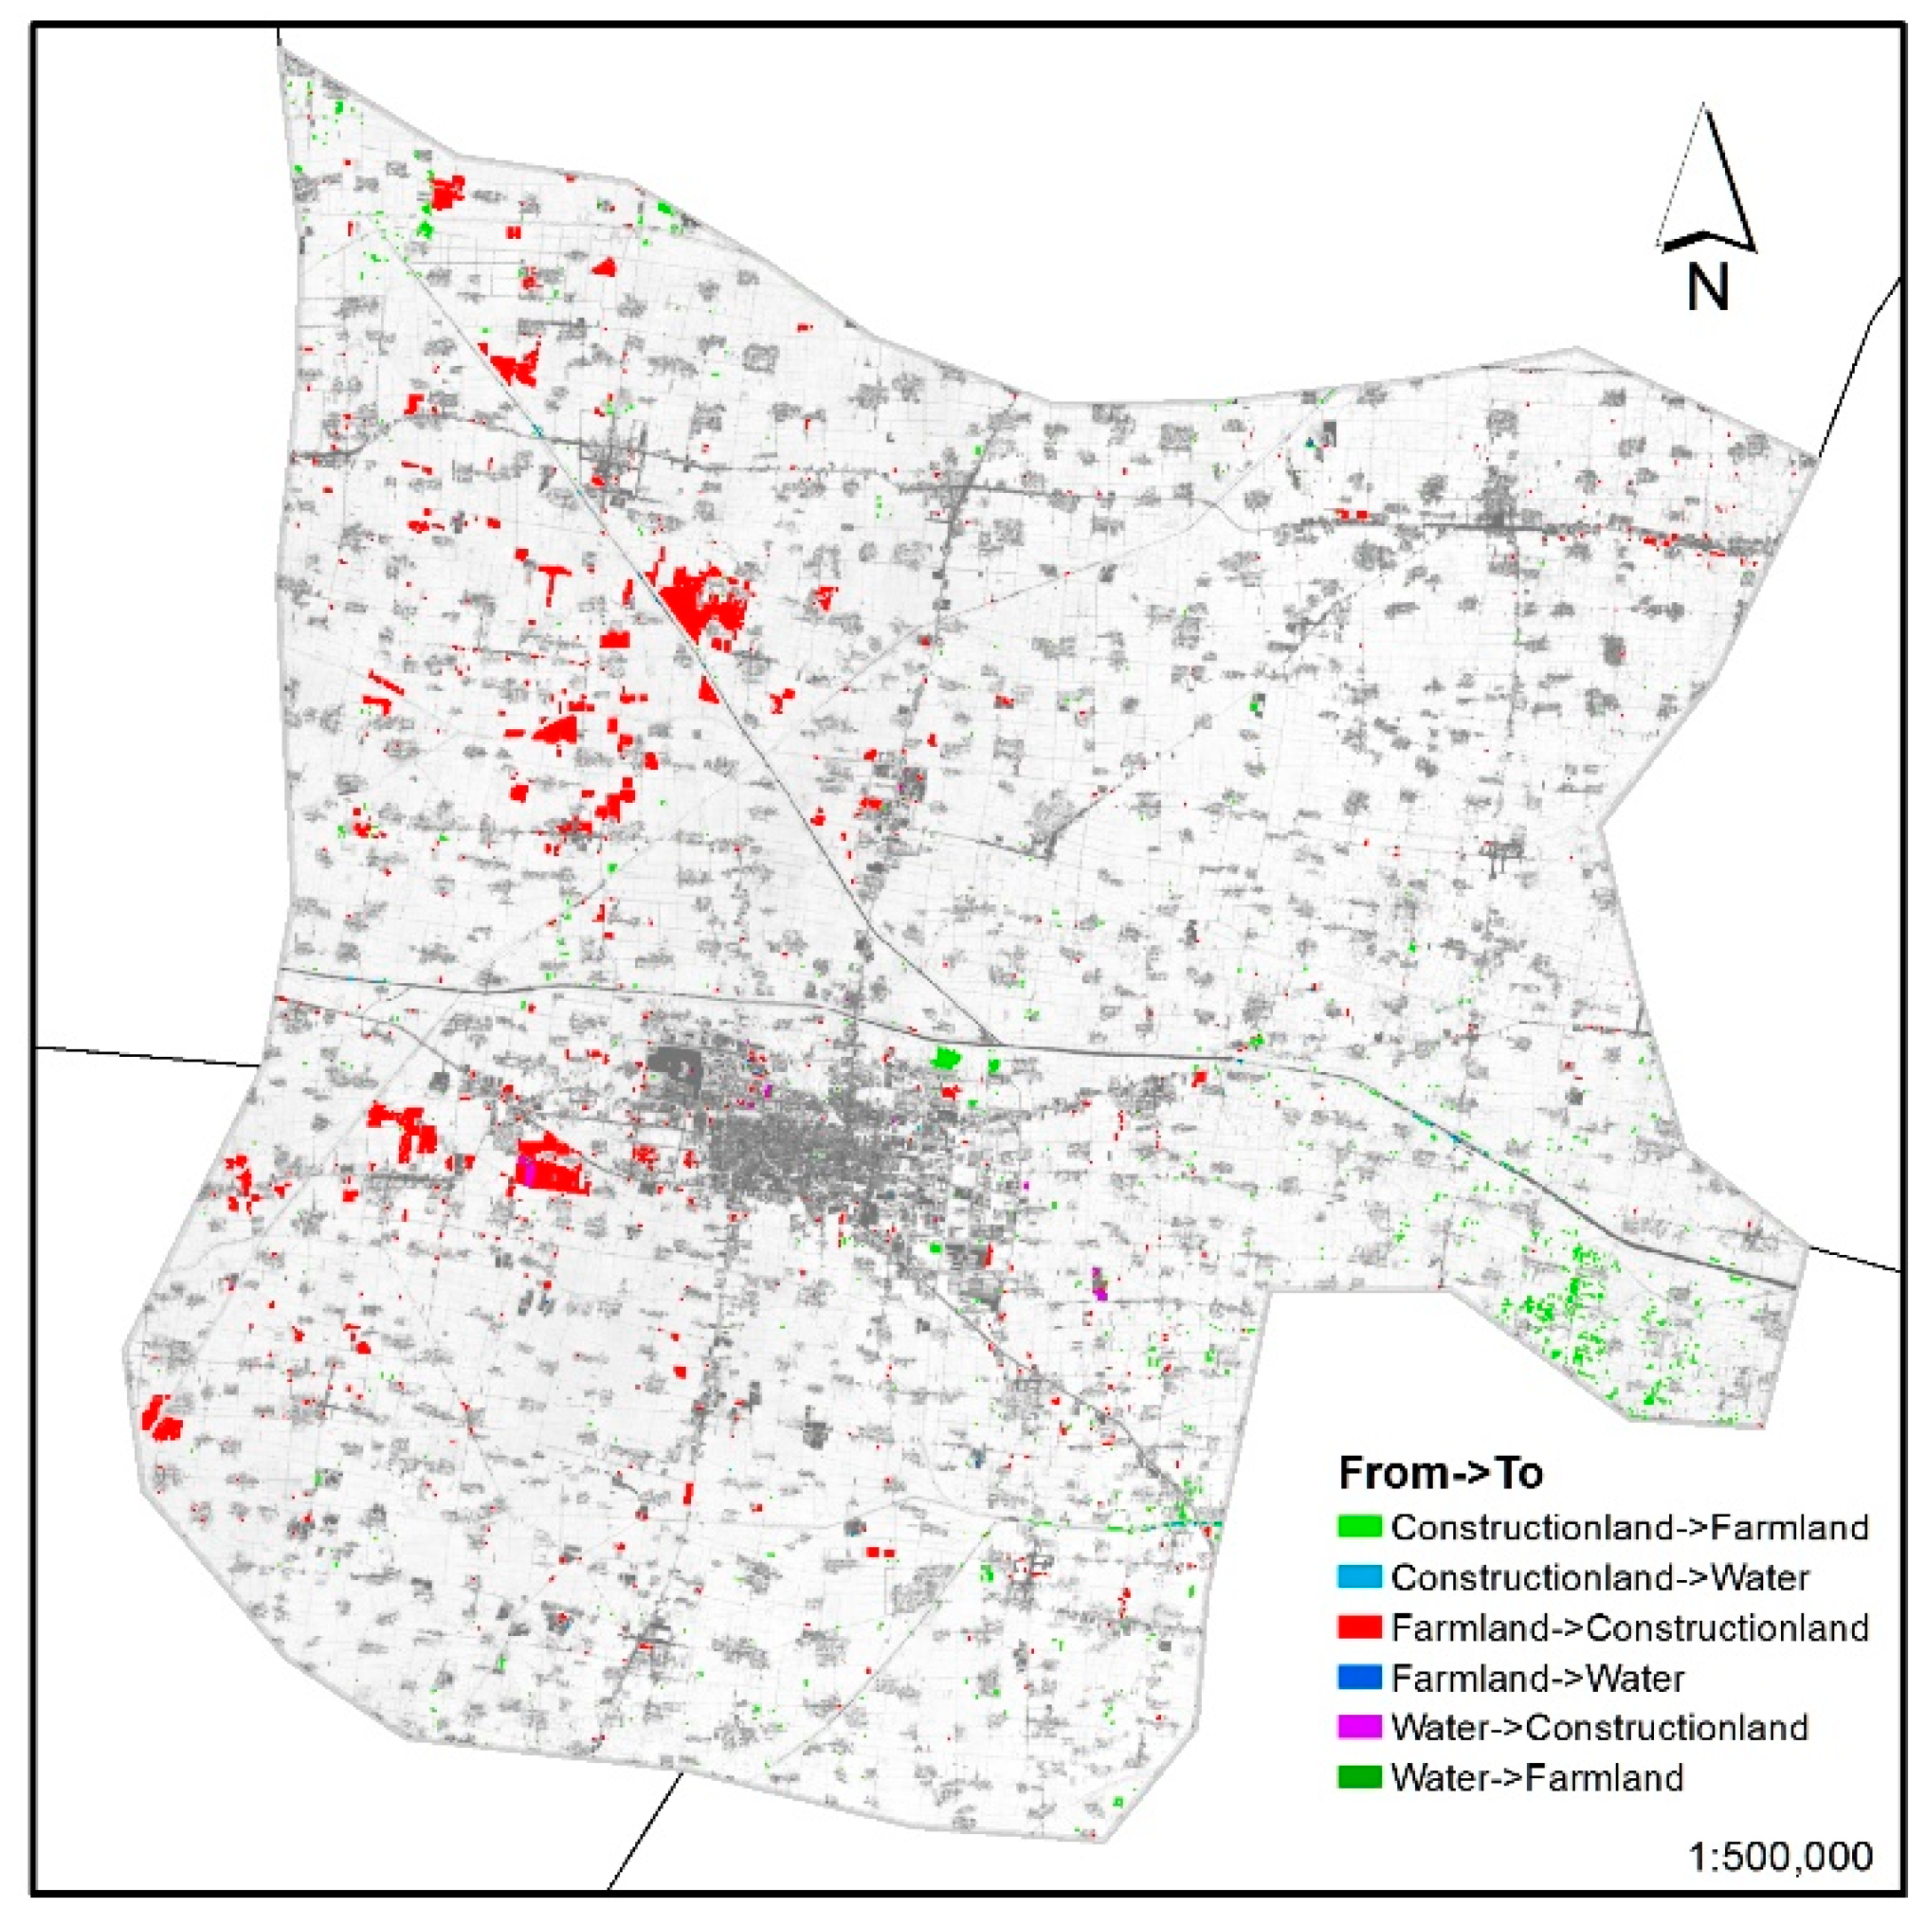
2.3.3. Changed Area Precise Location and Change Pattern Determination
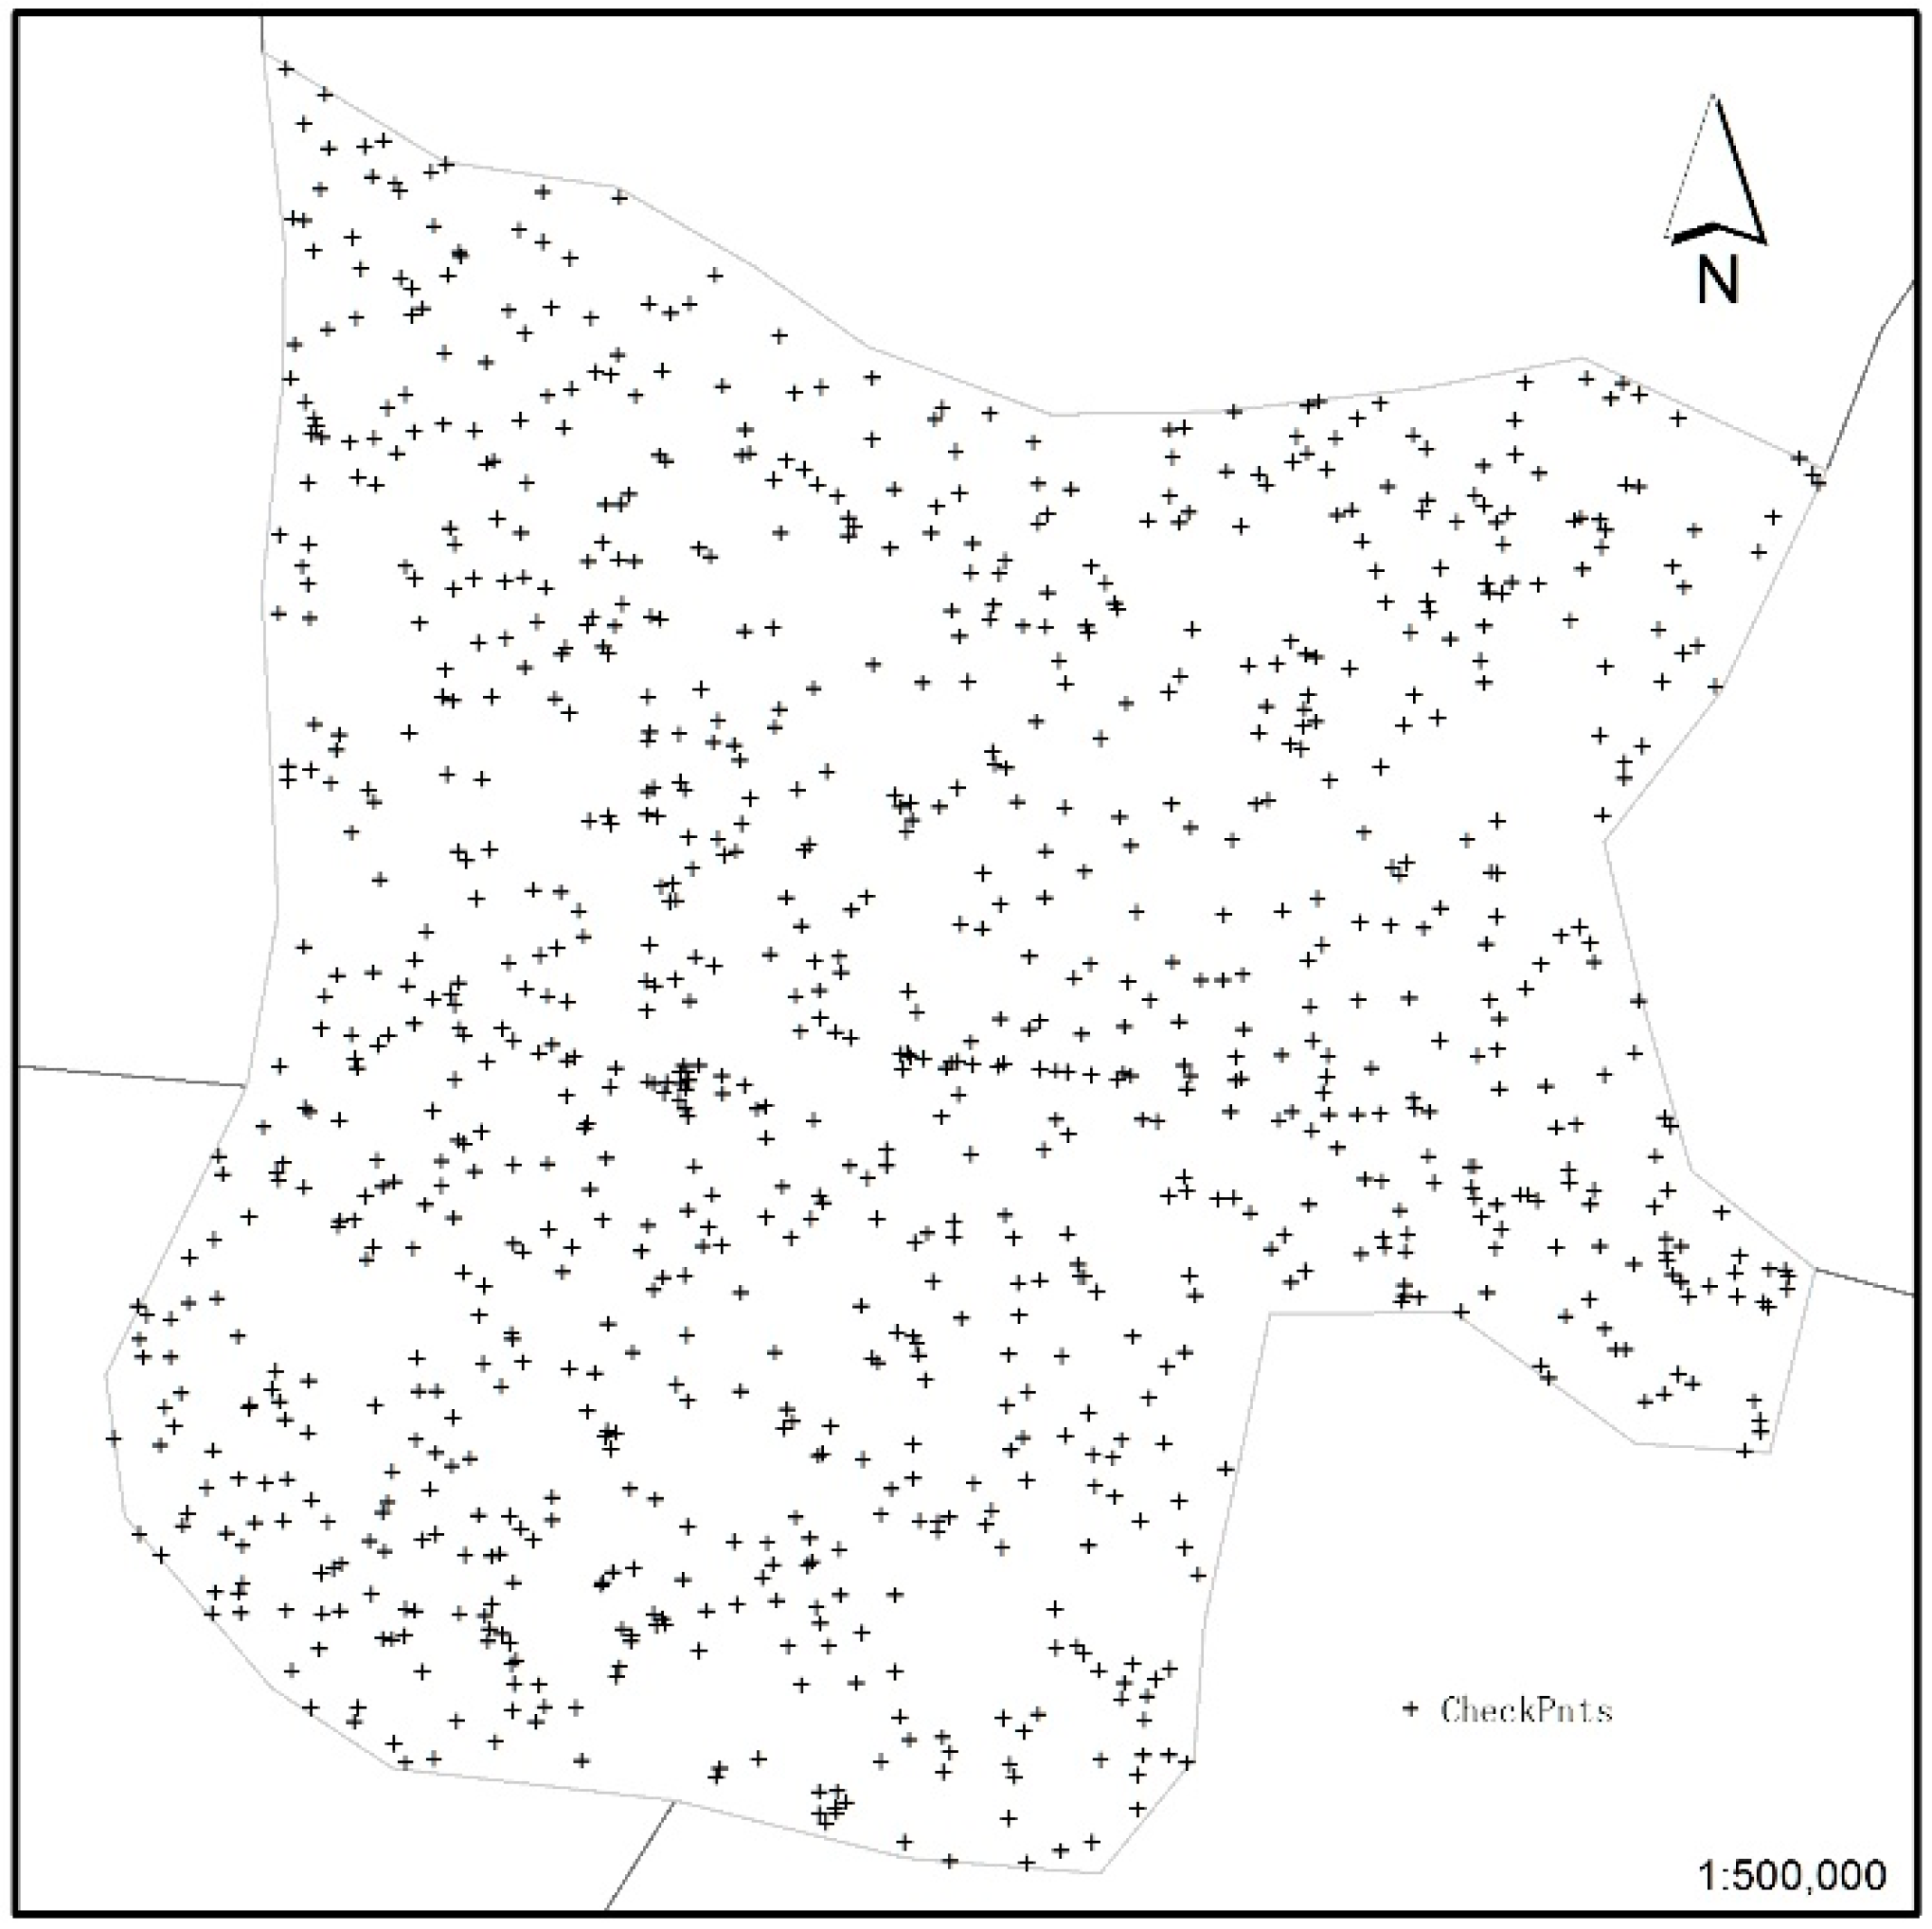
2.3.4. Accuracy Assessment
3. Results
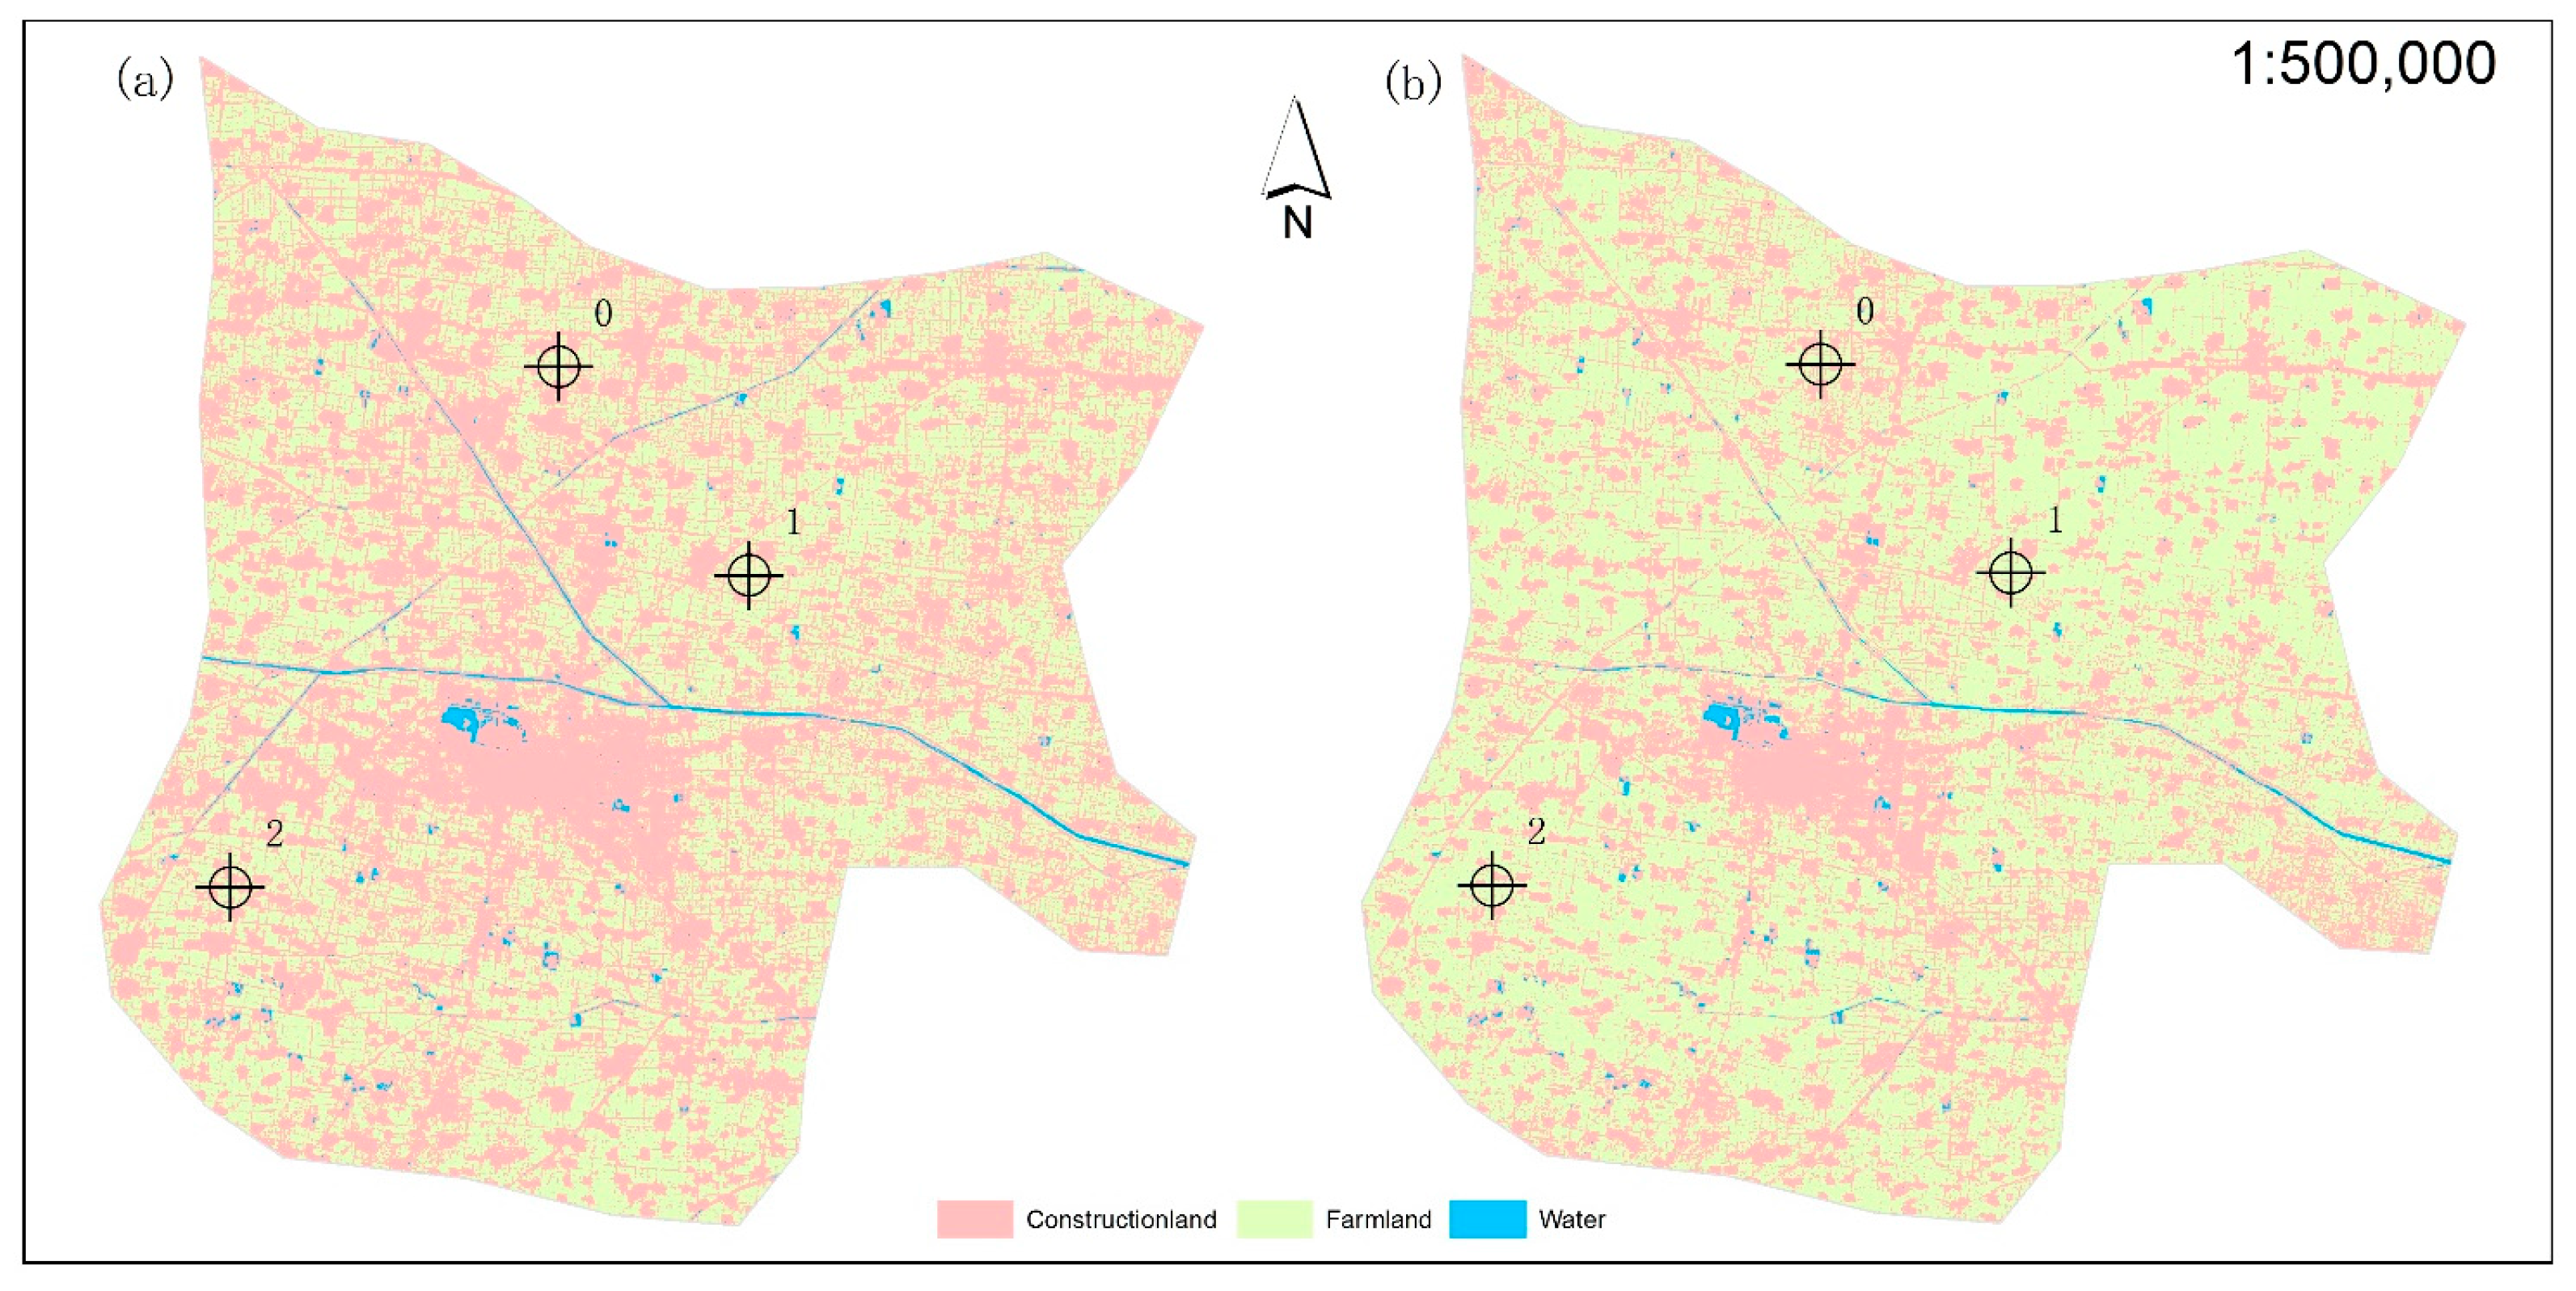
3.1. Assessment of the Improved/Standard Fuzzy c-Means Algorithm Based Classification
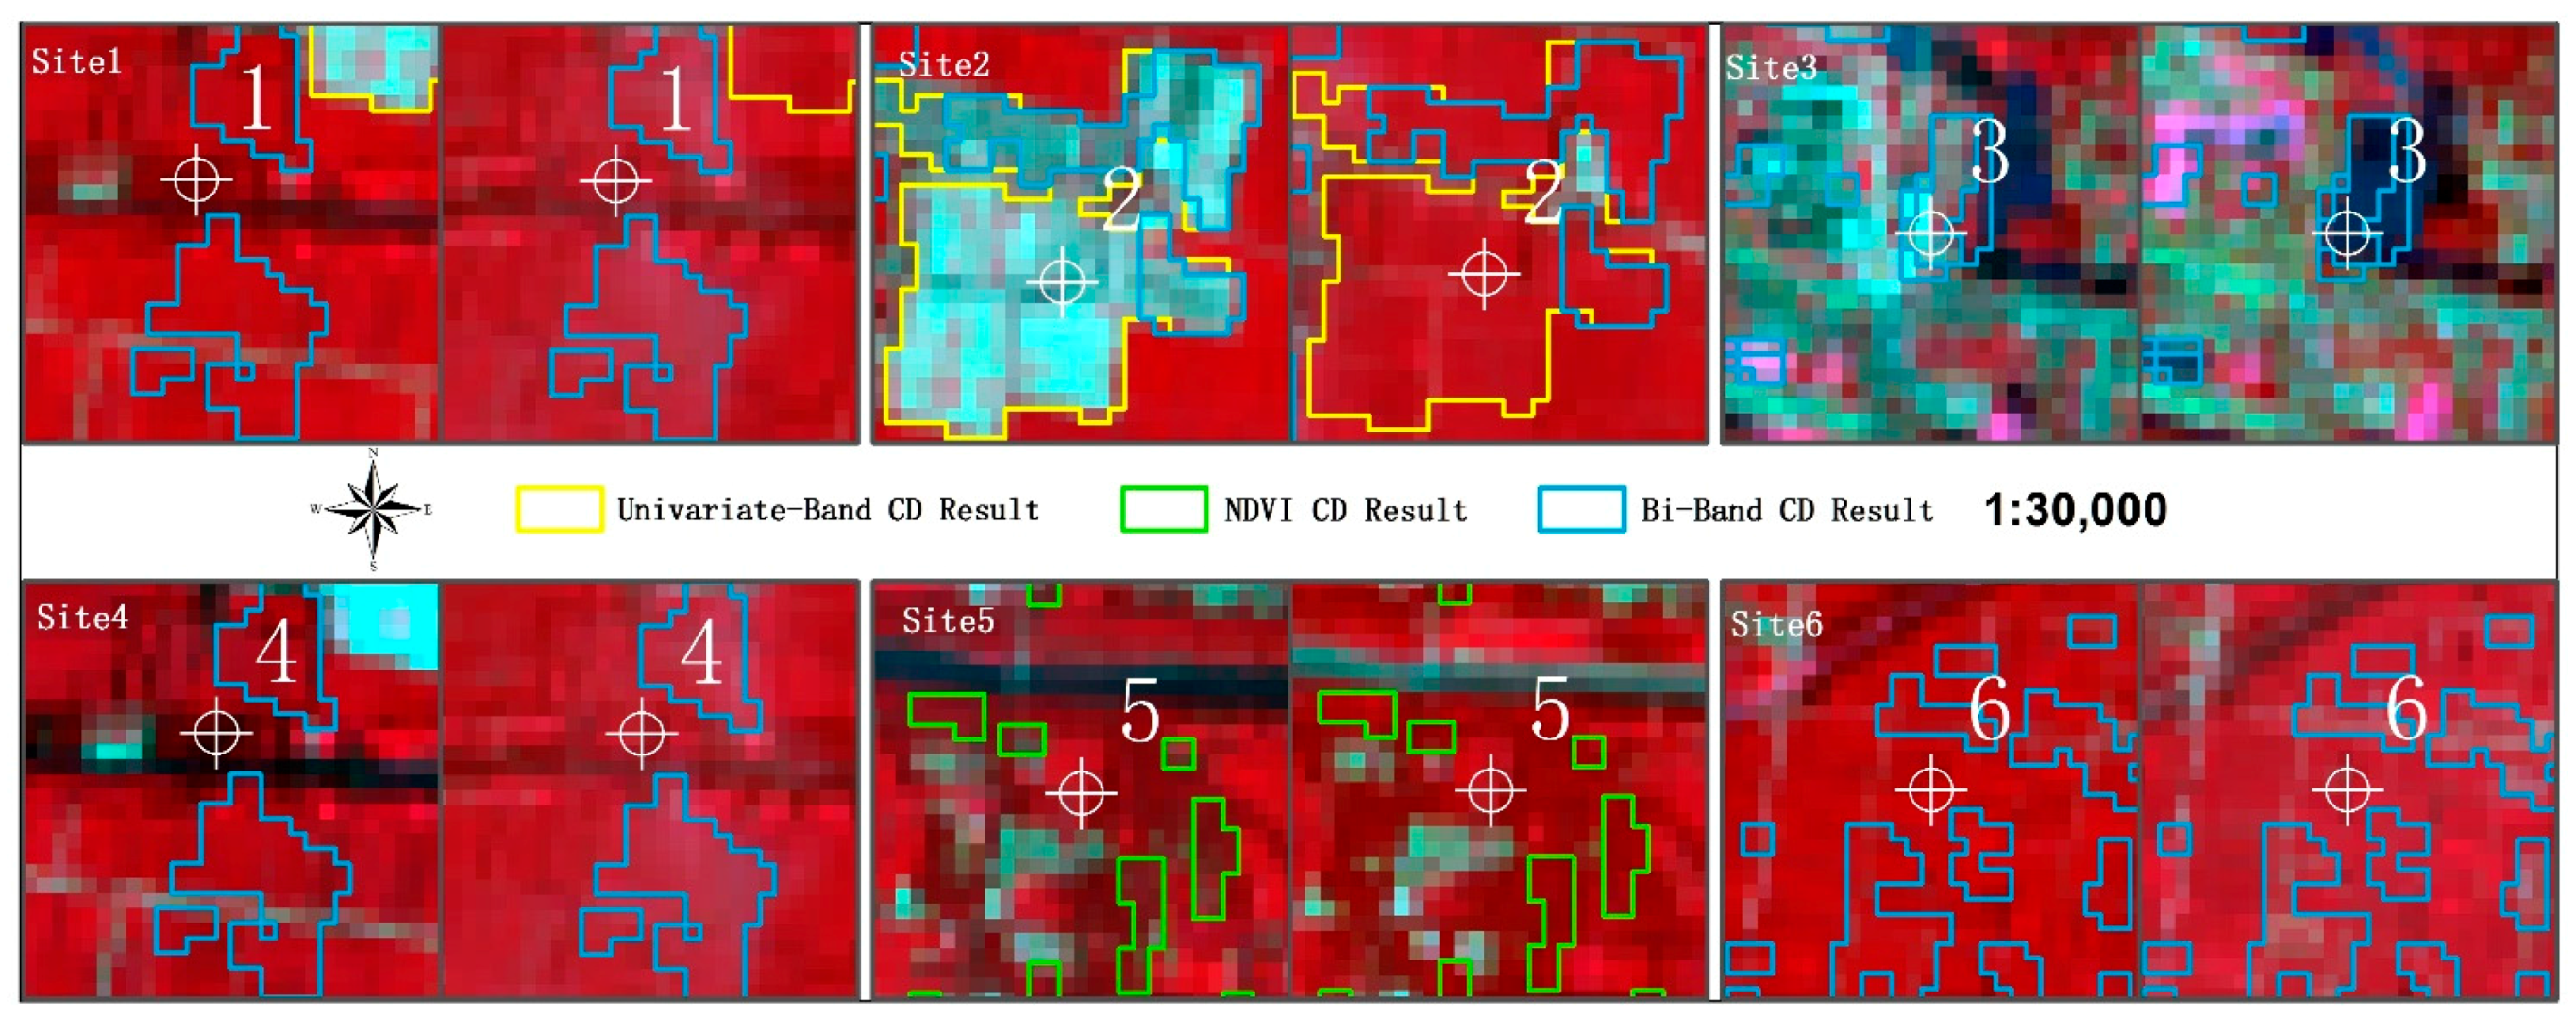
3.2. Assessment of Univariate Band/NDVI/Bi-Band Binary Masks Based Change Detection
4. Discussion
5. Conclusions
Acknowledgments
Author Contributions
Conflicts of Interest
References
- Houghton, R.A.; Hackler, J.L.; Lawrence, K.T. The U.S. Carbon Budget: Contributions from Land-Use Change. Science 1999, 285, 574. [Google Scholar] [CrossRef] [PubMed]
- Jin, S.; Yang, L.; Danielson, P.; Homer, C.; Fry, J.; Xian, G. A comprehensive change detection method for updating the National Land Cover Database to circa 2011. Remote Sens. Environ. 2013, 132, 159–175. [Google Scholar] [CrossRef]
- Peng, G.; Marceau, D.J.; Howarth, P.J. A comparison of spatial feature extraction algorithms for land-use classification with SPOT HRV data. Remote Sens. Environ. 1992, 40, 137–151. [Google Scholar]
- Liu, Y.; Huang, X.; Yang, H.; Zhong, T. Environmental effects of land-use/cover change caused by urbanization and policies in Southwest China Karst area—A case study of Guiyang. Habitat Int. 2014, 44, 339–348. [Google Scholar] [CrossRef]
- Zhang, M.; Huang, X.; Chuai, X.; Yang, H.; Lai, L.; Tan, J. Impact of land use type conversion on carbon storage in terrestrial ecosystems of China: A spatial-temporal perspective. Sci. Rep. 2015, 5, 10233. [Google Scholar] [CrossRef] [PubMed]
- Lai, L.; Huang, X.; Yang, H.; Chuai, X.; Zhang, M.; Zhong, T.; Chen, Z.; Chen, Y.; Wang, X.; Thompson, J.R. Carbon emissions from land-use change and management in China between 1990 and 2010. Sci. Adv. 2016, 2, e1601063. [Google Scholar] [CrossRef] [PubMed]
- Usman, M.; Liedl, R.; Shahid, M.A.; Abbas, A. Land use/land cover classification and its change detection using multi-temporal MODIS NDVI data. J. Geogr. Sci. 2015, 25, 1479–1506. [Google Scholar] [CrossRef]
- Xian, G.; Homer, C.; Fry, J. Updating the 2001 National Land Cover Database land cover classification to 2006 by using Landsat imagery change detection methods. Remote Sens. Environ. 2009, 113, 1133–1147. [Google Scholar] [CrossRef]
- Wang, A.S.; He, L. Practical split-window algorithm for retrieving land surface temperature over agricultural areas from ASTER data. J. Appl. Remote Sens. 2014, 8, 5230–5237. [Google Scholar] [CrossRef]
- Ward, M.H.; Nuckols, J.R.; Weigel, S.J.; Maxwell, S.K.; Cantor, K.P.; Miller, R.S. Identifying populations potentially exposed to agricultural pesticides using remote sensing and a Geographic Information System. Environ. Health Perspect. 2000, 108, 5–12. [Google Scholar] [CrossRef] [PubMed]
- Jat, M.K.; Garg, P.K.; Khare, D. Monitoring and modelling of urban sprawl using remote sensing and GIS techniques. Int. J. Appl. Earth Observ. Geoinf. 2008, 10, 26–43. [Google Scholar] [CrossRef]
- Rahman, A.; Aggarwal, S.P.; Netzband, M.; Fazal, S. Monitoring Urban Sprawl Using Remote Sensing and GIS Techniques of a Fast Growing Urban Centre, India. IEEE J. Sel. Top. Appl. Earth Observ. Remote Sens. 2011, 4, 56–64. [Google Scholar] [CrossRef]
- Hame, T.; Heiler, I.; San Miguel, J. An unsupervised change detection and recognition system for forestry. Int. J. Remote Sens. 1998, 19, 1079–1099. [Google Scholar] [CrossRef]
- Quegan, S.; Toan, T.L.; Yu, J.J.; Ribbes, F.; Floury, N. Multitemporal ERS SAR analysis applied to forest mapping. IEEE Trans. Geosci. Remote Sens. 2000, 38, 741–753. [Google Scholar] [CrossRef]
- Arieira, J.; Karssenberg, D.; Jong, S.M.D.; Addink, E.A.; Couto, E.G.; Cunha, C.N.D.; Ien, J.O.S. Integrating field sampling, geostatistics and remote sensing to map wetland vegetation in the Pantanal, Brazil. Biogeosciences 2011, 8, 667–686. [Google Scholar] [CrossRef]
- Schmid, T.; Koch, M.; Gumuzzio, J. Multisensor approach to determine changes of wetland characteristics in semiarid environments (central Spain). IEEE Trans. Geosci. Remote Sens. 2005, 43, 2516–2525. [Google Scholar] [CrossRef]
- Gitelson, A.; Garbuzov, G.; Szilagyi, F.; Mittenzwey, K.; Karnieli, A.; Kaiser, A. Quantitative remote sensing methods for real-time monitoring of inland waters quality. Int. J. Remote Sens. 2007, 14, 1269–1295. [Google Scholar] [CrossRef]
- Sawaya, K.E.; Olmanson, L.G.; Heinert, N.J.; Brezonik, P.L.; Bauer, M.E. Extending satellite remote sensing to local scales: Land and water resource monitoring using high-resolution imagery. Remote Sens. Environ. 2003, 88, 144–156. [Google Scholar] [CrossRef]
- Grover, K.; Quegan, S.; Costa Freitas, C.D. Quantitative estimation of tropical forest cover by SAR. IEEE Trans. Geosci. Remote Sens. 1999, 37, 479–490. [Google Scholar] [CrossRef]
- Shixin, W.; Yi, Z.; Chengjie, W.; Yun, S.; Fuli, Y. Risk Evaluation on the Secondary Disasters of Dammed Lakes using Remote Sensing Datasets, in the “Wenchuan Earthquake”. J. Remote Sens. 2008, 12, 900–907. [Google Scholar]
- Kennedy, R.E.; Townsend, P.A.; Gross, J.E.; Cohen, W.B.; Bolstad, P.; Wang, Y.Q.; Adams, P. Remote sensing change detection tools for natural resource managers: Understanding concepts and tradeoffs in the design of landscape monitoring projects. Remote Sens. Environ. 2009, 113, 1382–1396. [Google Scholar] [CrossRef]
- Hussain, M.; Chen, D.; Cheng, A.; Wei, H.; Stanley, D. Change detection from remotely sensed images: From pixel-based to object-based approaches. ISPRS J. Photogramm. Remote Sens. 2013, 80, 91–106. [Google Scholar] [CrossRef]
- Fan, Y. Studies on Change Detection Methods for Multitemporal Remote Sensing. Master’s Thesis, Xidian University, Xi’an, China, 2010. [Google Scholar]
- Singh, A. Review Article Digital change detection techniques using remotely-sensed data. Int. J. Remote Sens. 1989, 10, 989–1003. [Google Scholar] [CrossRef]
- Lu, D.; Mausel, P.; Brondízio, E.; Moran, E. Change detection techniques. Int. J. Remote Sens. 2004, 25, 2365–2401. [Google Scholar] [CrossRef]
- Bovolo, F.; Camps-Valls, G.; Bruzzone, L. A support vector domain method for change detection in multitemporal images. Pattern Recognit. Lett. 2010, 31, 1148–1154. [Google Scholar] [CrossRef]
- Ghosh, A.; Mishra, N.S.; Ghosh, S. Fuzzy clustering algorithms for unsupervised change detection in remote sensing images. Inf. Sci. 2011, 181, 699–715. [Google Scholar] [CrossRef]
- Ghosh, S.; Mishra, N.S.; Ghosh, A. Unsupervised Change Detection of Remotely Sensed Images Using Fuzzy Clustering. In Proceedings of the International Conference on Advances in Pattern Recognition, Kolkata, India, 4–6 February 2009; pp. 385–388.
- Mishra, N.S.; Ghosh, S.; Ghosh, A. Fuzzy clustering algorithms incorporating local information for change detection in remotely sensed images. Appl. Soft Comput. 2012, 12, 2683–2692. [Google Scholar] [CrossRef]
- Zanotta, D.C.; Haertel, V.; Zanotta, D.C.; Haertel, V. Gradual land cover change detection based on multitemporal fraction images. Pattern Recognit. 2012, 45, 2927–2937. [Google Scholar] [CrossRef]
- Chen, Y.; Cao, Z. An improved MRF-based change detection approach for multitemporal remote sensing imagery. Signal Process. 2013, 93, 163–175. [Google Scholar] [CrossRef]
- Coppin, P.R.; Bauer, M.E. Processing of multitemporal Landsat TM imagery to optimize extraction of forest cover change features. IEEE Trans. Geosci. Remote Sens. 1994, 32, 918–927. [Google Scholar] [CrossRef]
- Sanghamitra, B.; Sriparna, S. Unsupervised Classification: Similarity Measures, Classical and Metaheuristic Approaches, and Applications; Springer: New York, NY, USA, 2007; pp. 89–125. [Google Scholar]
- Shalaby, A.; Tateishi, R. Remote sensing and GIS for mapping and monitoring land cover and land-use changes in the Northwestern coastal zone of Egypt. Appl. Geogr. 2007, 27, 28–41. [Google Scholar] [CrossRef]
- Butt, A.; Shabbir, R.; Ahmad, S.S.; Aziz, N.; Nawaz, M.; Shah, M.T.A. Land cover classification and change detection analysis of rawal watershed using remote sensing data. J. Biodivers. Environ. Sci. 2015, 6, 2222–3045. [Google Scholar]
- El-Kawy, O.R.A.; Rød, J.K.; Ismail, H.A.; Suliman, A.S. Land use and land cover change detection in the western Nile delta of Egypt using remote sensing data. Appl. Geogr. 2011, 31, 483–494. [Google Scholar] [CrossRef]
- Munyati, C. Wetland change detection on the Kafue Flats, Zambia, by classification of a multitemporal remote sensing image dataset. Int. J. Remote Sens. 2000, 21, 1787–1806. [Google Scholar] [CrossRef]
- Im, J.; Jensen, J.R.; Tullis, J.A. Object-based change detection using correlation image analysis and image segmentation. Int. J. Remote Sens. 2008, 29, 399–423. [Google Scholar] [CrossRef]
- Fan, H.S.; Ai_Nai, M.A.; Jing, L.I. Case Study on Image Differencing Method for Land Use Change Detection Using Thematic Data in Renhe District of Panzhihua. J. Remote Sens. 2001, 1, 75–80. (In Chinese) [Google Scholar]
- Hoppner, F.; Klawonn, F. A New apProach to Fuzzy Partitioning. In Proceedings of the Ifsa World Congress and Nafips International Conference, Vancouver, BC, Canada, 25–28 July 2001; Volume 3, pp. 1419–1424.
- Kolen, J.F.; Hutcheson, T. Reducing the time complexity of the fuzzy c-means algorithm. IEEE Trans. Fuzzy Syst. 2002, 10, 263–267. [Google Scholar] [CrossRef]
- Yang, S.; Min, L.I.; Peng, Z.G.; Feng, C. A Novel Multi-band Remote Sensing Image Change Detection Algorithm. J. Image Graph. 2009, 14, 572–578. [Google Scholar]
- Zhu, L.; Chung, F.L.; Wang, S. Generalized fuzzy C-means clustering algorithm with improved fuzzy partitions. IEEE Trans. Syst. Man Cybern. Part B Cybern. A Publ. IEEE Syst. Man Cybern. Soc. 2009, 39, 578–591. [Google Scholar]
- Mas, J.F. Monitoring land-cover changes: A comparison of change detection techniques. Int. J. Remote Sens. 2010, 20, 139–152. [Google Scholar] [CrossRef]
- Vegaaraya, M. Applications of Hyper-Spectral and Radar Remote Sensing Analysis: A Case Study of Forest Landscapes in Costa Rica. Ph.D. Thesis, Georg-August University of Göottingen, Göttingen, Germany, November 2012. [Google Scholar]
- Bai, X.; Shi, P.; Liu, Y. Realizing China’s Urban dream. Nature 2014, 509, 158–160. [Google Scholar] [CrossRef] [PubMed]
- Yang, H. China must continue the momentum of green law. Nature 2014, 509, 535. [Google Scholar] [CrossRef] [PubMed]
- Yang, H. China’s soil plan needs strong support. Nature 2016, 536, 375. [Google Scholar] [CrossRef] [PubMed]
- Kim, D.-H.; Narashiman, R.; Sexton, J.O.; Huang, C. Methodology to select phenologically suitable Landsat scenes for forest change detection. In Proceedings of the Geoscience and Remote Sensing Symposium (IGARSS), Vancouver, BC, Canada, 24–29 July 2011; pp. 2613–2616.


| Land Cover Type | Built Land | Farmland | Water | Total | User’s Accuracy (%) | Commission Error (%) |
|---|---|---|---|---|---|---|
| Built land | 470 | 26 | 4 | 500 | 94.00 | 6.00 |
| Farmland | 13 | 387 | 0 | 400 | 96.75 | 3.25 |
| Water | 0 | 0 | 100 | 100 | 100.00 | 0.00 |
| Total | 483 | 413 | 104 | 1000 | ||
| Producer’s Accuracy (%) | 97.31 | 93.70 | 96.15 | |||
| Omission Error (%) | 2.69 | 6.30 | 3.85 | |||
| Overall Accuracy (%) | 95.70 | Kappa Coefficient | 0.93 |
| Land Cover Type | Built Land | Farmland | Water | Total | User’s Accuracy (%) | Commission Error (%) |
|---|---|---|---|---|---|---|
| Built land | 336 | 4 | 3 | 343 | 97.96 | 2.04 |
| Farmland | 149 | 408 | 0 | 557 | 73.25 | 26.75 |
| Water | 0 | 0 | 100 | 100 | 100.00 | 0.00 |
| Total | 485 | 412 | 103 | 1000 | ||
| Producer’s Accuracy (%) | 69.28 | 99.03 | 97.09 | |||
| Omission Error (%) | 30.72 | 0.97 | 2.91 | |||
| Overall Accuracy (%) | 84.40 | Kappa Coefficient | 0.74 |
| Image 2013 | Band 1 | Band 2 | Band 3 | Band 4 | Band 5 | Band 6 | Band 7 | |
|---|---|---|---|---|---|---|---|---|
| Image 2015 | ||||||||
| band 1 | 0.796 | |||||||
| band 2 | 0.814 | |||||||
| band 3 | 0.830 | |||||||
| band 4 | 0.848 | |||||||
| band 5 | 0.969 | |||||||
| band 6 | 0.882 | |||||||
| band 7 | 0.868 | |||||||
| Land Cover Change Types X → Y 1 | Overall Accuracy (%) | ||
|---|---|---|---|
| Band 3 Mask | NDVI Mask | Bi-Band Mask | |
| Built land → Farmland | 85.71 | 100.00 | 100.00 |
| Built land → Water | 45.45 | 63.64 | 72.73 |
| Farmland → Built land | 88.24 | 88.68 | 94.12 |
| Farmland → Water | 50.00 | 66.67 | 66.67 |
| Water → Built land | 0.00 | 72.73 | 100.00 |
| Water → Farmland | 66.67 | 100.00 | 100.00 |
| Average accuracy (%) | 56.01 | 81.95 | 88.92 |
| Land Cover Change Types | Area (km2) | ||
|---|---|---|---|
| Band 3 Mask | NDVI Mask | Bi-Band Mask | |
| Built land → Farmland | 2.07 | 1.94 | 5.45 |
| Built land → Water | 0.11 | 0.23 | 0.11 |
| Farmland → Built land | 15.51 | 19.01 | 13.89 |
| Farmland → Water | 0.01 | 0.06 | 0.14 |
| Water → Built land | 0.00 | 0.16 | 0.28 |
| Water → Farmland | 0.06 | 0.00 | 0.08 |
| Total area of detected | 17.76 | 21.42 | 19.94 |
| Built land Changed | 13.33 | 17.00 | 8.60 |
| Farmland Changed | −13.39 | −17.12 | −8.49 |
| Water Changed | 0.06 | 0.12 | −0.12 |
| Land Cover Change Types | Area (km2) |
|---|---|
| Built land → Farmland | 5.28 |
| Built land → Water | 0.11 |
| Farmland → Built land | 14.14 |
| Farmland → Water | 0.14 |
| Water → Built land | 0.28 |
| Water → Farmland | 0.08 |
| Total area of detected | 20.02 |
| Built land Changed | 9.03 |
| Farmland Changed | −8.92 |
| Water Changed | −0.12 |
© 2017 by the authors. Licensee MDPI, Basel, Switzerland. This article is an open access article distributed under the terms and conditions of the Creative Commons Attribution (CC BY) license ( http://creativecommons.org/licenses/by/4.0/).
Share and Cite
Li, X.; Zhao, S.; Yang, H.; Cong, D.; Zhang, Z. A Bi-Band Binary Mask Based Land-Use Change Detection Using Landsat 8 OLI Imagery. Sustainability 2017, 9, 479. https://doi.org/10.3390/su9030479
Li X, Zhao S, Yang H, Cong D, Zhang Z. A Bi-Band Binary Mask Based Land-Use Change Detection Using Landsat 8 OLI Imagery. Sustainability. 2017; 9(3):479. https://doi.org/10.3390/su9030479
Chicago/Turabian StyleLi, Xian, Shuhe Zhao, Hong Yang, Dianmin Cong, and Zhaohua Zhang. 2017. "A Bi-Band Binary Mask Based Land-Use Change Detection Using Landsat 8 OLI Imagery" Sustainability 9, no. 3: 479. https://doi.org/10.3390/su9030479
APA StyleLi, X., Zhao, S., Yang, H., Cong, D., & Zhang, Z. (2017). A Bi-Band Binary Mask Based Land-Use Change Detection Using Landsat 8 OLI Imagery. Sustainability, 9(3), 479. https://doi.org/10.3390/su9030479