Abstract
Global warming will increase the rate of chloride ingress and the rate of steel corrosion of concrete structures. Furthermore, in coastal (atmospheric marine) zones, sea level rise will reduce the distance of concrete structures from the coast and increase the surface chloride content. This study proposes a probabilistic model for analyzing the effects of global warming and sea level rise on the service life of coastal concrete structures. First, in the corrosion initiation stage, an improved chloride diffusion model is proposed to determine chloride concentration. The Monte Carlo method is employed to calculate the service life in the corrosion initiation stage; Second, in the corrosion propagation stage, a numerical model is proposed to calculate the rate of corrosion, probability of corrosion cracking, and service life. Third, overall service life is determined as the sum of service life in the corrosion initiation and corrosion propagation stages. After considering the impacts of global warming and sea level rise, the analysis results show that for concrete structures having a service life of 50 years, the service life decreases by about 5%.
1. Introduction
Chloride-induced corrosion causes various negative effects on coastal concrete structures, such as reductions in the cross sectional area of steel rebar, reductions in loading resistance, and concrete cover cracking. Furthermore, owing to global warming and sea level rise, the rates of chloride ingress and steel corrosion both increase, consequently resulting in a decrease in the service life of the concrete structures. Therefore, it is crucial for durability design of coastal concrete structures to consider the effects of both global warming and sea level rise [1].
Abundant studies have been conducted in regard to chloride ingress and steel corrosion of concrete structures. Martin-Perez et al. [2] and Tang [3] proposed a modified chloride diffusion equation and evaluated the service life of concrete structures considering various chloride binding isotherms. Conciatori et al. [4,5] proposed a numerical procedure for analyzing chloride ingress, water penetration, and carbonation of concrete structures under real climate conditions. However, the studies of Martin-Perez et al. [2], Tang [3], and Conciatori et al. [4,5] do not consider corrosion propagation after corrosion initiation due to chloride ingress. Chen and Mahadevan [6] proposed an integrated model assessing chloride ingress, corrosion initiation, and corrosion crack propagation of concrete structures. Vu and Stewart [7] analyzed the structural deterioration reliability of coastal concrete structures using a time-variant corrosion rate model and a time-variant load model. However, the respective studies conducted by Chen and Mahadevan [6] and Vu and Stewart [7] do not consider the effect of global warming. The effects of temperature rise on chloride diffusivity, rate of corrosion, and service life are ignored in their studies.
Regarding emission estimation methods for chloride-exposed concrete structures, some life cycle assessment (LCA) methods are proposed. Kim et al. [8] analyzed the life cycle CO2 (LCCO2) reduction performance for a chloride-exposed apartment house. LCCO2 emissions of different types of apartment houses were estimated. Demis et al. [9] made a computer-aided model of concrete service life under the chloride ingress condition. Economic costs and environmental costs from concrete production were calculated. Cusson et al. [10] evaluated the benefits of internal curing on the life cycle cost of chloride-exposed high performance concrete (HPC) bridge decks. Compared with normal concrete, internal cured HPC can allow a 63% reduction in life cycle cost. Kim et al. [11] evaluated CO2 emission of marine concrete used at construction sites. A CO2 emission reduction method at the construction stage was proposed. However, these LCA frameworks [8,9,10,11] do not consider the effect of global warming on service life.
In regard to chloride ingress and global warming, den Heede et al. [12] evaluated the chloride penetration service life of blended concrete by considering the effect of global warming on chloride diffusivity. Medeiros-Junior et al. [13] modeled the effect of climate changes (temperature and relative humidity change) on chloride diffusion coefficients. Reductions in service life for different situations were calculated. Bastidas-Arteaga et al. [14,15] modeled chloride-induced corrosion considering the coupling effect among chloride ingress, moisture diffusion, and heat transfer. Crack initiation and propagation for different global warming scenarios were calculated. Stewart et al. [16,17] proposed climate change adaptation strategies for corrosion control of concrete. That study revealed that increasing cover thickness, improving the quality of concrete, and using coatings and barriers can ameliorate the effects of climate change. However, the previous studies [12,13,14,15,16,17] mainly focused on the effect of global warming on chloride ingress. The effect of sea level rise on chloride ingress was not considered in the studies [2,3,4,5,6,7,8,9,10,11,12,13,14,15,16,17]. With the rise in sea level, the distance between the coast and structure decreases, the surface chloride concentration increases, and, consequently, the rate of chloride ingress and the rate of corrosion both increase as well.
Since the rise in sea level was not taken into account, previous models [2,3,4,5,6,7,8,9,10,11,12,13,14,15,16,17] underestimate the rates of chloride ingress and steel corrosion and overestimate the service life of coastal concrete. To address the weak points of previous studies [2,3,4,5,6,7,8,9,10,11,12,13,14,15,16,17], this study considers the effect of sea level rise on service life. A probabilistic model is proposed for evaluating the service life of coastal concrete structures resulting from global warming and sea level rise. The whole service life is determined as the sum of service life in the stages of corrosion initiation and corrosion propagation.
2. Methods and Model
Regarding the corrosion of concrete, the service life consists of the corrosion initiation stage and the corrosion propagation stage. The corrosion initiation stage is defined as the time at which the chloride content at the steel rebar surface reaches a critical value. The corrosion propagation stage is defined as the time at which the degree of steel corrosion exceeds critical steel corrosion at surface cracking of concrete. In addition, there are many uncertain factors in the chloride ingress and corrosion propagation processes. To consider these uncertainties, a probabilistic approach should be used for evaluating service life. Moreover, service life is influenced by changes in climate, such as global warming and sea level rise. Summarily, in this study we propose a probabilistic approach for evaluating the service life stages of chloride-exposed concrete considering global warming and sea level rise.
2.1. Corrosion Initiation Due to Chloride Ingress
The transport of chloride into concrete can take place by several different mechanisms, such as diffusion, convection, and permeation. The diffusion process occurs due to the chloride concentration gradient, convection is driven by the moisture gradient in concrete, and permeation occurs due to hydrostatic pressure [4,5]. Kwon et al. [18] and the Life365 software [19] stated that while the ingress of chloride into concrete involved various physical and chemical processes, it is generally accepted that the diffusion of chloride ions is the main mechanism of chloride ingress beyond the very near-surface zone of concrete. Based on Fick’s second law, one-dimensional chloride diffusion into concrete can be described as follows [18,19]:
where is chloride content at the distance, , and time, , and is the time dependent chloride diffusion coefficient. relates to concrete mixing proportions, environmental conditions, chloride binding condition, and curing ages. Owing to further hydration of binders and the enhanced binding capacity of chloride during the chloride ingress period, decreases with time. can be determined as a power law function of time as follows [19]:
where is the chloride diffusion coefficient at reference time, ( = 28 days), and is the diffusion decay index. decreases with the water-to-binder ratio and can be determined as follows [19]:
where W/B is the water-to-binder ratio. The Life 365 software [19] assumes that fly ash or slag does not affect the early-age chloride diffusion coefficient, .
The diffusion decay index, , relates to further hydration and enhanced chloride binding capacity during exposure periods. The diffusion decay index, , can be determined as follows [19]:
where %FA and %SG are the levels of fly ash and slag in the mixtures, respectively. As shown in Equation (4), the Life365 software [19] considers fly ash and slag impact on the rate of reduction in diffusivity. With increasing slag or fly ash replacement levels, the value of increases, and more reduction in chloride diffusivity occurs.
Assuming that the initial chloride content is zero and chloride content at the surface, , is constant, Equations (1) and (2) can be expressed as follows:
where is the error function, is the averaged diffusion coefficient and can be calculated as follows [18]:
where denotes the time when chloride diffusion coefficient is assumed to be constant ( = 30 years) [18].
There are different exposure conditions in marine environments, such as submerged zone, tidal zone, splash zone, and atmospheric zone. The scope of this study is a coastal concrete structure in the atmospheric zone. Regarding the atmospheric marine zone, the chloride content on the surface relates to the distance from the coast. Vu and Stewart [7] proposed that the surface chloride content, (kg/m3), can be determined as a step functions as follows:
where (km) is distance from the coast.
The corrosion initiation time denotes the time at which chloride content on the surface of steel rebar reaches a critical value. As proposed by Kwon et al. [18] and the Life365 software [19], chloride content of concrete (1.2 kg/m3), is used as the threshold chloride content (). The carbon steel reinforcement is considered in the calculations.
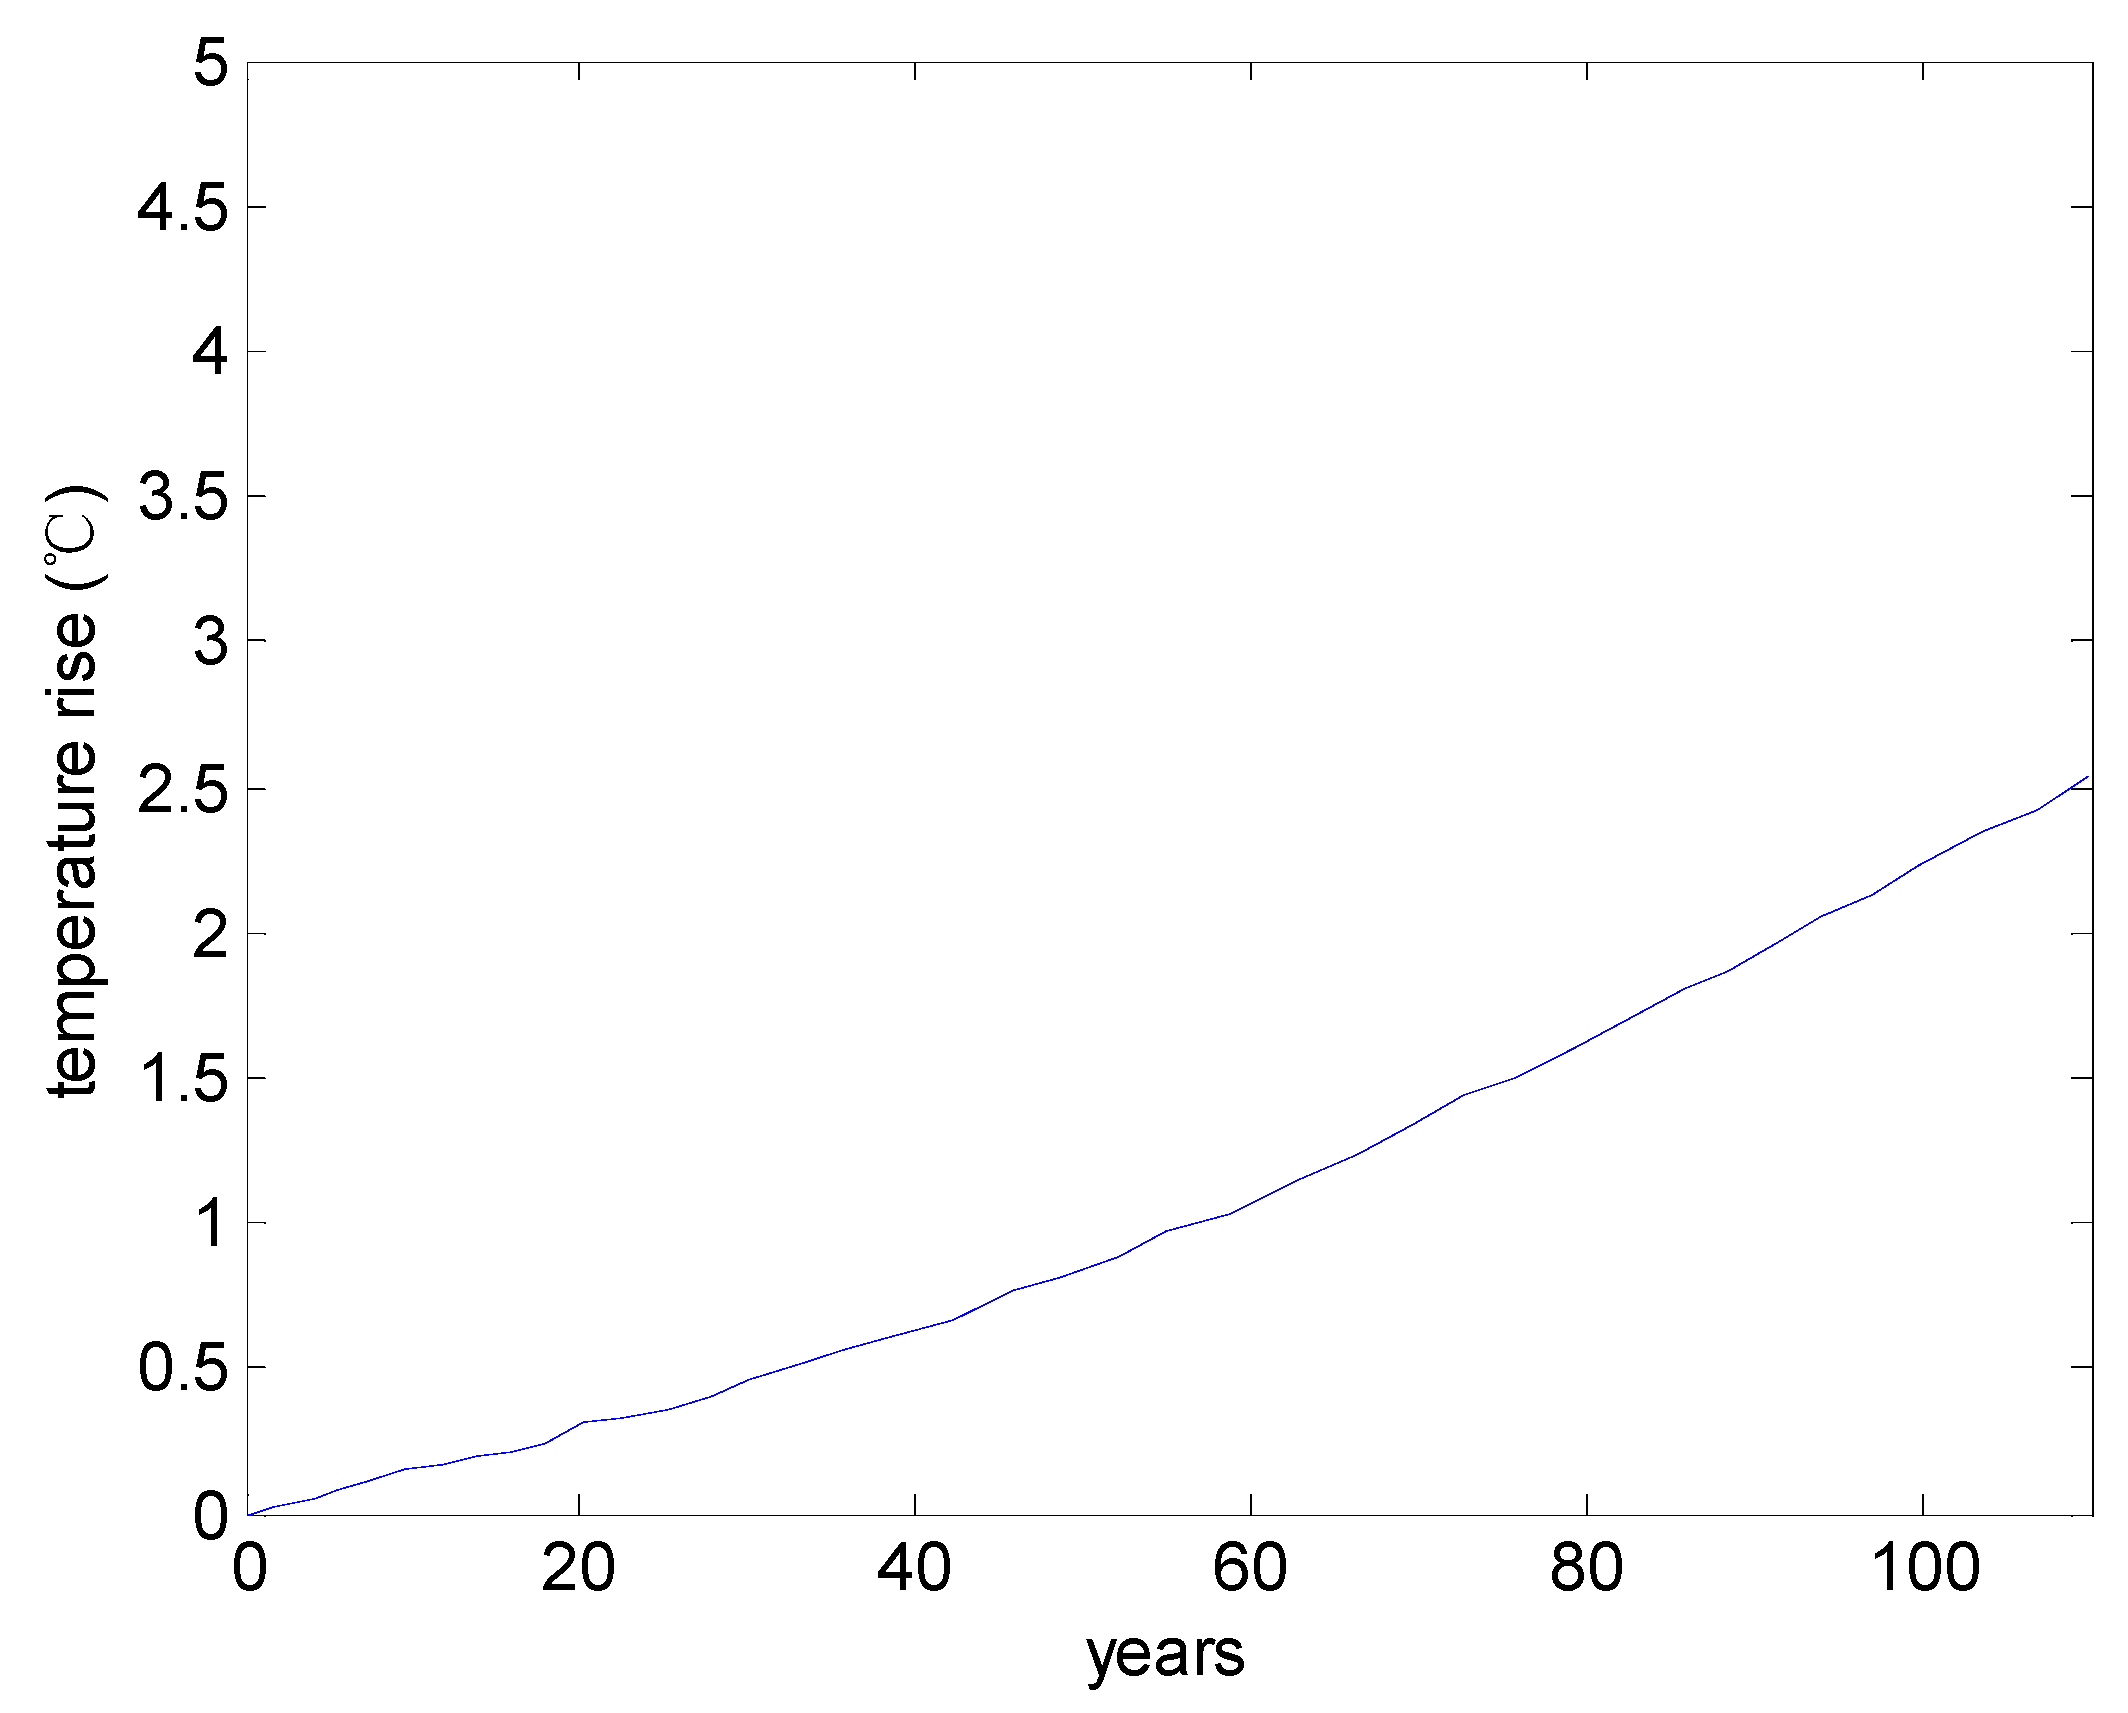
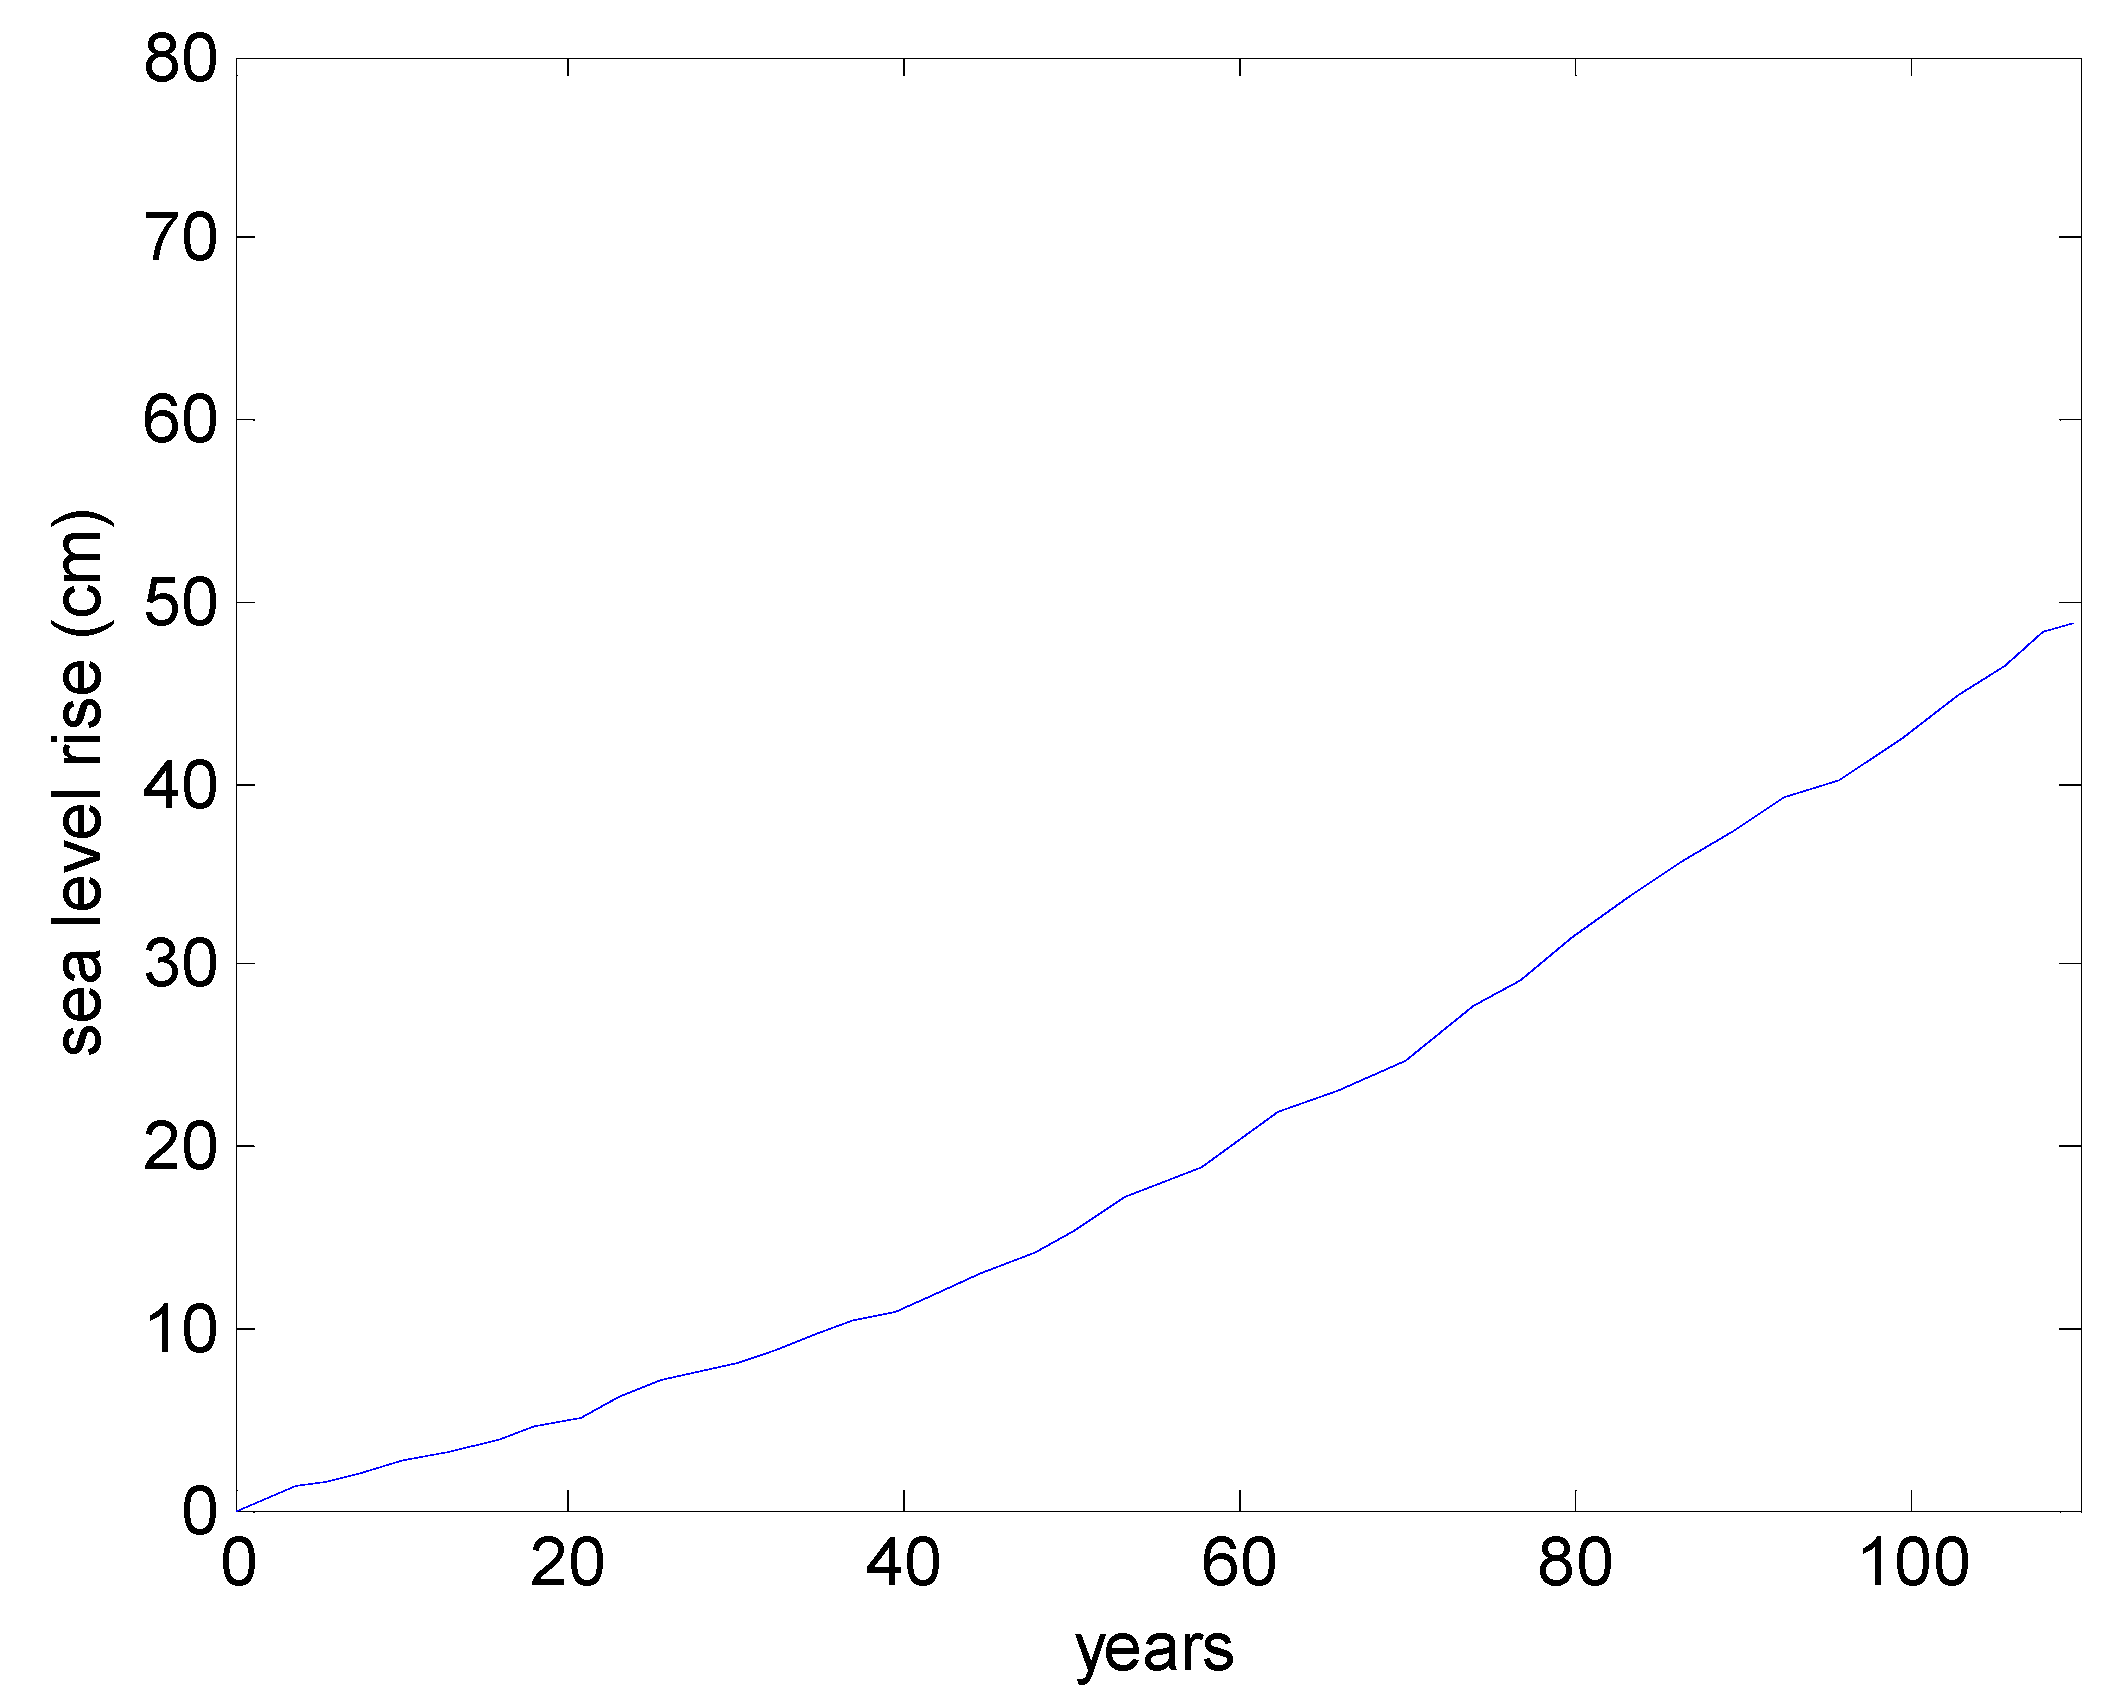
Based on IS92a global climate change scenario [20], in the 21st century, the environmental temperature rises about 2.5 °C due to global warming (shown in Figure 1), and the sea level rises about 49 cm in the next 100 years (shown in Figure 2).
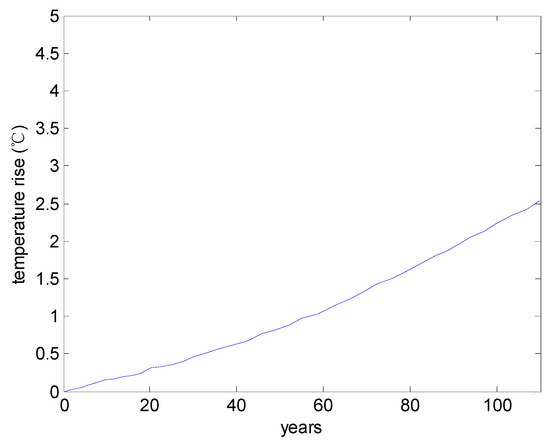
Figure 1.
Global warming.
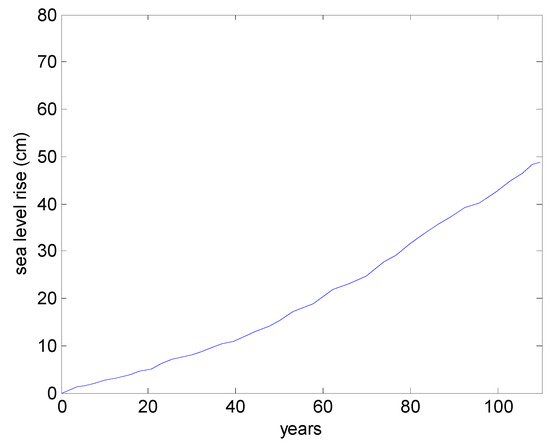
Figure 2.
Sea level rise.
Life365 [19] proposed that the dependence of chloride diffusivity on temperature can be described by using Arrhenius’s Law as follows:
where (m2/s) is the chloride diffusivity at reference temperature, (1/K) is the activity energy of chloride diffusion ( = 4300 [18,19]), (298 K) is the reference temperature, and (K) is the environmental temperature. In this study, the average temperature over the time period is used to consider the global warming effect.
When the sea level rises, it will have two effects. First, some of the lower land and river banks will be submerged. Therefore, the coastline will erode inland. Second, as the sea level rises, the ocean’s waves will cause additional erosion of the coast. The eroded coastline can be determined using Bruun’s rule [21,22] as follows:
where (m) is the eroded distance of the coastline, (m) is the height of the beach, (m) is the depth of sea water, (m) is the lateral distance from the beach to the offshore with depth , and (m) is the sea level rise. Generally, can be replaced by (where is the average slope near the beach). The average slope generally ranges between 1/50 and 1/150 [21,22]. When the average slope is 1/100, Bruun’s rule can be simplified as follows:
The time-average surface chloride concentration can be determined as follows:
The details about calculating the time-averaged surface chloride content are shown as follows: First, by using the climate change scenario about sea level rise (Figure 2), the time-dependent sea level rise can be determined. Then, by using Bruun’s rule (Equation (13)), eroded distance of the coastline can be calculated. Finally, by using Equations (8)–(10), the surface chloride content, Cs(t), can be determined as a function of distance from the coast. As shown in Equations (8)–(10), as the surface chloride concentration increases, the distance between the coast and the concrete structure decreases.
In this study, the year 2000 is the original point of time period. This original point of time can be taken into account by using Equation (14). In the numerator of Equation (14), the lower bound of the integral represents this original point of time period; therefore, a value of “0” refers to the year 2000. In the denominator, the value of t refers to the time period (t − 0 = t). Equation (14) can, therefore, be changed to allow for a different original time condition. For example, when the original time is changed to the year 2010, the lower bound of the integral in the numerator should be revised to “10”, and the denominator part should be revised to t − 10.
In the corrosion initiation stage, the durability failure criterion is defined as the point at which the chloride concentration exceeds the threshold chloride concentration. The chloride concentration prediction involves various uncertainties, such as statistical uncertainty, physical uncertainty, decision uncertainty, and model uncertainty [18]. Considering the uncertainties of the chloride concentration prediction and by using the Monte Carlo simulation method [18], the durability failure probability in the corrosion initiation stage can be determined as follows:
where is the chloride concentration at the cover depth () of concrete, refers to the durability failure criteria, and is the failure probability of the chloride ingress durability. The function, , refers to the number of chloride ingress durability failures out of a total number of trials. In the corrosion initiation stage, the service life of concrete is the time of failure probability to reach 10% [18].
2.2. Corrosion Propagation Stage
Owing to global warming, the environmental temperature increases with time and the corrosion current increases correspondingly. The dependence of corrosion current on temperature (°C) is shown as follows [16]:
where (μA/cm2) is the corrosion current density at 20 °C (shown in Table 1); = 0.025 if < 20 °C and = 0.073 if > 20 °C [16]. For chloride-induced corrosion, after the initiation of corrosion, chloride concentration at the steel rebar position continuously increases due to on-going chloride ingress. The corrosion rate shown in Table 1 does not consider the effect of chloride concentration on corrosion current. Jung et al. [23] measured the corrosion rate of steel rebar in concrete with different levels of chloride ion concentration (0.0%–12.8% by % weight of cement). Jung et al. [23] found that the corrosion rate of steel rebar increases with chloride concentration, and the revised corrosion rate considering chloride concentration can be empirically written as is × (2C/Cin − 1).

Table 1.
Chloride-induced corrosion rates () for various exposures [16].
By using Faraday’s law and the corrosion current density, the corroded depth of steel rebar can be determined as follows [24,25]:
where (m) is the corroded depth of steel rebar, (s) is the corroded time, (g/mol) denotes the atomic weight of iron corroded, (C/mol) denotes Faraday’s constant, and (kg/m3) denotes the density of iron.
The corrosion of steel rebar is not uniform and generally occurs on the side of chloride ingress. On the backside of chloride ingress, the corrosion of steel rebar is marginal [26,27]. Considering the non-uniform corrosion of steel rebar, the degree of corrosion can be calculated as follows [24]
where denotes the degree of corrosion, and denotes the radius of the steel rebar.
Once steel corrosion begins, the corrosion products will expand freely until the porous zone is filled, after which the expansion pressure will begin to develop around the surrounding concrete. With the progress of corrosion, the expansion pressure will cause tensile stresses and strains in the adjacent concrete. When the critical steel corrosion is reached, surface cracking of the concrete cover begins to occur. Wei et al. [25] conducted a numerical analysis of the propagation of non-uniform cracks in the concrete cover. The numerical analysis considered the filling of the porous zone by corrosion products and the development of tensile stress. The critical corrosion for surface cracking of concrete is calculated via the numerical analysis as follows [25]:
where is the critical steel corrosion at surface cracking of concrete, (μm) denotes the thickness of the interfacial transition zone (ITZ) ( = 12.5 μm) [25], (MPa) denotes the tensile strength of concrete, and denotes the volumetric ratio of steel corrosion products to original steel ( = 2.17) [26,27].
In the corrosion propagation stage, the durability failure criterion is defined as when the degree of steel corrosion exceeds the critical steel corrosion at surface cracking of concrete. The durability failure probability is expressed as follows [24]:
The deterioration process of reinforcement corrosion includes the following stages: depassivation of the reinforcement (stage 1), formation of cracks (stage 2), spalling of the concrete cover (stage 3), and collapse of the structure through either bond failure or through the reduction in cross sectional area of the loading bearing reinforcement (stage 4). Stage 1 belongs to the corrosion initiation period and stages 2, 3, and 4 belong to the corrosion propagation period. From stage 1 to stage 4, because a failure of the system may cause more severe consequences, the reliability index should increase, and the failure probability should decrease. The failure probability of stage 4 (collapse of structure) is significantly lower than that of stage 1 (depassivation of the reinforcement) [26,28]. On the other hand, Marques et al. [29,30] proposed that from stage 1 (corrosion initiation period) to stage 2 (formation of cracks), the changes in the reliability index and failure probability are marginal. Hence, in this study, in both stage 1 (corrosion initiation period) and stage 2 (formation of cracks in propagation period), a failure probability of 10% is used. Similarly, the probability of corrosion cracking can be determined by using the Monte Carlo simulation method [24].
2.3. Summary of Service Life Prediction Model
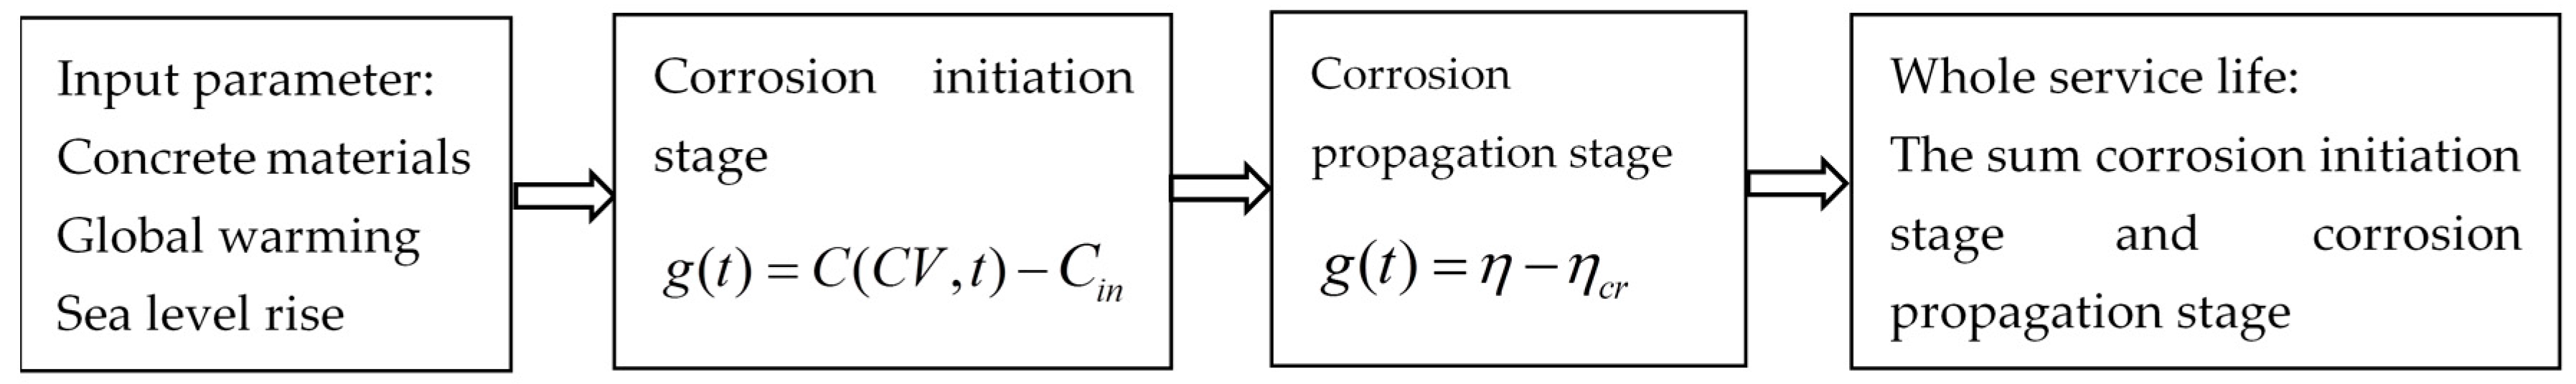
The flow chart of service life prediction is shown in Figure 3. As shown in this figure, for chloride-induced corrosion, the service life includes two stages, i.e., the corrosion initiation stage and the corrosion propagation stage.
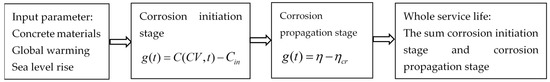
Figure 3.
Flow chart of service life prediction.
In corrosion initiation stage, based on the improved chloride diffusion model considering global warming and sea level rise, chloride concentration at the cover depth is calculated. Then, by using the Monte Carlo method, the probability of the corrosion initiation is calculated, and service life in the corrosion initiation stage is determined.
In the corrosion propagation stage, by using Faraday’s law and the temperature dependent corrosion rate, the degree of corrosion of steel rebar is calculated. Durability failure occurs when the degree of corrosion exceeds the critical steel corrosion at surface cracking.
The whole service life is equal to the sum of the service life in the corrosion initiation stage and in the corrosion propagation stage.
Although fundamental studies have been conducted on chloride-exposed concrete structures, these previous studies do not consider the effects of sea level rise on chloride ingress and on the service life of concrete structures. To fill this gap, we proposed a probabilistic model to assess the impacts of sea level rise and global warming on service life. The effect of sea level rise on eroded distance of the coastline is considered using Bruun’s rule. Furthermore, surface chloride content is determined using distance from the coast.
In the next section, we will show illustrative examples of the individual effects of sea level rise and global warming on service life in the corrosion initiation stage, the corrosion propagation stage, and in the whole life stage. Through these illustrative examples, we will show that the sea level rise presents a significant influence on the service life of concrete structures.
The presented model has some limitations. First, the rate of corrosion is related to many factors, such as the properties of the concrete materials (concrete strength, cover depth, and cracks), environmental conditions (temperature, relative humidity, and exposed environment), and period of corrosion. Further studies evaluating the rate of corrosion are necessary; Second, the current model about surface cracking (Equation (20)) does not consider concrete creep or the migration of corrosion products into the crack space.
3. Illustrative Examples
In this study, parametric studies are conducted to demonstrate the impacts of global warming and sea level rise on service life. Table 2 shows the parameters that are related to material properties and environmental conditions. From a material properties standpoint, two water-to-cement ratios, 0.4 and 0.5 (no Fly Ash or Slag is considered in the concrete mixture) and two concrete cover depths, 45 mm and 55 mm, are used. From an environmental conditions standpoint, the exposure class is Cl3 (airborne sea water), the distance from the coast is 500 m, the slope of the beach is 1/100, and the initial temperature is 20 °C. Table 3 shows the statistical parameters used for making service life predictions. The uncertainties associated with concrete cover depth, chloride diffusion coefficient, surface chloride content, chloride diffusivity decay coefficient, threshold chloride content, concrete strength, corrosion current density, temperature rise, and sea level rise are considered. For temperature rise or sea level rise, the coefficient of variance increases with time. At the start time, the coefficient of variance is zero, and at 100 years, the coefficient of variance is 0.06 [16].
Table 2.
Listing of parameters.
Table 3.
Statistical parameters.
3.1. Service Life in Corrosion Initiation Stage
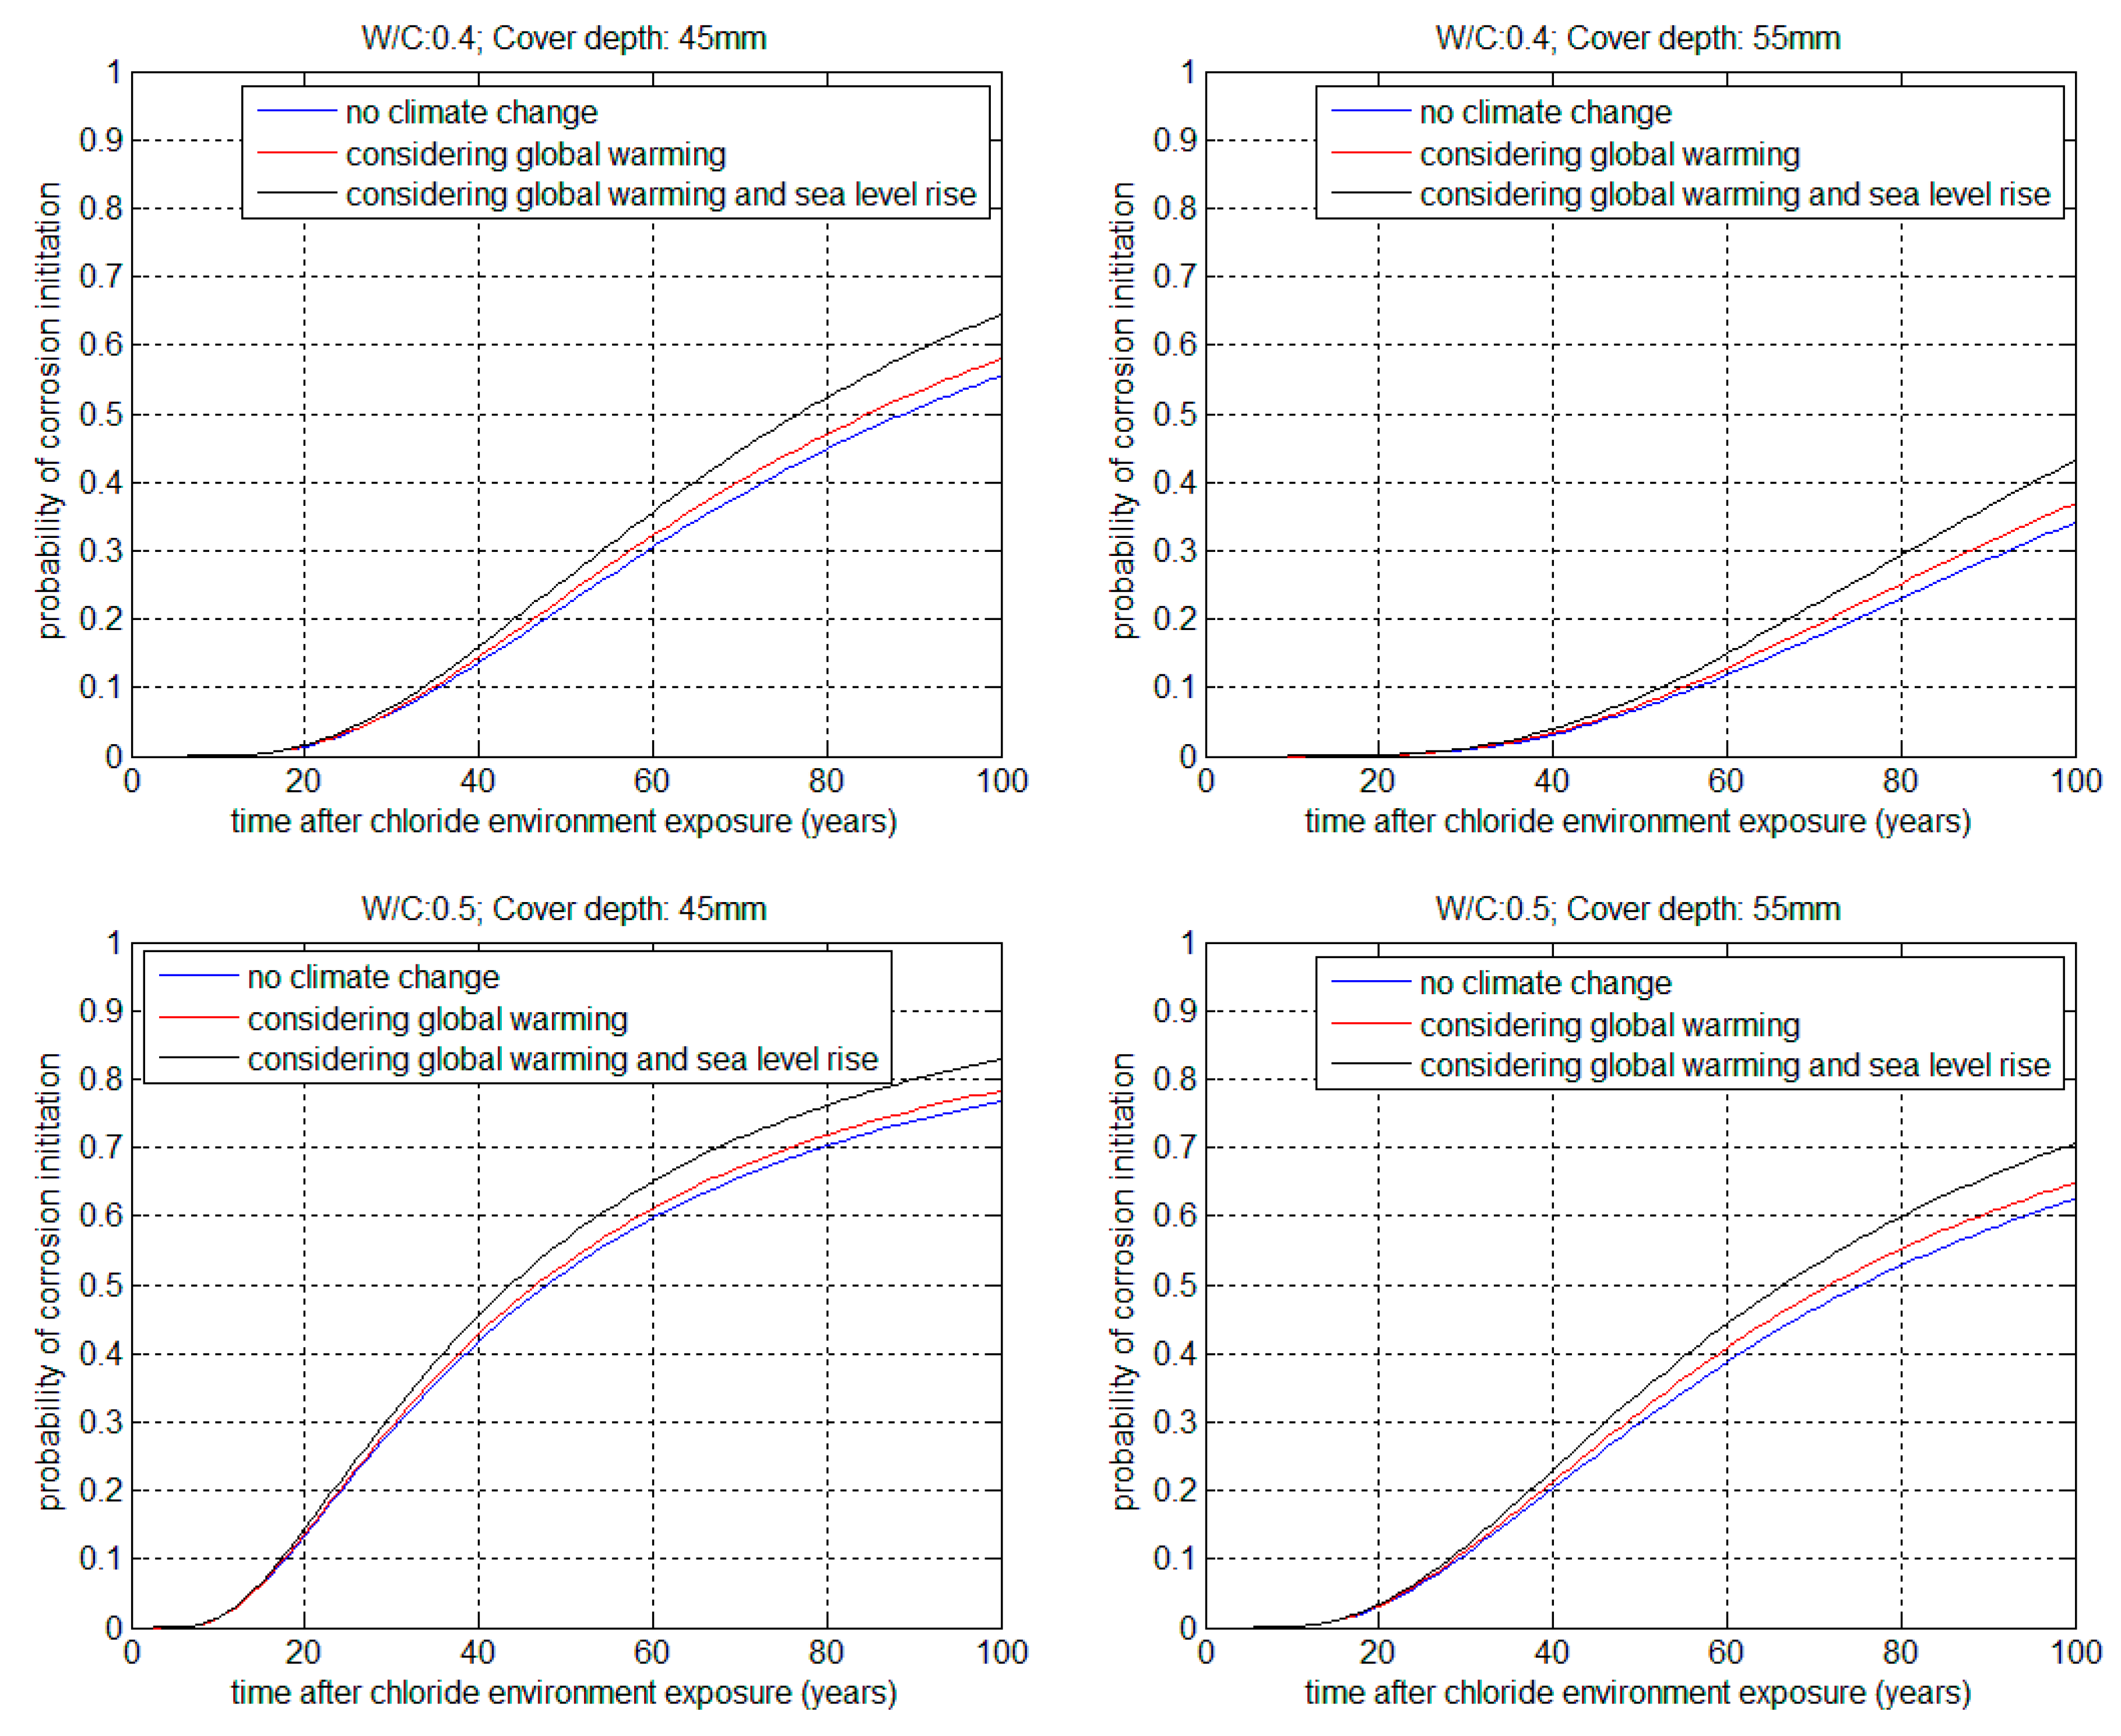
To illustrate the effects of global warming and sea level rise on service life, parametric studies are carried out for three cases: no climate change (case 1), considering global warming (case 2), and considering global warming and sea level rise (case 3). By using the Monte Carlo method, the probability of corrosion initiation for the three cases is calculated and shown in Figure 4. For case 2 and case 3, the probability of corrosion initiation is higher than that of case 1. Especially when the effect of sea level rise is considered, the increase in the probability of corrosion initiation becomes more obvious. When the water-to-cement ratio increases (from Figure 4a–c, and from Figure 4b–d), the probability of corrosion initiation also increases. When the cover depth increases (from Figure 4a,b, and from Figure 4c,d), the probability of corrosion initiation decreases.
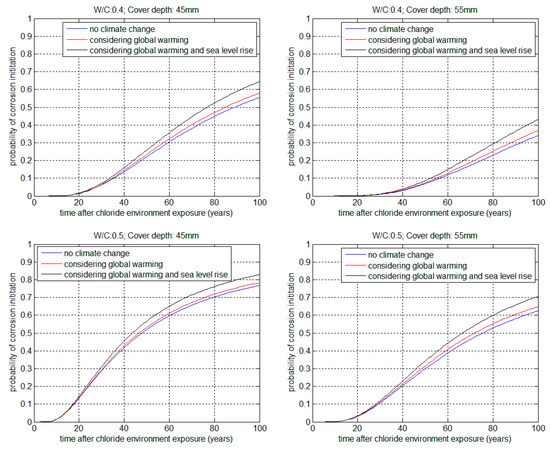
Figure 4.
Probability of corrosion initiation.
In the corrosion initiation stage, the time of probability of corrosion initiation to reach 10% is regarded as the service life [18]. Based on the relationship between the probability of corrosion initiation and the exposure period, the service life can be determined by using an interpolation method. Table 4 presents the service life of the concrete structure. In this study, “former service life” means the service life in the condition of no climate change, “modified service life” means the service life in the condition of climate changes (global warming and sea level rise), and “relative service life” means the ratio of the modified service life to the former service life. As shown in Table 4, the former service life shows reductions due to climate change. In particular, as the former service life increases, the reduction ratio of former service life increases. Hence, climate change shows more influences on the service life of durable concrete structures, such as concrete structures with lower water-to-cement ratio and higher cover depth.
Table 4.
Service life in the corrosion initiation stage.
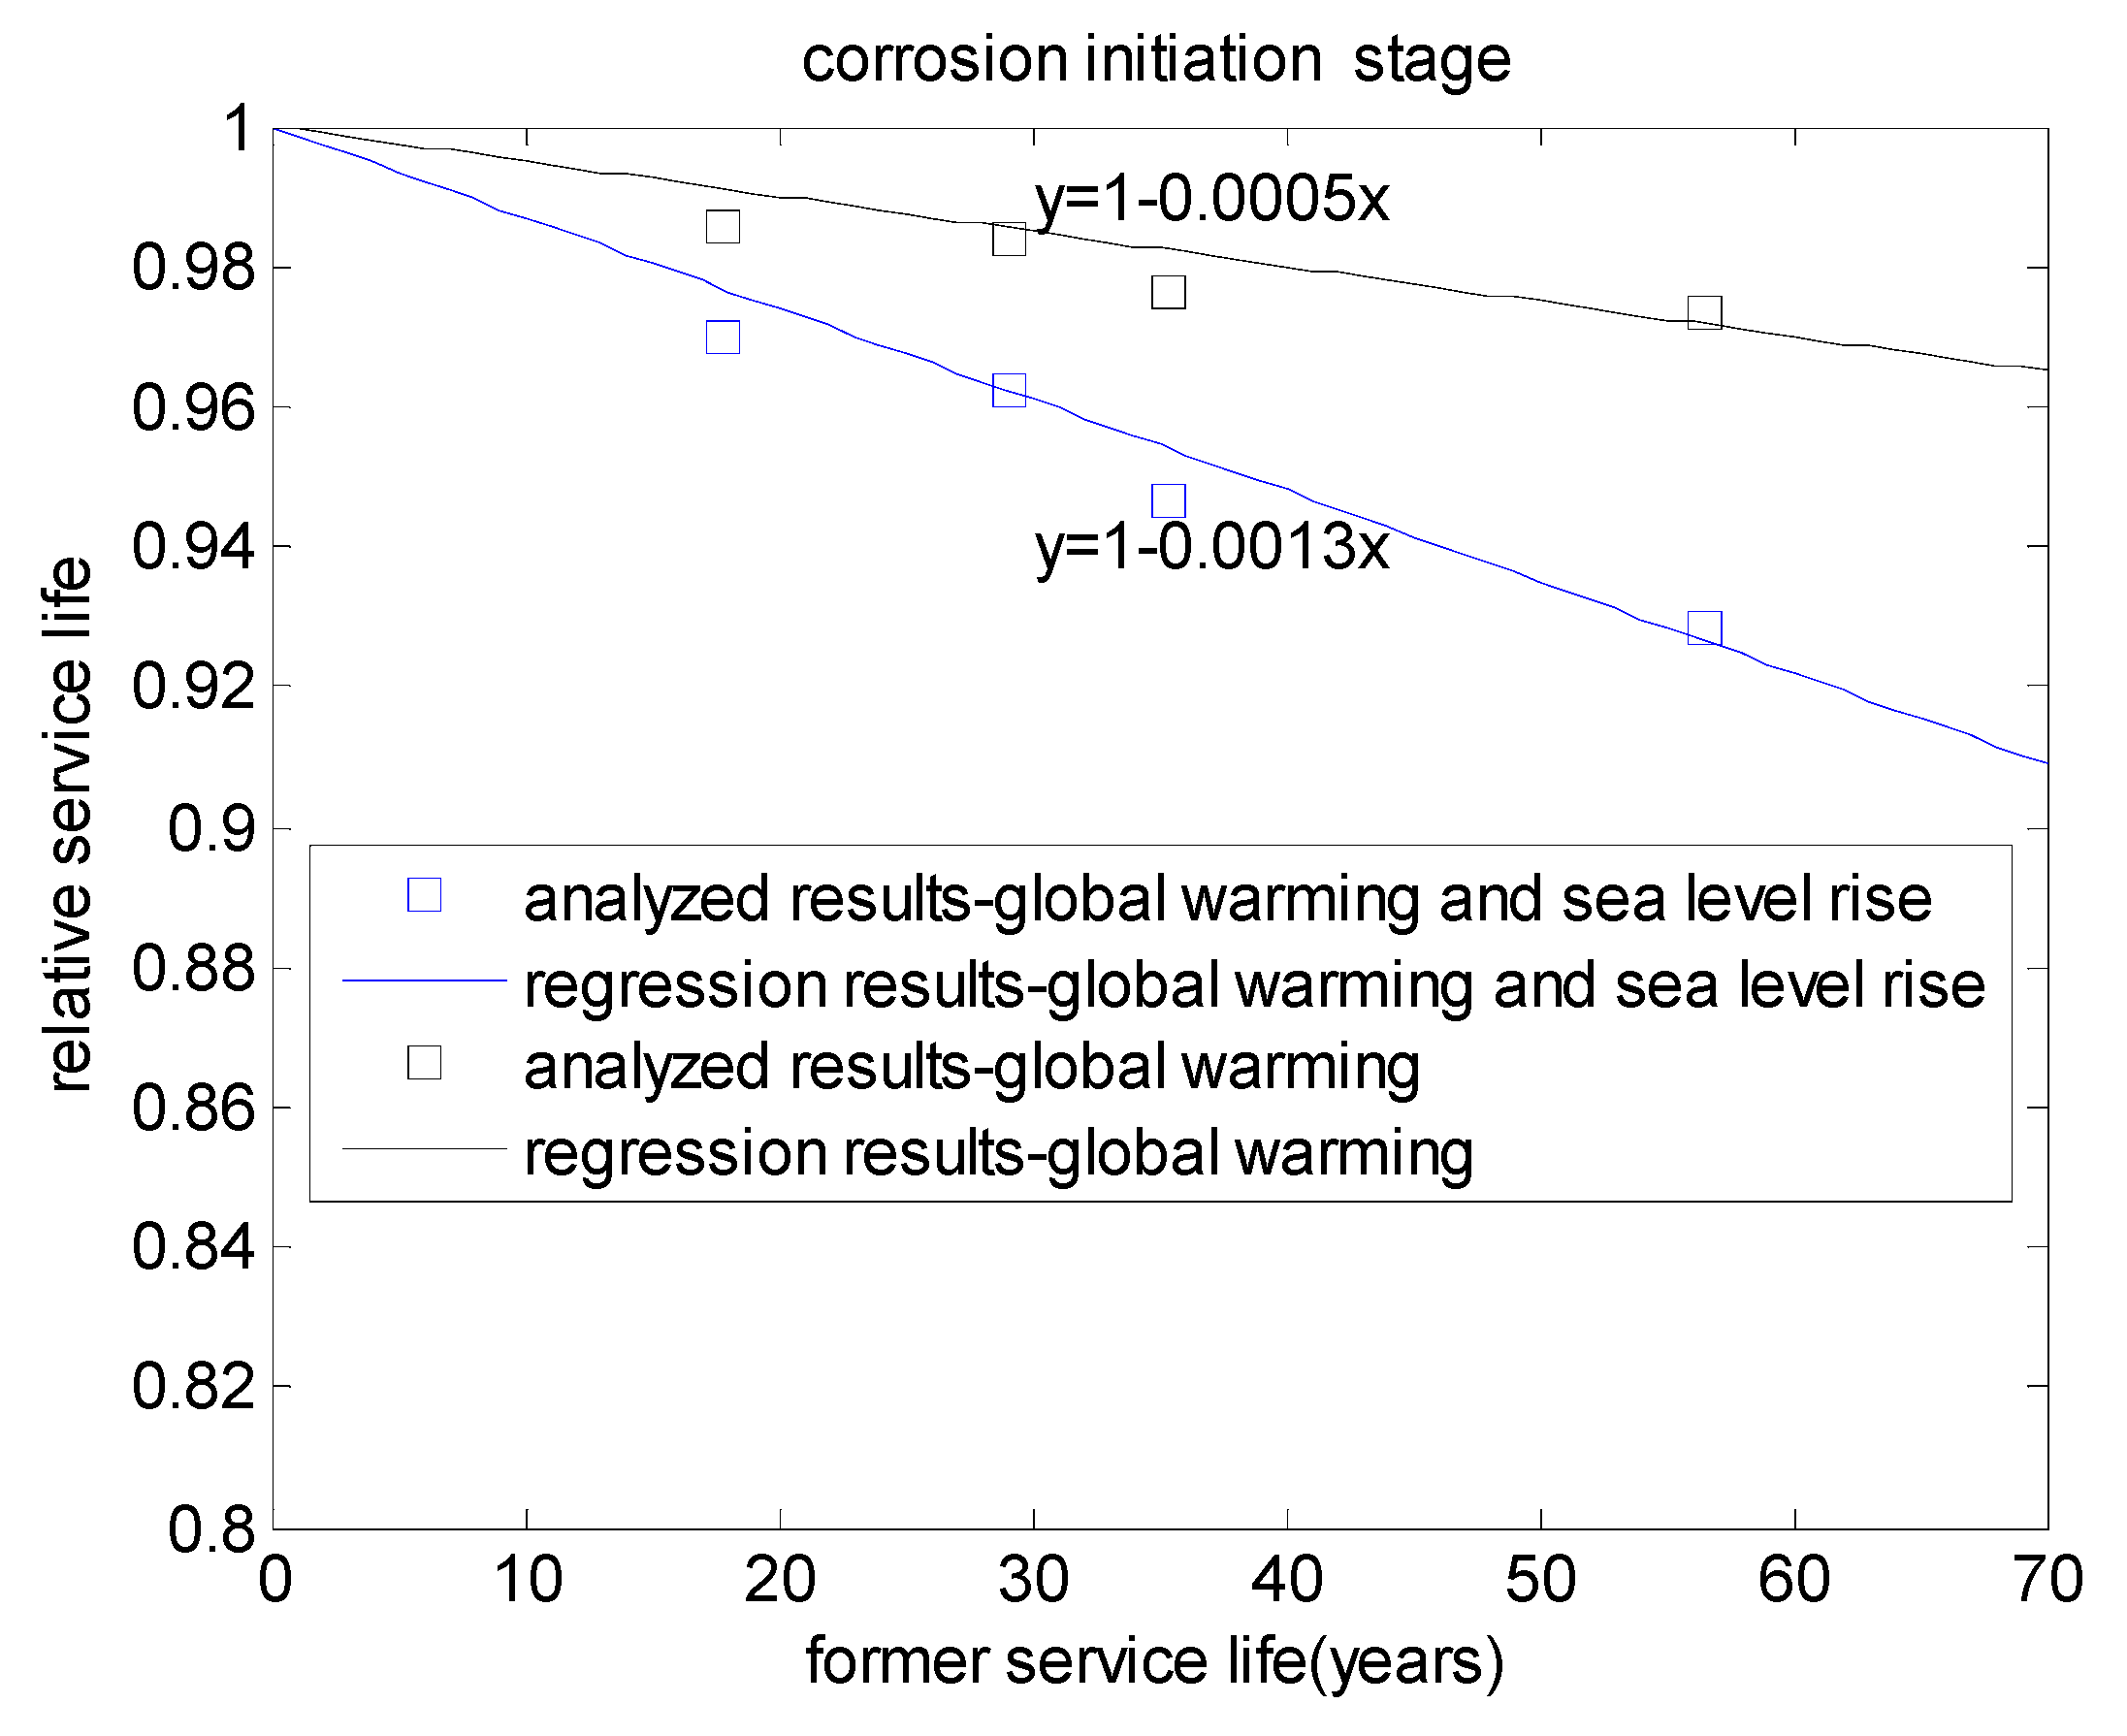
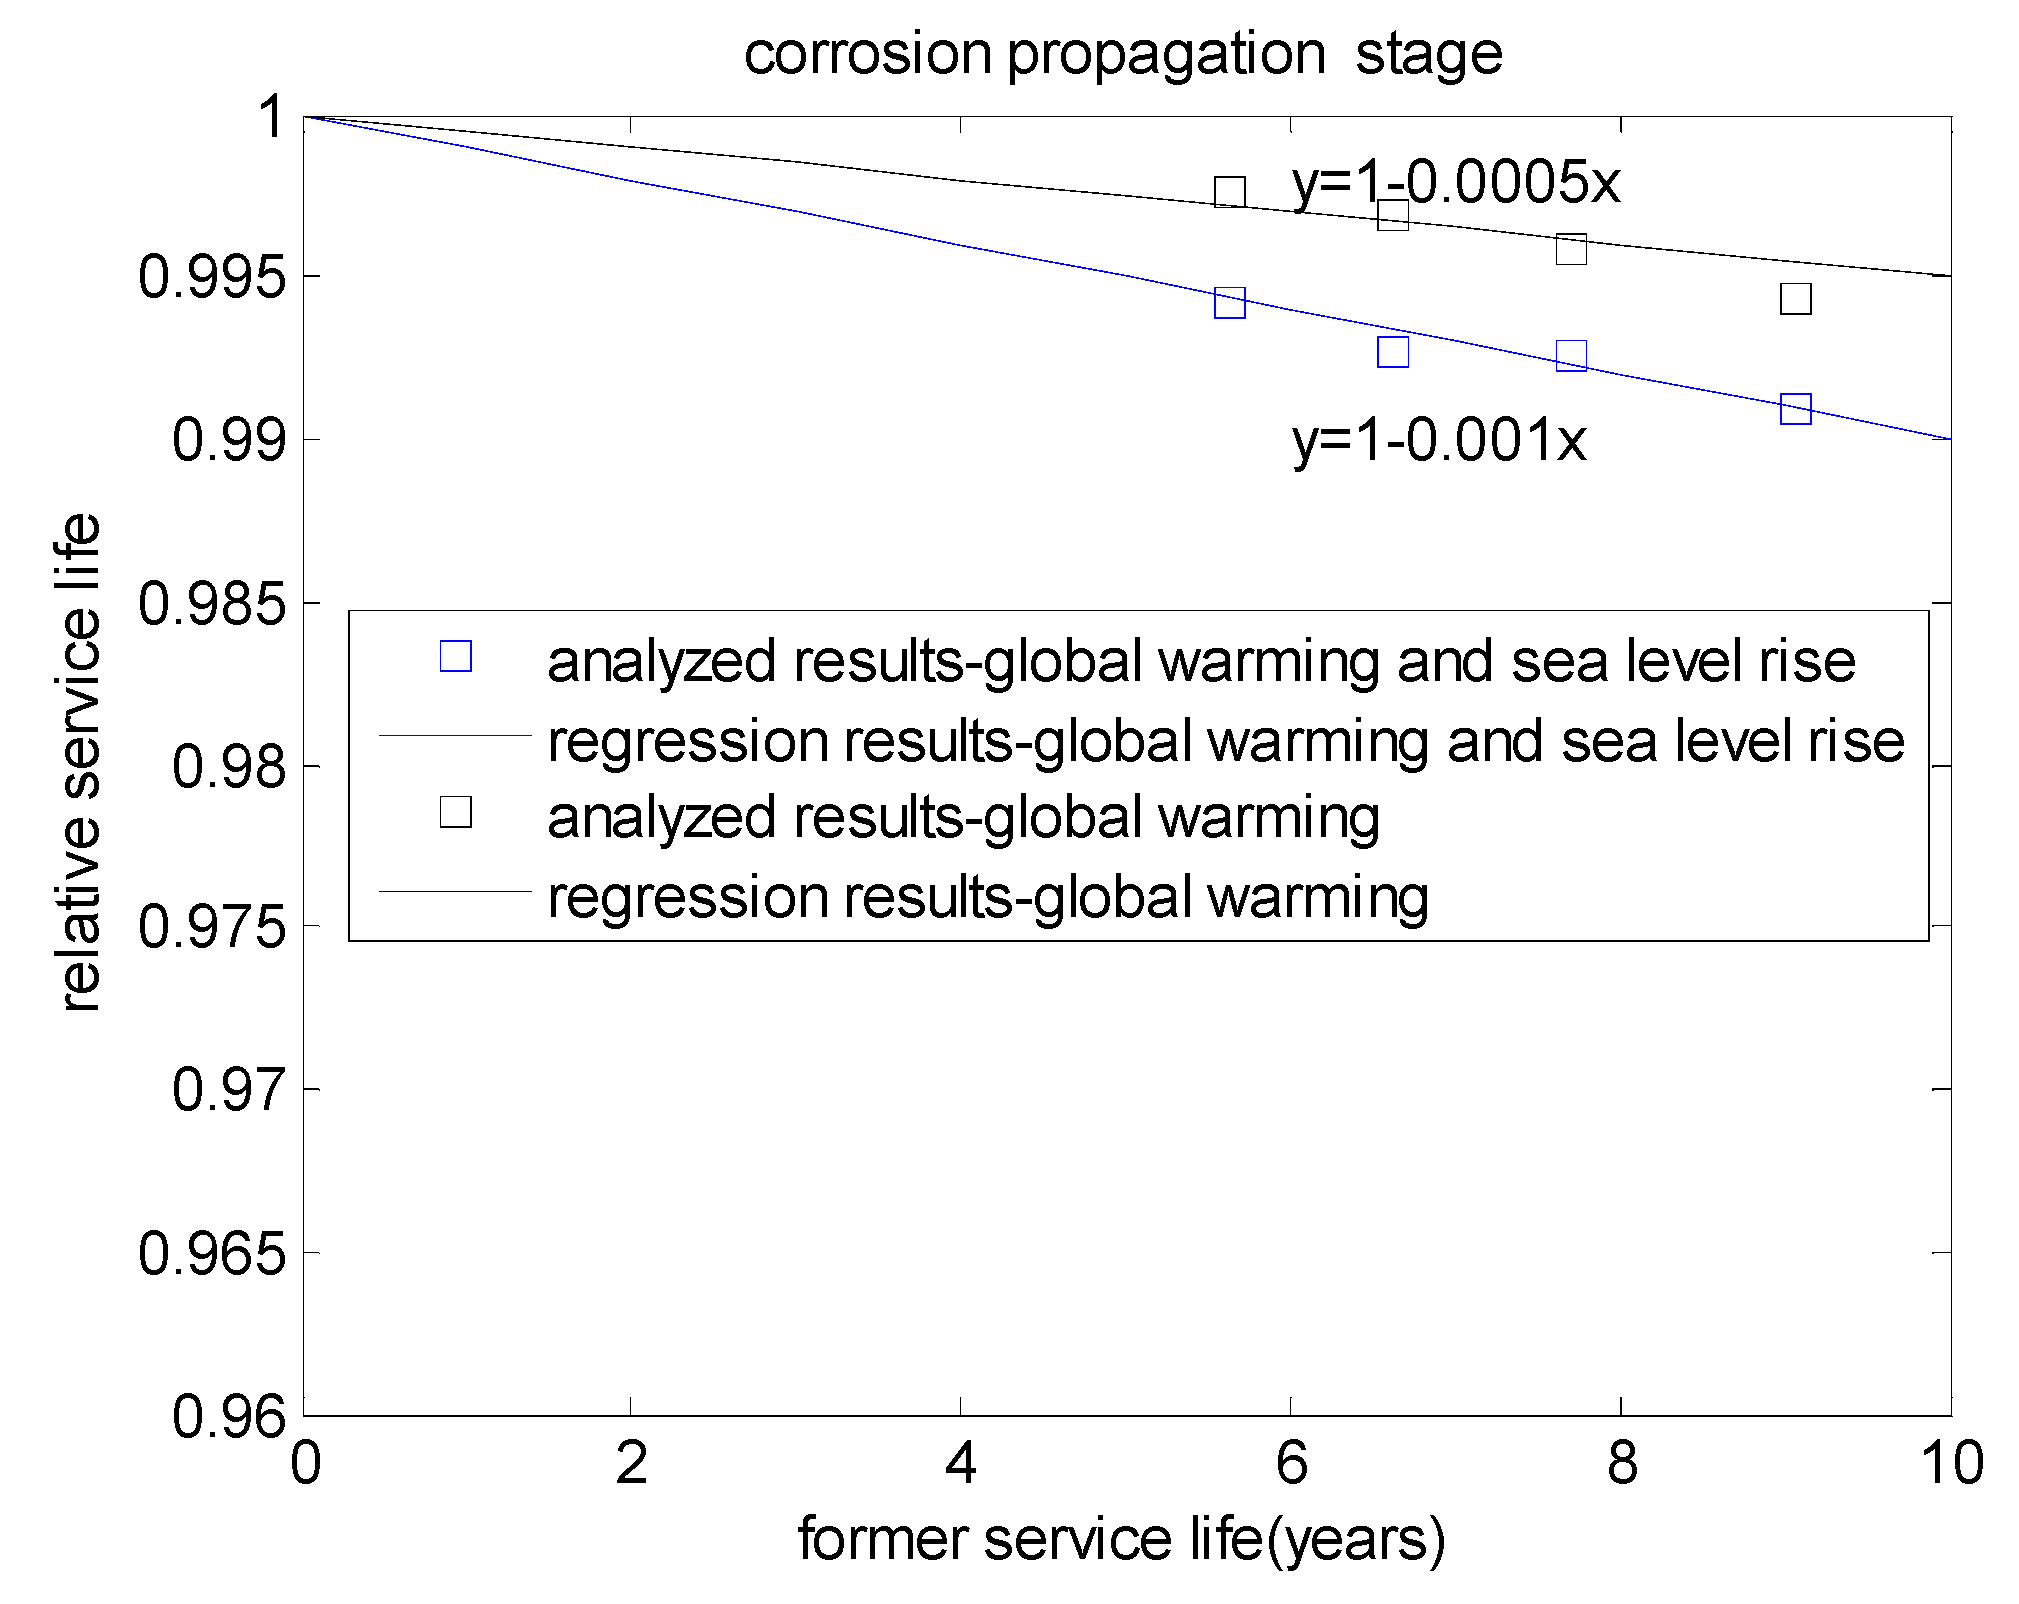
Figure 5 shows the relative service life for case 2 (considering global warming) and case 3 (considering global warming and sea level rise). Linear regressions of service life are carried out for case 2 and case 3. The slopes of the regression equation for case 2 and case 3 are −0.0005 and −0.0013, respectively. Hence, sea level rise presents significant effects on service life, which show similarity with the trends shown in Figure 4. For concrete with a former service life of 50 years in the corrosion initiation stage, after considering global warming and sea level rise, the reduction ratio of former service life is about 6.5%.
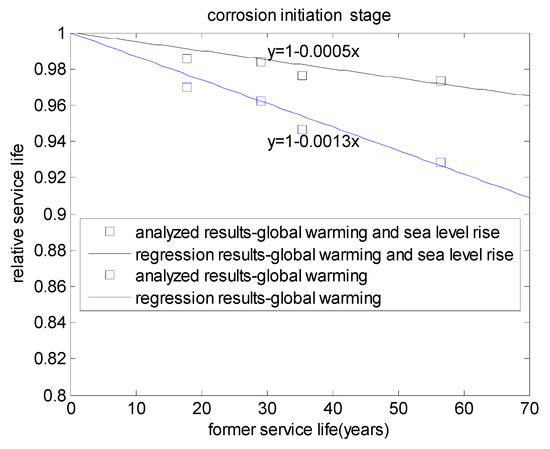
Figure 5.
Relative service life in the corrosion initiation stage.
3.2. Service Life in Corrosion Propagation Stage
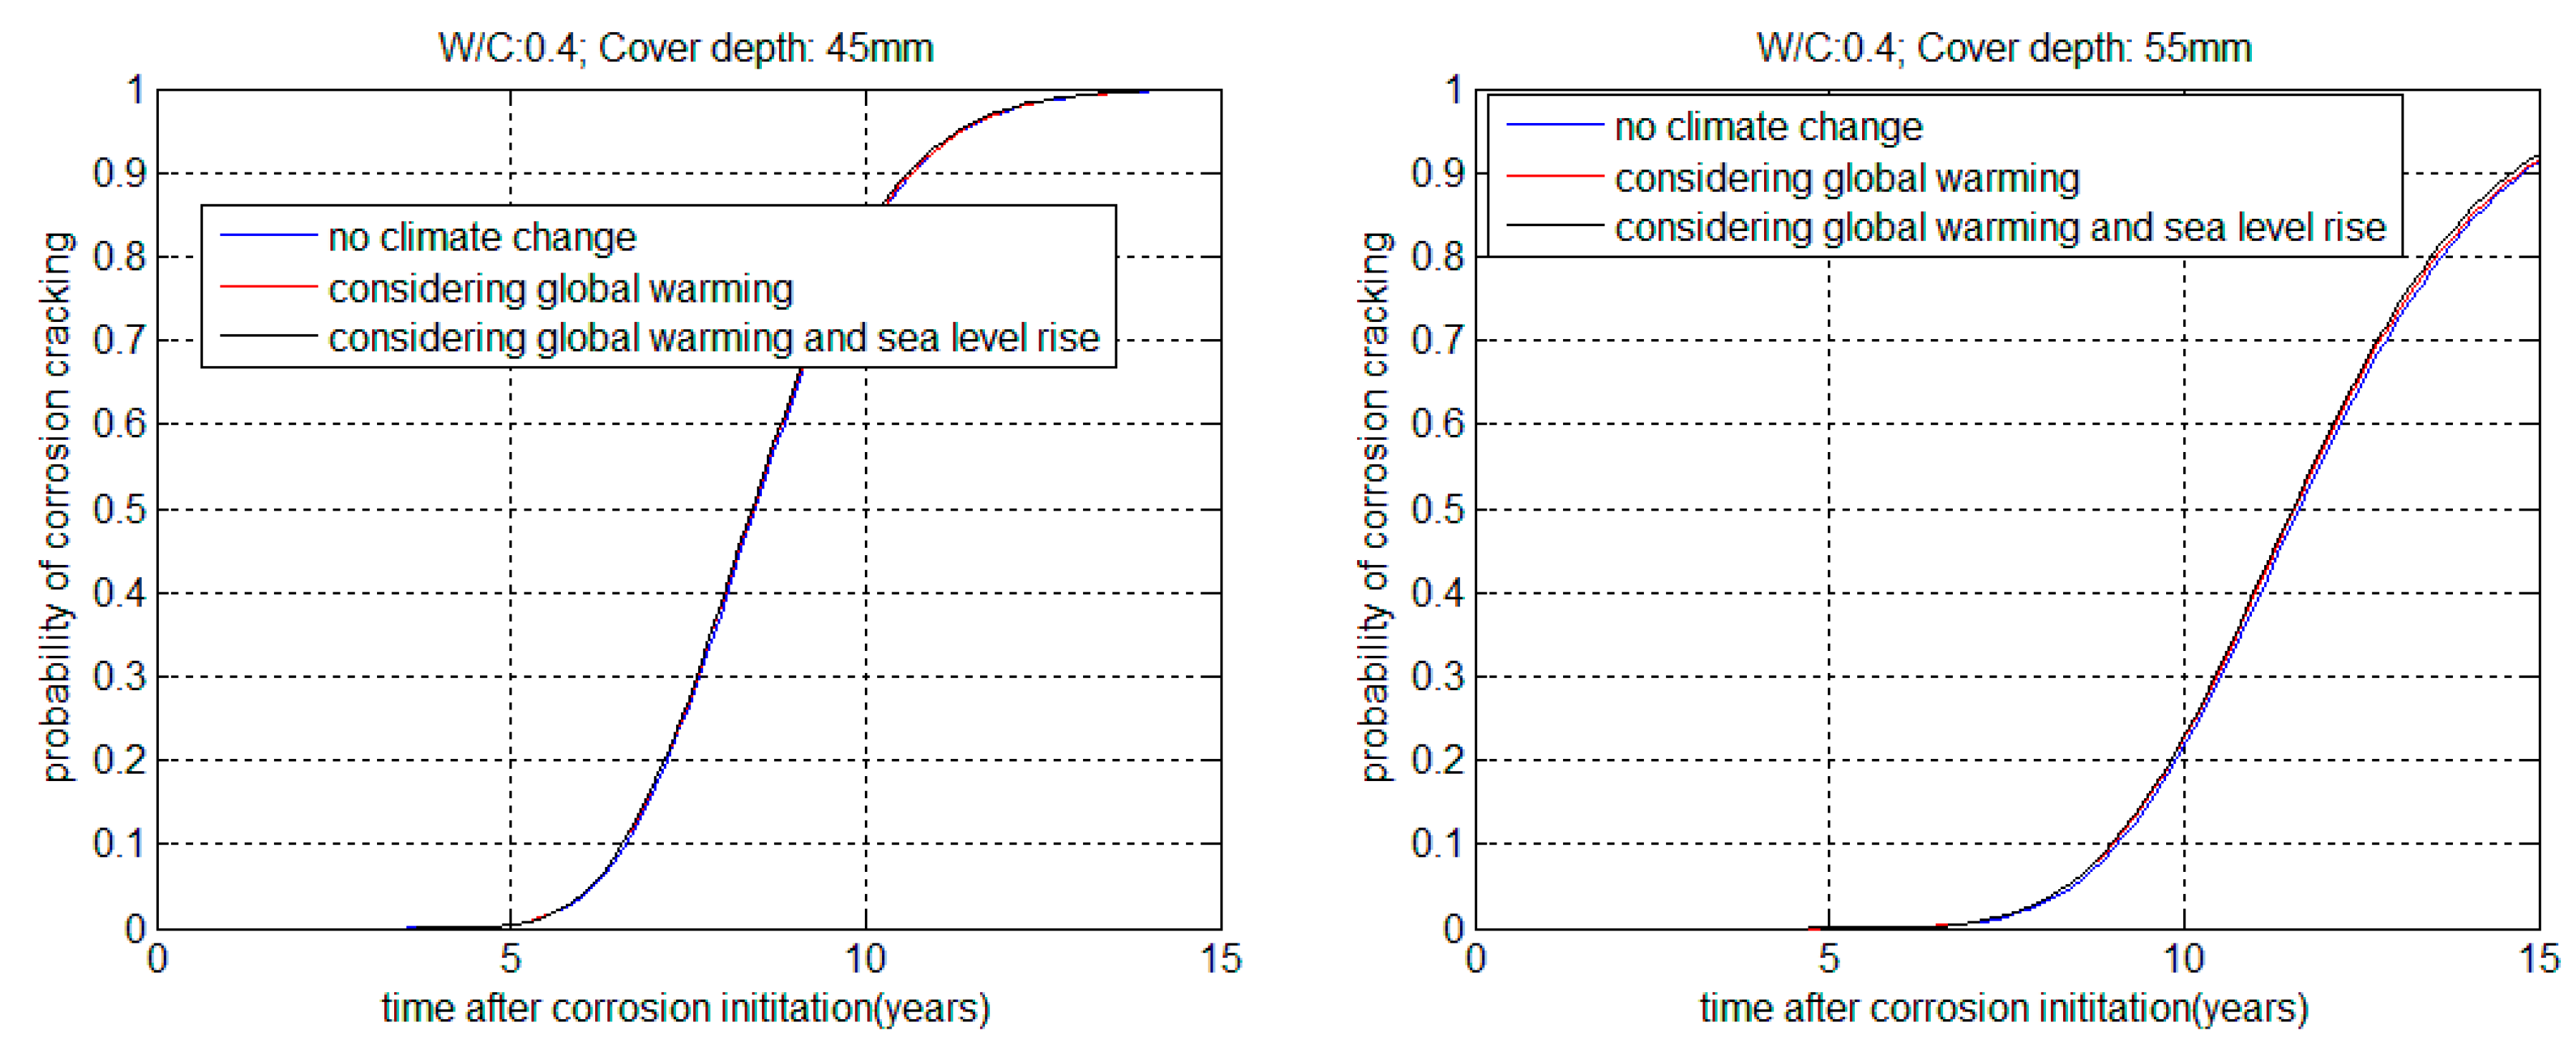
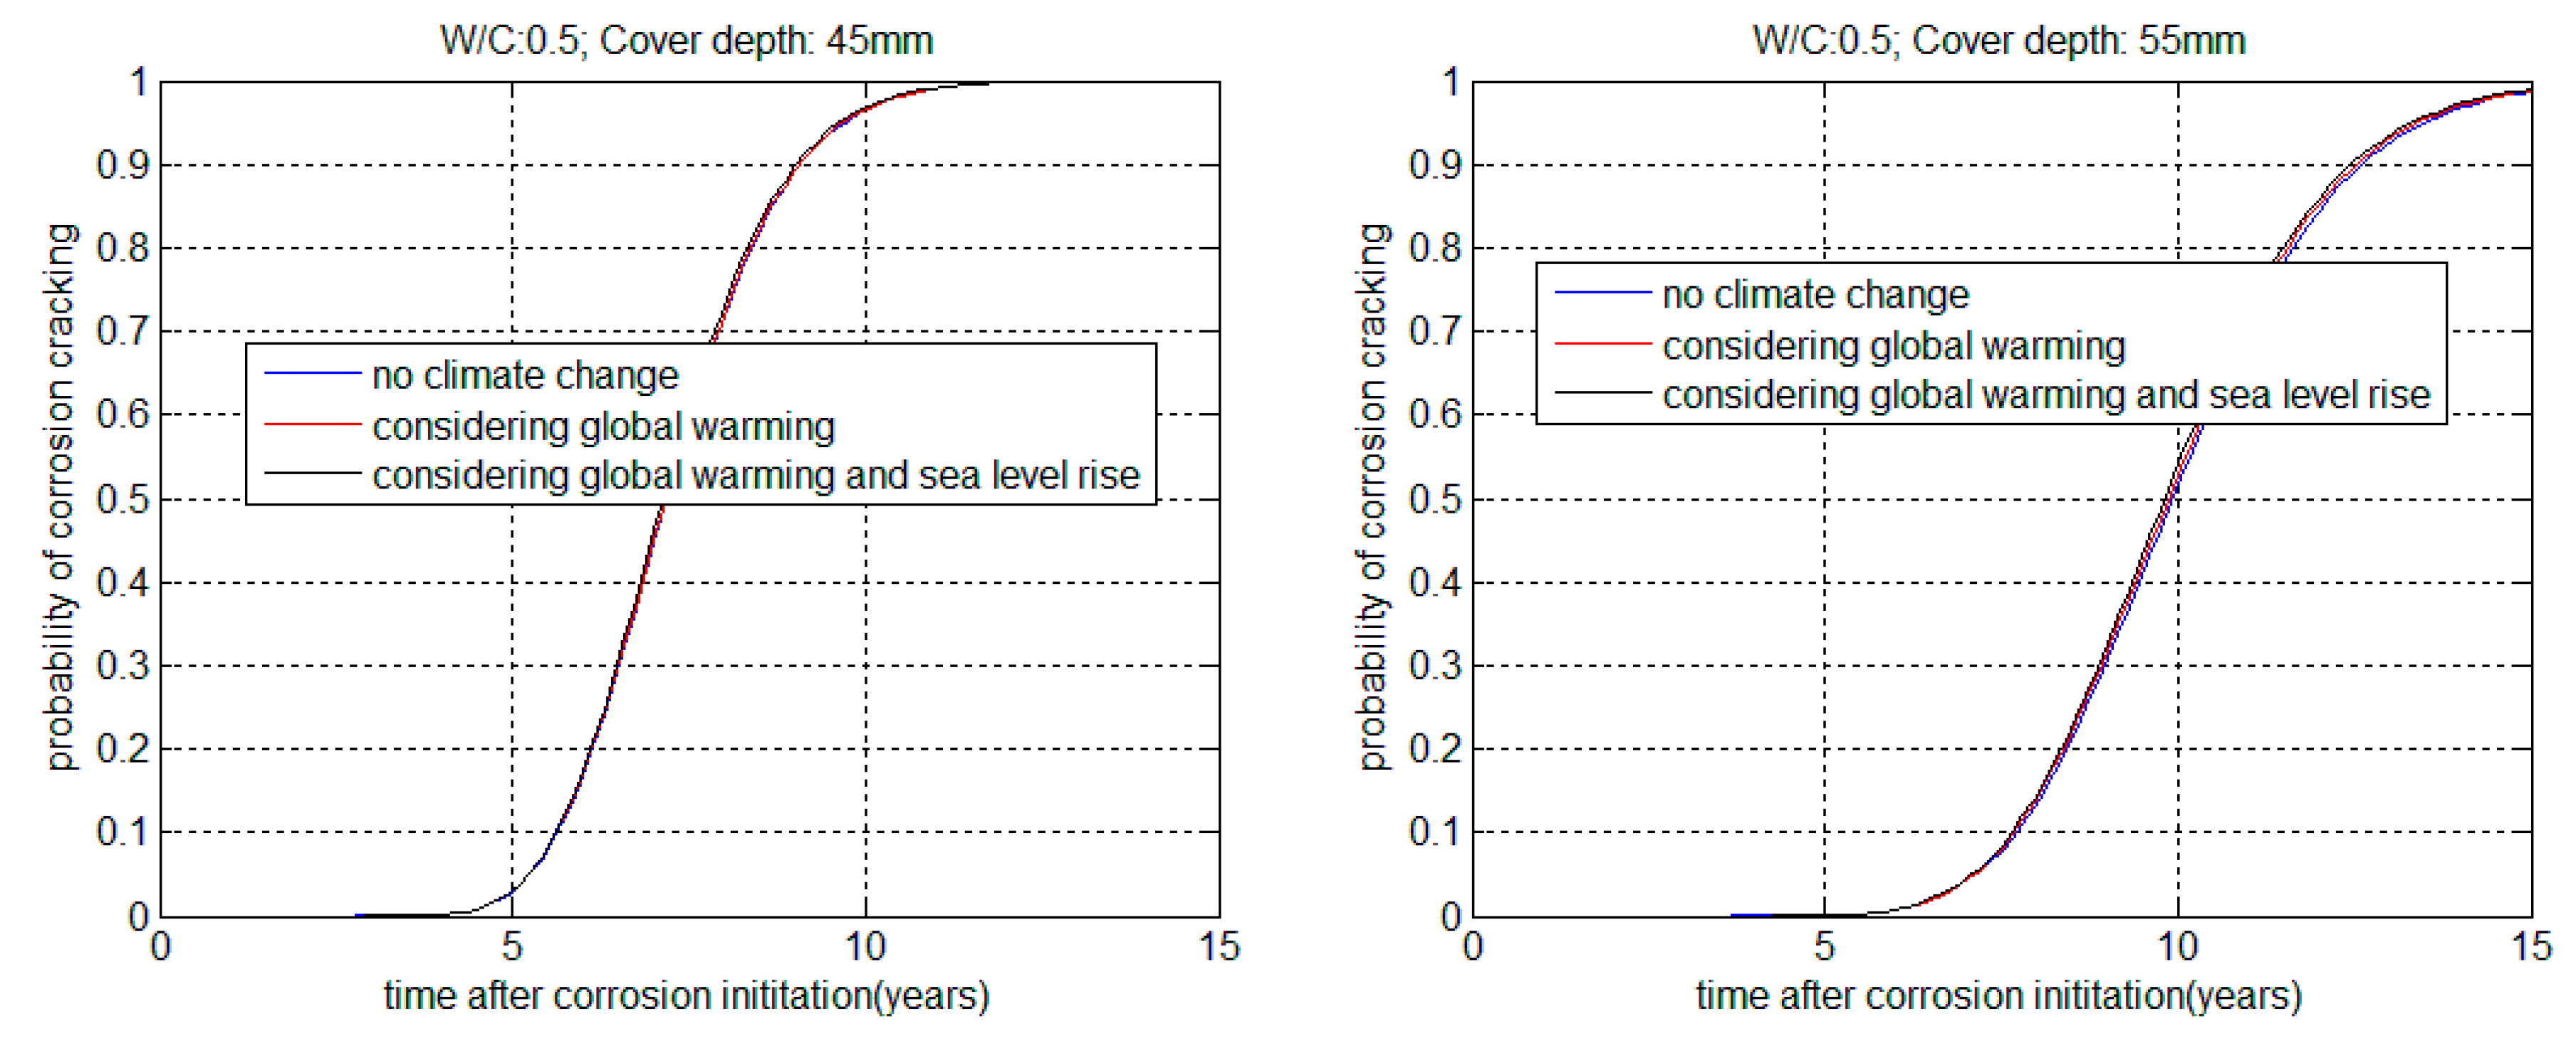
In the corrosion propagation stage, the durability failure criterion is defined as when the degree of corrosion exceeds the critical steel corrosion at surface cracking. By using the Monte Carlo method, the probability of corrosion cracking is calculated and shown in Figure 6. For cases of no climate change (case 1), considering global warming (case 2), and considering global warming and sea level rise (case 3), the difference of service life is marginal. This is because the corrosion current is high for chloride-induced corrosion. After the initiation of corrosion, the surface cracking generally occurs in a few years. With the increasing water-to-cement ratio (from Figure 6a–c, and from Figure 6b–d), the probability of corrosion cracking increases. Moreover, with increasing concrete cover depth (from Figure 6a,b, and from Figure 6c,d), probability of corrosion cracking decreases.
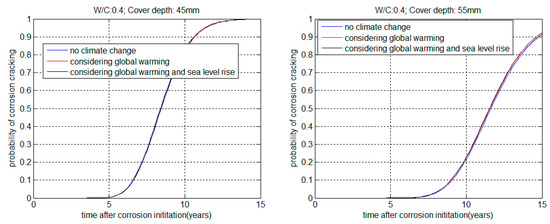
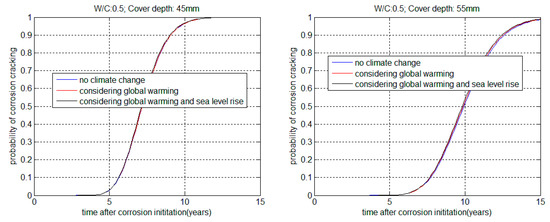
Figure 6.
Probability of corrosion cracking.
Table 5 shows the service life in the corrosion propagation stage. For case 2 (considering global warming), and case 3 (considering global warming and sea level rise), the reduction in service life is marginal. For concrete with different material properties, the service life ranges between 5 years and 9 years. This generally agrees with studies conducted using the Life365 software. In the current version of the Life365 software, the duration of corrosion propagation is assumed to be 6 years [19]. This value was selected on the basis of the studies conducted by Weyers [31] who determined that the length of the time period between corrosion initiation and cracking varied from 3 to 7 years for bridge decks in the USA. The Life365 software also indicated that the propagation period is a function of many parameters such as rate of corrosion, temperature, moisture content, and the quality of the concrete; therefore, 6 years is a simplified value for the corrosion propagation period.
Table 5.
Service life in corrosion cracking propagation stage.
Figure 7 shows the relative service life in the corrosion propagation stage. For concrete with a former service life of 10 years in the corrosion propagation stage, after considering global warming and sea level rise, the reduction ratio in former service life is about 1%.
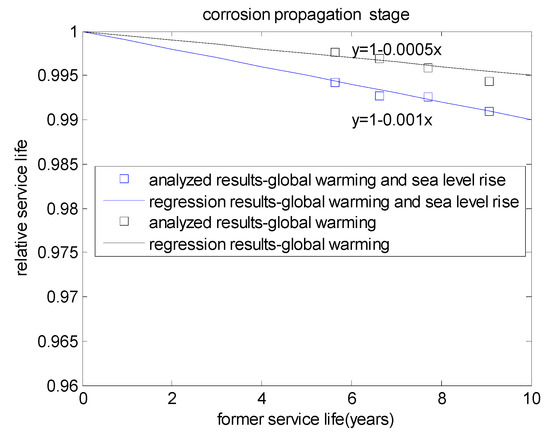
Figure 7.
Relative service life in the corrosion propagation stage.
3.3. Whole Effects of Global Warming and Sea Level Rise on Service Life
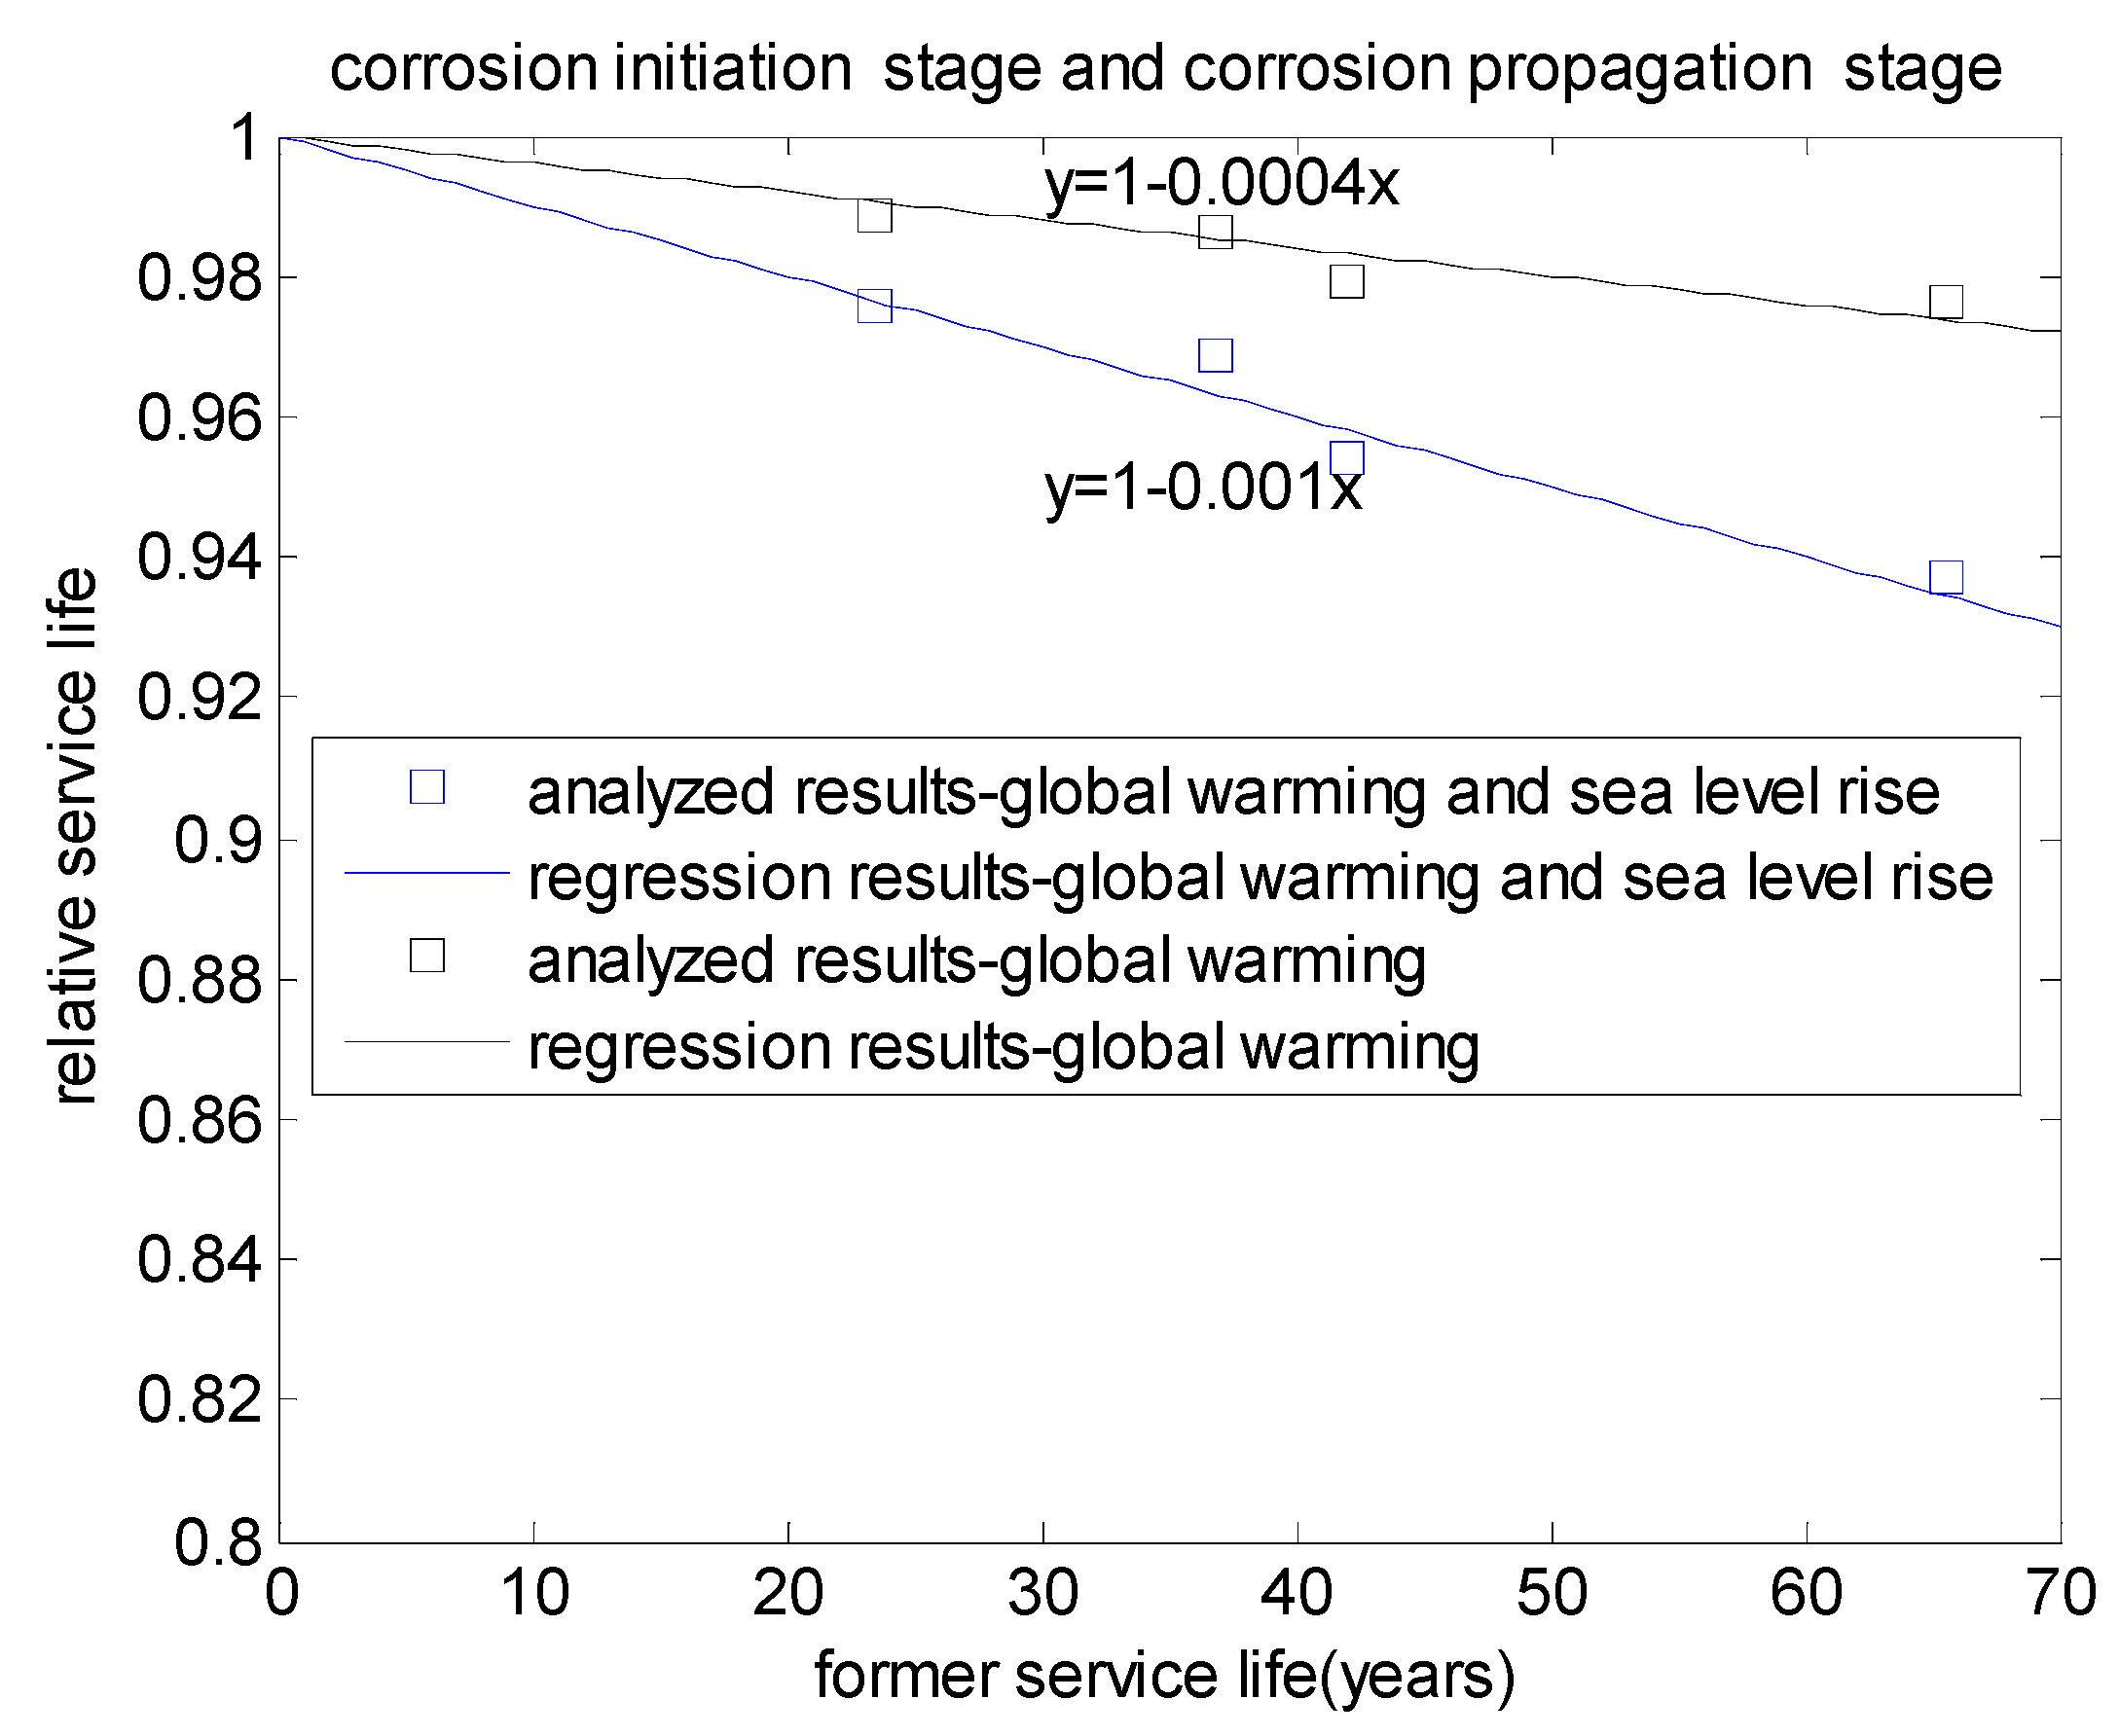
By using the service life in the corrosion initiation stage (Table 4) and in the corrosion propagation stage (Table 5), the whole service life of the concrete structure is calculated and shown in Table 6. Figure 8 shows the relative service life versus the former service life. For concrete with a former service life of 50 years, after considering both global warming and sea level rise, the reduction ratio of former service life is about 5%. In contrast, if only considering global warming, the reduction ratio of service life is about 2%. Hence, the service life of concrete structures is significantly influenced by sea level rise.
Table 6.
Whole service life of concrete.
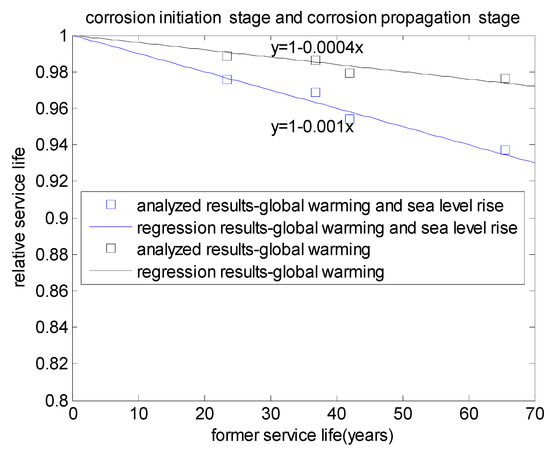
Figure 8.
Relative service life of concrete.
In this study, the environmental database and material database are from other studies and databases. When the proposed model in this study is adopted for other regions/countries, the users should select the appropriate environmental database and material database according to real conditions, such as the global warming scenario (Figure 1), sea level rise scenario (Figure 2), corrosion rate (Table 1), and listing of input parameters (Table 2).
In addition, further studies are necessary to validate the proposed model for different environmental and material databases. For example, climate change closely relates to greenhouse gas emissions. In this study, the IS92a global climate change scenario is used to describe global warming and sea level rise. When the local greenhouse gas emissions are different from IS92a, the appropriate local climate change scenario should be used [32]. In addition, blended cement concrete has a lower chloride diffusivity and corrosion rate than those of Portland cement concrete. If blended cement concrete is used, the service life of concrete structures will increase.
4. Conclusions
This study proposes a probabilistic model for analyzing the service life of coastal concrete structures considering the effects of global warming and sea level rise. The specific contribution of the present study is that it considers the influence of sea level rise on service life. We analyze the individual effects of sea level rise and global warming on service life in the corrosion initiation stage, the corrosion propagation stage, and whole life stage.
First, in the corrosion initiation stage, an improved chloride diffusion model is proposed to determine chloride concentration. The effect of global warming on the chloride diffusion coefficient is considered using activation energy. With rising sea levels, the distance between concrete structures and the coast decrease, and, consequently, surface chloride concentration increases. The effect of sea level rise on surface chloride concentration is considered using Bruun’s rule. The Monte Carlo method is used to calculate the probability of corrosion initiation. Service life is determined based on the interpolation of the probability of corrosion initiation.
Second, in the corrosion propagation stage, a numerical model is proposed to calculate the rate of corrosion, probability of corrosion cracking, and service life. For chloride-induced corrosion, the corrosion current is high, and surface cracking generally occurs within a few years after the initiation of corrosion. After considering global warming and sea level rise, the reduction in service life is marginal.
Third, the whole service life is determined as the sum of service life in the corrosion initiation and corrosion propagation stages. For concrete structures with a service life of 50 years, after considering the impact of global warming and sea level rise, the service life decreases by about 5%. In contrast, if only considering global warming, the reduction ratio of service life is about 2%. Based on the numerical results shown in this paper, we can see that sea level rise presents a significant influence on the service life of concrete structures.
Acknowledgments
This research was supported by the Basic Science Research Program through the National Research Foundation of Korea (NRF), funded by the Ministry of Science, ICT and Future Planning (No. 2015R1A5A1037548).
Author Contributions
Xiao-Jian Gao made the chloride ingress calculation program; Xiao-Yong Wang analyzed the calculation results. Xiao-Jian Gao and Xiao-Yong Wang wrote the paper.
Conflicts of Interest
The authors declare no conflict of interest.
References
- Al-Khaja, W.A. Influence of temperature, cement type and level of concrete consolidation on chloride ingress in conventional and high-strength concretes. Constr. Build. Mater. 1997, 11, 9–13. [Google Scholar] [CrossRef]
- Martin-Perez, B.; Zibara, H.; Hooton, R.D.; Thomas, M.D.A. A study of the effect of chloride binding on service life predictions. Cem. Concr. Res. 2000, 30, 1215–1223. [Google Scholar] [CrossRef]
- Tang, L.P. Engineering expression of the ClinConc model for prediction of free and total chloride ingress in submerged marine concrete. Cem. Concr. Res. 2008, 38, 1092–1097. [Google Scholar]
- Conciatori, D.; Laferriere, F.; Bruhwiler, E. Comprehensive modeling of chloride ion and water ingress into concrete considering thermal and carbonation state for real climate. Cem. Concr. Res. 2010, 40, 109–118. [Google Scholar] [CrossRef]
- Conciatori, D.; Sadouki, H.; Bruhwiler, E. Capillary suction and diffusion model for chloride ingress into concrete. Cem. Concr. Res. 2008, 38, 1401–1408. [Google Scholar] [CrossRef]
- Chen, D.; Mahadevan, S. Chloride-induced reinforcement corrosion and concrete cracking simulation. Cem. Concr. Compos. 2008, 30, 227–238. [Google Scholar] [CrossRef]
- Vu, K.A.T.; Stewart, M.G. Structural reliability of concrete bridges including improved chloride-induced corrosion models. Struct. Saf. 2000, 22, 313–333. [Google Scholar] [CrossRef]
- Kim, R.H.; Tae, S.H.; Yang, K.H.; Kim, T.H.; Roh, S.J. Analysis of Lifecycle CO2 Reduction Performance for Long-Life Apartment House. Environ. Prog. Sustain. 2015, 34, 555–566. [Google Scholar] [CrossRef]
- Demis, S.; Efstathiou, M.P.; Papadakis, V.G. Computer-aided modeling of concrete service life. Cem. Concr. Compos. 2014, 47, 9–18. [Google Scholar] [CrossRef]
- Cusson, D.; Lounis, Z.; Daigle, L. Benefits of internal curing on service life and life-cycle cost of high-performance concrete bridge decks—A case study. Cem. Concr. Compos. 2010, 32, 339–350. [Google Scholar] [CrossRef]
- Kim, T.H.; Chae, C.U.; Kim, G.H.; Jang, H.J. Analysis of CO2 Emission Characteristics of Concrete Used at Construction Sites. Sustainability 2016, 8, 348–362. [Google Scholar] [CrossRef]
- Den Heede, P.V.; Maes, M.; De Belie, N. Influence of active crack width control on the chloride penetration resistance and global warming potential of slabs made with fly ash + silica fume concrete. Constr. Build. Mater. 2014, 67, 74–80. [Google Scholar] [CrossRef]
- De Medeiros-Junior, R.A.; de Lima, M.G.; de Medeiros, M.H.F. Service life of concrete structures considering the effects of temperature and relative humidity on chloride transport. Environ. Dev. Sustain. 2015, 17, 1103–1119. [Google Scholar] [CrossRef]
- Bastidas-Arteaga, E.; Chateauneuf, A.; Sanchez-Silva, M.; Bressolette, P.; Schoefs, F. Influence of weather and global warming in chloride ingress into concrete: A stochastic approach. Struct. Saf. 2010, 32, 238–249. [Google Scholar] [CrossRef]
- Bastidas-Arteaga, E.; Stewart, M.G. Damage risks and economic assessment of climate adaptation strategies for design of new concrete structures subject to chloride-induced corrosion. Struct. Saf. 2015, 52, 40–53. [Google Scholar] [CrossRef]
- Wang, X.M.; Stewart, M.G.; Nguyen, M. Impact of climate change on corrosion and damage to concrete infrastructure in Australia. Clim. Chang. 2012, 110, 941–957. [Google Scholar] [CrossRef]
- Stewart, M.G.; Wang, X.M.; Nguyen, M. Climate change adaptation for corrosion control of concrete infrastructure. Struct. Saf. 2012, 35, 29–39. [Google Scholar] [CrossRef]
- Kwon, S.J.; Na, U.J.; Park, S.S.; Jung, S.H. Service life prediction of concrete wharves with early-aged crack: Probabilistic approach for chloride diffusion. Struct. Saf. 2009, 31, 75–83. [Google Scholar] [CrossRef]
- Life-365 Service Life Prediction Model. 2014. Available online: http://www.life-365.org/ (accessed on 10 March 2017).
- Houghton, J.T.; Ding, Y.; Griggs, D.J.; Noguer, M.; van der Linden, P.J.; Dai, X.; Maskell, K.; Johnson, C.A. Climate Change 2001: The Scientific Basis; Cambridge University Press: Cambridge, UK, 2001. [Google Scholar]
- Bruun, P. Review of conditions for uses of the Bruun rule of erosion. Coast. Eng. 1983, 7, 77–89. [Google Scholar] [CrossRef]
- Ranasinghe, R.; Callaghan, D.; Stive, M.J.F. Estimating coastal recession due to sea level rise: Beyond the Bruun rule. Clim. Chang. 2012, 110, 561–574. [Google Scholar] [CrossRef]
- Jung, W.Y.; Yoon, Y.S.; Sohn, Y.M. Predicting the remaining service life of land concrete by steel corrosion. Cem. Concr. Res. 2003, 33, 663–677. [Google Scholar] [CrossRef]
- Liang, M.T.; Jin, W.L.; Yang, R.J.; Huang, N.M. Predeterminate model of corrosion rate of steel in concrete. Cem. Concr. Res. 2005, 35, 1827–1833. [Google Scholar] [CrossRef]
- Wei, J.; Meng, H.; Xue, S.G. FEM analysis on the crack process of concrete cover induced by non-uniform corrosion of re-bar. J. Xi’an Univ. Archit. Technol. 2011, 43, 747–775. [Google Scholar]
- Zhao, Y.X.; Jin, W.L. Steel Corrosion-Induced Concrete Cracking; China Science Publishing: Beijing, China, 2016. [Google Scholar]
- Park, K.B.; Wang, X.Y. Effect of Climate Change on Service Life of High Volume Fly Ash Concrete Subjected to Carbonation—A Korean Case Study. Sustainability 2017, 9, 157–172. [Google Scholar] [CrossRef]
- Song, H.W.; Lee, C.H.; Ann, K.Y. Factors influencing chloride transport in concrete structures exposed to marine environments. Cem. Concr. Compos. 2008, 30, 113–121. [Google Scholar] [CrossRef]
- Marques, P.F.; Chastre, C.; Nunes, A. Carbonation service life modelling of RC structures for concrete with Portland and blended cements. Cem. Concr. Compos. 2013, 37, 171–184. [Google Scholar] [CrossRef]
- Marques, P.F.; Costa, A. Service life of RC structures: Carbonation induced corrosion. Prescriptive vs. performance-based methodologies. Constr. Build. Mater. 2010, 24, 258–265. [Google Scholar] [CrossRef]
- Weyers, R.E. Service life model for concrete structures in chloride laden environments. ACI Mater. J. 1998, 95, 445–453. [Google Scholar]
- García-Segura, T.; Yepes, V.; Alcalá, J. Life cycle greenhouse gas emissions of blended cement concrete including carbonation and durability. Int. J. Life Cycle Assess. 2014, 19, 3–12. [Google Scholar] [CrossRef]
© 2017 by the authors. Licensee MDPI, Basel, Switzerland. This article is an open access article distributed under the terms and conditions of the Creative Commons Attribution (CC BY) license ( http://creativecommons.org/licenses/by/4.0/).