Article

A Model for Assessing Pedestrian Corridors. Application to Vitoria-Gasteiz City (Spain)

1
Transport Research Centre (TRANSyT-UPM), Universidad Politécnica de Madrid, 28040 Madrid, Spain
2
Department of Forest and Environmental Engineering and Management, MONTES (School of Forest Engineering and Natural Environment), Universidad Politécnica de Madrid, 28040 Madrid, Spain
*
Author to whom correspondence should be addressed.
Sustainability 2017, 9(3), 434; https://doi.org/10.3390/su9030434
Submission received: 12 January 2017 / Revised: 10 March 2017 / Accepted: 13 March 2017 / Published: 16 March 2017
(This article belongs to the Special Issue Nature-Based Solutions for Urban Challenges)

Abstract

:
From a mobility perspective, walking is considered to be the most sustainable transport mode. One of the consequences of motor-oriented urban configuration on pedestrian mobility is urban fragmentation, which affects sustainability in cities. In this paper, we use a natural-based approach to landscape fragmentation and connectivity (inherited from landscape ecology) for pedestrian mobility planning. Our aim is to design a useful methodology to identify priority pedestrian corridors, and to assess the effects of implementing barrier-free pedestrian corridors in the city. For this purpose, we developed a method that integrates Geographical Information Systems (GIS) network analysis with kernel density methods, which are commonly used for designating habitat corridors. It was applied to Vitoria-Gasteiz (Spain). Pedestrian mobility was assessed by comparison of travel times between different scenarios. Results show that the implementation of pedestrian corridors reduces travel time by approximately 6%. Thus, an intervention in a small percentage of the city’s street network could considerably reduce pedestrian travel times. The proposed methodology is a useful tool for urban and transport planners to improve pedestrian mobility and manage motorised traffic.

1. Introduction

Assessing sustainability of urban environments is of great importance because more than 66% of the global population is expected to become urban by 2050 [1]. From the mobility point of view, walking is considered to be the most sustainable way to get around. It is cheap, it does not produce greenhouse gas emissions, it provides important health benefits and it is accessible to the majority of the population, regardless of their income level [2,3]. It is also a fundamental mode in intermodal travel chains, since every trip begins and ends by walking, but it is also an important form of access by itself [4]. Walking improves physical fitness and mental health, increases the opportunities for social interaction and permits engagement with the place encountered in the move [5]. Pedestrian-friendly design characteristics in neighbourhoods are associated with higher levels of sense of community and physical activity [6,7]. Furthermore, according to Speck [8], there is an increasing demand for pedestrian-friendly communities to the detriment of car-oriented developments, and walkability can be considered an economic driver.
The promotion of walking is essential for sustainability of cities. In addition to the above-mentioned economic, social and health reasons, increasing the share of sustainable transport modes reduces motor vehicle use along with its negative impacts in terms of pollution, noise, land take, congestion, etc. [9]. In recent years, transport policies have taken sustainable modes of transport such as walking and cycling into account [10,11]. However, sustainability in many cities has been compromised by motor-oriented urban developments, and it is recognised that more resources should be invested in improving facilities for pedestrians, the elderly and passengers with reduced mobility [12].
The consequences of urban motor-oriented configuration on pedestrian mobility have been a core concern for urban planners and researchers. In the last few years, research has been focused on studying the spatial characteristics of urban environments, such as urban density and sprawl, land-use mix distribution, connectivity and spatial configuration of streets, among other aspects [12,13,14,15,16,17]. These characteristics of city configuration are related to the concept of urban fragmentation, which affects sustainability through multiple costs (economic, social and environmental) [18]. From a spatial point of view, it can be understood as “the phenomenon resulting from the act of disjointing the pre-existing forms and structures of the city and city systems” [19]. From a transport planning perspective, urban fragmentation can also be understood as a lack of connectivity of the transport system [20]. Connectivity is the permeability enabled by the directness of links and the density of connections in a transport network [21] and, in the particular case of pedestrians, it can be defined by the directness of routes and the route distance for pedestrians for each trip [22]. Pedestrian connectivity is related to path continuity, sidewalk availability and the presence of physical barriers [23]. The reduction of pedestrian connectivity affects vulnerable social collectives with restricted mobility (the elderly, children, and people without access to a personal car [24]). It constitutes not only a threat to social cohesiveness, but also compromises urban sustainability by increasing car dependence [22]. Apart from these spatial characteristics of the city, individual travel behavior in pedestrian mobility is influenced by a number of factors that include cognitive aspects [13,25,26]. For example, Foltete et al. [13] consider that pedestrian traffic in the streets is a function of accessibility and landscape preferences. Landscape is also important in the perceived distance, in areas where it is more complex for travelers to remember a greater number of elements along their route, and individuals will perceive distances as longer [25]. Nourian et al. [26] propose that pedestrians encounter two types of impedances: a physical impedance in the length of the path and the slope, and a cognitive impedance in the change of direction, or turning at each junction.
The application of Geographical Information Systems (GIS) network analysis methods to urban environments has risen over the last few decades, mainly due to the increase in computational power, showing their capacity to measure a set of interesting urban singularities [27]. Street networks have been widely used to study and predict pedestrian movements throughout the city [28,29,30]. Traditionally, data on the amount of movement that a street withstands was collected with the gates method, by means of which pedestrians are counted in designated sections of streets distributed over the area of study [30,31]. Another approach used to study pedestrian frequency in streets is the compilation of complete pedestrian routes or recording regular trips of individuals participating in the study [13], or by using stalking observation methods [32].
Additionally, some authors consider urban fragmentation and connectivity as concepts inherited from landscape ecology [19,20]. In the literature, there are urban studies that incorporate spatial indicators commonly used in this discipline, for example [33,34,35]. Rotem-Mindali [19] applied least-cost modelling to study retail fragmentation and urban liveability through accessibility measurements, while other authors use spatial metrics to assess the integration of land use and transport or spatial disparities [33,36]. Ortega et al. [20] studied the effects of urban fragmentation in pedestrian connectivity using least-cost modelling in a city neighbourhood. In this regard, a widely used term in the study on landscape fragmentation is habitat corridor. These corridors are defined as “strips of suitable environment that enhance the movement of species among the habitat” [37]. Conservation of these corridors preserves target species and increases population viability by improving landscape connectivity [38]. In the last few years, several methods have been used to study habitat corridors, such as circuit theory models [39,40], graph theory models [41,42,43], and least-cost modelling [44,45,46]. Least-cost methods have also been used in combination with kernel density estimators in order to study landscape connectivity. Least-cost kernel surfaces have been combined with point sources of dispersal to create the “resistant-kernel estimator” [47]. This approach has been followed by [48] to study the connectivity of populations of African lions and the effects of implementing corridors. Teng et al. [49] studied connectivity in two stages. First, they calculated optimal routes between habitat patches by using least-cost modelling; and second, they performed a kernel density analysis on the routes obtained, with the objective of identifying potential conservation corridors.
In this paper, we aim to develop and apply a new method for assessing the effects of implementing pedestrian corridors. We consider that the ecological implications of the habitat corridor can be applied to pedestrians in their urban displacements. To this end, we will address three research questions. The first one covers the use of the natural-based approach to landscape fragmentation and connectivity to pedestrian mobility planning. The second regards the identification of priority pedestrian corridors, adapting the concept of habitat corridors from landscape ecology. The third one is related to the effects of implementing barrier-free pedestrian corridors on pedestrian mobility.
This paper is structured as follows: the following Section 2 describes the methodological approach, which combines kernel density methodologies with GIS network analysis tools to identify pedestrian corridors. In Section 3, the methodology is tested in a case study, Vitoria-Gasteiz, a medium-sized city in the north of Spain. Results are analysed in Section 4, and Section 5 contains the discussion of the results and conclusions, respectively.

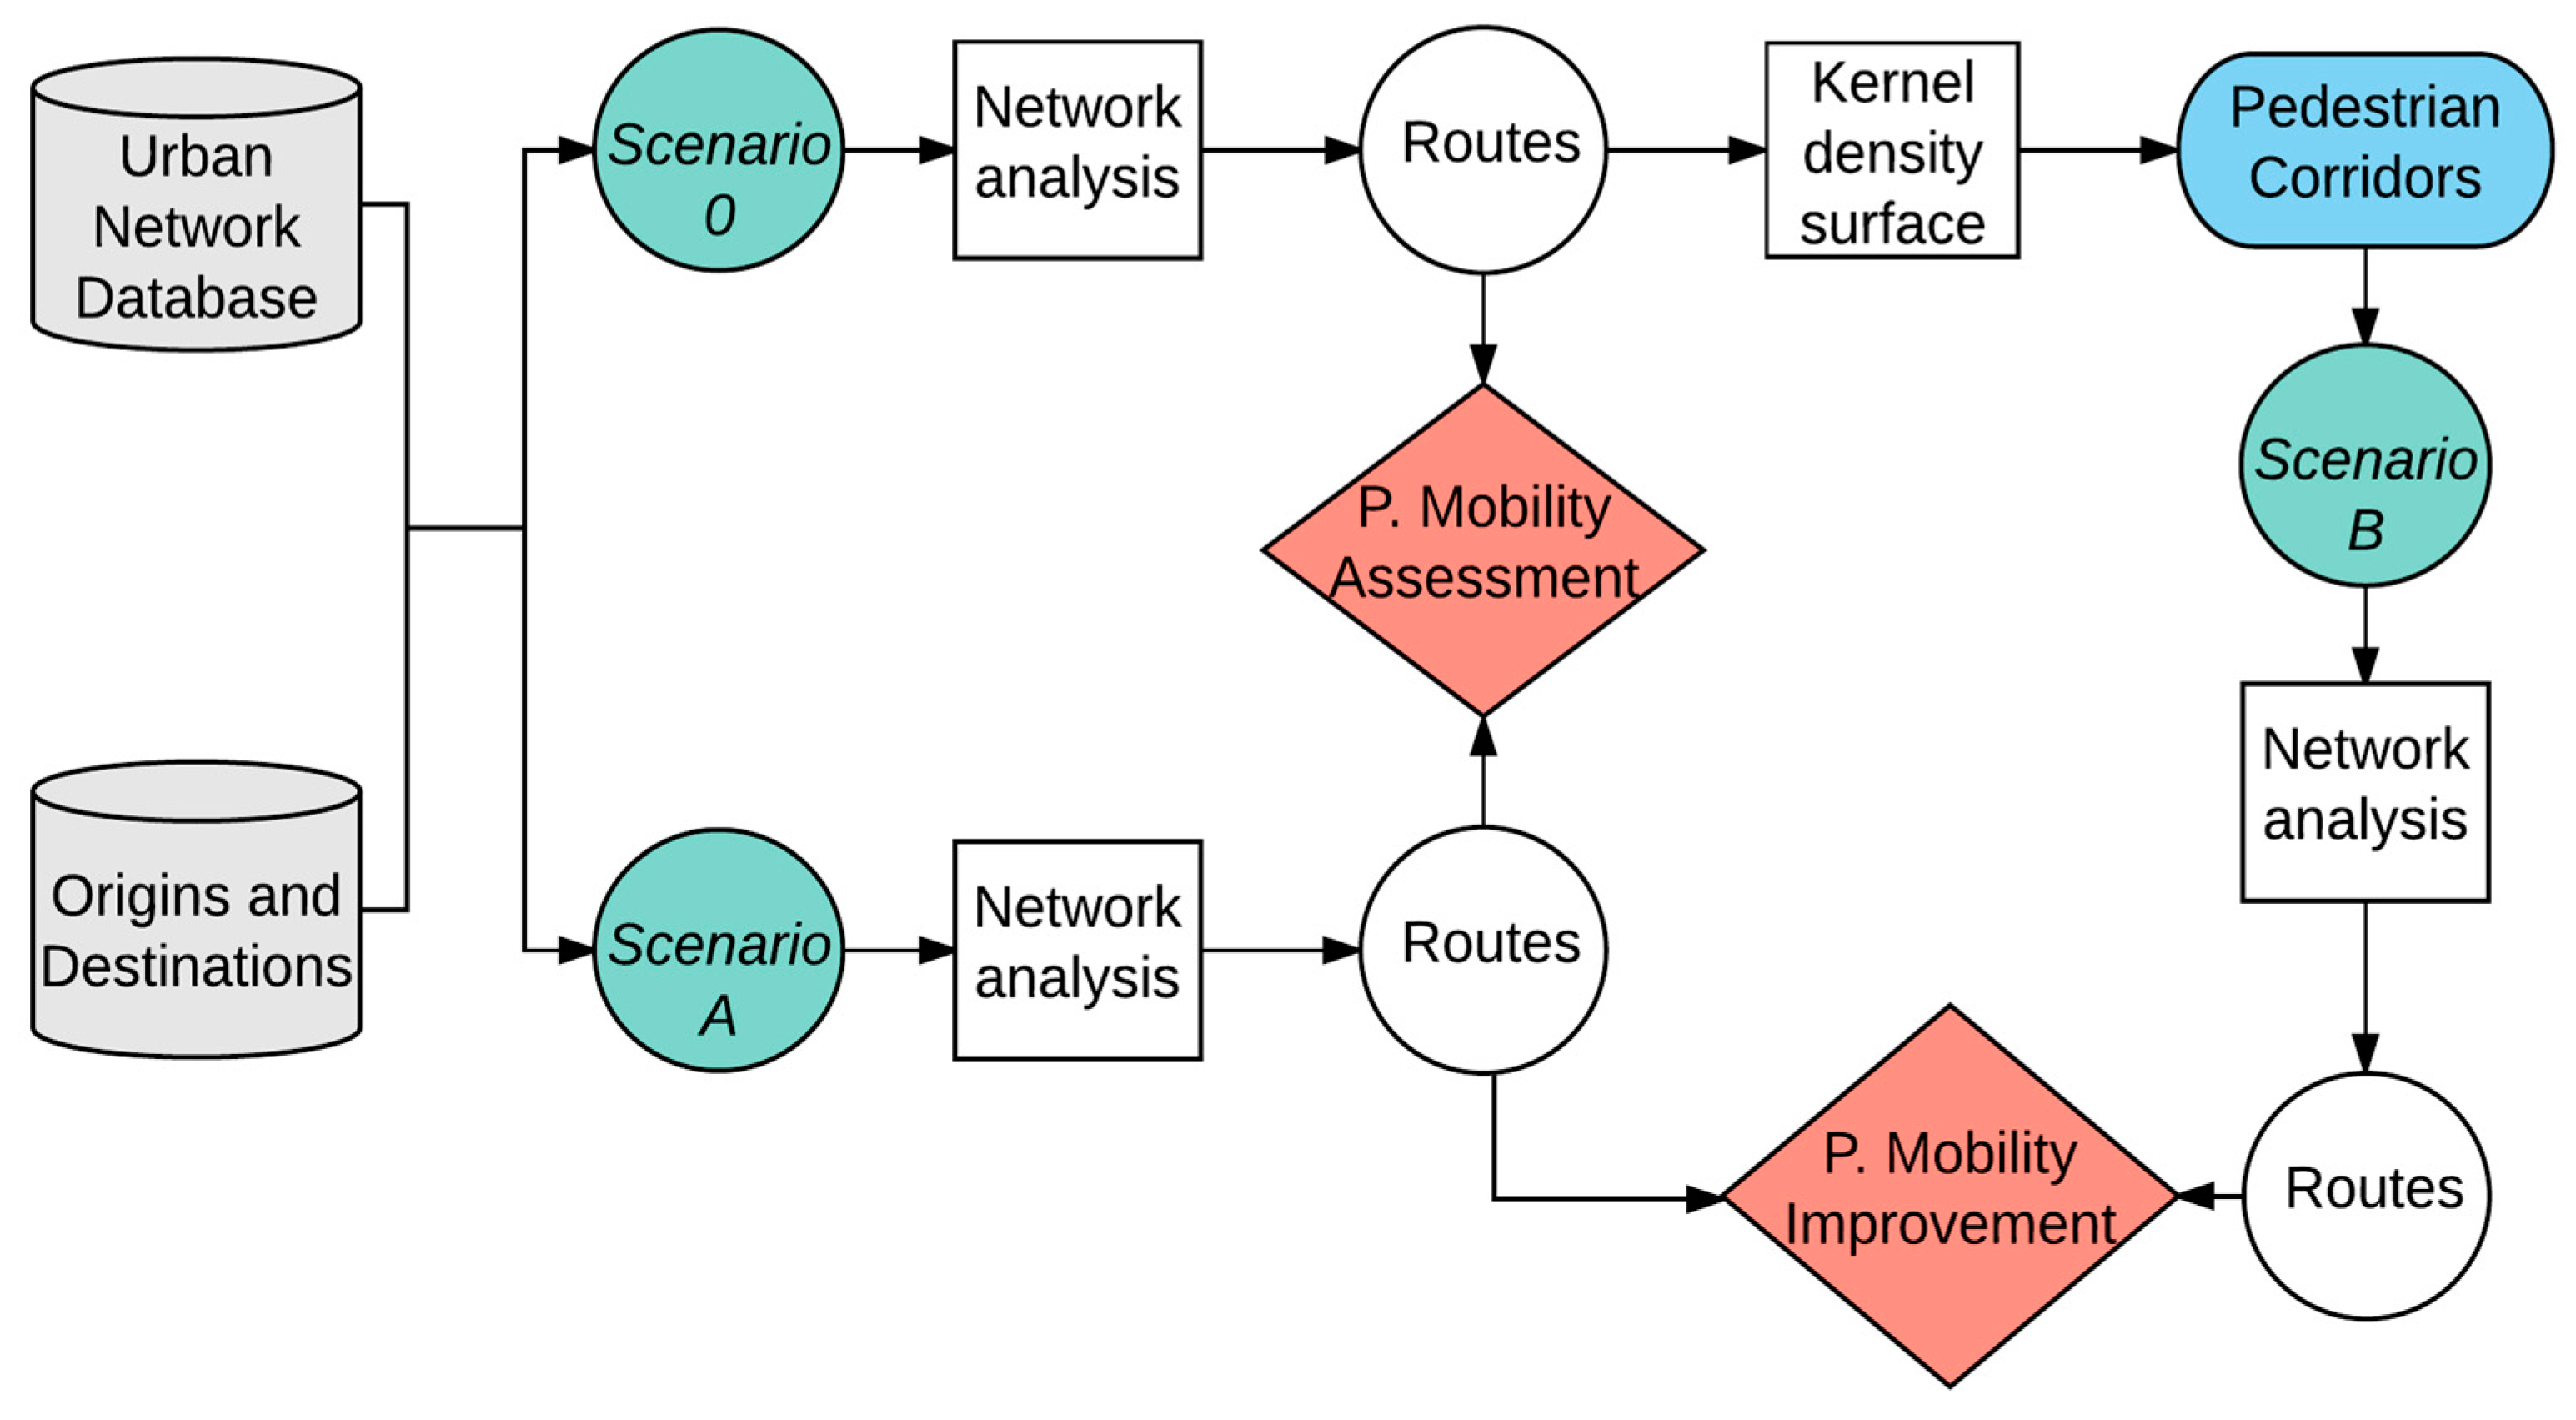
2. Methodology for the Assessment of the Implementation of Pedestrian Corridors

The method proposed uses origins and destinations of commutes and study trips to obtain optimal routes in terms of pedestrian travel times, in different scenarios. It has two main stages. First, network analyses are performed to obtain optimal pedestrian routes. These routes have a double purpose: (i) the assessment of the pedestrian mobility in a particular urban area; and, (ii) to serve as input in the second stage. The second stage identifies the streets that will constitute the pedestrian corridor network. Figure 1 shows our methodological approach.

2.1. Creation of Network Analysis Database

GIS network datasets should be created for the assessment. The main attribute that must be included in the network dataset is a displacement cost for each arc in the network. Usually, this cost is the travel time. Crosswalks and pedestrian crossings regulated with traffic lights are considered as barriers that increase the pedestrians’ travel time. Impedance times in crosswalks and pedestrian crossings differ from one crossing to another and among individuals. In the case of the crosswalks, factors such as the traffic on the street, speed limit, gender or age of individuals can influence the impedance time [50]. For the pedestrian crossing regulated with traffic lights, the main drivers of the impedances are the traffic light waiting times and the delay due to the interaction of opposing movements at the green light [51]. The final impedance times assigned for each barrier are obtained through field work or municipalities’ databases. Some studies also consider slope to be a factor that influences walking speed [26,52]. In this paper, we adopt the simplification consisting of the average values of the values proposed by Ortega et al. [20]. In their work, they modelled the pedestrian network with speeds and times at crosswalks and pedestrian crossings collected in field work.

2.2. Definition of Scenarios

Pedestrian mobility is evaluated by comparing average travel time on optimal routes in different scenarios. The first scenario (scenario 0) models the network dataset in an ideal situation, without barriers, for walking trips. In scenario 0, pedestrians can move freely through sidewalks and pedestrian streets. The second scenario (scenario A) includes real city barriers in the network (pedestrian crossings and traffic lights) that constitute impedances to walking. This is the actual city scenario, where pedestrian crossings and traffic lights reduce connectivity by increasing pedestrian travel times.
An additional scenario (scenario B) is designed for assessing pedestrian corridors. Its characteristics are explained in subsequent sections.

2.3. Calculation of Pedestrian Routes

In landscape fragmentation studies, origins and destinations are suitable habitat patches for the species under consideration. In this study, in which pedestrians in urban environments are considered, there is a wide range of possible origins and destinations for the network analyses, depending on the purpose of the trip (shopping, leisure…). In this paper, commuting and study trips are considered. Therefore, origins and destinations will be residential, work or study places. Outward and return trips are differentiated in order to study if there are any differences between them. Outward trips are those that have a home as origin, and a workplace or educational institution as destination, and return trips have a workplace or educational institution as origin, and home as destination.
Once the network datasets are created for each scenario, and origins and destinations are established, optimal routes and travel times are calculated. ArcGIS 10.2 (ESRI, Redlands, CA, USA) Network Analyst extension [53] is used to obtain minimum-cost routes between origins and destinations. This extension uses Dijkstra’s Algorithm in a vector format [54]. The ArcGIS tool used is closest facility, where origins are considered as facilities and destinations as incidents. When applying the closest facility tool in each scenario, the result is a layer with the total set of routes from all the origins to all the destinations.

2.4. Identification of Pedestrian Corridors

Pedestrian corridors are studied as a possible urban planning solution to improve pedestrian connectivity. We propose the following hypothesis: in the city, most streets support commuting and study routes, and they therefore play a role in city connectivity. However, some of these streets play a major role in pedestrian connectivity by supporting a higher number of routes. Thus, if these streets are identified, a set of actions could be implemented in order to reduce pedestrian travel times. The most straightforward action that could be performed is to remove barriers in these streets. These streets will be designated in this study as “pedestrian corridors”, as in landscape ecology “habitat corridors” are a priority for species conservation.
The routes obtained in the network analysis of scenario 0 are used to identify the travel routes in an ideal situation, in which pedestrians are not affected by pedestrian crossings and traffic lights.
In order to identify the streets that constitute pedestrian corridors, a linear kernel analysis on the set of routes is performed. The kernel density surface is calculated with the ArcGIS 10.2 kernel density tool [55]. The kernel density estimation for linear features creates a gridded continuous surface with a specified cell size that shows the density of events across a surface. A bandwidth distance is specified to determine the radius of the shifting circle in which linear events will be searched. Then, a kernel function is used to obtain the density contribution that corresponds to each cell inside the search radius for each linear event [56]. The kernel density surfaces resulting from each line are added. The result is the final kernel density surface that represents the total density of linear events across the grid [55]. The resulting raster layer contains the density of routes over the city, and is categorized into five classes, using the Jenks Natural Break method [57], to identify the streets with higher route density rates. Streets in the highest classes are identified as pedestrian corridors [49].
The ArcGIS tool output uses Euclidean distance to determine the density of events across a 2D planar space [55]. However, urban pedestrian routes are constrained to a network. Although there have been many efforts in the last few years to adjust the kernel density estimation to be used in networks, they were mainly restricted to the analysis of point events [58,59,60]. We address this lack of specific tools to analyze linear events across a network by controlling the cell size and the bandwidth according to the phenomenon studied. As the pedestrian routes used for the kernel density estimation are constrained across a network, they overlap. This leads to greater kernel values in cells on streets with a higher volume of routes.

2.5. Comparison of Scenarios

Pedestrian mobility assessment is carried out by first considering the real barriers of the city, and then by considering the implementation of pedestrian corridors.
Pedestrian mobility in the city is assessed by comparing scenarios 0 and A. The resulting average time in the set of routes calculated in scenario A are compared, in terms of relative percentage, to the average travel time of the ideal set of routes obtained in scenario 0.
Improvement through the implementation of barrier-free pedestrian corridors is assessed by considering a new scenario (scenario B). The travel times obtained using a barrier-free network dataset in the pedestrian corridors (scenario B) are compared as relative percentage difference with those obtained in scenario 0 and scenario A.

2.6. Validation Using Control Scenarios

Finally, average travel times in control scenarios are calculated in order to test the results of scenario B. Their purpose is to verify that removing barriers in pedestrian corridors is more effective than reducing barriers at random locations. Control scenarios are generated by removing a number of randomly located barriers, and calculating pedestrian travel times by using the method explained in Section 2.3.

3. Application to the Case Study

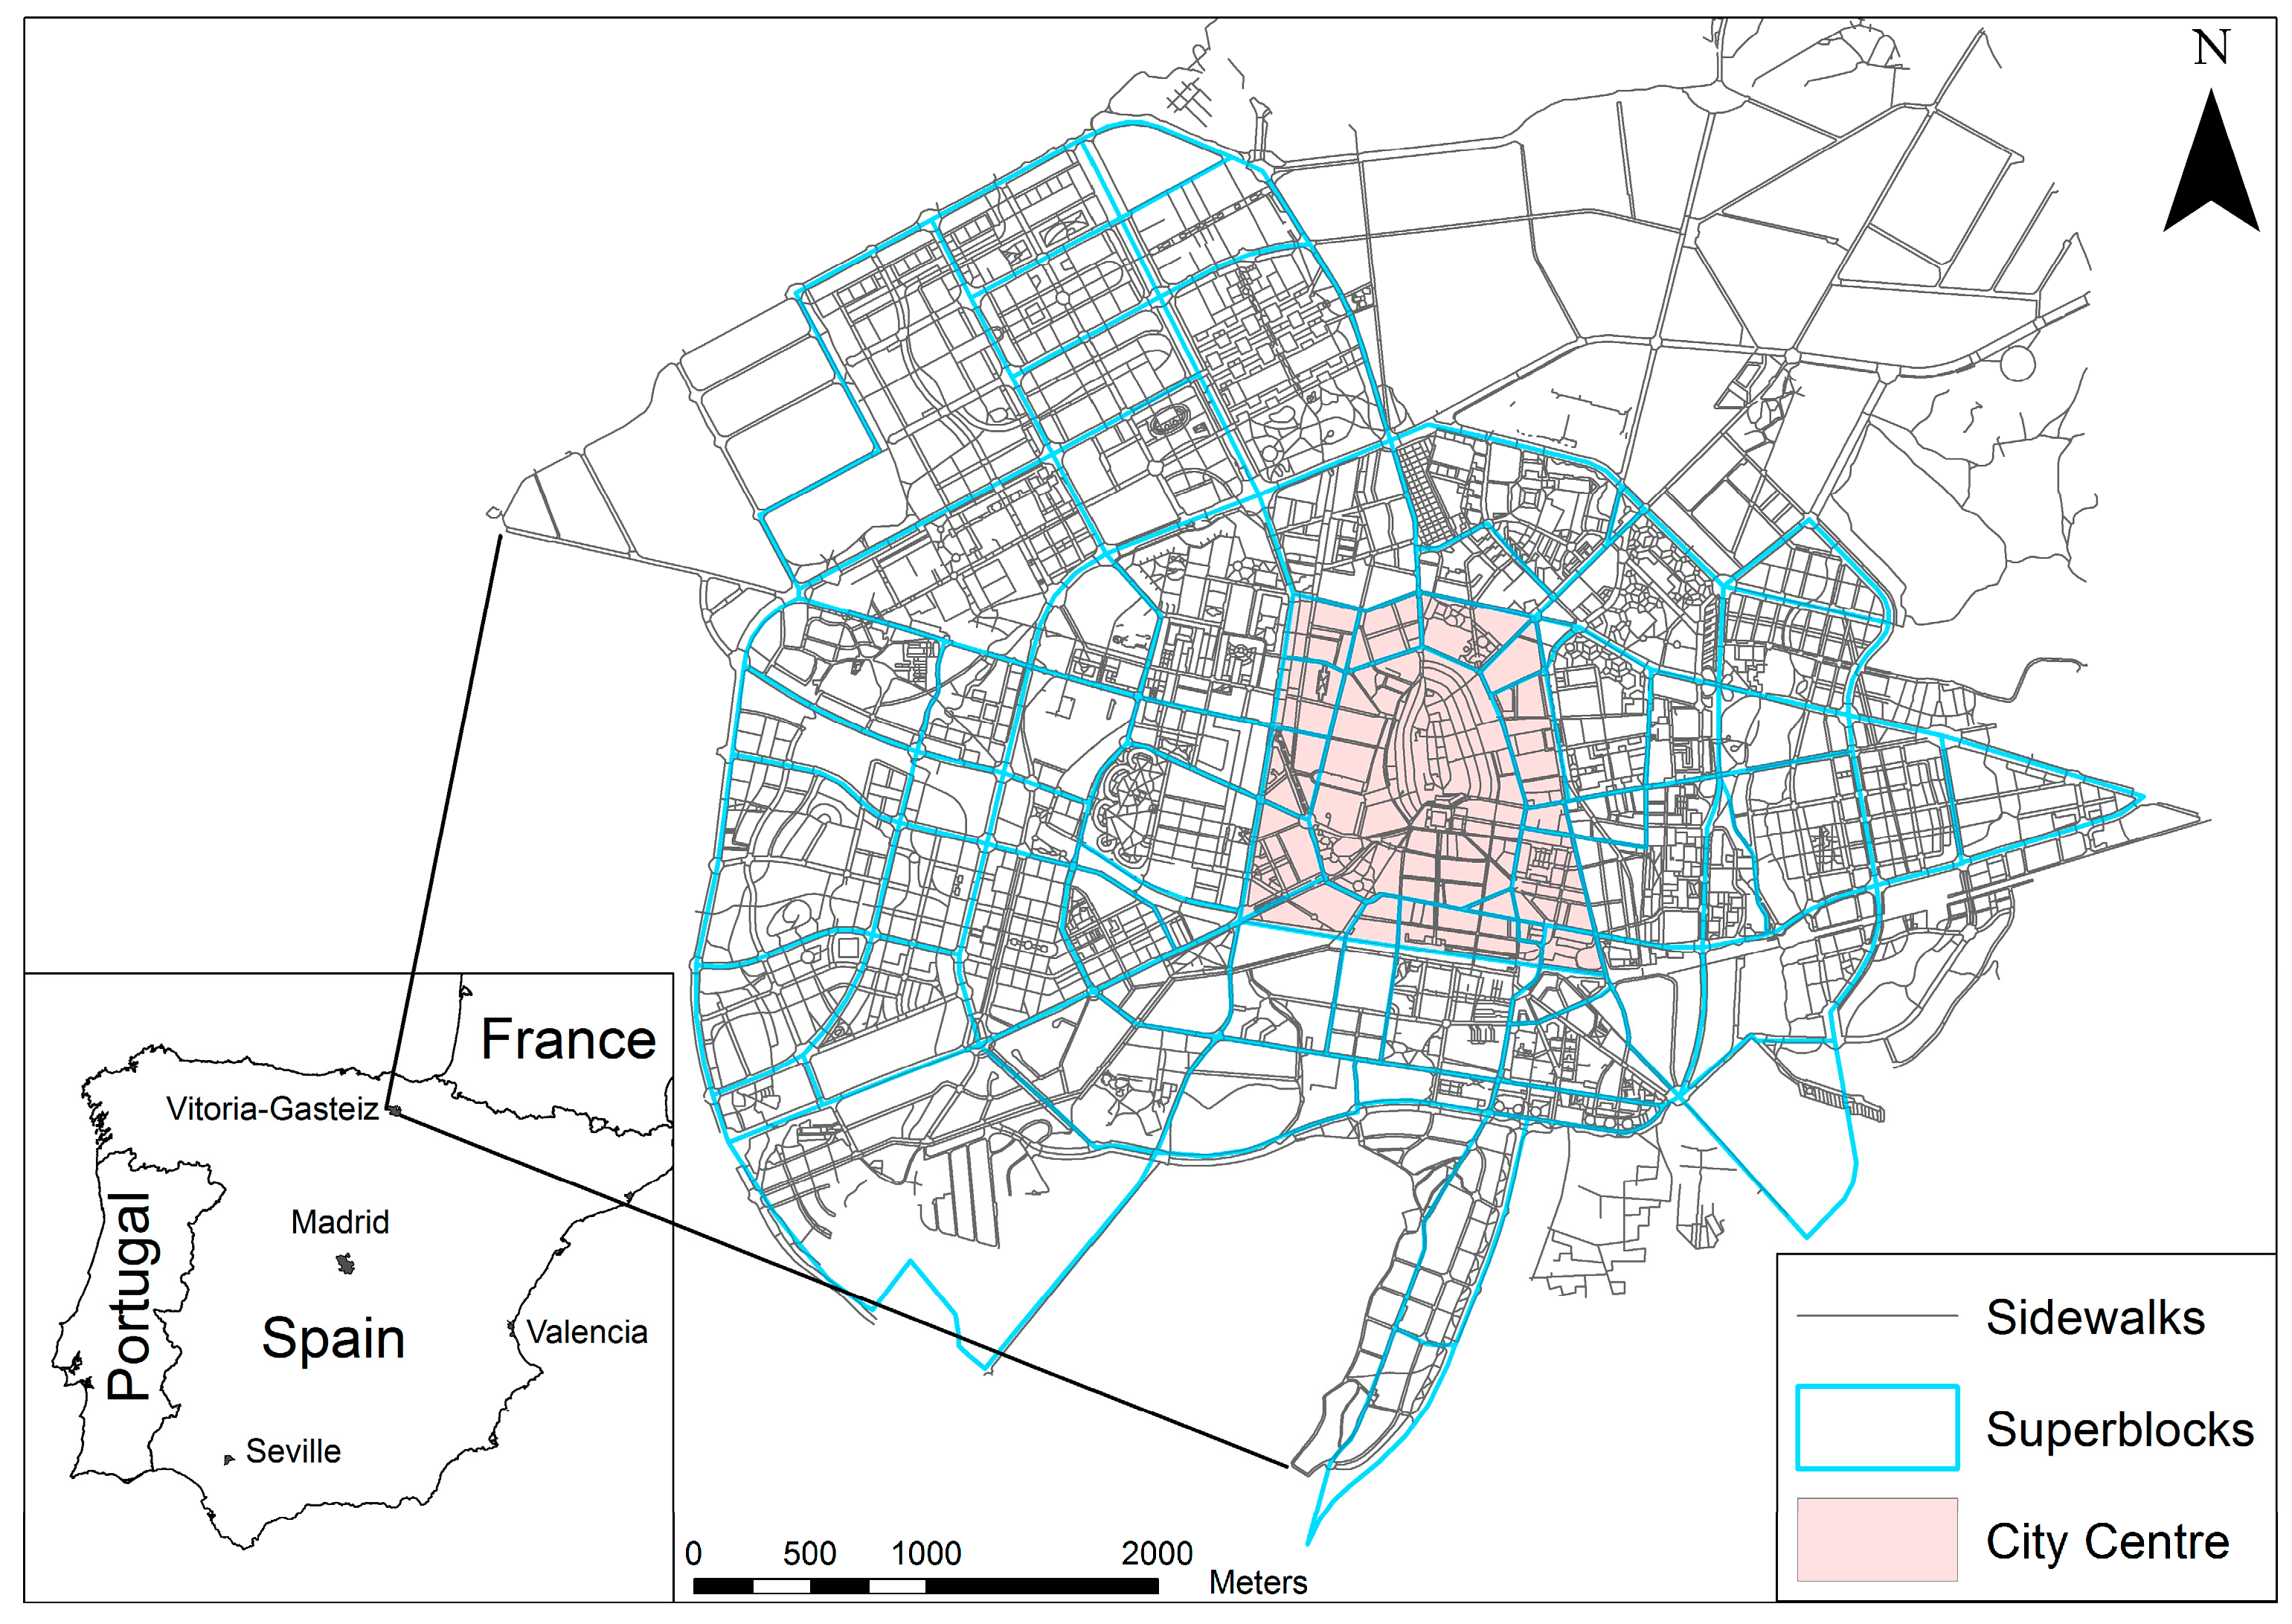
3.1. Description of the Study Area

The Vitoria-Gasteiz municipality is located in the north of Spain, in the Alava province, one of the three provinces of the Basque region. The municipality has 63 population cores, with a total population of 244,000 inhabitants in 2015. The great majority of inhabitants live in the main urban area of the namesake Vitoria-Gasteiz city.
Since Vitoria-Gasteiz is a compact city with smooth orography and a relatively temperate climate, it is very suitable to the use of active transport modes, such as walking and cycling. This fact is corroborated by the latest mobility surveys that showed that active transport modes have been consistently increasing over the past years [61]. The main driver behind this increase is the implementation of the Mobility and Public Space Plan from 2007 [62]. This Plan created the environment to support sustainable transport modes by implementing different measures. Among other actions associated with active transport modes, some of the streets on the urban centre were pedestrianised, and the implementation of “Superblocks” is planned. These are urban zones where the plan is to transfer motorized transport to the perimeter streets, thereby giving maximum preference to pedestrians in the inner streets. The main intention behind implementing Superblocks is to liberate public spaces in favour of pedestrians while increasing connectivity [63]. Figure 2 presents the location map of Vitoria-Gasteiz.

3.2. Assessment of the Implementation of Pedestrian Corridors

The following is a description of the methodology described in Section 2, applied to Vitoria-Gasteiz.

3.2.1. Creation of Network Analysis Database

In order to create the GIS network dataset, free data from OpenStreetsMap (OSM) was used [64]. Given that this study mainly focuses on pedestrian movements, sidewalks and pedestrian street layers were extracted from the GIS polyline layer. OSM data for Vitoria-Gasteiz was quality checked with the municipality CAD layers and with aerial orthophotography of Vitoria-Gasteiz from the Aerial Orthophotography National Plan (PNOA). Pedestrian crossings and traffic lights for pedestrians were digitalized from the aerial orthophotography, and by using a traffic light point layer provided by the municipality.
Origins and destinations were extracted from the Municipal Household Travel Survey (MHTS) from 2014, which studied the population trips in a typical workday. The Survey used a stratified random sampling method (by transport zones, age and gender of the individuals) in order to acquire a representative sample of the citizens’ trips. The survey consisted of a sample of 4192 persons who were interviewed by phone in order to collect information on their trips the previous working day [65]. All the types of trips were considered in the survey (commuting, shopping, leisure, etc.). From the trips contained in the survey, a total of about 10,000 were walking trips, approximately 54% of the total, of which 1400 were commuting trips.

3.2.2. Definition of Scenarios

In the assessment of pedestrian mobility of Vitoria-Gasteiz, two scenarios were considered (scenario 0 and scenario A) and, consequently, two network datasets were created with the OSM network as a basis.
The scenario 0 models the network dataset in an ideal barrier-free situation for walking trips. Vitoria-Gasteiz has a flat topography, so a single travel speed of 4 km/h (1.1 m/s) was considered for the analyses, which is consistent with literature values [66,67].
The specific impedances for scenario A were digitalized and included in the corresponding network dataset. Since there was no information available on average waiting times at pedestrian crossings or traffics lights, average times were calculated from those obtained by Ortega et al. [20] in Madrid (Spain). An average waiting time of 0.1 min was applied as impedance for pedestrian crossings, and 0.7 min was applied as impedance to crossings regulated with traffic lights. For each arc of the GIS network dataset, the pedestrian travel time was also calculated with the 1.1 m/s speed, adding the impedances times to the arcs corresponding to the barriers.
The following sections explain the definition of the additional scenario (scenario B), which was designed to assess pedestrian corridors.

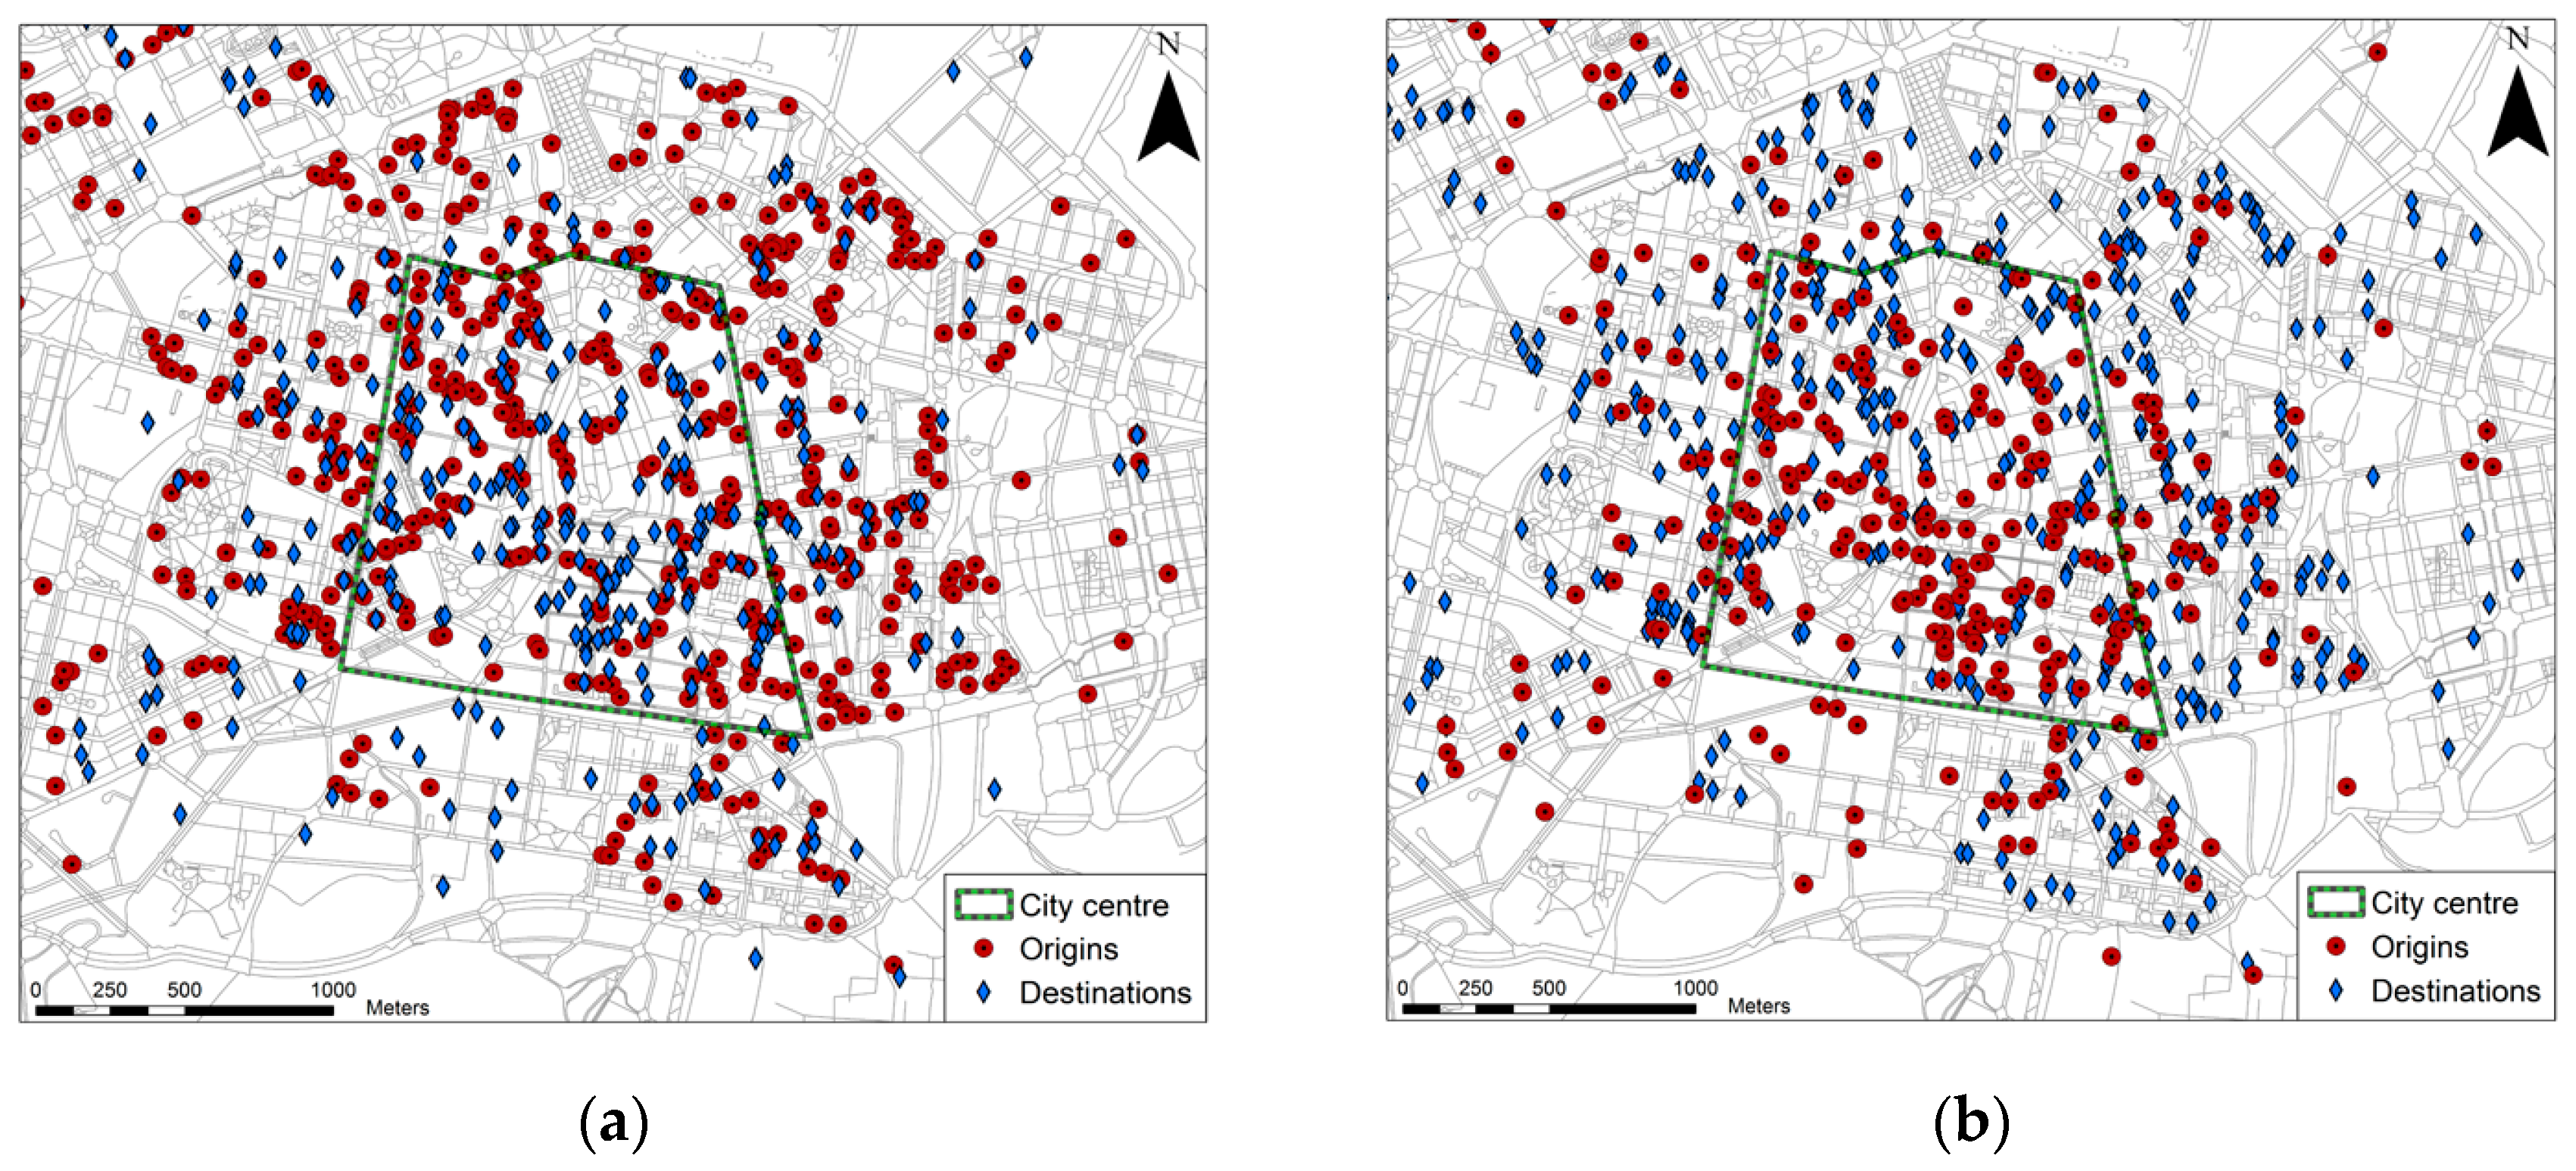
3.2.3. Calculation of Pedestrian Routes

Origins and destinations of commuting and study walking trips were obtained from the MHTS. Two groups of trips were considered: the first group contains those that have a home as origin and a workplace or educational institution as destination (702 trips); the second trip group contains the return trips to home (640 trips). These numbers differ because each person could choose different methods of transportation for the outward and return trips (e.g., public transport, public bicycles...), or have a destination other than home for the return trip. In Figure 3, origins and destinations for both groups are shown.
Figure 3 shows different patterns between the two groups. For the first group (outward trips), a greater amount of origins are in the outer residential zones and the destinations are more concentrated in the city centre. As expected, the contrary occurs for the second group (return trips), where the origins are more concentrated in the inner part of the city and destinations in the residential zones.
GIS closest facility analyses were performed in scenario 0 and A for each of the two groups of origins and destinations. All the possible routes from each origin to all the destinations are computed. The origins and destinations were considered in the calculations the number of times that they were recorded as a part of a trip in MHTS. Thus, origins and destinations are weighted as a function of their frequency in the MHTS. A total of approximately 900,000 routes were generated in each of the scenarios (702 × 702 + 640 × 640) and the travel time of each one was computed.
Finally, 1342 routes (702 outward routes + 640 return routes) that connect the origins and destinations declared in the MHTS were extracted from the total in each scenario.

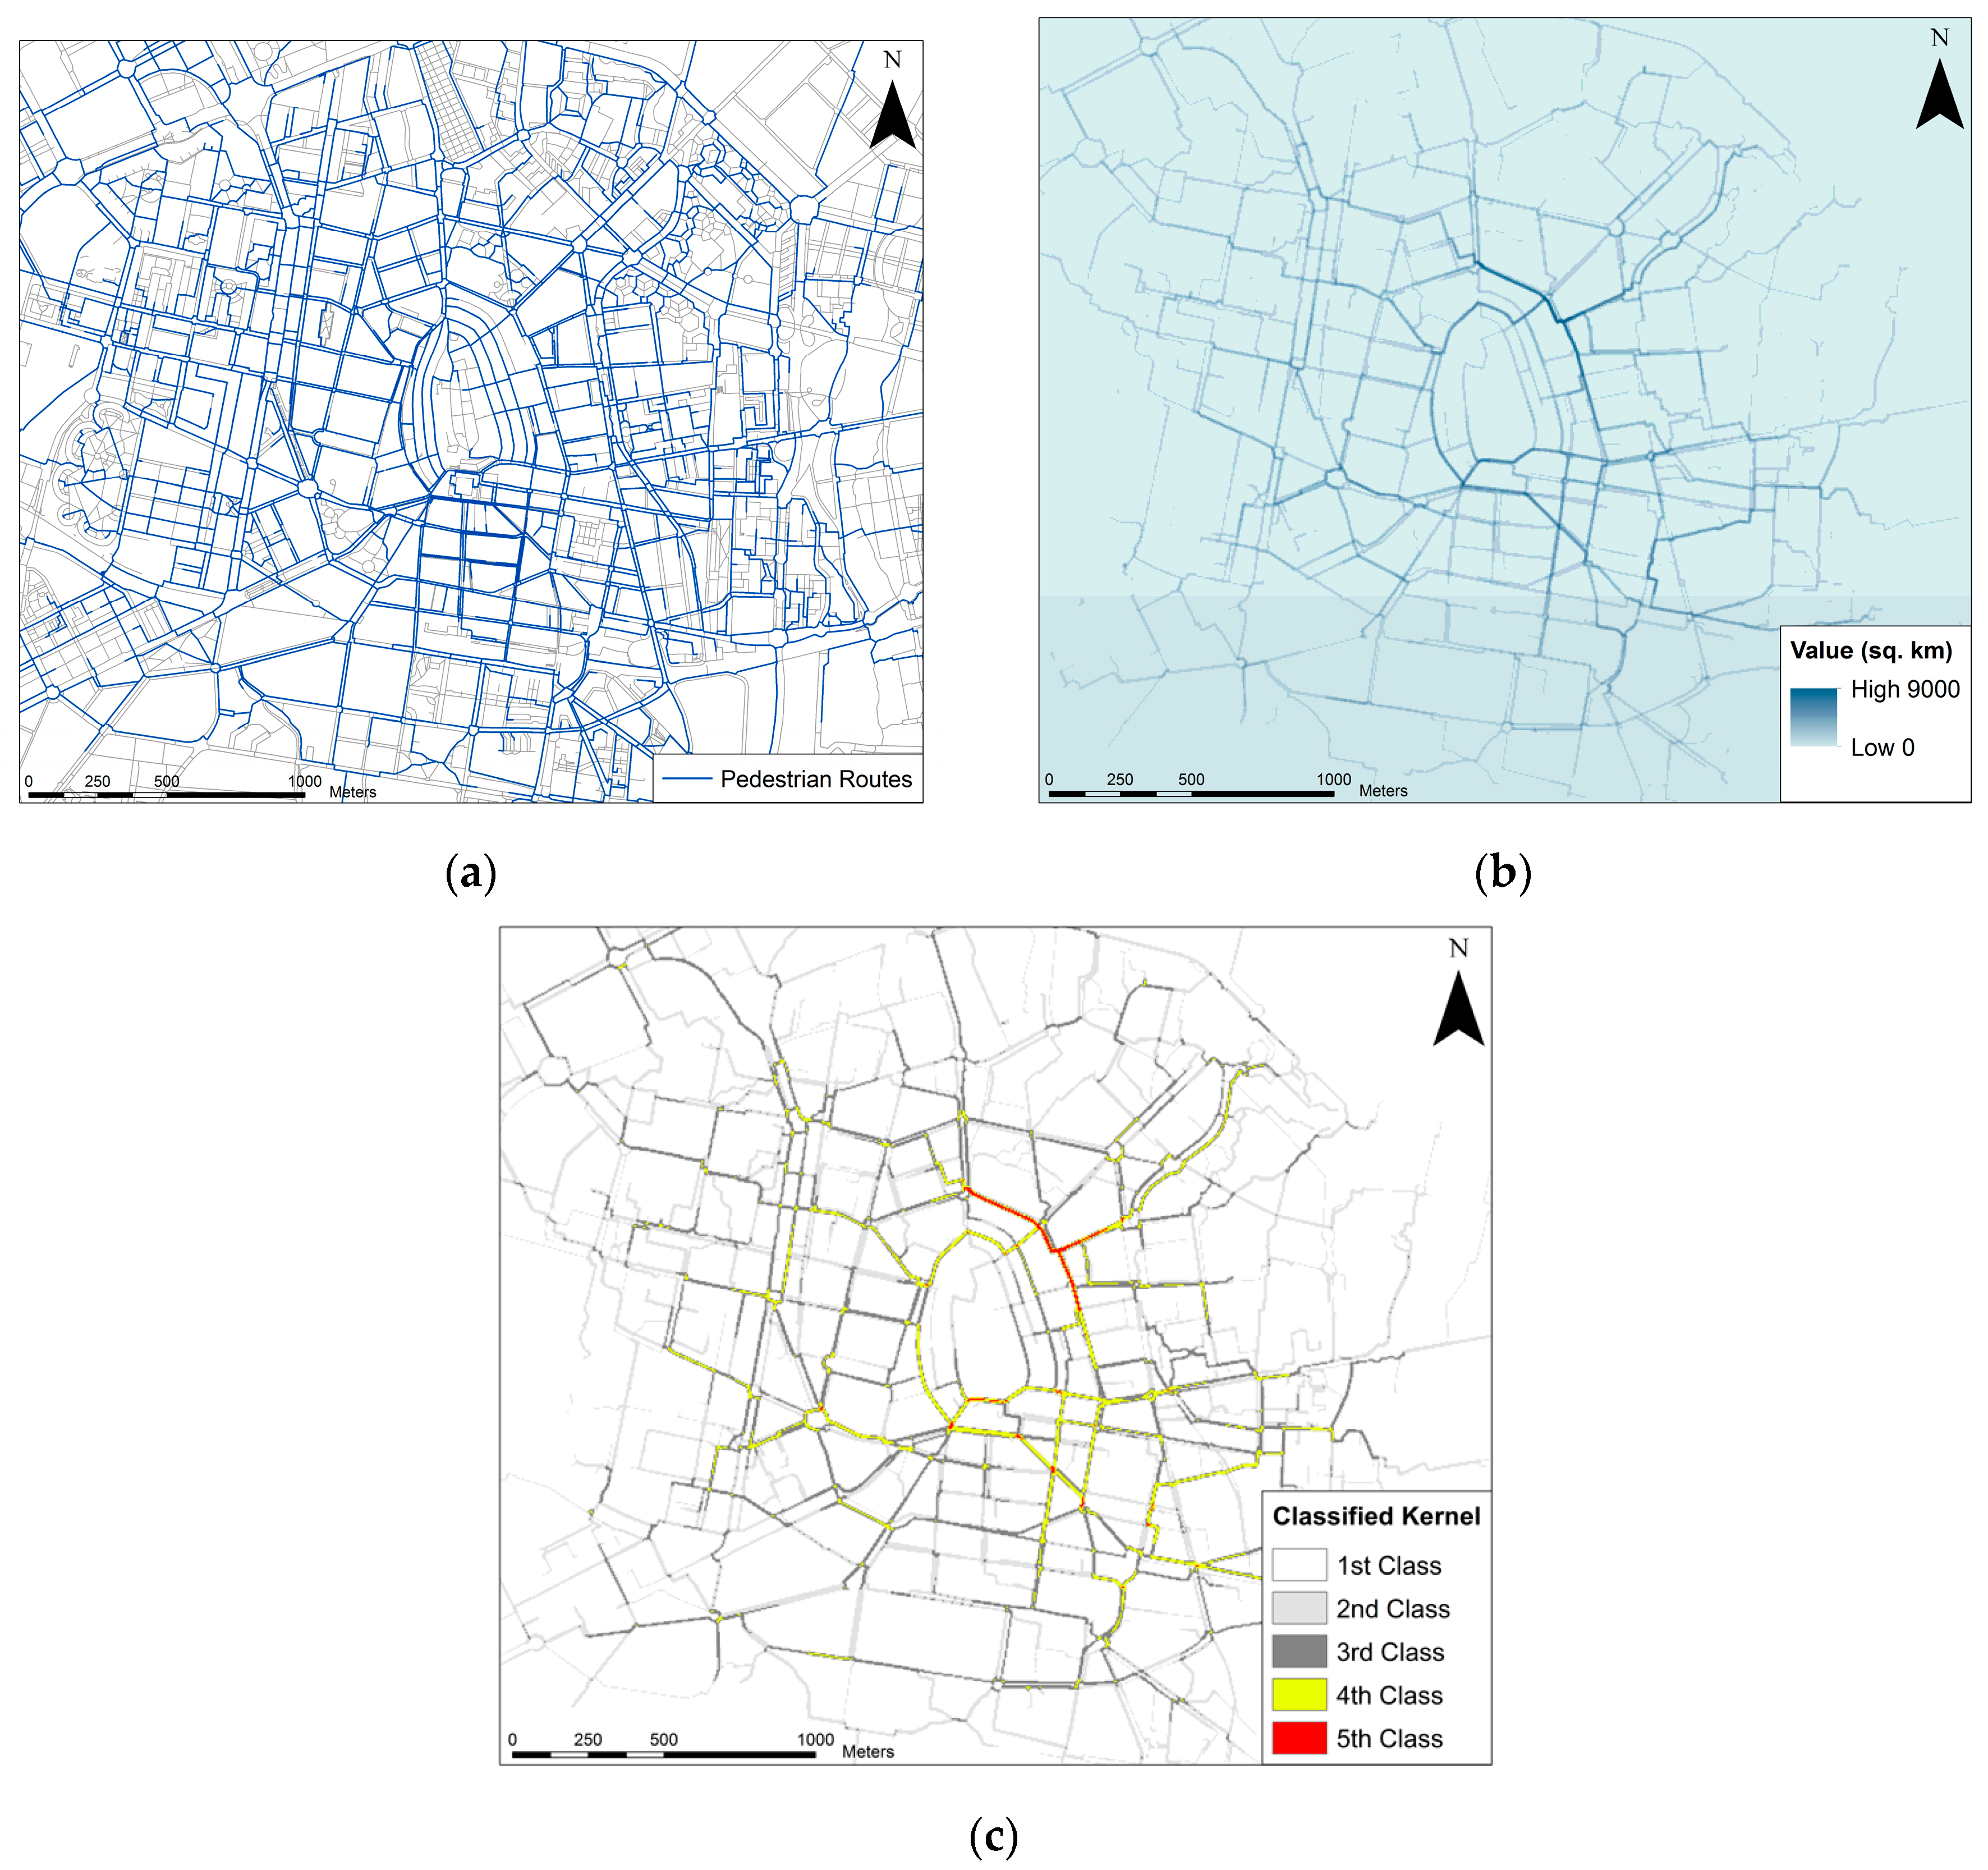
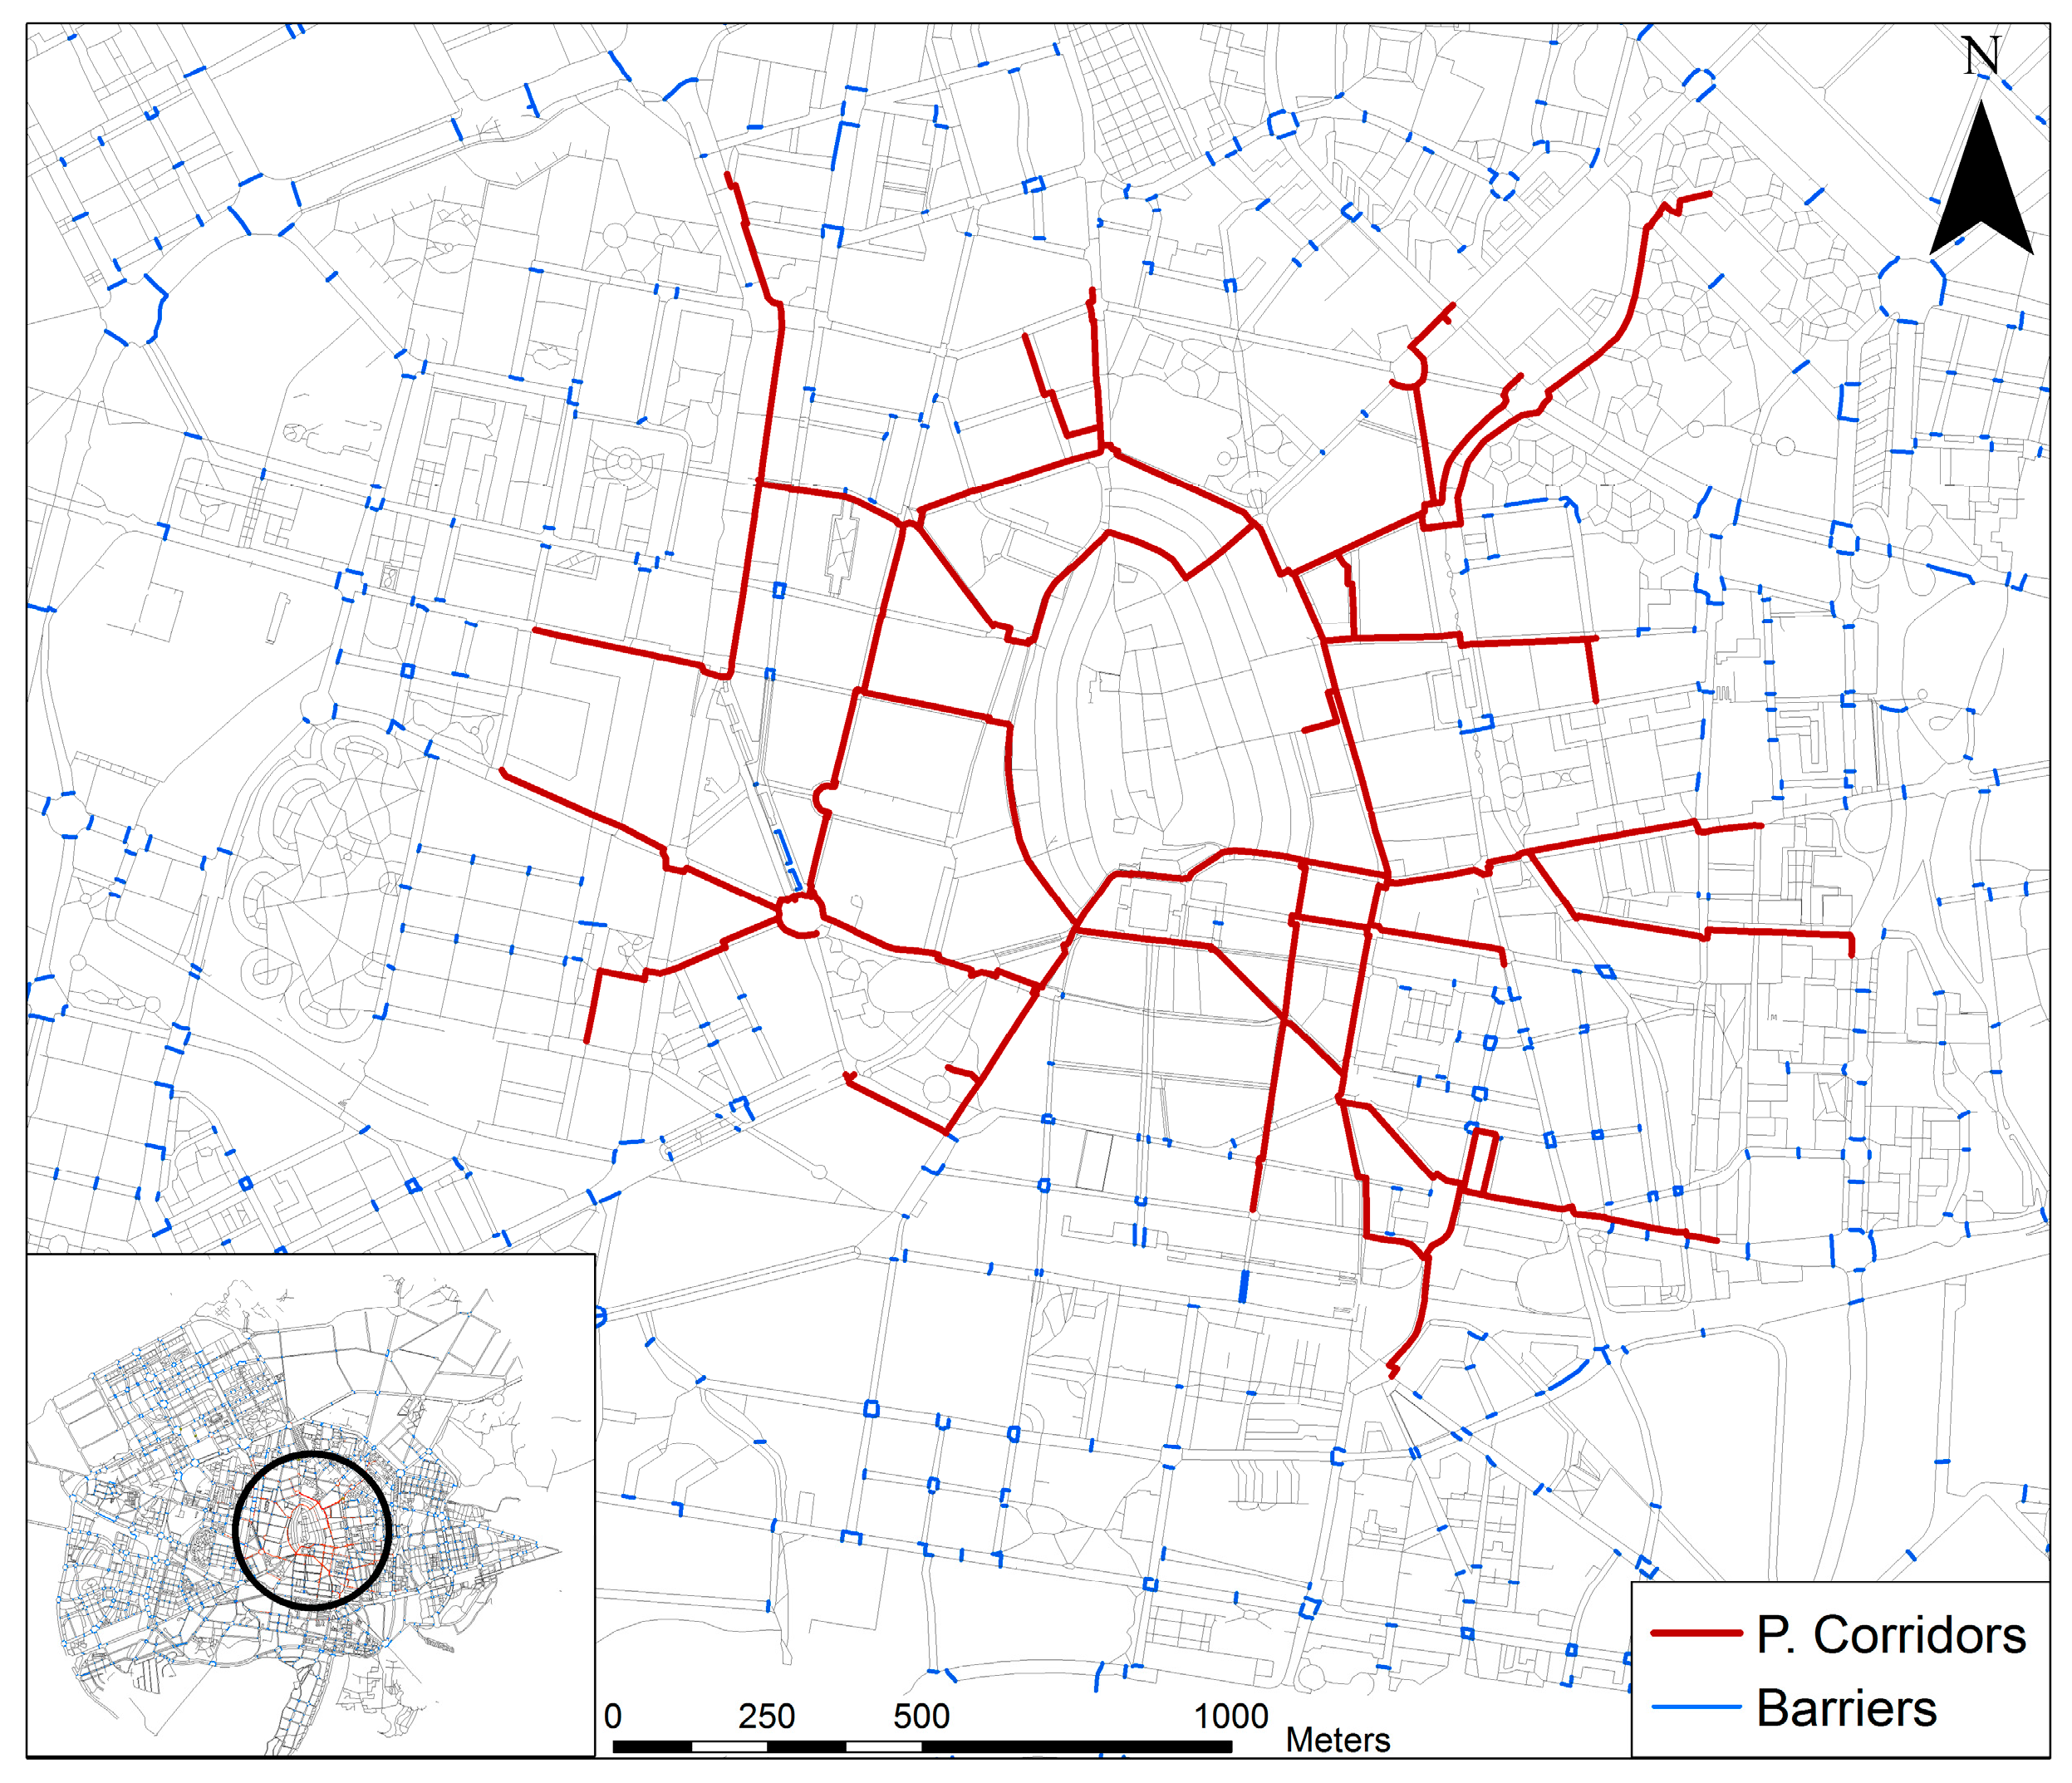
3.2.4. Identification of Pedestrian Corridors

A GIS kernel density analysis was performed with the 1342 routes obtained in scenario 0 (barrier-free). This density raster layer was classified into five natural breaks using the Jenks method as shown in Figure 4: in Figure 4a the optimal routes are superimposed over the city street network; Figure 4b shows the resulting kernel density surface obtained with the routes layer (using a 5 m pixel and a 10 m bandwidth); in Figure 4c, the kernel density surface raster is classified into five classes. Finally, the 4th and the 5th classes were selected as pedestrian corridors.
The resulting network of pedestrian corridors for Vitoria-Gasteiz (Figure 5) has a total of 13 km, occupying 1.5% of the total length of the city network. In general, pedestrian corridors are streets inside the city center or streets that connect the center with residential zones.
Scenario B is created by removing the barriers from the pedestrian corridors. A total of 207 barriers were removed, which suppose around 10% of total barriers in the city (Table 1). A higher proportion of pedestrian crossings with traffic lights were removed, in comparison with pedestrian crossings with crosswalks.

3.2.5. Results: Comparison of Scenarios

We calculated the relative percentage difference between the average travel times in the scenarios (scenario 0, scenario A and scenario B).
Two result sets for each scenario are considered, and each result set is divided into average travel times on outward and return routes. The first result set is composed of the routes between the origin destinations obtained from the MHTS (Table 2 and Table 3). The second result set contains every route obtained from the GIS closest facility analysis (Table 4 and Table 5). In this case, we assume that all destinations will be reached from each origin, and vice versa.
Regarding the first result set, the average travel times in scenario 0 are slightly below 18 min, while for scenario A, they are around 20 min (Table 2 and Table 3). In scenario B, with the pedestrian corridors already implemented in the network, the average travel times decrease to similar values as scenario 0. It is observed that, for the three scenarios, average times are slightly higher for the return routes than the outward routes.
In Table 2 and Table 3, average travel times are compared with the average travel times declared in the MHTS. The average times declared in the outward routes are lower than the value obtained in scenario 0. In contrast, the average time declared for the return trips is slightly higher than the value obtained for scenario 0, and much higher than average times declared for outward trips.
The second result set (average times in all the calculated routes) is shown on Table 4 and Table 5. Higher average times are observed in comparison with the first results set (Table 2 and Table 3). Average times for scenario 0 are approximately 11% lower than those obtained in scenario A, as occurs with the first result set. Results in scenario B are similar to those obtained in scenario 0 (barrier-free). This may indicate that pedestrians are closer to moving in the barrier-free city through the implementation of pedestrian corridors.
It should be noted that similar average distances for routes were obtained in the three scenarios for each result set. Average distances are higher in the second result set (as occurred with average times) (Table 2, Table 3, Table 4 and Table 5). This indicates that travel time differences between scenarios are caused by the existence of barriers, such as crosswalks and traffic lights.
It is observed (Table 4 and Table 5) that there is an increase of around 12% from scenario 0 to scenario A. With the corridor implementation (scenario B), there is an increase in average travel time of 4%–5% in comparison with scenario 0. However, the decrease in average travel time between the network with all the barriers (scenario A) to the network with the pedestrian corridors implemented (scenario B) is around 6%–7%. This is important since, in scenario B, barriers were removed in only 1.5% of the total network length.

3.2.6. Validation of Results with Control Scenarios

Travel times on optimal pedestrian routes were calculated in 35 control scenarios, in order to compare them with the results obtained with the implementation of pedestrian corridors. Thirty-five network datasets were constructed by randomly removing a similar number of barriers, as in scenario B (see Table 1), instead of removing those located in the pedestrian corridors. Once the networks were constructed, pedestrian travel times were obtained with the method explained in Section 2.3.
The aggregated results in the control scenarios are shown in Table 6. For both the outward and return trips, the mean results are higher than the average travel times obtained in scenario B, and lower than those in scenario A (Table 2 and Table 3). These results indicate that our proposed barrier-free pedestrian corridors (scenario B) are more effective in terms of travel-time reduction than randomly removing barriers across the city.

4. Discussion

This study obtains travel times from optimal routes in several networks (scenarios). We evaluate commuting and study trips. On these trips, travel time is particularly important, since individuals tend to use the more direct route on the considered trips. Nevertheless, it should be noted that this is a simplification. The duration of the route is not the only factor affecting pedestrian choices. Their preferences are also influenced by the built environment and cognitive factors [13,25,26], which could be taken into account in the model when defining impedances to walking in further research.
The results show similar average distances on routes for all scenarios in comparison with the differences in times (Table 2, Table 3, Table 4 and Table 5). In this study, pedestrian mobility is assessed by comparing travel times in different scenarios, since it can be expected that time is key factor in commuting and study trips, regardless of variations in distance. In the literature, several authors transform pedestrian distances into pedestrian walking times to study pedestrian accessibility [20,68,69]. Similar average distances accompanied by different average travel times in the scenarios indicate that the existence of barriers (such as crossings and traffic lights) have important implications in pedestrian mobility. However, pedestrian transit accessibility has also been commonly measured by maximum walkable catchments based on distances [36,70,71,72,73,74].
Results show that average declared times in MHTS (Table 2 and Table 3) are within the range of average times obtained in the GIS network analyses. The higher declared times obtained on the return trips (Table 3), in comparison with the outward trips (Table 2), could indicate that individuals took longer routes for shopping or leisure in their return trips. Also, for both result sets, the trips declared in MHTS are either considerably below (outward routes), or within the range (return routes) of those obtained with GIS using the barrier-free network, which is contrary to what would be expected. This might be explained by various factors: (i) we considered an average speed of 4 km/h in the GIS calculations; (ii) routes chosen by the individuals could be different from the optimal computed routes due to personal preferences; and (iii) the difficulty of individuals in estimating their walking trip times, as stated by [25].
The implementation of pedestrian corridors reduces pedestrian travel time, as our results show. Pedestrians are closer to moving freely across the city and their travel time is reduced. This fact could contribute to increasing the percentage of walking trips. Nevertheless, this study only takes into account the point of view of pedestrian movements. Therefore, an important factor, such as the effects that the elimination of barriers could have on motorized traffic, is not evaluated. Traffic lights and pedestrian crossings cannot be removed. However, as discussed by Noland [69], on streets with high pedestrian movements (like the proposed pedestrian corridors), traffic signals may prioritize pedestrians to reduce pedestrian delay. Further research could include practical means in the implementation of pedestrian corridors and a cost-benefit analysis.
The application of the proposed methodology to define pedestrian corridors has proven that, by influencing a small percentage of the network (1.5%), pedestrian travel times may be reduced (6%–7%). Results obtained in the control scenarios corroborate the fact that the effects of implementing barrier-free pedestrian corridors are better than those obtained by eliminating barriers at other locations in the city.
We found that pedestrian corridors are mainly located in streets surrounding the city center (Figure 5). This is because it is a pole of attraction for pedestrian routes, since it has a high number of commute and study destinations. Furthermore, some of the main streets that connect residential zones to the city center were designated as pedestrian corridors. Another important result is that most of the designated pedestrian corridors are major arterial connectors that bear high levels of motorized traffic, and are the limits of superblocks. This issue is a challenge for urban and transport planners, who should find an equilibrium between improving pedestrian mobility and managing motorized traffic.

5. Conclusions

This study responds to the research questions formulated. We have applied the natural-based approach of landscape fragmentation and habitat connectivity to pedestrian mobility planning. Specifically, we have adapted the concept of habitat corridors from landscape ecology to the identification of priority pedestrian corridors, and studied the effects of their implementation on pedestrian mobility.
Based on a mobility survey with pedestrian origin and destinations, and by combining network analysis and a kernel density analysis, a theoretical approach was applied in Vitoria-Gasteiz in order to assess the city’s pedestrian travel times and study the effects of implementing pedestrian corridors across the city. This study is an example of how the elimination of barriers to pedestrian movements could reduce commute and study travel times, and therefore increase urban connectivity.
The results show that influencing a small percentage of the city’s street network could reduce pedestrian travel times. Pedestrians are closer to moving freely across the city, and this could contribute to increasing the percentage of walking trips. However, most of the designated pedestrian corridors are major arterial connectors, and the effects that eliminating barriers might have on motorized traffic are not evaluated in this study.
Therefore, our methodology could be a useful tool for urban and transport planners to improve pedestrian mobility and manage motorized traffic. These corridors may be used to improve overall connectivity of the city by removing pedestrian barriers. It can also help to locate priority sites for traffic lights and new facilities for pedestrians. All of these measures contribute toward achieving sustainable mobility, and, therefore, greater sustainability for the city.

Acknowledgments

The authors would like to thank the Municipality of Vitoria-Gasteiz (Environmental Studies Centre) for their support and for providing the GIS databases, and Rodrigo Cuevas for his valuable work in this research. We also thank to the reviewers for their comments, which have improved this paper. Map data copyrighted OpenStreetMap contributors and are available from http://www.openstreetmap.org.

Author Contributions

This paper was conceived and wrote jointly by the authors. Javier Delso performed the calculations and analyzed the data; Belén Martín and Emilio Ortega completed the theoretical background, formulated the research questions, analyzed the data and extracted the conclusions. Isabel Otero was concerned with the first section and the structure of the paper.

Conflicts of Interest

The authors declare no conflict of interest.

References

  1. United Nations, Department of Economic and Social Affairs. World Urbanization Prospects; The 2014 Revision; United Nations: New York, NY, USA, 2015. [Google Scholar]
  2. International Transport Forum. Pedestrian Safety, Urban Space and Health; Organisation for Economic Co-Operation and Development (OECD): Paris, France, 2012. [Google Scholar]
  3. Tournier, I.; Dommes, A.; Cavallo, V. Review of safety and mobility issues among older pedestrians. Accid. Anal. Prev. 2016, 91, 24–35. [Google Scholar] [CrossRef] [PubMed]
  4. Litman, T. Measuring transportation: Traffic, mobility and accessibility. ITE J. 2003, 73, 28–32. [Google Scholar]
  5. Gatrell, A. Therapeutic mobilities: Walking and “steps” to well being and health. Health Place 2013, 22, 98–106. [Google Scholar] [CrossRef] [PubMed]
  6. Wood, L.; Frank, L.; Giles-Corti, B. Sense of community and its relationship with walking and neighborhood design. Soc. Sci. Med. 2010, 70, 1381–1390. [Google Scholar] [CrossRef] [PubMed]
  7. Van Dyck, D.; Deforche, B.; Cardon, G.; de Bourdeaudhuij, I. Neighbourhood walkability and its particular importance for adults with a preference for passive transport. Health Place 2009, 15, 496–504. [Google Scholar] [CrossRef] [PubMed] [Green Version]
  8. Speck, J. Walkable City: How Downtown Can Save America, One Step at a Time; Farrar, Straus and Giroux: New York, NY, USA, 2012. [Google Scholar]
  9. Kim, H.; Macdonald, E. Does Wind Discourage Sustainable Transportation Mode Choice? Findings from San Francisco, California, USA. Sustainability 2016, 8, 257. [Google Scholar] [CrossRef]
  10. Joh, K.; Chakrabarti, S.; Boarnet, M.G.; Woo, A. The Walking Renaissance: A Longitudinal Analysis of Walking Travel in the Greater Los Angeles Area, USA. Sustainability 2015, 7, 8985–9011. [Google Scholar] [CrossRef]
  11. European Commission. WHITE PAPER Roadmap to a Single European Transport Area—Towards a Competitive and Resource Efficient Transport System; Publications Office of the European Union: Luxembourg, 2011. [Google Scholar]
  12. Van de Camp, W. Report on the Implementation of the 2011 White Paper on Transport: Taking Stock and the Way Forward towards Sustainable Mobility; (2015/2005(INI)). Available online: http://www.europarl.europa.eu/sides/getDoc.do?pubRef=-//EP//NONSGML+REPORT+A8-2015-0246+0+DOC+PDF+V0//EN (accessed on 15 March 2017).
  13. Foltete, J.; Piombini, A. Urban layout, landscape features and pedestrian usage. Landsc. Urban Plan. 2007, 81, 225–234. [Google Scholar] [CrossRef]
  14. Özbil, A.; Peponis, J. The Effects of Urban Form on Walking to Transit. In Proceedings of the Eighth International Space Syntax Symposium, Santiago de Chile, Chile, 3–6 January 2012.
  15. García-Palomares, J. Urban sprawl and travel to work: The case of the metropolitan area of Madrid. J. Transp. Geogr. 2010, 18, 197–213. [Google Scholar] [CrossRef]
  16. Peponis, J.; Bafna, S.; Zhang, Z. The connectivity of streets: Reach and directional distance. Environ. Plan. B Plan. Des. 2008, 35, 881–901. [Google Scholar] [CrossRef]
  17. Yu, C. Built Environmental Designs in Promoting Pedestrian Safety. Sustainability 2015, 7, 9444–9460. [Google Scholar] [CrossRef]
  18. You, H. Quantifying Urban Fragmentation under Economic Transition in Shanghai City, China. Sustainability 2016, 8, 21. [Google Scholar] [CrossRef]
  19. Rotem-Mindali, O. Retail fragmentation vs. urban livability: Applying ecological methods in urban. Appl. Geogr. 2012, 35, 292–299. [Google Scholar] [CrossRef]
  20. Ortega, E.; Martín, B.; Nuñez, E.; Ezquerra, A. Urban fragmentation map of the Chamberí district in Madrid. J. Maps 2014, 11, 788–797. [Google Scholar] [CrossRef]
  21. Victoria Transport Policy Institute. Online TDM Encyclopedia. Available online: http://www.vtpi.org/tdm/index.php (accessed on 25 September 2016).
  22. Randall, T.; Baetz, B. Evaluating Pedestrian Connectivity for Suburban Sustainability. J. Urban Plan. 2001, 127, 1–15. [Google Scholar] [CrossRef]
  23. Southworth, M. Designing the Walkable City. J. Urban Plan. 2005, 131, 246–257. [Google Scholar] [CrossRef]
  24. Pikora, T.; Giles-Corti, B.; Bull, F.; Jamrozik, K.; Donovan, R. Developing a framework for assessment of the environmental determinants of walking and cycling. Soc. Sci. Med. 2003, 56, 1693–1703. [Google Scholar] [CrossRef]
  25. Krizek, K.J.; Horning, J.; El-Geneidy, A.M. Perceptions of Accessibility to Neighborhood Retail and Other Public Services. In Accessibility and Transport Planning: Challenges for Europe and North America; Geurs, K., Krizek, K., Reggiani, A., Eds.; Edward Elgar: London, UK, 2012; pp. 96–117. [Google Scholar]
  26. Nourian, P.; Hoeven, F.; Rezvani, S.; Sariylidiz, S. Easiest paths for walking and cycling: Combining syntactic and geographic analyses in studying walking and cycling mobility. In Proceedings of the 10th International Space Syntax Symposium, London, UK, 13–17 July 2015.
  27. Sevtsuk, A.; Mekonnen, M. Urban network analysis: A new toolbox for ArcGIS. Rev. Int. Géomat. 2012, 2, 287–305. [Google Scholar] [CrossRef]
  28. Hillier, B.; Penn, A.; Grajewski, T.; Xu, J. Natural Movement: Or, Configuration and Attraction in Urban Pedestrian Movement. Environ. Plan. B Plan. Des. 1993, 20, 29–66. [Google Scholar] [CrossRef]
  29. Radford, N.; Ragland, D. Space Syntax: Innovative Pedestrian Volume Modeling Tool for Pedestrian Safety. Transp. Res. Rec. 2004, 1878, 66–74. [Google Scholar] [CrossRef]
  30. Chang, D.; Penn, A. Integrated multilevel circulation in dense urban areas: The effect of multiple interacting constraints on the use of complex urban areas. Environ. Plan. B Plan. Des. 1998, 25, 507–538. [Google Scholar] [CrossRef]
  31. Peponis, J.; Ross, C.; Rashid, M. The structure of urban space, movement and co-presence: The case of Atlanta. Geoforum 1997, 28, 341–358. [Google Scholar] [CrossRef]
  32. Chang, D. Spatial Choice and Preference in Multilevel Movement Networks. Environ. Behav. 2002, 34, 582–615. [Google Scholar] [CrossRef]
  33. Marinescu, I.; Avram, S. Evaluation of urban fragmentation in Craiova city, Romania. Procedia Environ. Sci. 2012, 14, 207–215. [Google Scholar] [CrossRef]
  34. Fan, C.; Myint, S. A comparison of spatial autocorrelation indices and landscape metrics in measuring urban landscape fragmentation. Landsc. Urban Plan. 2014, 121, 117–128. [Google Scholar] [CrossRef]
  35. Kane, K.; Connors, J.; Galletti, C. Beyond fragmentation at the fringe: A path-dependent, high-resolution analysis of urban land cover in Phoenix, Arizona. Appl. Geogr. 2014, 142, 123–134. [Google Scholar] [CrossRef]
  36. Soria-Lara, J.; Aguilera-Benavente, F.; Arranz-López, A. Integrating land use and transport practice through spatial. Transp. Res. Part A Policy Pract. 2016, 91, 330–345. [Google Scholar] [CrossRef]
  37. Chetkiewicz, C.L.; St. Claire, C.; Boyce, M. Corridors for Conservation: Integrating Pattern and Process. Annu. Rev. Ecol. Evol. Syst. 2006, 37, 317–342. [Google Scholar] [CrossRef]
  38. Beier, P.; Noss, R. Do Habitat Corridors Provide Connectivity? Conserv. Biol. 1998, 12, 1241–1252. [Google Scholar] [CrossRef]
  39. Brodie, J.F.; Giordano, A.J.; Dickson, B.; Hebblewhite, M.; Bernard, H.; Mohd-Azlan, J.; Anderson, J.; Ambu, L. Evaluating Multispecies Landscape Connectivity in a Threatened Tropical Mammal Community. Conserv. Biol. 2015, 29, 1–11. [Google Scholar] [CrossRef] [PubMed]
  40. Dutta, T.; Sharma, S.; McRae, B.H.; Sarathi Roy, P.; DeFries, R. Connecting the dots: Mapping habitat connectivity for tigers. Reg. Environ. Chang. 2016, 16, 53–67. [Google Scholar] [CrossRef]
  41. Hortal, L.; Saura, S. Comparison and development of new graph-based landscape connectivity indices: Towards the priorization of habitat patches and corridors for conservation. Landsc. Ecol. 2006, 21, 959–967. [Google Scholar] [CrossRef]
  42. Kong, F.; Yin, H.; Nakagoshi, N.; Zong, Y. Urban green space network development for biodiversity conservation: Identification based on graph theory and gravity modeling. Landsc. Urban Plan. 2010, 95, 16–27. [Google Scholar] [CrossRef]
  43. Pinto, N.; Keitt, T. Beyond the least-cost path: Evaluating corridor redundancy using a graph-theoretic approach. Landsc. Ecol. 2007, 24, 253–266. [Google Scholar] [CrossRef]
  44. Drielsma, M.; Manion, G.; Ferrier, S. The spatial links tool: Automated mapping of habitat linkages in variegated landscapes. Ecol. Model. 2007, 200, 403–411. [Google Scholar] [CrossRef]
  45. Adriaensen, F.; Chardon, J.P.; De Blust, G.; Swinnen, E.; Villalba, S.; Gulinck, S.; Matthysen, E. The application of “least-cost” modelling as a functional landscape model. Landsc. Urban Plan. 2003, 64, 233–247. [Google Scholar] [CrossRef]
  46. Mancebo, S.; Ramos, B.; Casermeiro, M.; Otero, I. A model for assessing habitat fragmentation caused by new infrastructures in extensive territories. Evaluation of the impact of the Spanish Infrastructure and Transport Plan. J. Environ. Manag. 2010, 91, 1087–1096. [Google Scholar] [CrossRef] [PubMed] [Green Version]
  47. Compton, B.; McGarigal, K.; Cushman, S.; Gamble, L. A Resistant-Kernel Model of Connectivity for Amphibians that Breed in Vernal Pools. Conserv. Biol. 2007, 21, 788–799. [Google Scholar] [CrossRef] [PubMed]
  48. Cushman, S.; Elliot, N.; Macdonald, D.; Loveridge, A. A multi-scale assessment of population connectivity in African lions (Panthera leo) in response to landscape change. Landsc. Ecol. 2016, 31, 1337–1353. [Google Scholar] [CrossRef]
  49. Teng, M.; Wu, C.; Zhou, Z.; Lord, L.; Zheng, Z. Multipurpose greenway planning for changing cities: A framework integrating priorities and a least-cost path model. Landsc. Urban Plan. 2011, 103, 1–14. [Google Scholar]
  50. Havard, C.; Willis, A. Effects of installing a marked crosswalk on road crossing behaviour and perceptions of the environment. Transp. Res. Part F Traffic Psychol. Behav. 2011, 15, 249–260. [Google Scholar] [CrossRef]
  51. Li, M.; Alhajyaseen, W.; Nakamura, H. A traffic Signal Optimization Strategy Considering Both Vehicular and Pedestrian Flows. In Proceedings of the 89th Annual Meeting of the Transportation Research Board, Washington, DC, USA, 10–14 January 2010.
  52. Rodriguez, D.; Joo, J. The relationship between non-motorized mode choice and the local physical environment. Transp. Res. Part D Transp. Environ. 2004, 9, 151–173. [Google Scholar] [CrossRef]
  53. ESRI. ArcGIS Network Analyst. 2016. Available online: http://www.esri.com/software/arcgis/extensions/networkanalyst (accessed on 28 September 2016).
  54. Dijkstra, E. A note on two problems in connexion with graphs. Numer. Math. 1959, 1, 269–271. [Google Scholar] [CrossRef]
  55. ESRI. ArcGIS Kernel Density. 2016. Available online: http://pro.arcgis.com/en/pro-app/tool-reference/spatial-analyst/kernel-density.htm (accessed on 22 October 2016).
  56. Silverman, B.W. Density Estimation for Statistics and Data Analysis; Chapman and Hall: New York, NY, USA, 1986. [Google Scholar]
  57. Jenks, G.F.; Caspall, F. Error on choroplethic maps: Definition, measurement, reduction. Ann. Assoc. Am. Geogr. 1971, 61, 217–244. [Google Scholar] [CrossRef]
  58. Xie, Z.; Yan, J. Kernel Density Estimation of traffic accidents in a network space. Comput. Environ. Urban Syst. 2008, 32, 396–406. [Google Scholar] [CrossRef]
  59. Okabe, A.; Satoh, T.; Sugihara, K. A kernel density estimation method for networks, its computational method and a GIS-based tool. ‎Int. J. Geogr. Inf. Sci. 2009, 23, 7–23. [Google Scholar] [CrossRef]
  60. Tanga, L.; Kana, Z.; Zhangb, X.; Suna, F.; Yanga, X.; Lia, Q. A network Kernel Density Estimation for linear features in space-time analysis of big trace data. Int. J. Geogr. Inf. Sci. 2016, 30, 1717–1737. [Google Scholar] [CrossRef]
  61. TRANSyT. Análisis de los Resultados de la Encuesta de Movilidad 2014 de Vitoria-Gasteiz Realizada por TRANSyT (Universidad Politécnica de Madrid) Para el Centro de Estudios Ambientales; Centro de Estudios Ambientales: Vitoria-Gasteiz, Spain, 2014. (In Spanish) [Google Scholar]
  62. Council of Vitoria-Gasteiz. Mobility and Public Space Plan (Plan de Movilidad y Espacio Público de Vitoria-Gasteiz); Council of Vitoria-Gasteiz: Vitoria-Gasteiz, Spain, 2007. (In Spanish) [Google Scholar]
  63. BCNECOLOGIA. BCNECOLOGIA Supermanzanas. Available online: http://www.bcnecologia.net/es/modelo-conceptual/supermanzana (accessed on 28 September 2016).
  64. OSM Contributors. Available online: http://planet.openstreetmap.org (accessed on 8 October 2016).
  65. Muñoz-Lopez, B. Integrating Bicycle Option in Mode Choice Models through Latent Variables. Ph.D. Thesis, Escuela Tecnica Superior de Ingenieros de Caminos, Canales y Puertos, Madrid, Spain, 2016. [Google Scholar]
  66. Tobler, W. Three Presentations on Geographical Analysis and Modeling: Non-Isotropic Geographical Modeling Speculations on the Geometry of Geography Global Spatial Analysis; National Center for Geographic Information and Analysis: Santa Barbara, CA, USA, 1993. [Google Scholar]
  67. Gates, T.; Noyce, D.; Bill, A.; van Ee, N. Recommended walking speeds for pedestrian clearance timing based on pedestrian characteristics. Transp. Res. Rec. 2006, 1982, 38–47. [Google Scholar] [CrossRef]
  68. Lei, T.L.; Church, R.L. Mapping transit-based access: Integrating GIS, routes and schedules. Int. J. Geogr. Inf. Sci. 2010, 24, 283–304. [Google Scholar] [CrossRef]
  69. Noland, R.B. Pedestrian Travel Times and Motor Vehicle Traffic Signals. Transp. Res. Rec. 1996, 1553, 28–33. [Google Scholar] [CrossRef]
  70. O’ Sullivan, D.; Morrison, A.; Shearer, J. Using desktop GIS for the investigation of accessibility by public transport: An isochrone approach. Int. J. Geogr. Inf. Sci. 2000, 14, 85–104. [Google Scholar] [CrossRef]
  71. Hsiao, S.; Lu, J.; Sterling, J.; Weatherford, M. Use of Geographic Information System for Analysis of Transit Pedestrian Access. Transp. Res. Rec. 1997, 1604, 50–59. [Google Scholar] [CrossRef]
  72. Zhao, F.; Chow, L.F.; Li, M.-T.; Gan, A. Forecasting Transit Walk Accessibility: Regression Model Alternative to Buffer Method. Transp. Res. Rec. 2003, 1835, 34–41. [Google Scholar] [CrossRef]
  73. Kimpel, T.J.; Dueker, K.J.; El-Geneidy, A.M. Using GIS to Measure the Effect of Overlapping Service Areas on Passenger Boardings at Bus Stops. URISA J. 2007, 19, 5–11. [Google Scholar]
  74. Gutiérrez, J.; Garcia-Palomares, J.C. Distance-measure impacts on the calculation of transport service areas using GIS. Environ. Plan. B Plan. Des. 2008, 35, 480–503. [Google Scholar] [CrossRef]
Figure 1. Methodological approach.
Sustainability 09 00434 g001
Figure 2. Location map of Vitoria-Gasteiz.
Sustainability 09 00434 g002
Figure 3. Origins and destinations in the analysis: (a) outward trips; (b) return trips.
Sustainability 09 00434 g003
Figure 4. Kernel density classification: (a) optimal routes; (b) kernel density surface; (c) classified kernel density surface (Jenks method).
Sustainability 09 00434 g004
Figure 5. City network with barriers and pedestrian corridors.
Sustainability 09 00434 g005
Table 1. Comparison of barriers for scenarios A and B.
Number of BarriersBarriered Network (Scenario A)Corridor Network (Scenario B)Difference (No.)Difference (%)
Crosswalks14741398765
Pedestrian crossings with traffic lights65652513120
Total2130192320710
Table 2. Average travel times for the outward routes between MHTS origins and destinations.
Outward Routes (702)Barrier-Free Network (Scenario 0)Barriered Network (Scenario A)Corridor Network (Scenario B)Declared Time Average
Average distance (m)116211811173-
Average time (min)17.6119.6918.4515.10
Difference with scenario 0 (%) 11.854.77
Difference with scenario A (%) −6.32
Table 3. Average travel times for the return routes between MHTS origins and destinations.
Return Routes (640)Barrier-Free Network (Scenario 0)Barriered Network (Scenario A)Corridor Network (Scenario B)Declared Time
Average
Average distance (m)117811961188-
Average time (min)17.9320.0318.6818.19
Difference with scenario 0 (%) 11.714.14
Difference with scenario A (%) −6.78
Table 4. Average travel times for the outward routes.
Outward Routes (519, 720)Barrier-Free Network (Scenario 0)Barriered Network (Scenario A)Corridor Network (Scenario B)
Average distance (m)179718291817
Average time (min)27.2230.4828.52
Difference with scenario 0 (%) 11.984.78
Difference with scenario A (%) −6.42
Table 5. Average travel times for the return routes.
Return Routes (428, 829)Barrier-Free Network (Scenario 0)Barriered Network (Scenario A)Corridor Network (Scenario B)
Average distance (m)182618581846
Average time (min)27.6630.9428.97
Difference with scenario 0 (%) 11.864.74
Difference with scenario A (%) −6.37
Table 6. Aggregated results in control scenarios.
Mean Travel Time (min)Coefficient of Variation (%)
Outward19.130.25
Return19.460.26

