
Understanding Driving Forces and Implications Associated with the Land Use and Land Cover Changes in Portugal


Abstract
:
1. Introduction
2. Study Area
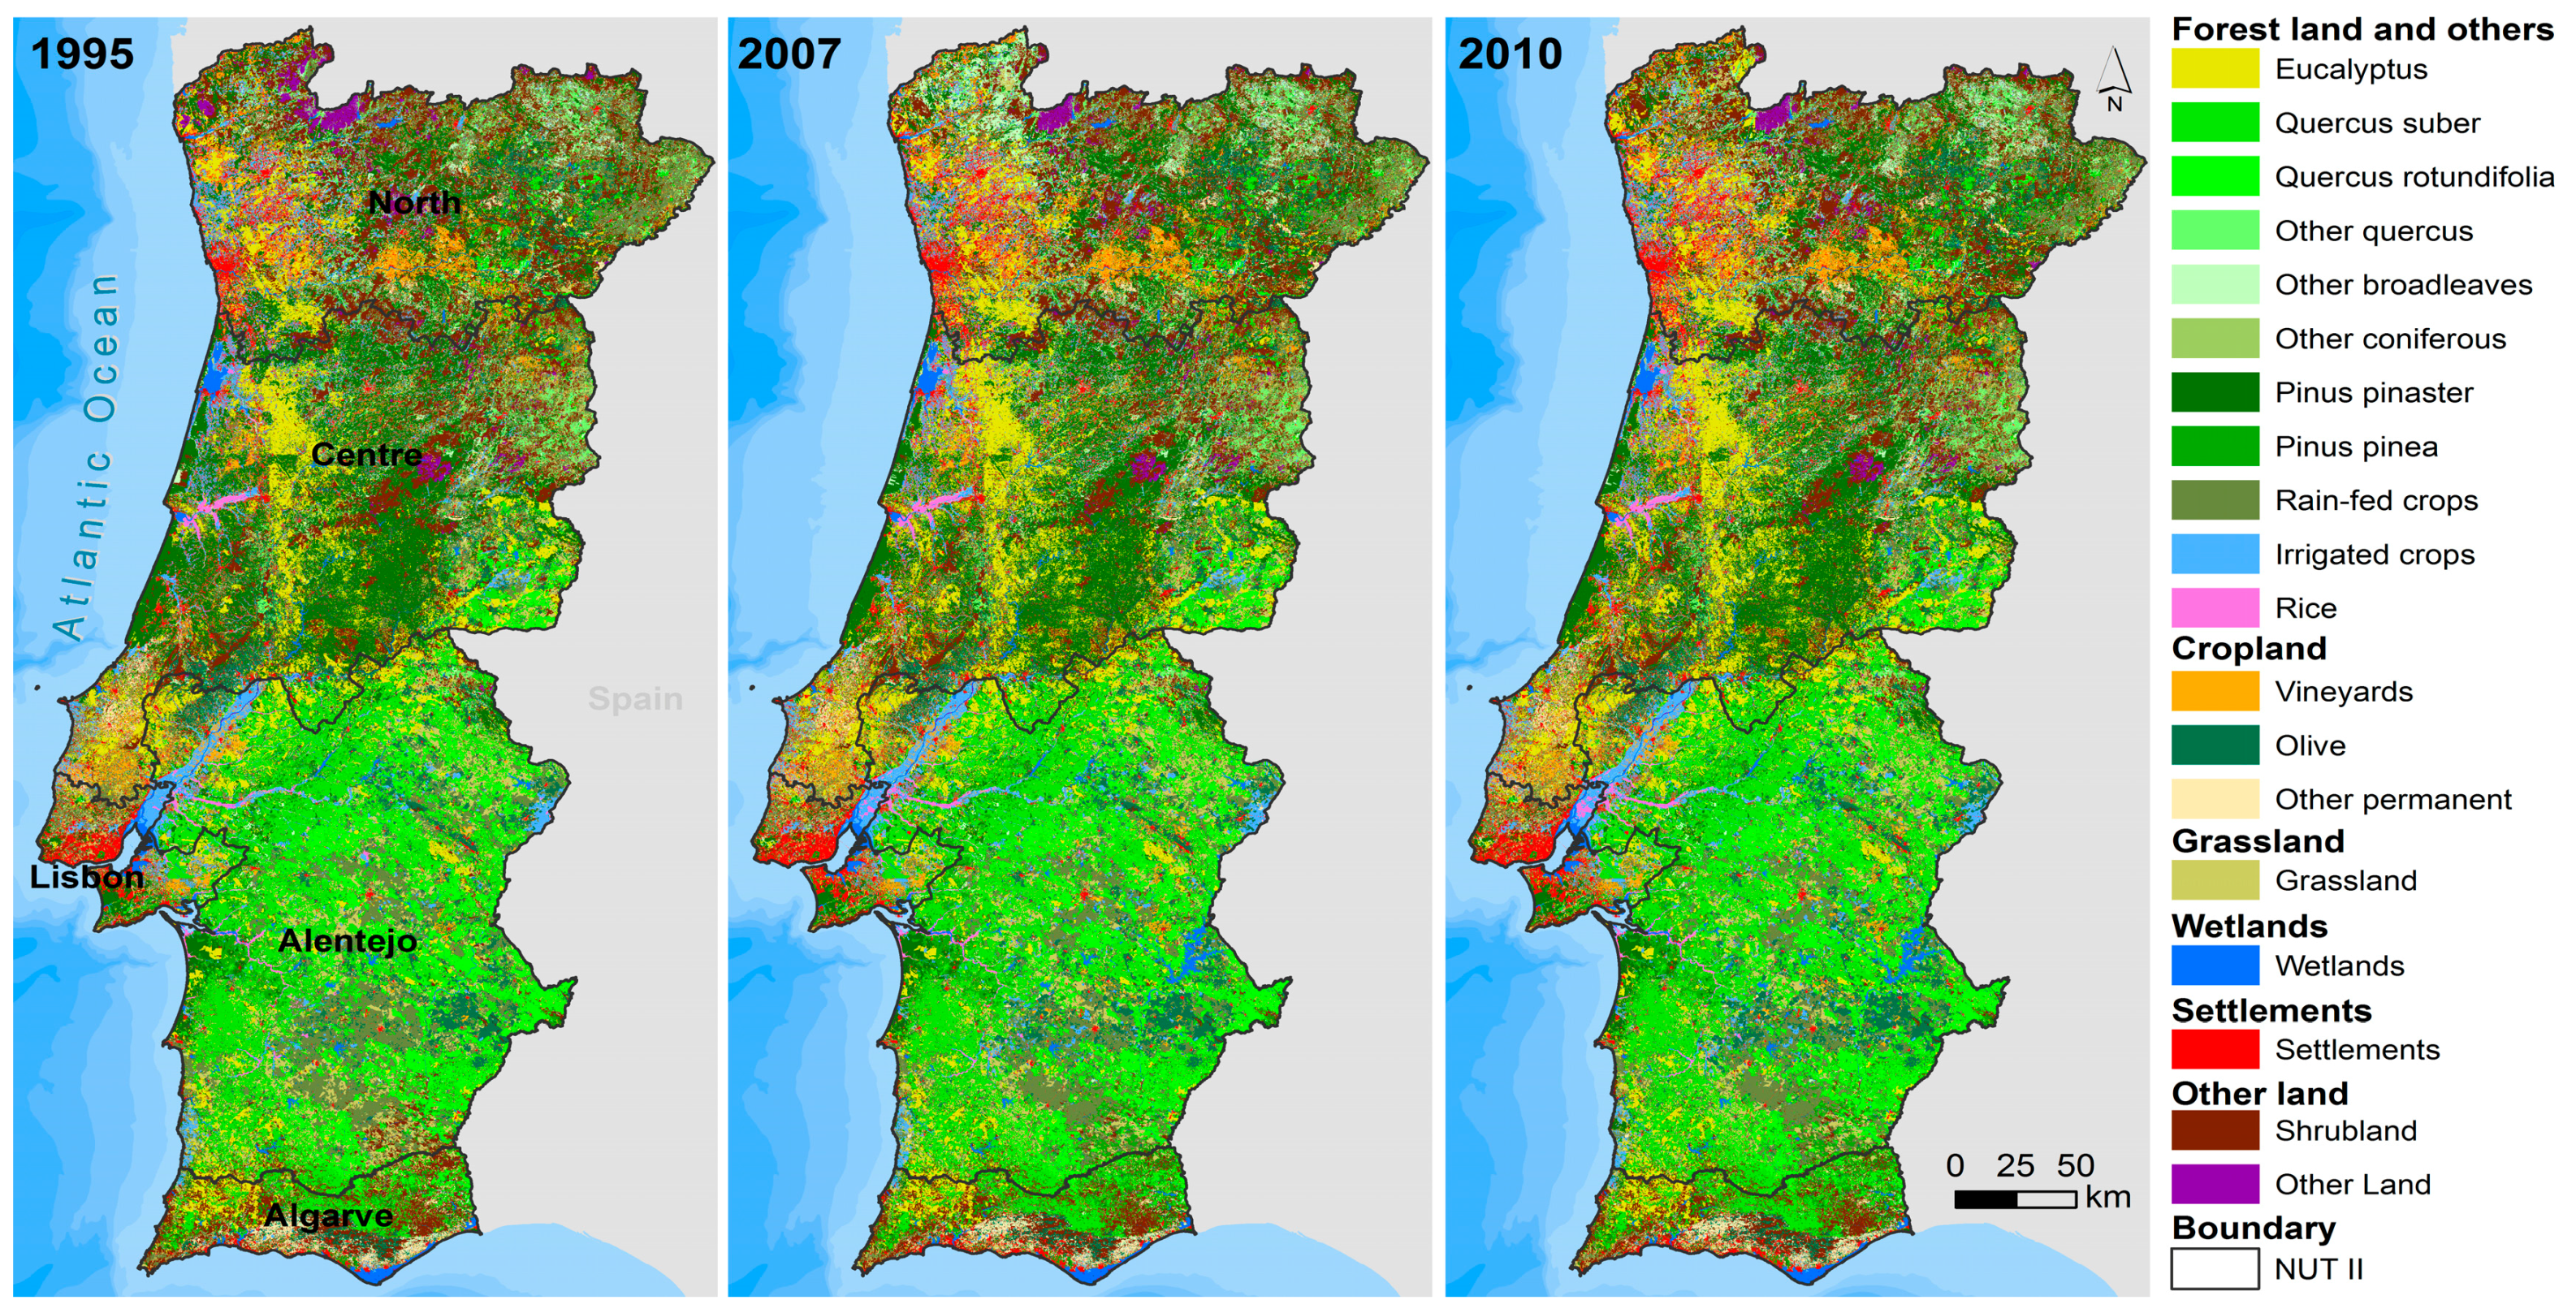
3. Data and Methods
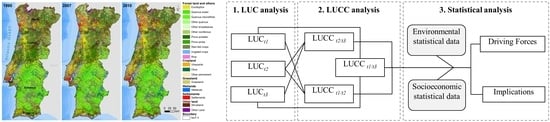
3.1. LUC Cartography
3.2. LUC Type Variations
3.3. Spatio-Temporal LUCC
3.4. Driving Forces and Implications
4. Results
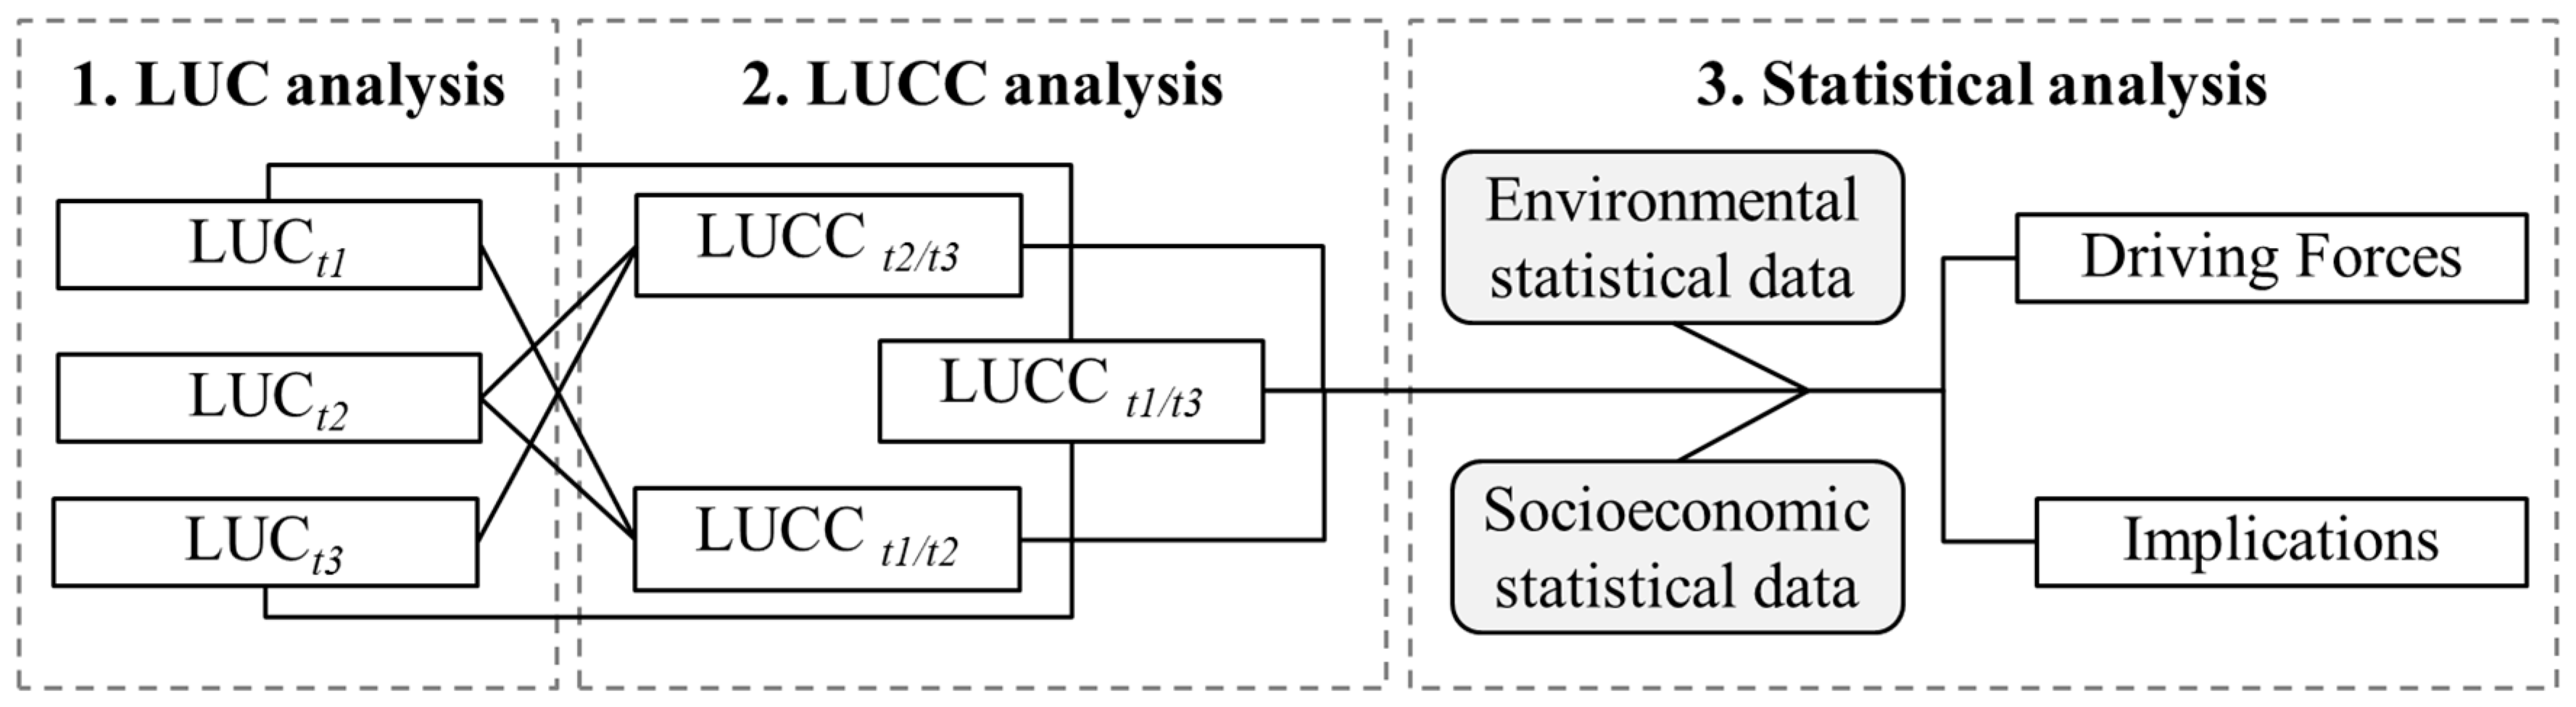
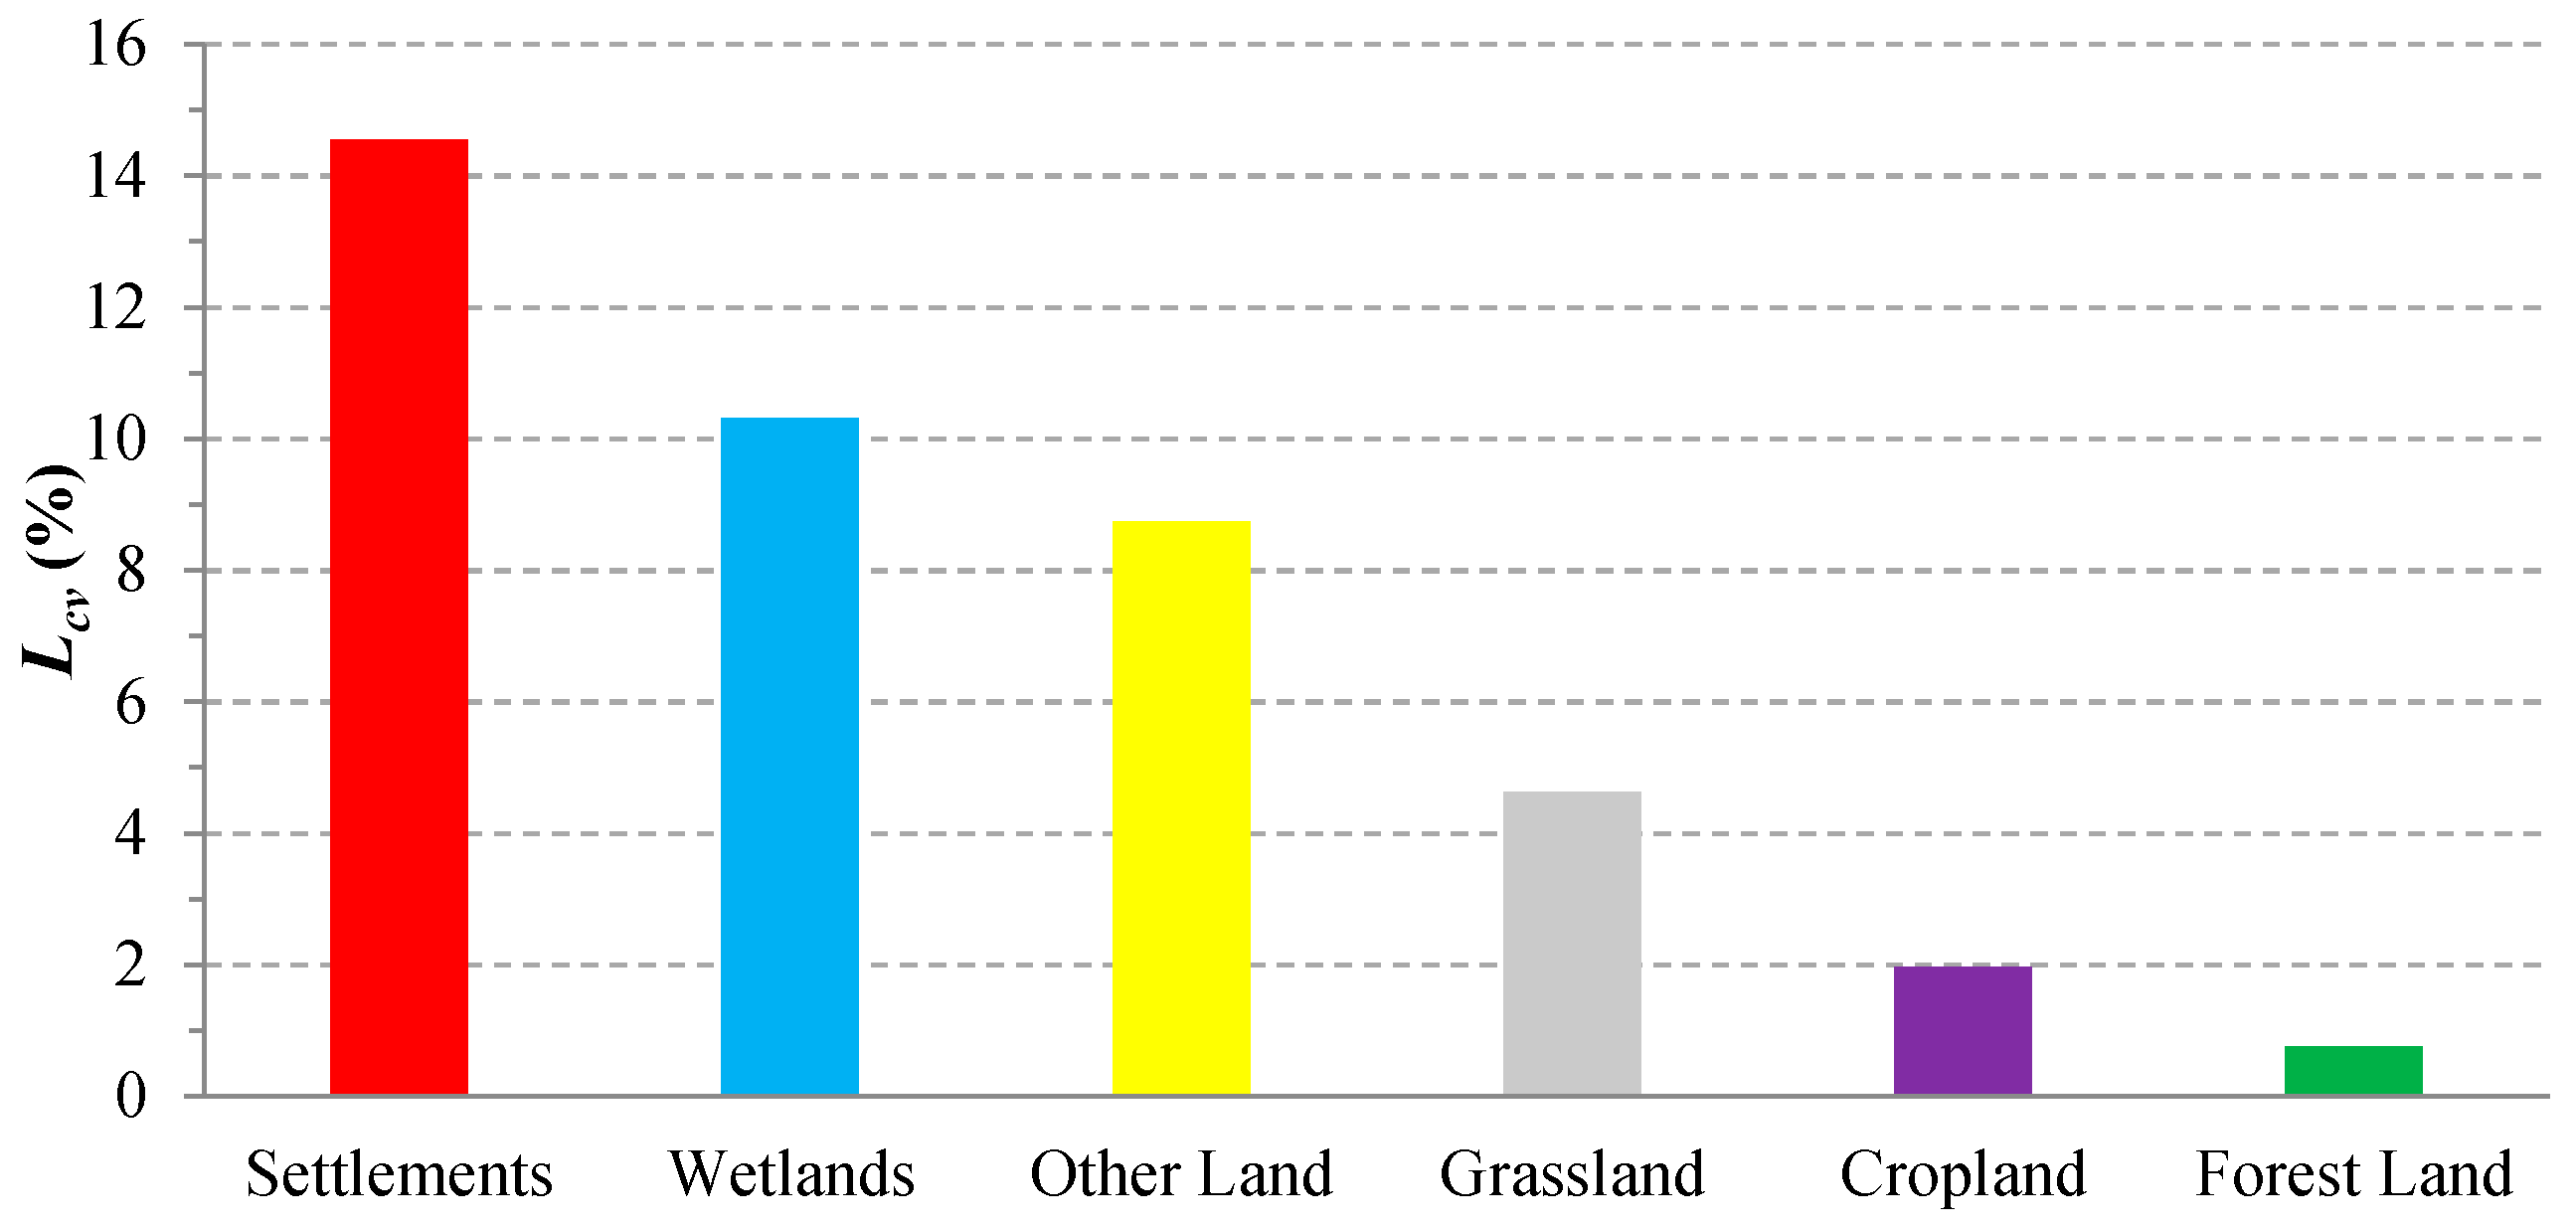
4.1. Land Use/Cover Types Variations
4.2. Spatio-Temporal Transitions
4.3. Driving Forces and Implications of the LUCC
5. Discussion and Conclusions
Supplementary Materials
Acknowledgments
Author Contributions
Conflicts of Interest
References
- Wang, J.; Zhao, Y.; Li, C.; Yu, L.; Liu, D.; Gong, P. Mapping global land cover in 2001 and 2010 with spatial-temporal consistency at 250 m resolution. ISPRS J. Photogramm. Remote Sens. 2014, 103, 38–47. [Google Scholar] [CrossRef]
- Rodriguez-Galiano, V.; Chica-Olmo, M. Land cover change analysis of a Mediterranean area in Spain using different sources of data: Multi-seasonal Landsat images, land surface temperature, digital terrain models and texture. Appl. Geogr. 2012, 35, 208–218. [Google Scholar] [CrossRef]
- Teixeira, Z.; Teixeira, H.; Marques, J.C. Systematic processes of land use/land cover change to identify relevant driving forces: Implications on water quality. Sci. Total Environ. 2014, 471, 1320–1335. [Google Scholar] [CrossRef] [PubMed]
- Direção Geral do Território. Land Use and Land Cover Evolutions in Continental Portugal. Work to Support Reporting of Emissions and Carbon Sequestration in the Sector Use and Land Use Changes. Kyoto Protocol and United Nations Framework Convention on Climate Changes; DGT: Lisbon, Portugal, 2014. [Google Scholar]
- Salvati, L.; De Zuliani, E.; Sabbi, A.; Cancellieri, L.; Tufano, M.; Caneva, G.; Savo, V. Land-cover changes and sustainable development in a rural cultural landscape of central Italy: classical trends and counter-intuitive results. Int. J. Sustain. Dev. World Ecol. 2016, 24, 1–10. [Google Scholar] [CrossRef]
- Meneses, B.M. Analysis of Land Use and Land Cover Changes in the Valley of the Varosa (Portugal) by Landsat-TM Images and its Influence on Soil Conservation. GeoFocus 2013, 13, 270–290. [Google Scholar]
- Li, Y.L.; Liu, K.; Li, L.; Xu, Z.X. Relationship of land use/cover on water quality in the Liao River basin, China. Procedia Environ. Sci. 2012, 13, 1484–1493. [Google Scholar] [CrossRef]
- Nunes, A.N.; de Almeida, A.C.; Coelho, C.O.A. Impacts of land use and cover type on runoff and soil erosion in a marginal area of Portugal. Appl. Geogr. 2011, 31, 687–699. [Google Scholar] [CrossRef]
- Jung, M.; Henkel, K.; Herold, M.; Churkina, G. Exploiting synergies of global land cover products for carbon cycle modeling. Remote Sens. Environ. 2006, 101, 534–553. [Google Scholar] [CrossRef]
- Office of Environment and Heritage (OEH). The Land and Soil Capability Assessment Scheme, Second Approximation: A General Rural Land Evaluation System for New SouthWales; OHE: Haymarket, Australia, 2012. [Google Scholar]
- Dumanski, J.; Pieri, C. Land quality indicators: Research plan. Agric. Ecosyst. Environ. 2000, 81, 93–102. [Google Scholar] [CrossRef]
- Frondoni, R.; Mollo, B.; Capotorti, G. A landscape analysis of land cover change in the Municipality of Rome (Italy): Spatio-temporal characteristics and ecological implications of land cover transitions from 1954 to 2001. Landsc. Urban Plan. 2011, 100, 117–128. [Google Scholar] [CrossRef]
- Campbell, D.J.; Lusch, D.P.; Smucker, T.A.; Wangui, E.E. Multiple Methods in the Study of Driving Forces of Land Use and Land Cover Change: A Case Study of SE Kajiado District, Kenya. Hum. Ecol. 2005, 33, 763–794. [Google Scholar] [CrossRef]
- Fichera, C.R.; Modica, G.; Pollino, M. Land Cover classification and change-detection analysis using multi-temporal remote sensed imagery and landscape metrics. Eur. J. Remote Sens. 2012, 45, 1–18. [Google Scholar] [CrossRef]
- Aitkenhead, M.J.; Aalders, I.H. Automating land cover mapping of Scotland using expert system and knowledge integration methods. Remote Sens. Environ. 2011, 115, 1285–1295. [Google Scholar] [CrossRef]
- Alcamo, J.; Schaldach, R.; Koch, J.; Kölking, C.; Lapola, D.; Priess, J. Evaluation of an integrated land use change model including a scenario analysis of land use change for continental Africa. Environ. Model. Softw. 2011, 26, 1017–1027. [Google Scholar] [CrossRef]
- Basse, R.M.; Omrani, H.; Charif, O.; Gerber, P.; Bódis, K. Land use changes modelling using advanced methods: Cellular automata and artificial neural networks. The spatial and explicit representation of land cover dynamics at the cross-border region scale. Appl. Geogr. 2014, 53, 160–171. [Google Scholar] [CrossRef]
- Liu, Y.; Luo, T.; Liu, Z.; Kong, X.; Li, J.; Tan, R. A comparative analysis of urban and rural construction land use change and driving forces: Implications for urban–rural coordination development in Wuhan, Central China. Habitat Int. 2015, 47, 113–125. [Google Scholar] [CrossRef]
- Long, H.; Tang, G.; Li, X.; Heilig, G.K. Socio-economic driving forces of land-use change in Kunshan, the Yangtze River Delta economic area of China. J. Environ. Manag. 2007, 83, 351–364. [Google Scholar] [CrossRef] [PubMed]
- Pang, A.; Li, C.; Wang, X.; Hu, J. Land use/cover change in response to driving forces of Zoige County, China. Procedia Environ. Sci. 2010, 2, 1074–1082. [Google Scholar] [CrossRef] [Green Version]
- Parcerisas, L.; Marull, J.; Pino, J.; Tello, E.; Coll, F.; Basnou, C. Land use changes, landscape ecology and their socioeconomic driving forces in the Spanish Mediterranean coast (El Maresme County, 1850–2005). Environ. Sci. Policy 2012, 23, 120–132. [Google Scholar] [CrossRef]
- Regos, A.; Ninyerola, M.; Moré, G.; Pons, X. Linking land cover dynamics with driving forces in mountain landscape of the Northwestern Iberian Peninsula. Int. J. Appl. Earth Obs. Geoinf. 2015, 38, 1–14. [Google Scholar] [CrossRef]
- Hansen, M.C.; Stehman, S.V.; Potapov, P.V. Quantification of Global Gross Forest Cover Loss; Fung, I.Y., Ed.; University of California: Berkeley, CA, USA, 2010. [Google Scholar]
- Meneses, B.M. The Influence of Forest Fire on Water Quality of São Domingos Stream Located in the Western Region of Portugal; High Institute of Agronomy of University of Lisbon: Lisbon, Portugal, 2013. [Google Scholar]
- Etter, A.; McAlpine, C.; Wilson, K.; Phinn, S.; Possingham, H. Regional patterns of agricultural land use and deforestation in Colombia. Agric. Ecosyst. Environ. 2006, 114, 369–386. [Google Scholar] [CrossRef]
- Pacheco, P. Agricultural expansion and deforestation in lowland Bolivia: The import substitution versus the structural adjustment model. Land Use Policy 2006, 23, 205–225. [Google Scholar] [CrossRef]
- Verburg, R.; Filho, S.R.; Lindoso, D.; Debortoli, N.; Litre, G.; Bursztyn, M. The impact of commodity price and conservation policy scenarios on deforestation and agricultural land use in a frontier area within the Amazon. Land Use Policy 2014, 37, 14–26. [Google Scholar] [CrossRef]
- Meneses, B.M.; Vale, M.J.; Reis, R. Uso e ocupação do solo. In Uso e Ocupação do Solo em Portugal Continental: Avaliação e Cenários Futuros. Projeto LANDYN; Direção Geral do Território, Ed.; Direção-Geral do Território: Lisboa, Portugal, 2014; pp. 16–52. [Google Scholar]
- Yoder, R.E.; Freeland, R.S.; Ammons, J.T.; Leonard, L.L. Mapping agricultural fields with GPR and EMI to identify offsite movement of agrochemicals. J. Appl. Geophys. 2001, 47, 251–259. [Google Scholar] [CrossRef]
- Schmitz, J.; Hahn, M.; Brühl, C.A. Agrochemicals in field margins—An experimental field study to assess the impacts of pesticides and fertilizers on a natural plant community. Agric. Ecosyst. Environ. 2014, 193, 60–69. [Google Scholar] [CrossRef]
- Alister, C.; Kogan, M. ERI: Environmental risk index. A simple proposal to select agrochemicals for agricultural use. Crop Prot. 2006, 25, 202–211. [Google Scholar] [CrossRef]
- Grainger, A.; Francisco, H.A.; Tiraswat, P. The impact of changes in agricultural technology on long-term trends in deforestation. Land Use Policy 2003, 20, 209–223. [Google Scholar] [CrossRef]
- Paz, J.M.; Sánchez, J.; Visconti, F. Combined use of GIS and environmental indicators for assessment of chemical, physical and biological soil degradation in a Spanish Mediterranean region. J. Environ. Manag. 2006, 79, 150–162. [Google Scholar] [CrossRef] [PubMed]
- Shu, B.; Zhang, H.; Li, Y.; Qu, Y.; Chen, L. Spatiotemporal variation analysis of driving forces of urban land spatial expansion using logistic regression: A case study of port towns in Taicang City, China. Habitat Int. 2014, 43, 181–191. [Google Scholar] [CrossRef]
- Ascione, M.; Campanella, L.; Cherubini, F.; Ulgiati, S. Environmental driving forces of urban growth and development. Landsc. Urban Plan. 2009, 93, 238–249. [Google Scholar] [CrossRef]
- Meneses, B.M.; Reis, E.; Vale, M.J.; Reis, R. Modeling the Probability of Surface Artificialization in Zêzere Watershed (Portugal) Using Environmental Data. Water 2016, 8, 1–19. [Google Scholar] [CrossRef]
- Amato, F.; Maimone, B.A.; Martellozzo, F.; Nolè, G.; Murgante, B. The Effects of Urban Policies on the Development of Urban Areas. Sustainability 2016, 8, 1–22. [Google Scholar] [CrossRef]
- Martellozzo, F. Forecasting High Correlation Transition of Agricultural Landscapes into Urban Areas. Int. J. Agric. Environ. Inf. Syst. 2012, 3, 22–34. [Google Scholar] [CrossRef]
- Nolè, G.; Murgante, B.; Calamita, G.; Lanorte, A.; Lasaponara, R. Evaluation of urban sprawl from space using open source technologies. Ecol. Inform. 2015, 26, 151–161. [Google Scholar] [CrossRef]
- Nestroy, O. Soil sealing in Austria and its consequences. Ecohydrol. Hydrobiol. 2006, 6, 171–173. [Google Scholar] [CrossRef]
- Scalenghe, R.; Marsan, F.A. The anthropogenic sealing of soils in urban areas. Landsc. Urban Plan. 2009, 90, 1–10. [Google Scholar] [CrossRef]
- Serra, P.; Pons, X.; Saurí, D. Land-cover and land-use change in a Mediterranean landscape: A spatial analysis of driving forces integrating biophysical and human factors. Appl. Geogr. 2008, 28, 189–209. [Google Scholar] [CrossRef]
- König, H.J.; Uthes, S.; Schuler, J.; Zhen, L.; Purushothaman, S.; Suarma, U.; Sghaier, M.; Makokha, S.; Helming, K.; Sieber, S.; et al. Regional impact assessment of land use scenarios in developing countries using the FoPIA approach: Findings from five case studies. J. Environ. Manag. 2013, 127, S56–S64. [Google Scholar] [CrossRef] [PubMed]
- Hong, Z.; Hailin, L.; Zhen, C. Analysis of Land Use Dynamic Change and Its Impact on the Water Environment in Yunnan Plateau Lake Area—A Case Study of the Dianchi Lake Drainage Area. Procedia Environ. Sci. 2011, 10, 2709–2717. [Google Scholar] [CrossRef]
- Mouri, G.; Takizawa, S.; Oki, T. Spatial and temporal variation in nutrient parameters in stream water in a rural-urban catchment, Shikoku, Japan: Effects of land cover and human impact. J. Environ. Manag. 2011, 92, 1837–1848. [Google Scholar] [CrossRef] [PubMed]
- Auch, R.F.; Napton, D.E.; Kambly, S.; Moreland, T.R.; Sayler, K.L. The driving forces of land change in the Northern Piedmont of the United States. Geogr. Rev. 2012, 102, 53–75. [Google Scholar] [CrossRef]
- Kanianska, R.; Kizeková, M.; Nováček, J.; Zeman, M. Land-use and land-cover changes in rural areas during different political systems: A case study of Slovakia from 1782 to 2006. Land Use Policy 2014, 36, 554–566. [Google Scholar] [CrossRef]
- Briassoulis, H. Land Use, Land Cover and Soil Sciences—Land-use, land-cover changes and global aggregate impacts. Encycl. Life Support Syst. 2009, I, 6. [Google Scholar]
- Lambin, E.F.; Turner, B.L.; Geist, H.J.; Agbola, S.B.; Angelsen, A.; Bruce, J.W.; Coomes, O.T.; Dirzo, R.; Fischer, G.; Folke, C.; et al. The causes of land-use and land-cover change: Moving beyond the myths. Glob. Environ. Chang. 2001, 11, 261–269. [Google Scholar] [CrossRef]
- Rayner, S.; Bretherton, F.; Buol, S.; Fosberg, M.; Grossmann, W.; Houghton, R.A.; Lal, R.; Lee, J.; Lonergan, S.; Olson, J.; et al. A wiring diagram for the study of land-use/cover change: Report of Working Group A. In Changes in Land Use and Land Cover: A Global Perspective; Meyer, W.B., Turner, B.L.I., Eds.; Cambridge University Press: Cambridge, UK, 1994; pp. 13–53. [Google Scholar]
- Meyer, W.B.; Turner, B.L.I. Changes in Land Use and Land Cover: A Global Perspective, 1st ed.; Meyer, W.B., Turner, B.L.I., Eds.; Cambridge University Press: Cambridge, UK, 1994. [Google Scholar]
- Meneses, B.M.; Vale, M.J.; Reis, R.; Saraiva, R. Metodologias para a avaliação das alterações do uso e ocupação do solo em Portugal Continental nas últimas três décadas. CIDADES Comunidades Territ. 2013, 27, 50–60. [Google Scholar] [CrossRef]
- Brum Ferreira, D. Evolução da Paisagem de Montado no Alentejo Interior ao Longo do Século XX: Dinâmicas e incidências ambientais. Finisterra Rev. Port. Geogr. 2001, 36, 179–193. [Google Scholar] [CrossRef]
- Moreira, F.; Ferreira, P.G.; Rego, F.C.; Bunting, S. Landscape changes and breeding bird assemblages in northwestern Portugal: The role of fire. Landsc. Ecol. 2001, 16, 175–187. [Google Scholar] [CrossRef]
- Pôças, I.; Cunha, M.; Marcal, A.R.S.; Pereira, L.S. An evaluation of changes in a mountainous rural landscape of Northeast Portugal using remotely sensed data. Landsc. Urban Plan. 2011, 101, 253–261. [Google Scholar] [CrossRef]
- Pôças, I.; Cunha, M.; Pereira, L.S. Remote sensing based indicators of changes in a mountain rural landscape of Northeast Portugal. Appl. Geogr. 2011, 31, 871–880. [Google Scholar] [CrossRef]
- Meneses, B.M.; Reis, R.; Vale, M.J.; Saraiva, R. Land use and land cover changes in Zêzere watershed (Portugal)—Water quality implications. Sci. Total Environ. 2015, 527–528, 439–447. [Google Scholar] [CrossRef] [PubMed]
- Hersperger, A.M.; Bürgi, M. Going beyond landscape change description: Quantifying the importance of driving forces of landscape change in a Central Europe case study. Land Use Policy 2009, 26, 640–648. [Google Scholar] [CrossRef]
- Bičı́k, I.; Jeleček, L.; Štěpánek, V. Land-use changes and their social driving forces in Czechia in the 19th and 20th centuries. Land Use Policy 2001, 18, 65–73. [Google Scholar] [CrossRef]
- Alarcão, A. Êxodo Rural e Atracção Urbana no Continente. Análise Soc. 1964, VII–VIII, 511–573. [Google Scholar]
- Instituto Geográfico Português. Carta de Uso e Ocupação do Solo de Portugal Continental para 2007 (COS2007). Memória Descritiva; IGP, Ed.; Instituto Geográfico Português/Direção Geral do Território: Lisboa, Portugal, 2010. [Google Scholar]
- Shi, P.; Chen, J.; Pan, Y. Land use change mechanism in Shenzhen City. Acta Geogr. Sin. 2000, 67, 151–160. [Google Scholar]
- Zhang, X.; Zhang, L.; He, C.; Li, J.; Jiang, Y.; Ma, L. Quantifying the impacts of land use/land cover change on groundwater depletion in Northwestern China—A case study of the Dunhuang oasis. Agric. Water Manag. 2014, 146, 270–279. [Google Scholar] [CrossRef]
- Jiang, P.; Cheng, L.; Li, M.; Zhao, R.; Huang, Q. Analysis of landscape fragmentation processes and driving forces in wetlands in arid areas: A case study of the middle reaches of the Heihe River, China. Ecol. Indic. 2014, 46, 240–252. [Google Scholar] [CrossRef]
- Marques, T.S. Dinâmicas territoriais e as relações urbano-rurais. Rev. Fac. Let. Geogr. 2003, XIX, 507–521. [Google Scholar]
- Oliveira, S.L.J.; Pereira, J.M.C.; Carreiras, J.M.B. Fire frequency analysis in Portugal (1975–2005), using Landsat-based burnt area maps. Int. J. Wildl. Fire 2012, 21, 48–60. [Google Scholar] [CrossRef]
- Leite, F.F.; Bento Gonçalves, A.; Vieira, A. The recurrence interval of forest fires in Cabeço da Vaca (Cabreira Mountain-northwest of Portugal). Environ. Res. 2011, 111, 215–221. [Google Scholar] [CrossRef] [PubMed]
- Pereira, M.G.; Trigo, R.M.; da Camara, C.C.; Pereira, J.M.C.; Leite, S.M. Synoptic patterns associated with large summer forest fires in Portugal. Agric. For. Meteorol. 2005, 129, 11–25. [Google Scholar] [CrossRef]
- Esteves, T.C.J.; Kirkby, M.J.; Shakesby, R.A.; Ferreira, A.J.D.; Soares, J.A.A.; Irvine, B.J.; Ferreira, C.S.S.; Coelho, C.O.A.; Bento, C.P.M.; Carreiras, M.A. Mitigating land degradation caused by wildfire: Application of the PESERA model to fire-affected sites in central Portugal. Geoderma 2012, 191, 40–50. [Google Scholar] [CrossRef]
- Lloret, F.; Marí, G. A comparison of the medieval and the current fire regimes in managed pine forests of Catalonia (NE Spain). For. Ecol. Manag. 2001, 141, 155–163. [Google Scholar] [CrossRef]
- Goes, F.A. Modelação do Crescimento da Árvore Individual de Eucalyptus Globulus Labill; Universidade Nova de Lisboa: Lisbon, Portugal, 2012. [Google Scholar]
- American Forces Network (AFN). Nemátodo da Madeira do Pinheiro—Atividades Realizadas no Âmbito do seu Controlo; AFN: Lisboa, Portugal, 2012. [Google Scholar]
- Daniel, A.C.M. Caracterização do Sector Turístico em Portugal. Rev. Estud. Politéc. 2010, VIII, 255–276. [Google Scholar]
- Aguiar, C.; Rodrigues, O.; Azevedo, J.; Domingos, T. Montanha. In Ecossistemas e Bem-Estar Humano. Avaliação para Portugal do Millennium Ecosystem Assessment; Pereira, H.M., Domingos, T., Vicente, L., Proença, V., Eds.; Escolar Editora: Lisboa, Portugal, 2009; pp. 295–339. [Google Scholar]
- Carpio, A.J.; Oteros, J.; Tortosa, F.S.; Guerrero-Casado, J. Land use and biodiversity patterns of the herpetofauna: The role of olive groves. Acta Oecol. 2016, 70, 103–111. [Google Scholar] [CrossRef]
- European Economic Area (EEA). Landscape Fragmentation in Europe: Joint EEA-FOEN Report; EEA: Bern, Switzerland, 2011. [Google Scholar]
- Ribeiro, M.; Vale, M.J.; Reis, R. Identificação das principais forças motrizes: Abordagem quantitativa. In Uso e Ocupação do Solo em Portugal Continental: Avaliação e Cenários Futuros. Projeto LANDYN; DGT, Ed.; Direção-Geral do Território: Lisboa, Portugal, 2014; pp. 81–88. [Google Scholar]
- Chen, L.; Yang, X.; Chen, L.; Li, L. Impact assessment of land use planning driving forces on environment. Environ. Impact Assess. Rev. 2015, 55, 126–135. [Google Scholar] [CrossRef]
- Kelarestaghi, A.; Jeloudar, Z.J. Land use/cover change and driving force analyses in parts of northern Iran using RS and GIS techniques. Arab. J. Geosci. 2011, 4, 401–411. [Google Scholar] [CrossRef]
- García-Frapolli, E.; Ayala-Orozco, B.; Bonilla-Moheno, M.; Espadas-Manrique, C.; Ramos-Fernández, G. Biodiversity conservation, traditional agriculture and ecotourism: Land cover/land use change projections for a natural protected area in the northeastern Yucatan Peninsula, Mexico. Landsc. Urban Plan. 2007, 83, 137–153. [Google Scholar]
- Rounsevell, M.D.A.; Reginster, I.; Araújo, M.B.; Carter, T.R.; Dendoncker, N.; Ewert, F.; House, J.I.; Kankaanpää, S.; Leemans, R.; Metzger, M.J.; et al. A coherent set of future land use change scenarios for Europe. Agric. Ecosyst. Environ. 2006, 114, 57–68. [Google Scholar] [CrossRef]
- Hegazy, I.R.; Kaloop, M.R. Monitoring urban growth and land use change detection with GIS and remote sensing techniques in Daqahlia governorate Egypt. Int. J. Sustain. Built Environ. 2015. [Google Scholar] [CrossRef]
- Gautam, A.P.; Webb, E.L.; Shivakoti, G.P.; Zoebisch, M.A. Land use dynamics and landscape change pattern in a mountain watershed in Nepal. Agric. Ecosyst. Environ. 2003, 99, 83–96. [Google Scholar] [CrossRef]
- Staus, N.L.; Strittholt, J.R.; DellaSala, D.A.; Robinson, R. Rate and pattern of forest disturbance in the Klamath-Siskiyou ecoregion, USA between 1972 and 1992. Landsc. Ecol. 2002, 17, 455–470. [Google Scholar] [CrossRef]
- Bebi, P.; Seidl, R.; Motta, R.; Fuhr, M.; Firm, D.; Krumm, F.; Conedera, M.; Ginzler, C.; Wohlgemuth, T.; Kulakowski, D. Changes of forest cover and disturbance regimes in the mountain forests of the Alps. For. Ecol. Manag. 2016. In press. [Google Scholar] [CrossRef]
- Lois-González, R.C. A model of spanish-portuguese urban growth: The atlantic axis. Dela 2004, 21, 281–294. [Google Scholar]
- Carballada, Á.M.; Marques, T.M. Urban areas in the Iberian Peninsula. The delineation exercise. Geograifa 2016, 62, 1–3. [Google Scholar]
- Aroengbinang, B.W. Driving Force Analysis of Landuse and Cover Changes in Cimandiri and Cibuni Watersheds. Procedia Environ. Sci. 2015, 24, 184–188. [Google Scholar] [CrossRef]
- Roca, M.N.O.; Leitão, N. População e sustentabilidade da paisagem agrícola em Portugal: Uma tipologia de concelhos. In X Colóquio Ibérico de Geografia “A Geografia Ibérica no Contexto Europeu”; Pedro-Rego, P., Henriques, M.V., Eds.; Universidade de Évora: Évora, Portugal, 2005; pp. 1–18. [Google Scholar]
- Canada Communicable Disease Report (CCDR). Relatório de Aplicação de Fundos Comunitários na Região do Alentejo; CCDR: Évora, Portugal, 2014. [Google Scholar]
- Tomaz, C.V.B.R. Avaliação da Implementação de Projetos Florestais No Âmbito do Programa “RURIS-FTA” na Beira Inteior Sul; Instituto Politécnico de Castelo Branco: Castelo Branco, Portugal, 2011. [Google Scholar]
- Wu, G.; Gao, Y.; Wang, Y.; Wang, Y.; Xu, D. Land-use/land cover changes and their driving forces around wetlands in Shangri-La County, Yunnan Province, China. Int. J. Sustain. Dev. World Ecol. 2014, 22, 110–116. [Google Scholar] [CrossRef]


| LUC | North (23.93% of Total Area) | Centre (31.70% of Total Area) | Lisbon (3.32% of Total Area) | Alentejo (35.44% of Total Area) | Algarve (5.62% of Total Area) | |||||||||||
|---|---|---|---|---|---|---|---|---|---|---|---|---|---|---|---|---|
| Level I | Level II | 1995 | 2007 | 2010 | 1995 | 2007 | 2010 | 1995 | 2007 | 2010 | 1995 | 2007 | 2010 | 1995 | 2007 | 2010 |
| Forest Land and others | Pinus pinaster | 3.86 | 3.98 | 3.95 | 8.93 | 8.46 | 8.35 | 0.29 | 0.28 | 0.28 | 0.99 | 0.96 | 0.95 | 0.07 | 0.07 | 0.07 |
| Quercus suber | 0.39 | 0.40 | 0.39 | 0.63 | 0.70 | 0.70 | 0.26 | 0.26 | 0.26 | 7.72 | 8.06 | 8.11 | 0.82 | 0.85 | 0.85 | |
| Eucalyptus | 1.49 | 1.70 | 1.87 | 3.52 | 4.67 | 4.80 | 0.16 | 0.15 | 0.15 | 2.21 | 2.26 | 2.25 | 0.35 | 0.36 | 0.36 | |
| Quercus rotundifolia | 0.09 | 0.10 | 0.09 | 0.54 | 0.55 | 0.55 | 0.00 | 0.00 | 0.00 | 5.96 | 5.73 | 5.72 | 0.31 | 0.30 | 0.30 | |
| Other quercus | 1.24 | 1.31 | 1.31 | 0.97 | 1.04 | 1.05 | 0.00 | 0.00 | 0.00 | 0.07 | 0.07 | 0.07 | 0.00 | 0.00 | 0.00 | |
| Other broadleaves | 1.23 | 1.99 | 1.43 | 0.88 | 1.08 | 1.09 | 0.07 | 0.08 | 0.08 | 0.30 | 0.30 | 0.31 | 0.18 | 0.17 | 0.17 | |
| Pinus pinea | 0.00 | 0.01 | 0.01 | 0.07 | 0.11 | 0.11 | 0.15 | 0.17 | 0.17 | 1.11 | 1.55 | 1.56 | 0.26 | 0.49 | 0.49 | |
| Other coniferous | 0.05 | 0.07 | 0.07 | 0.05 | 0.09 | 0.09 | 0.01 | 0.01 | 0.01 | 0.00 | 0.00 | 0.00 | 0.00 | 0.00 | 0.00 | |
| Rain-fed crops | 3.45 | 2.90 | 2.88 | 4.33 | 3.62 | 3.62 | 0.50 | 0.44 | 0.43 | 6.17 | 5.42 | 5.28 | 0.40 | 0.36 | 0.36 | |
| Irrigated crops | 1.61 | 1.36 | 1.37 | 1.47 | 1.49 | 1.50 | 0.36 | 0.32 | 0.31 | 1.21 | 1.43 | 1.42 | 0.05 | 0.05 | 0.05 | |
| Rice | 0.00 | 0.00 | 0.00 | 0.12 | 0.12 | 0.12 | 0.02 | 0.04 | 0.05 | 0.26 | 0.25 | 0.26 | 0.00 | 0.00 | 0.00 | |
| Cropland | Vineyards | 1.08 | 1.23 | 1.24 | 0.68 | 0.66 | 0.65 | 0.13 | 0.12 | 0.12 | 0.38 | 0.46 | 0.47 | 0.03 | 0.02 | 0.02 |
| Olive | 0.96 | 1.03 | 1.05 | 1.55 | 1.36 | 1.36 | 0.03 | 0.03 | 0.03 | 2.23 | 2.29 | 2.48 | 0.33 | 0.31 | 0.31 | |
| Other permanent | 0.25 | 0.32 | 0.32 | 0.34 | 0.34 | 0.33 | 0.04 | 0.03 | 0.03 | 0.05 | 0.06 | 0.06 | 0.37 | 0.34 | 0.34 | |
| Grassland | Grassland | 0.40 | 0.38 | 0.36 | 1.43 | 1.51 | 1.45 | 0.27 | 0.26 | 0.26 | 4.59 | 4.21 | 4.10 | 0.29 | 0.23 | 0.23 |
| Wetlands | Wetlands | 0.21 | 0.21 | 0.21 | 0.37 | 0.39 | 0.40 | 0.20 | 0.20 | 0.20 | 0.50 | 0.76 | 0.77 | 0.20 | 0.21 | 0.21 |
| Settlements | Settlements | 1.34 | 1.67 | 1.72 | 1.29 | 1.64 | 1.70 | 0.55 | 0.69 | 0.71 | 0.42 | 0.58 | 0.60 | 0.19 | 0.28 | 0.30 |
| Other Land | Shrubland | 5.54 | 4.89 | 5.28 | 4.19 | 3.53 | 3.52 | 0.26 | 0.23 | 0.22 | 1.20 | 0.96 | 0.95 | 1.72 | 1.52 | 1.51 |
| Other Land | 0.72 | 0.39 | 0.38 | 0.31 | 0.32 | 0.32 | 0.02 | 0.02 | 0.02 | 0.07 | 0.08 | 0.08 | 0.04 | 0.05 | 0.05 | |
| Variable | Description | |
|---|---|---|
| Driving forces | CP | Cereals production (kg) |
| EI | Export intensity (%) | |
| EMPA | Employment (No.)—agriculture, forestry and fishing | |
| EMPI | Employment (No.)—industry, construction and water | |
| EMPT | Employment (No.) | |
| ERPBL | Environmental revenues (€)—protection of biodiversity and landscape | |
| ERWM | Environmental revenues (€)—waste management | |
| GVAA | Gross value added (€)—agriculture, forestry and fishing | |
| GVAI | Gross value added (€)—industry, construction and water | |
| OTP | Olive trees production (kg) | |
| PCGDP | Per capita gross domestic product (€/per inhabitant) | |
| PCPP | Per capita purchasing power (%/per inhabitant) | |
| Rd | Roads (km) | |
| RP | Resident population (No.) | |
| VP | Vineyard production (kg) | |
| VSW | Volumes stored by watershed (106 m3) | |
| Implications | CEEA | Consumption of electric energy (kWh)—agriculture, forestry and fishing |
| CEED | Consumption of electric energy (kWh)—domestic | |
| CEEI | Consumption of electric energy (kWh)—industry, construction and water | |
| CEET | Consumption of electric energy (kWh)—total | |
| ECA | Electricity consumers (No.)—agriculture, forestry and fishing | |
| ECD | Electricity consumers (No.)—domestic | |
| ECI | Electricity consumers (No.)—industry, construction and water | |
| ECT | Electricity consumers (No.)—total | |
| EEPBLPC | Environmental expenditure (€/per inhabitant)—protection of biodiversity and landscape | |
| EETPC | Environmental expenditure (€/per inhabitant)—total | |
| Periods | Overall Unchanged (%) | Overall Changes (%) | Kappa Coefficient (%) |
|---|---|---|---|
| 1995–2007 | 84 | 16 | 82.4 |
| 2007–2010 | 97.1 | 2.9 | 96.6 |
| 1995–2010 | 83.4 | 16.6 | 81.8 |
| NUTS II | Absolute Changes | Relative Changes | ||
|---|---|---|---|---|
| r | r2 | r | r2 | |
| North | −0.67 | 0.45 | −0.15 | 0.02 |
| Centre | 0.72 | 0.52 | 0.45 | 0.20 |
| Lisbon | 0.80 | 0.63 | 0.80 | 0.65 |
| Alentejo | 0.62 | 0.39 | 0.22 | 0.05 |
| Algarve | 0.49 | 0.24 | 0.35 | 0.12 |
| NUTS II | Absolute Changes | Relative Changes | |||||
|---|---|---|---|---|---|---|---|
| Input 1 | Input 2 | 1995–2010 | 1995–2007 | 2007–2010 | 1995–2010 | 1995–2007 | 2007–2010 |
| North | Centre | 0.68 | 0.58 | 0.15 | 0.56 | 0.56 | 0.16 |
| Lisbon | 0.63 | 0.52 | −0.07 | 0.04 | 0.13 | 0.00 | |
| Alentejo | 0.51 | 0.41 | 0.02 | 0.43 | 0.41 | 0.07 | |
| Algarve | 0.36 | 0.40 | −0.16 | 0.74 | 0.71 | 0.07 | |
| Centre | Lisbon | 0.41 | 0.42 | 0.16 | 0.17 | 0.33 | 0.04 |
| Alentejo | 0.40 | 0.44 | 0.15 | 0.47 | 0.42 | 0.40 | |
| Algarve | 0.39 | 0.39 | 0.21 | 0.45 | 0.44 | 0.28 | |
| Lisbon | Alentejo | 0.38 | 0.39 | 0.25 | 0.00 | 0.02 | 0.28 |
| Algarve | 0.48 | 0.47 | 0.63 | 0.13 | 0.22 | 0.11 | |
| Alentejo | Algarve | 0.57 | 0.61 | 0.22 | 0.55 | 0.56 | 0.14 |
| Land Use/Cover Classes | ||||||||||||||||||||
|---|---|---|---|---|---|---|---|---|---|---|---|---|---|---|---|---|---|---|---|---|
| Pinus pinaster | Quercus suber | Eucalyptus | Quercus rotundifolia | Other quercus | Other broadleaves | Pinus pinea | Other Coniferous | Rain-Fed crops | Irrigated crops | Rice | vineyards | Olive | Other permanent | Grassland | Wetlands | Settlements | Shrubland | Other Land | ||
| Driving forces | CP | n.a. | n.a. | n.a. | n.a. | n.a. | n.a. | n.a. | n.a. | 0.94 | 0.67 | 0.93 | n.a. | n.a. | n.a. | 0.96 | 0.87 | n.a. | n.a. | n.a. |
| EI | 0.55 | −0.04 | 0.49 | −0.02 | 0.77 | 0.76 | −0.22 | 0.70 | 0.48 | 0.81 | 0.11 | 0.86 | 0.35 | −0.07 | n.a. | n.a. | n.a. | n.a. | n.a. | |
| EMPA | 0.97 | −0.31 | 0.80 | −0.27 | 0.91 | 0.81 | −0.47 | 0.93 | 0.42 | 0.75 | −0.01 | 0.75 | 0.31 | 0.56 | n.a. | n.a. | 0.89 | n.a. | n.a. | |
| EMPI | 0.51 | −0.49 | 0.21 | −0.48 | 0.85 | 0.83 | −0.65 | 0.71 | 0.08 | 0.52 | −0.41 | 0.84 | −0.09 | 0.24 | n.a. | −0.38 | 0.83 | n.a. | n.a. | |
| EMPT | 0.42 | −0.59 | 0.11 | −0.57 | 0.66 | 0.60 | −0.71 | 0.62 | −0.12 | 0.32 | −0.42 | 0.60 | −0.29 | 0.01 | n.a. | −0.46 | 0.75 | n.a. | n.a. | |
| ERPBL | 0.73 | −0.28 | 0.65 | −0.24 | 0.62 | 0.62 | −0.37 | 0.77 | 0.20 | 0.47 | 0.03 | 0.47 | 0.14 | 0.31 | −0.08 | 0.01 | 0.74 | 0.44 | 0.39 | |
| ERWM | 0.38 | −0.31 | 0.31 | −0.31 | 0.58 | 0.63 | −0.37 | 0.64 | −0.01 | 0.30 | −0.21 | 0.55 | −0.04 | 0.24 | −0.25 | −0.16 | 0.72 | 0.43 | 0.29 | |
| GVAA | 0.73 | 0.40 | 0.85 | 0.45 | 0.55 | 0.48 | 0.21 | 0.53 | 0.90 | 0.89 | 0.63 | 0.57 | 0.84 | 0.16 | 0.61 | n.a. | n.a. | 0.52 | 0.53 | |
| GVAI | 0.44 | −0.48 | 0.21 | −0.46 | 0.71 | 0.71 | −0.61 | 0.69 | −0.02 | 0.40 | −0.34 | 0.70 | −0.16 | 0.07 | −0.39 | n.a. | 0.83 | 0.55 | 0.56 | |
| OTP | n.a. | n.a. | n.a. | n.a. | n.a. | n.a. | n.a. | n.a. | 0.80 | 0.74 | n.a. | n.a. | 0.84 | n.a. | n.a. | 0.73 | n.a. | n.a. | n.a. | |
| PCGDP | −0.42 | −0.13 | −0.40 | −0.16 | −0.45 | −0.41 | 0.05 | −0.31 | −0.52 | −0.51 | −0.15 | −0.46 | −0.44 | −0.36 | −0.24 | −0.13 | −0.25 | −0.56 | −0.54 | |
| PCPP | −0.52 | −0.36 | −0.65 | −0.38 | −0.51 | −0.52 | −0.23 | −0.41 | −0.72 | −0.66 | −0.40 | −0.54 | −0.73 | −0.48 | −0.47 | −0.43 | −0.37 | n.a. | n.a. | |
| Rd | n.a. | n.a. | n.a. | n.a. | n.a. | n.a. | n.a. | n.a. | n.a. | n.a. | n.a. | n.a. | n.a. | n.a. | n.a. | n.a. | 0.74 | n.a. | n.a. | |
| RP | 0.43 | −0.54 | 0.13 | −0.52 | 0.71 | 0.67 | −0.68 | 0.64 | −0.05 | 0.39 | −0.40 | 0.69 | −0.22 | 0.03 | −0.45 | −0.43 | 0.78 | 0.58 | 0.64 | |
| VSW | 0.25 | 0.58 | 0.55 | 0.57 | 0.01 | −0.02 | 0.55 | 0.10 | 0.68 | 0.63 | 0.72 | 0.17 | 0.79 | −0.56 | 0.65 | 0.87 | 0.18 | −0.17 | −0.02 | |
| VP | n.a. | n.a. | n.a. | n.a. | n.a. | n.a. | n.a. | n.a. | n.a. | n.a. | n.a. | 0.89 | n.a. | n.a. | n.a. | 0.33 | 0.80 | n.a. | n.a. | |
| Implications | CEEA | 0.44 | 0.51 | 0.75 | 0.52 | 0.20 | 0.20 | 0.46 | 0.38 | 0.65 | 0.64 | 0.71 | 0.26 | 0.71 | −0.14 | 0.64 | 0.79 | n.a. | n.a. | n.a. |
| CEED | n.a. | n.a. | n.a. | n.a. | n.a. | n.a. | n.a. | n.a. | n.a. | n.a. | n.a. | n.a. | n.a. | n.a. | n.a. | n.a. | 0.77 | n.a. | n.a. | |
| CEEI | 0.73 | −0.41 | 0.55 | −0.38 | 0.80 | 0.74 | −0.57 | 0.87 | 0.19 | 0.60 | −0.12 | 0.71 | 0.04 | 0.15 | −0.22 | −0.15 | 0.93 | n.a. | n.a. | |
| CEET | 0.47 | −0.49 | 0.25 | −0.48 | 0.65 | 0.62 | −0.61 | 0.69 | −0.06 | 0.36 | −0.29 | 0.59 | −0.19 | 0.03 | −0.38 | −0.32 | 0.80 | n.a. | n.a. | |
| ECA | 0.97 | −0.24 | 0.87 | −0.20 | 0.90 | 0.81 | −0.40 | 0.96 | 0.46 | 0.78 | 0.07 | 0.74 | 0.36 | 0.53 | 0.00 | n.a. | n.a. | n.a. | n.a. | |
| ECD | n.a. | n.a. | n.a. | n.a. | n.a. | n.a. | n.a. | n.a. | n.a. | n.a. | n.a. | n.a. | n.a. | n.a. | n.a. | n.a. | 0.80 | n.a. | n.a. | |
| ECI | 0.64 | −0.44 | 0.35 | −0.42 | 0.90 | 0.85 | −0.61 | 0.76 | 0.21 | 0.61 | −0.32 | 0.85 | 0.04 | 0.35 | −0.31 | −0.29 | 0.83 | n.a. | n.a. | |
| ECT | 0.49 | −0.58 | 0.20 | −0.56 | 0.70 | 0.66 | −0.71 | 0.70 | −0.09 | 0.35 | −0.39 | 0.63 | −0.25 | 0.08 | −0.47 | −0.42 | 0.82 | 0.53 | 0.56 | |
| EEPBLPC | −0.32 | −0.26 | −0.35 | −0.29 | −0.42 | −0.41 | −0.06 | −0.24 | −0.61 | −0.59 | −0.25 | −0.52 | −0.52 | −0.14 | −0.35 | −0.23 | −0.25 | −0.50 | −0.52 | |
| EETPC | −0.66 | −0.09 | −0.62 | −0.13 | −0.75 | −0.70 | 0.16 | −0.65 | −0.69 | −0.86 | −0.26 | −0.80 | −0.53 | −0.08 | −0.27 | −0.20 | −0.71 | −0.68 | −0.76 | |
© 2017 by the authors. Licensee MDPI, Basel, Switzerland. This article is an open access article distributed under the terms and conditions of the Creative Commons Attribution (CC BY) license ( http://creativecommons.org/licenses/by/4.0/).
Share and Cite
Meneses, B.M.; Reis, E.; Pereira, S.; Vale, M.J.; Reis, R. Understanding Driving Forces and Implications Associated with the Land Use and Land Cover Changes in Portugal. Sustainability 2017, 9, 351. https://doi.org/10.3390/su9030351
Meneses BM, Reis E, Pereira S, Vale MJ, Reis R. Understanding Driving Forces and Implications Associated with the Land Use and Land Cover Changes in Portugal. Sustainability. 2017; 9(3):351. https://doi.org/10.3390/su9030351
Chicago/Turabian StyleMeneses, Bruno M., Eusébio Reis, Susana Pereira, Maria J. Vale, and Rui Reis. 2017. "Understanding Driving Forces and Implications Associated with the Land Use and Land Cover Changes in Portugal" Sustainability 9, no. 3: 351. https://doi.org/10.3390/su9030351
APA StyleMeneses, B. M., Reis, E., Pereira, S., Vale, M. J., & Reis, R. (2017). Understanding Driving Forces and Implications Associated with the Land Use and Land Cover Changes in Portugal. Sustainability, 9(3), 351. https://doi.org/10.3390/su9030351