
Optimal Acquisition and Production Policy for End-of-Life Engineering Machinery Recovering in a Joint Manufacturing/Remanufacturing System under Uncertainties in Procurement and Demand

Abstract
:1. Introduction
2. Model Description and Formulation
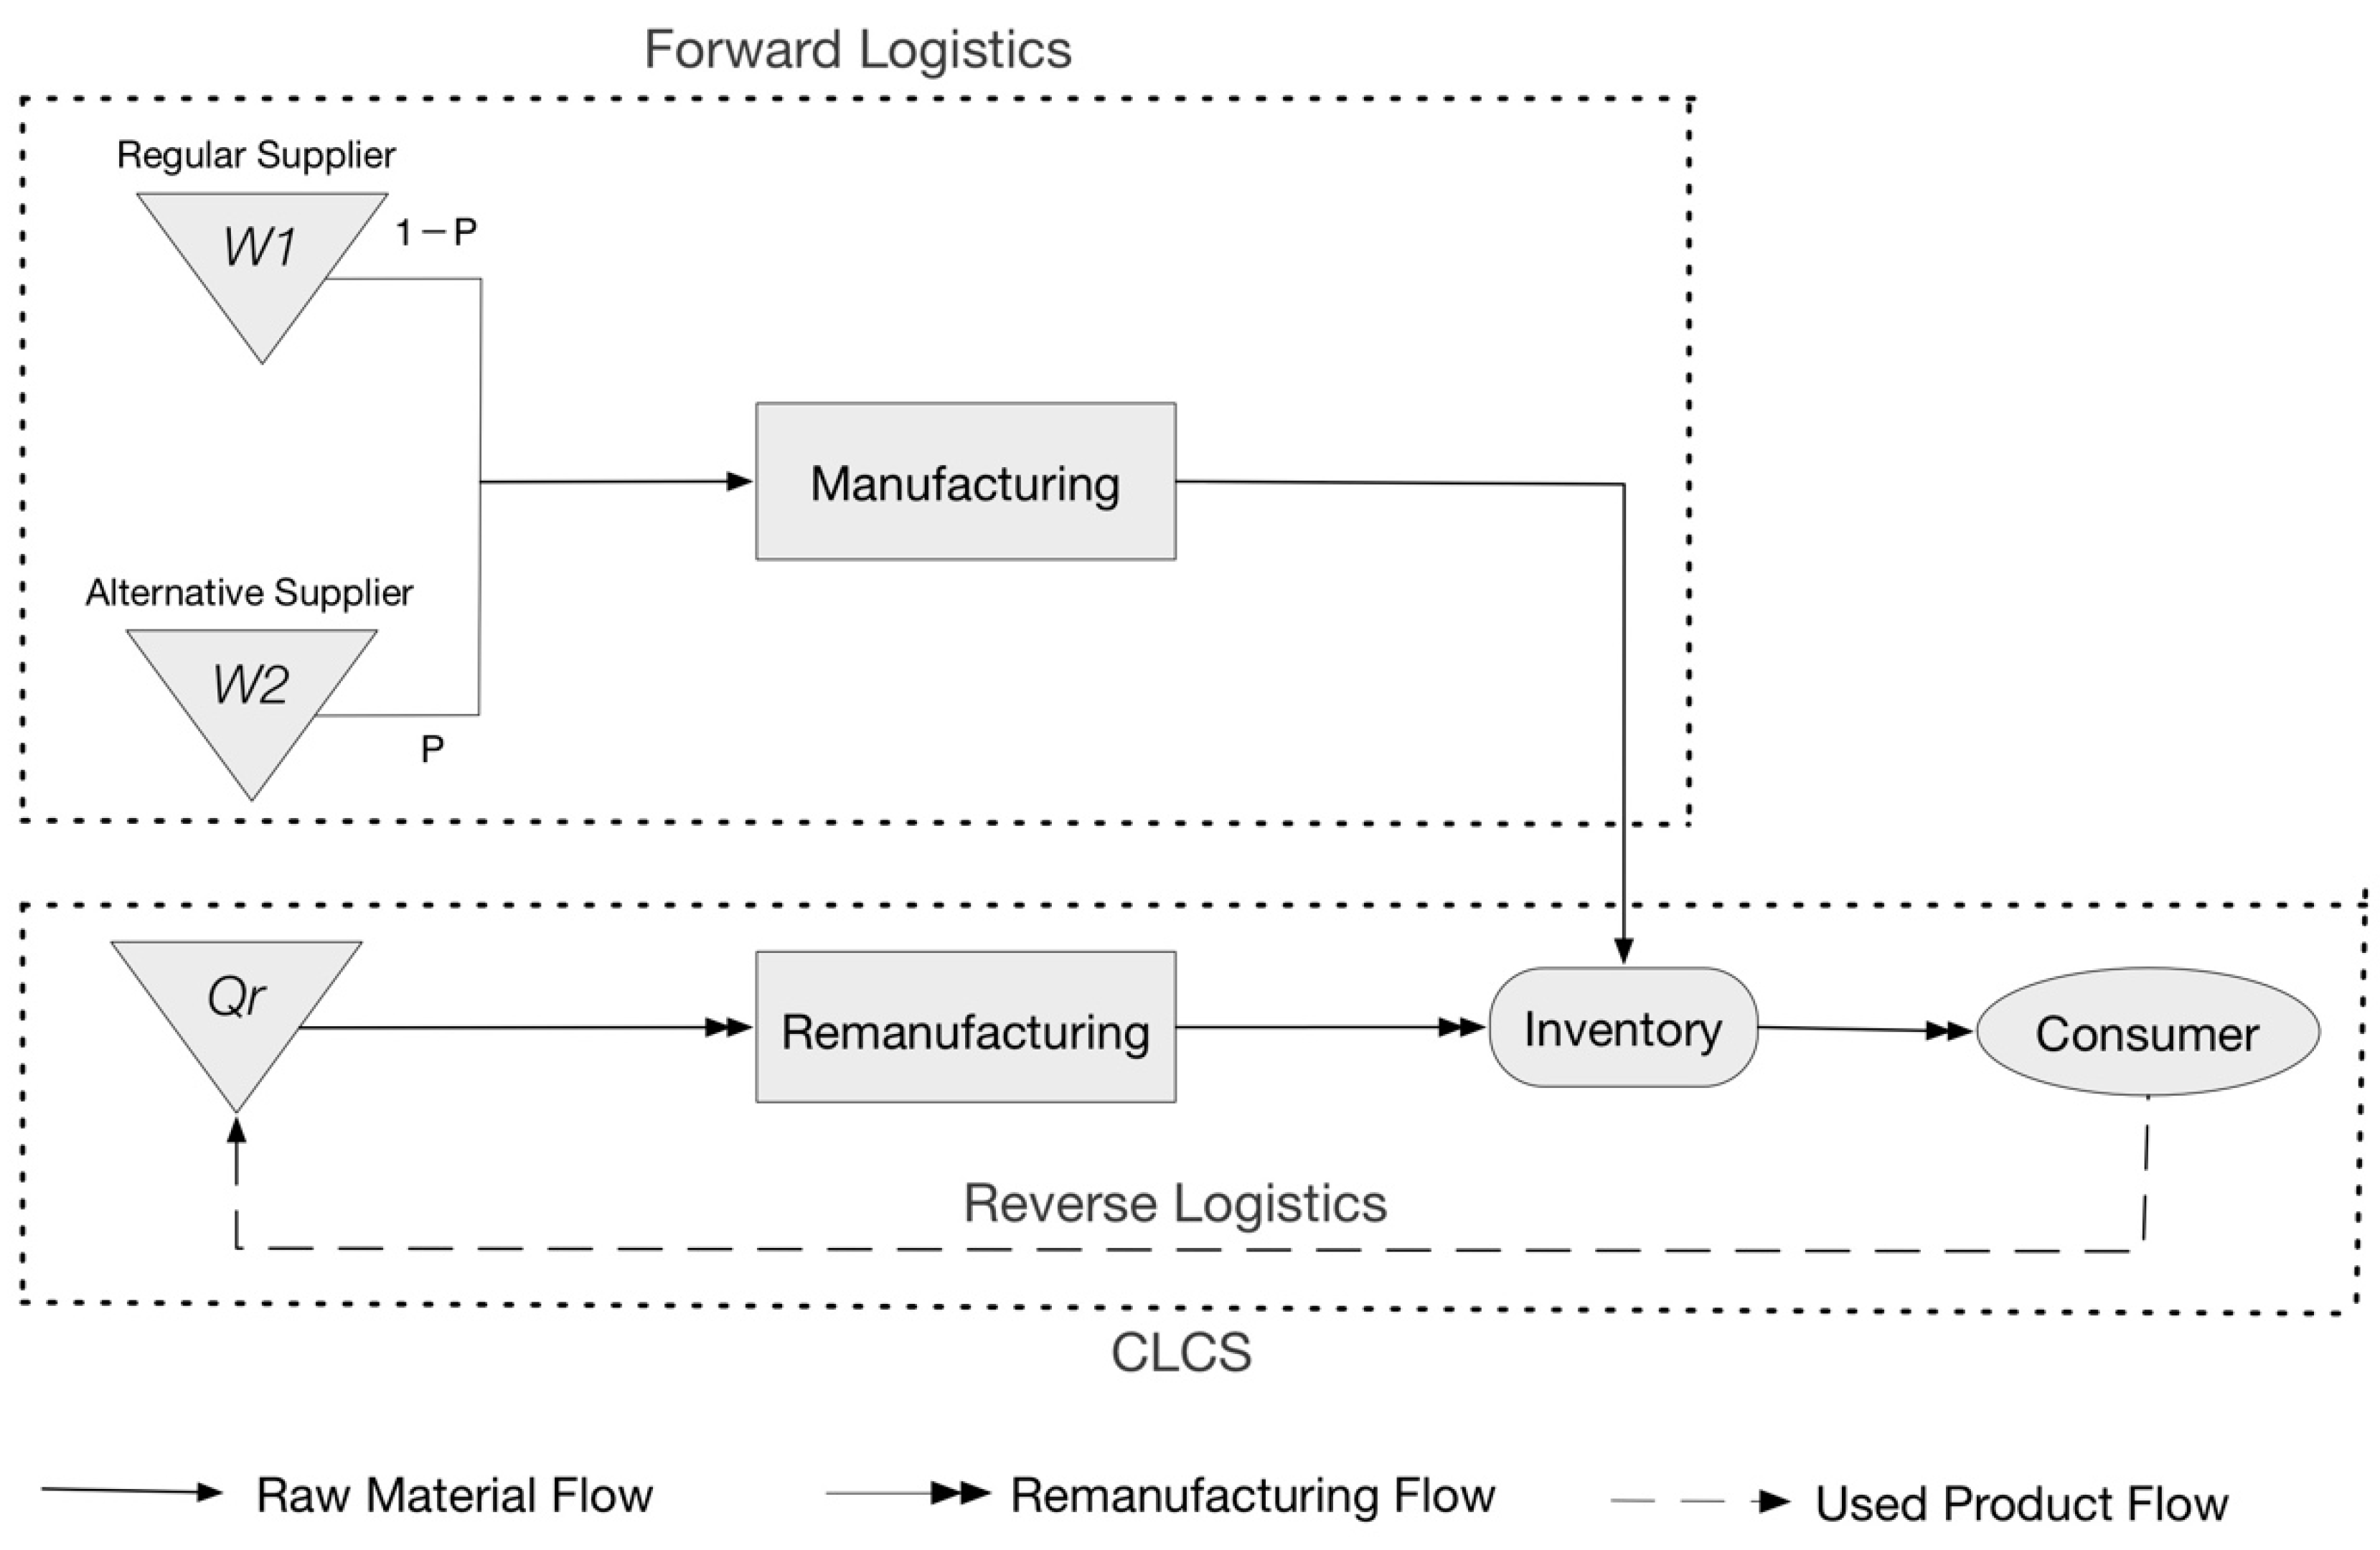
2.1. Model Description and Formulation
2.2. Decompose the Problem into a Series of Smaller Ones
- How many end-of-life products need to be purchased?
- How many new products should be manufactured?
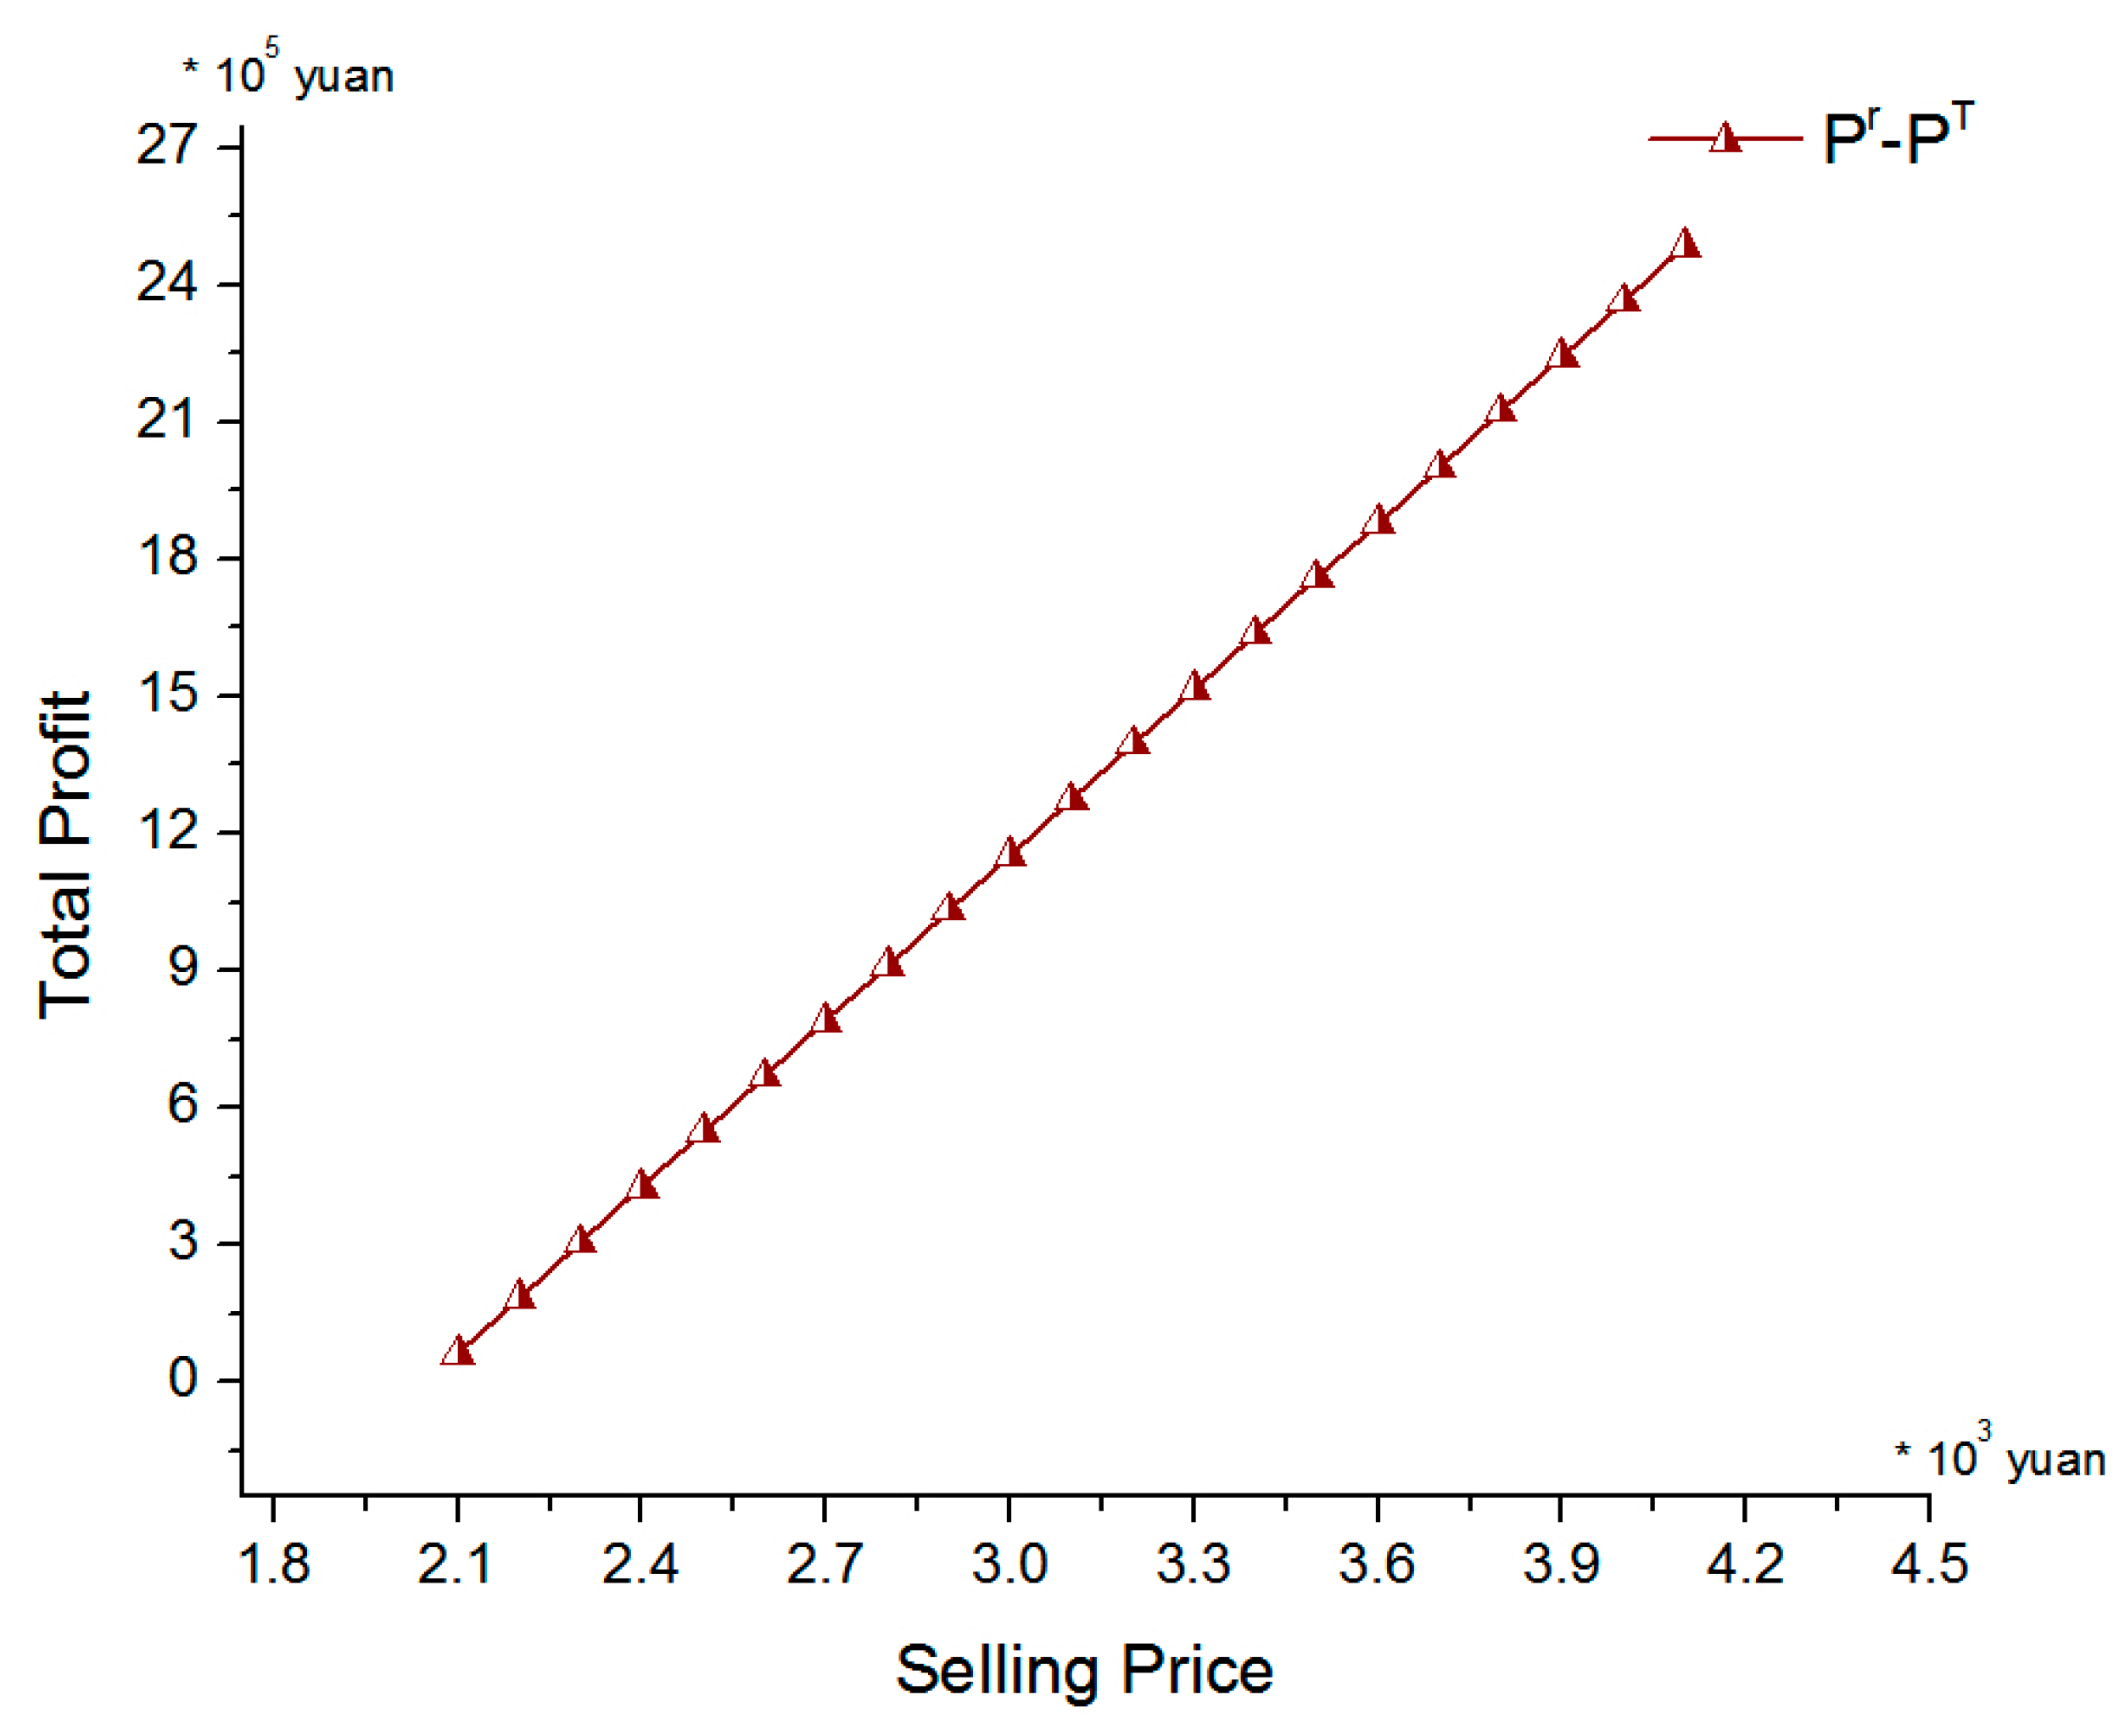
- How much the optimal selling price should be set as?
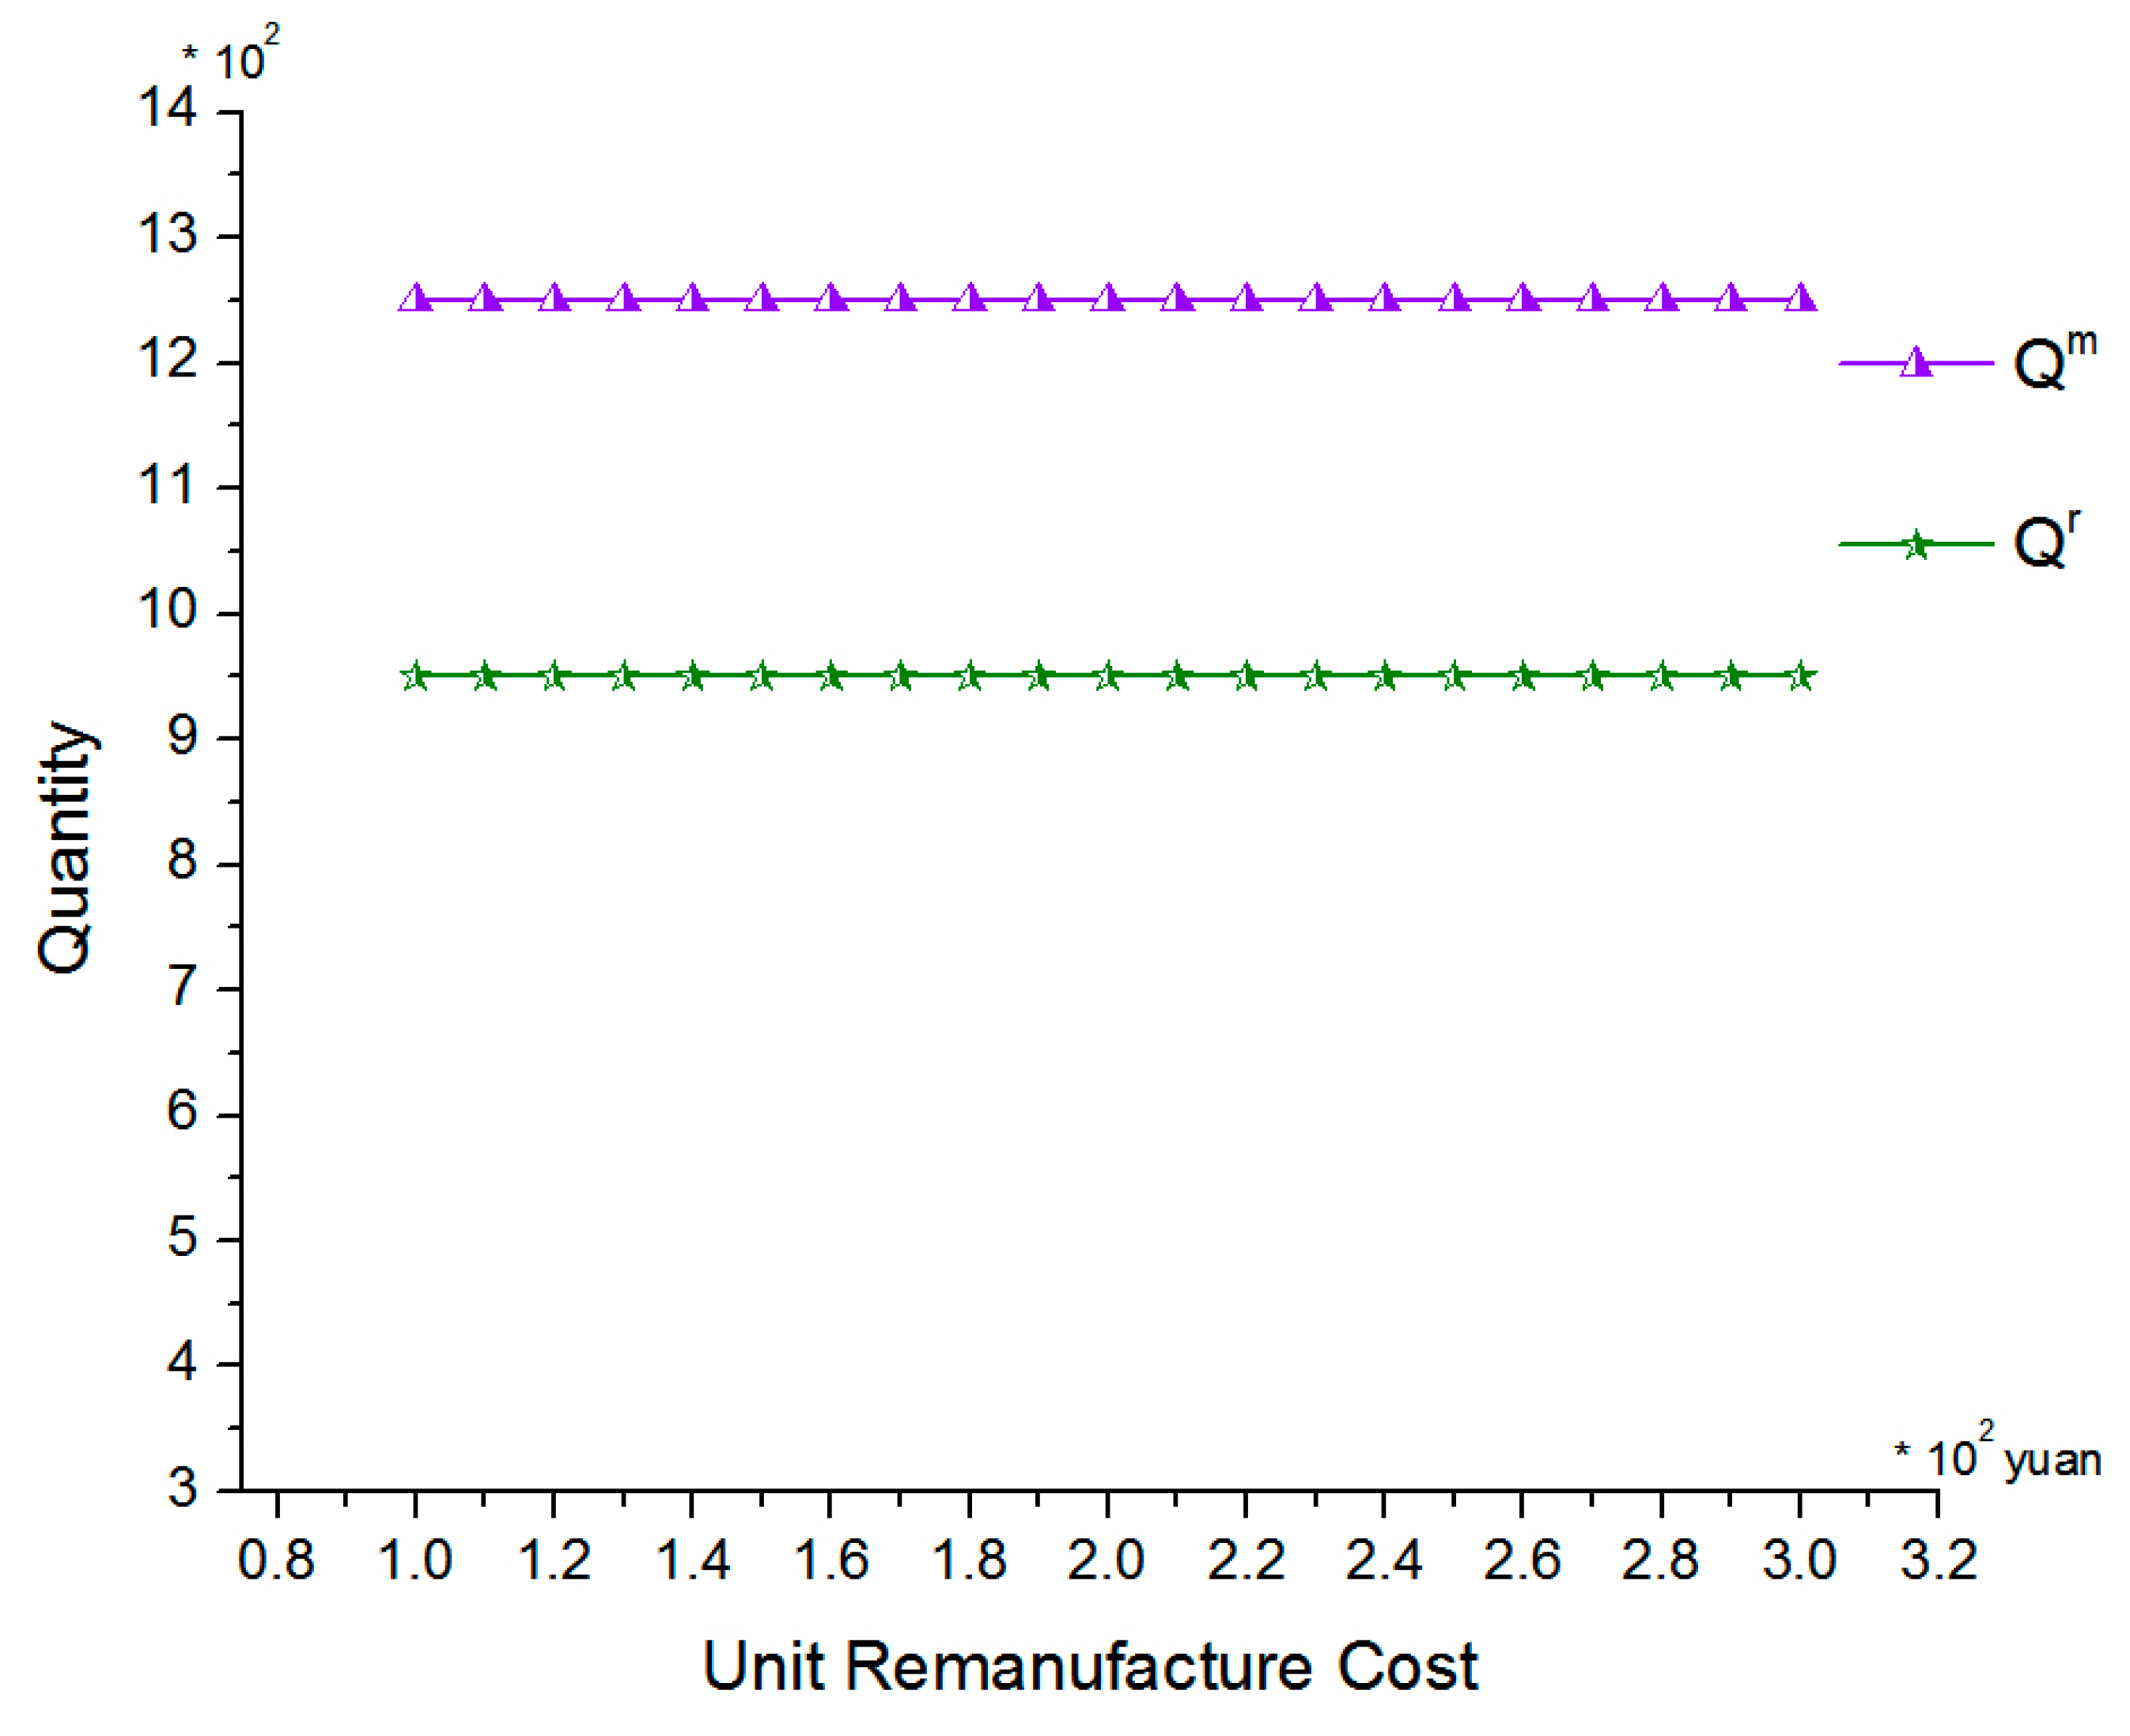
- How many end-of-life products of quality k should be remanufactured?
- How many of the total products should be sold and how many be stocked?
2.3. Model Definition
3. Illustration of the Proposed Method
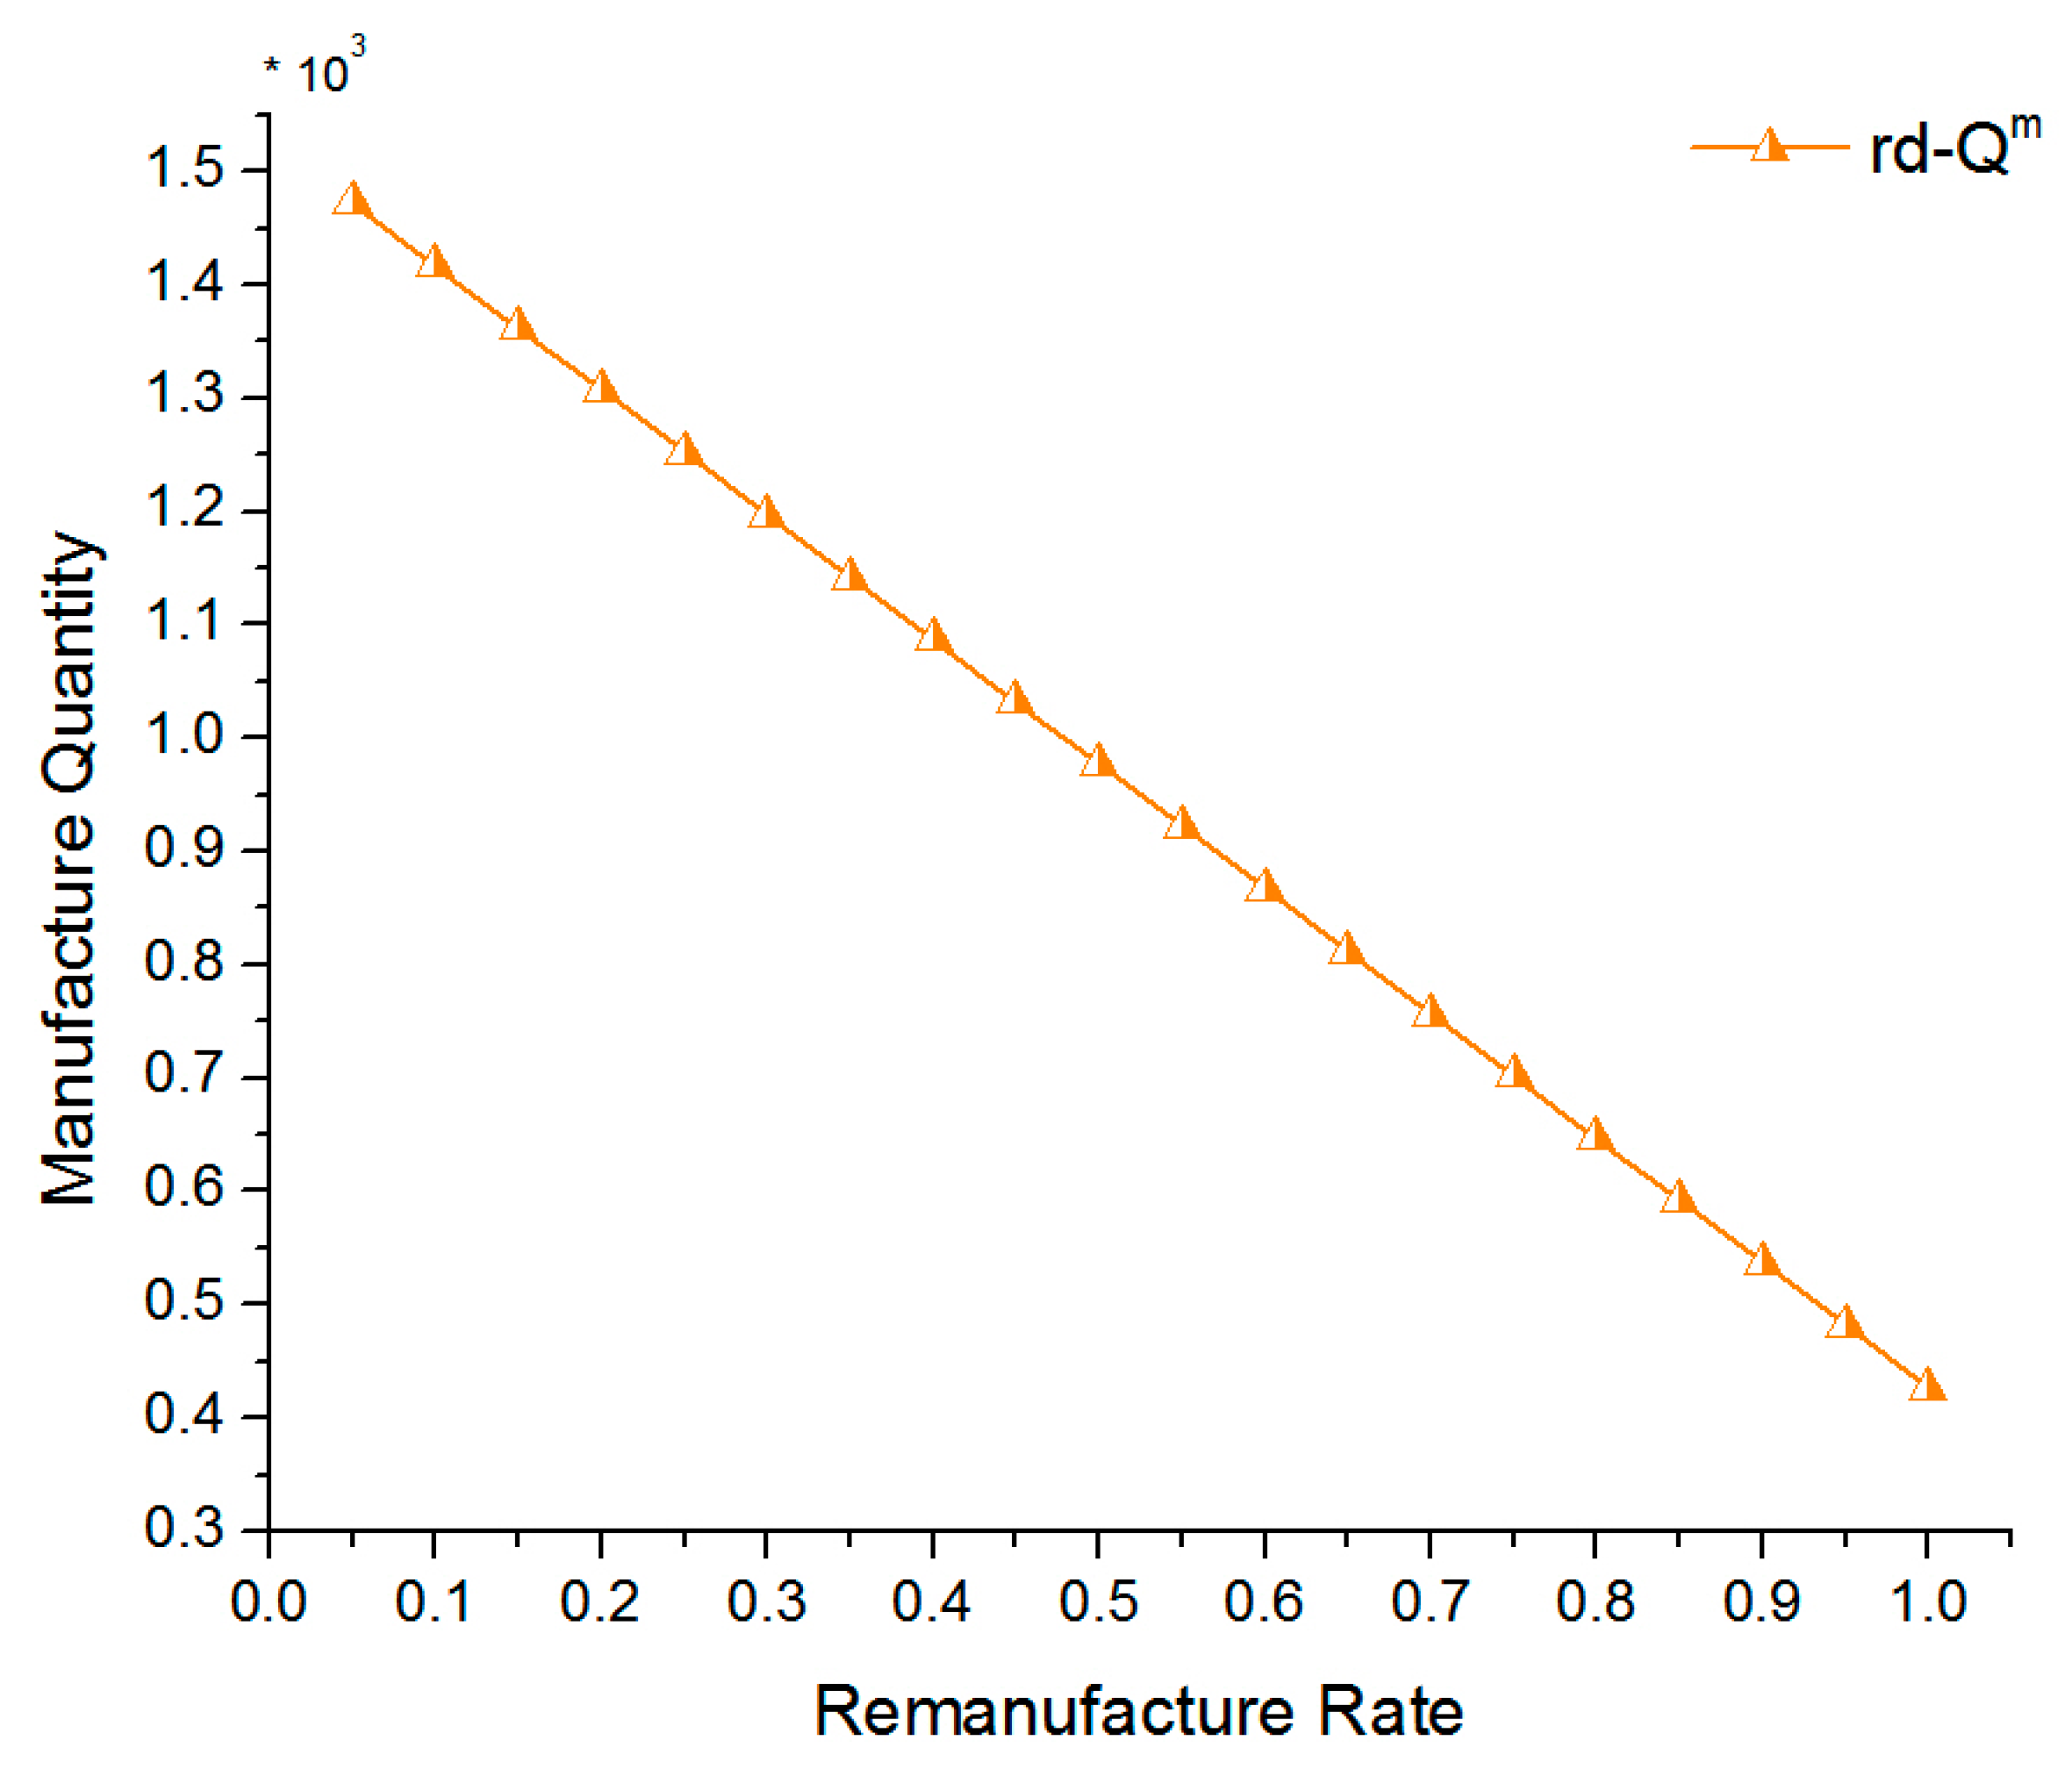
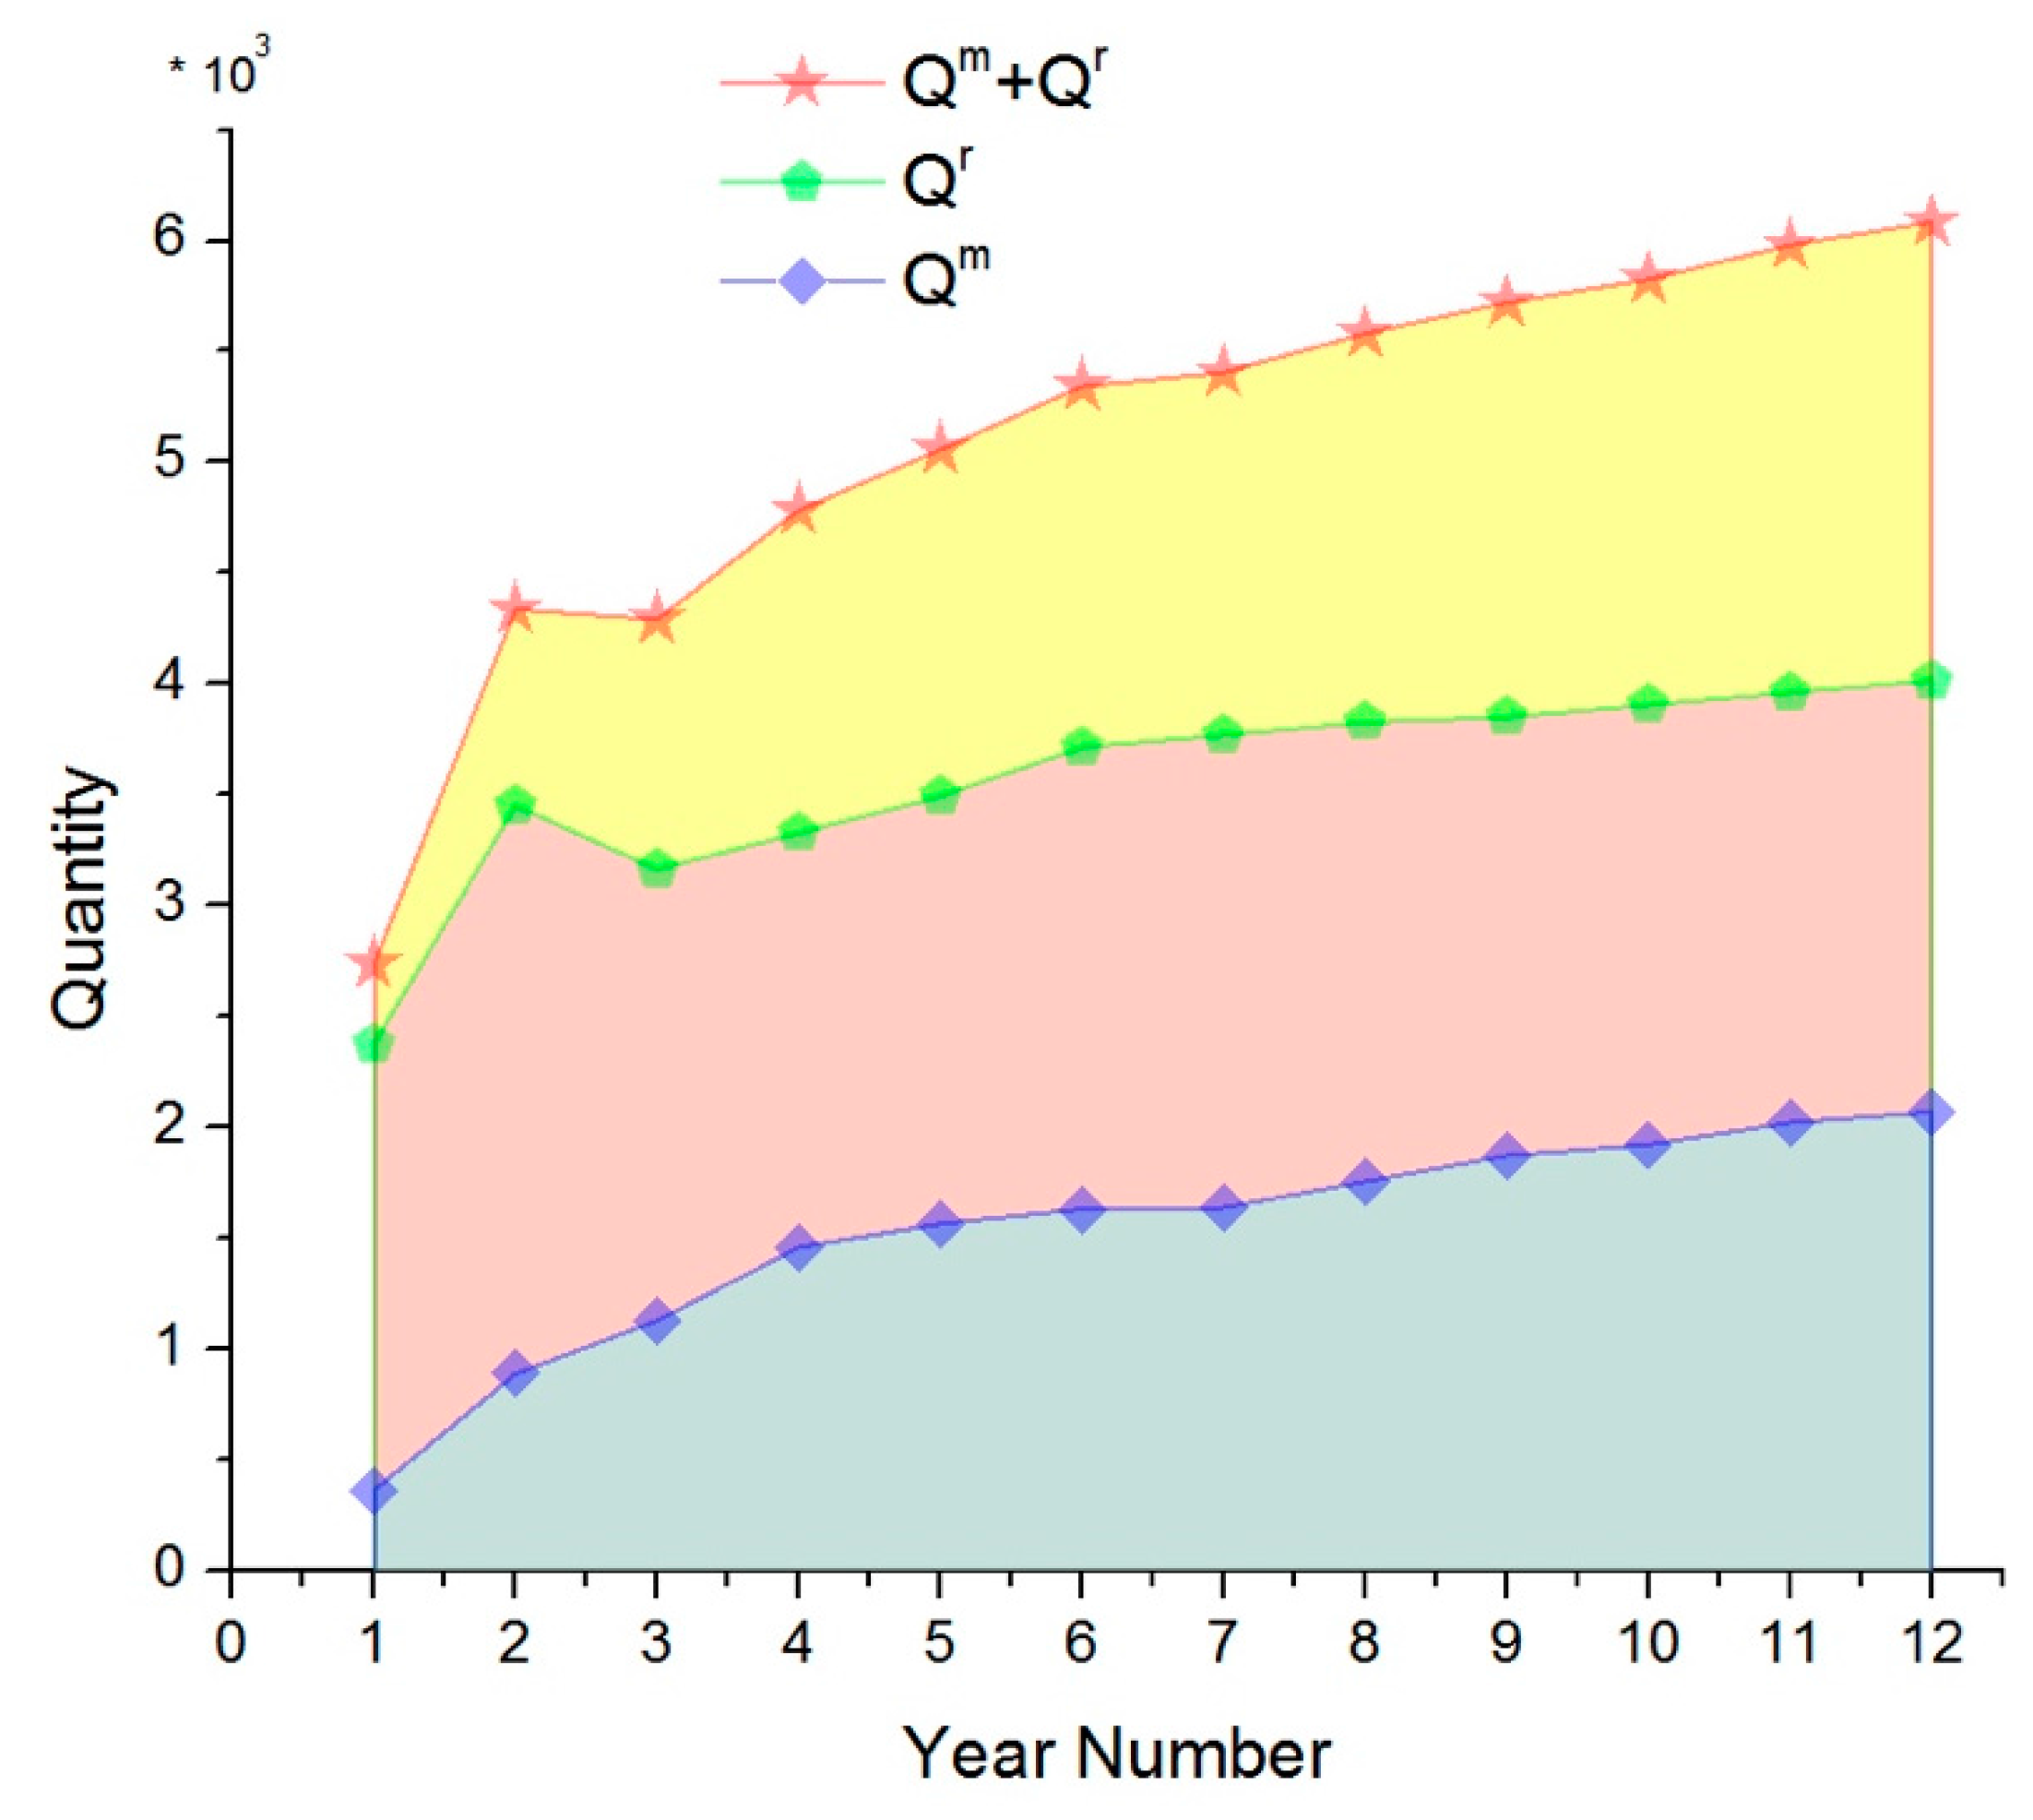
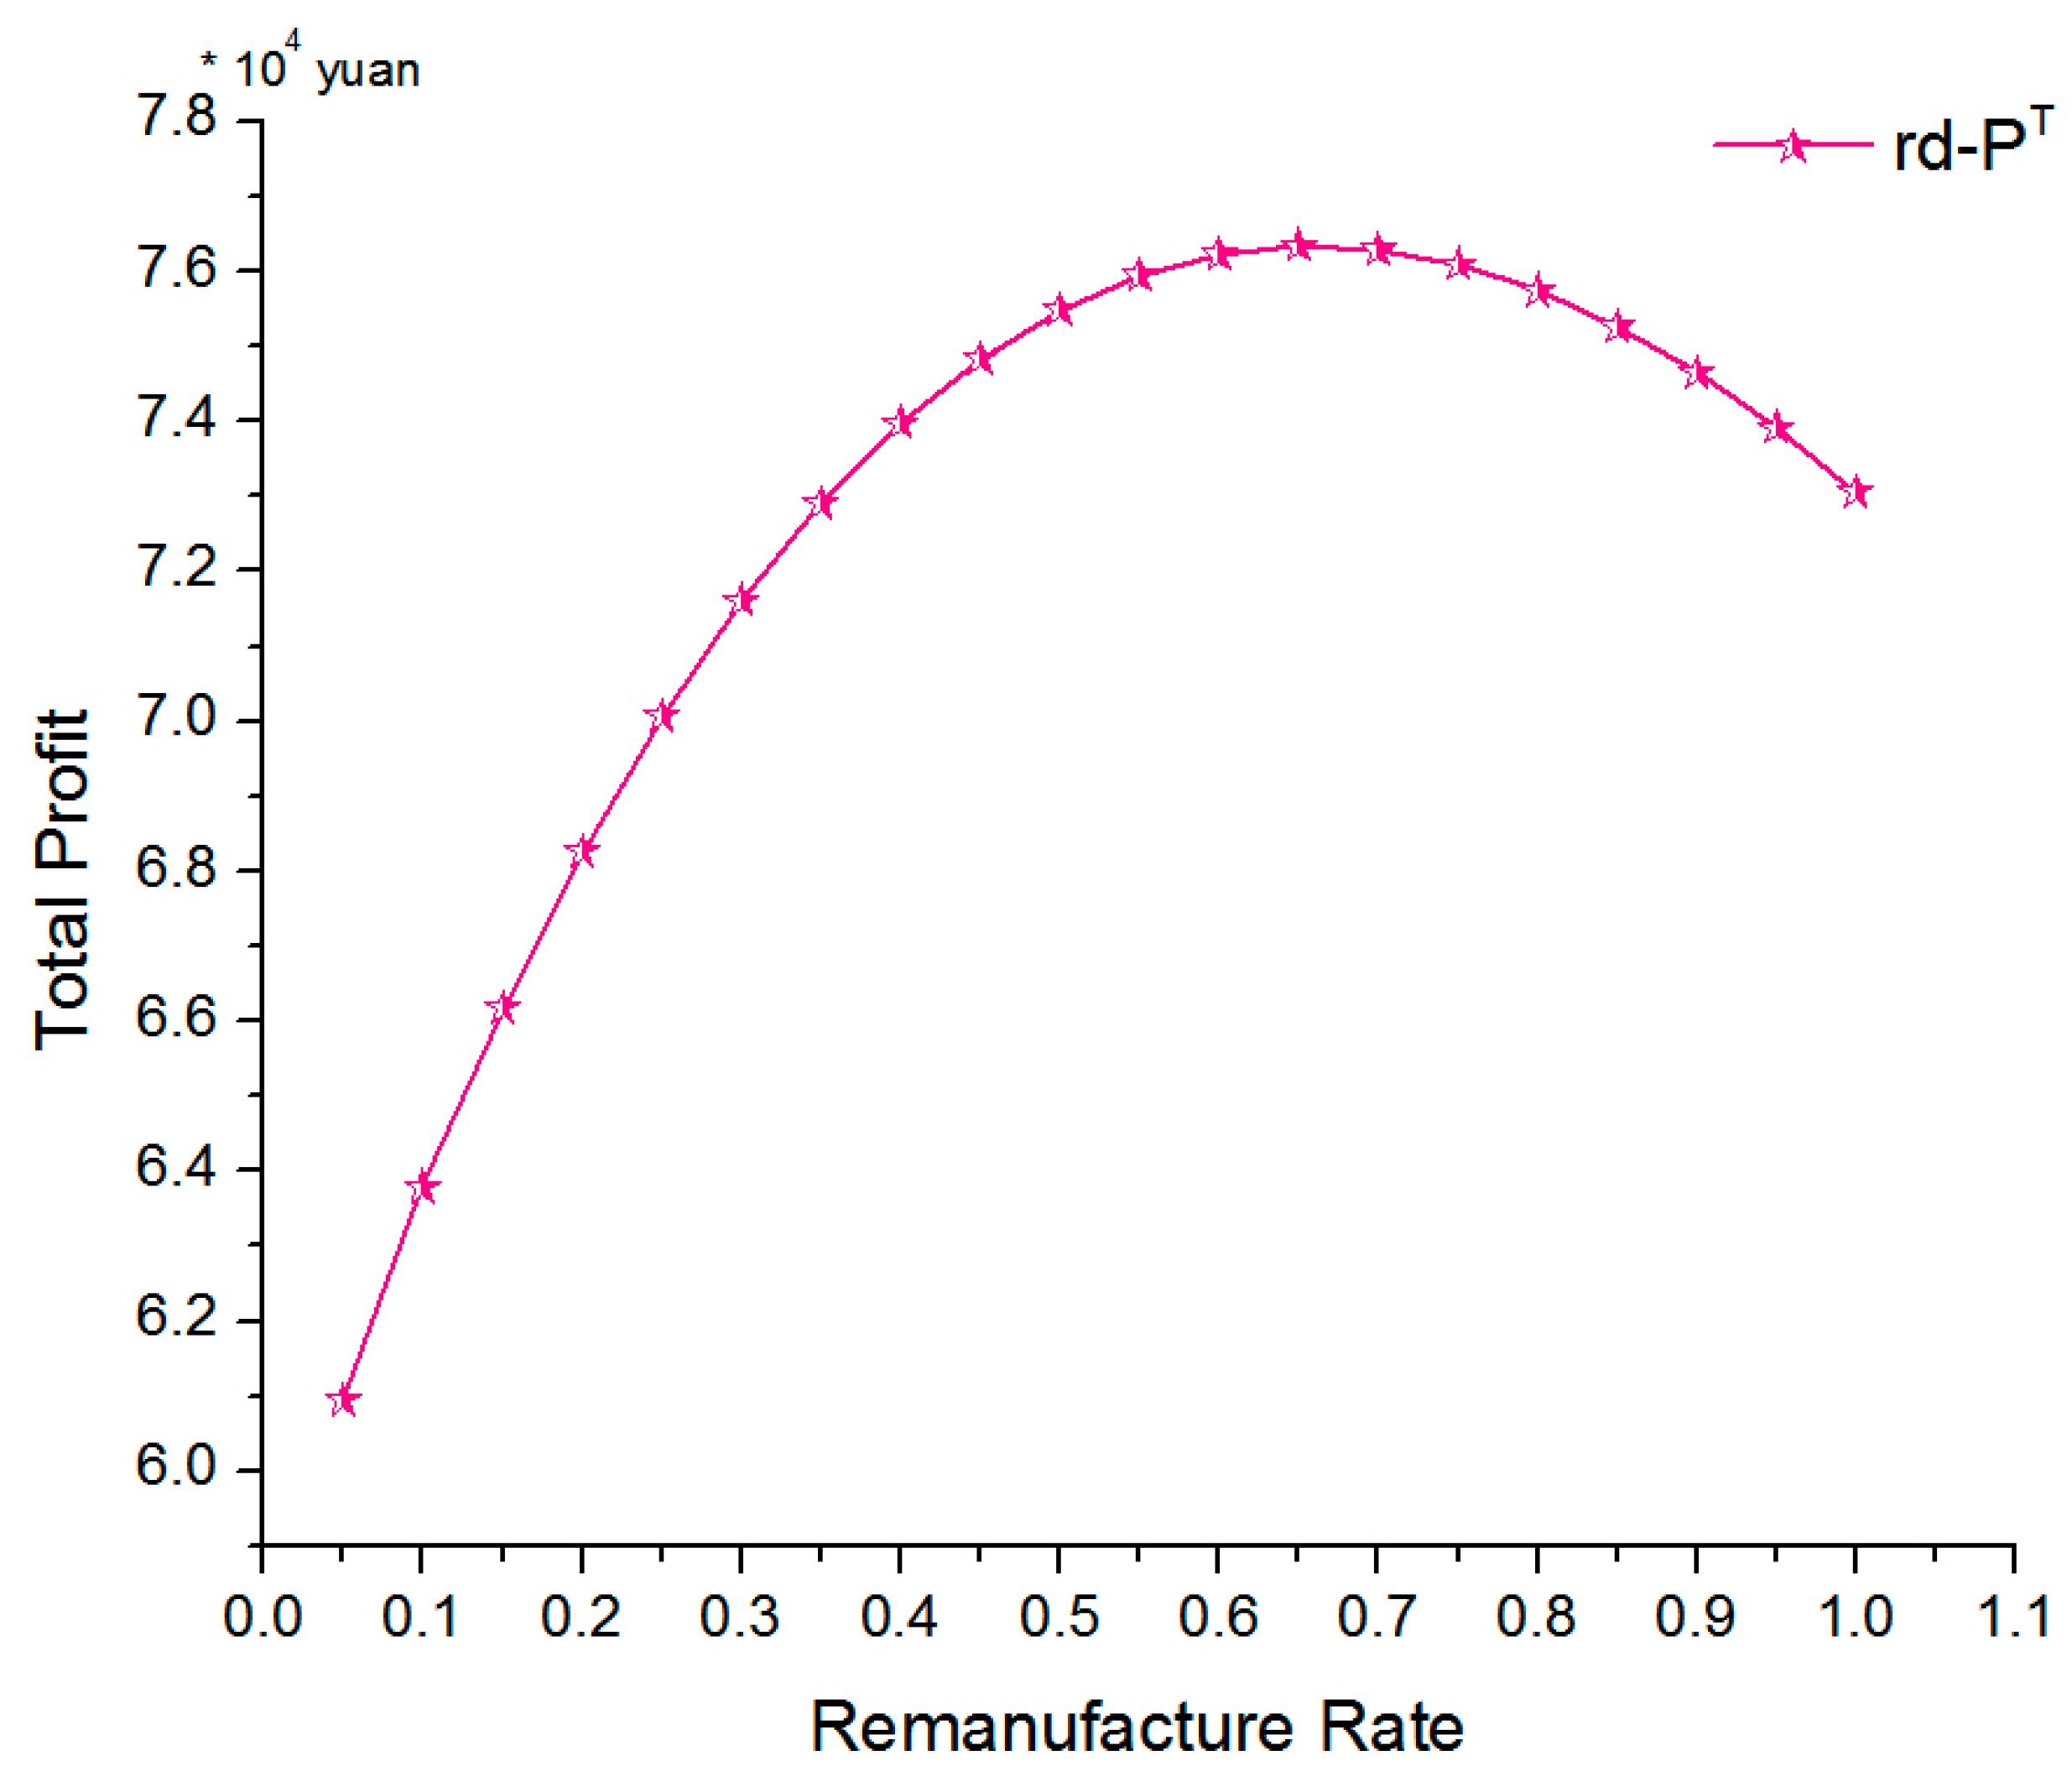
3.1. Optimal Remanufacturing Quantity
3.2. Optimal Manufacturing Quantity
4. Numerical Experiments and Real-Life Case Analysis
4.1. Impact Analysis of System Variables
4.1.1. Example 1
4.1.2. Example 2
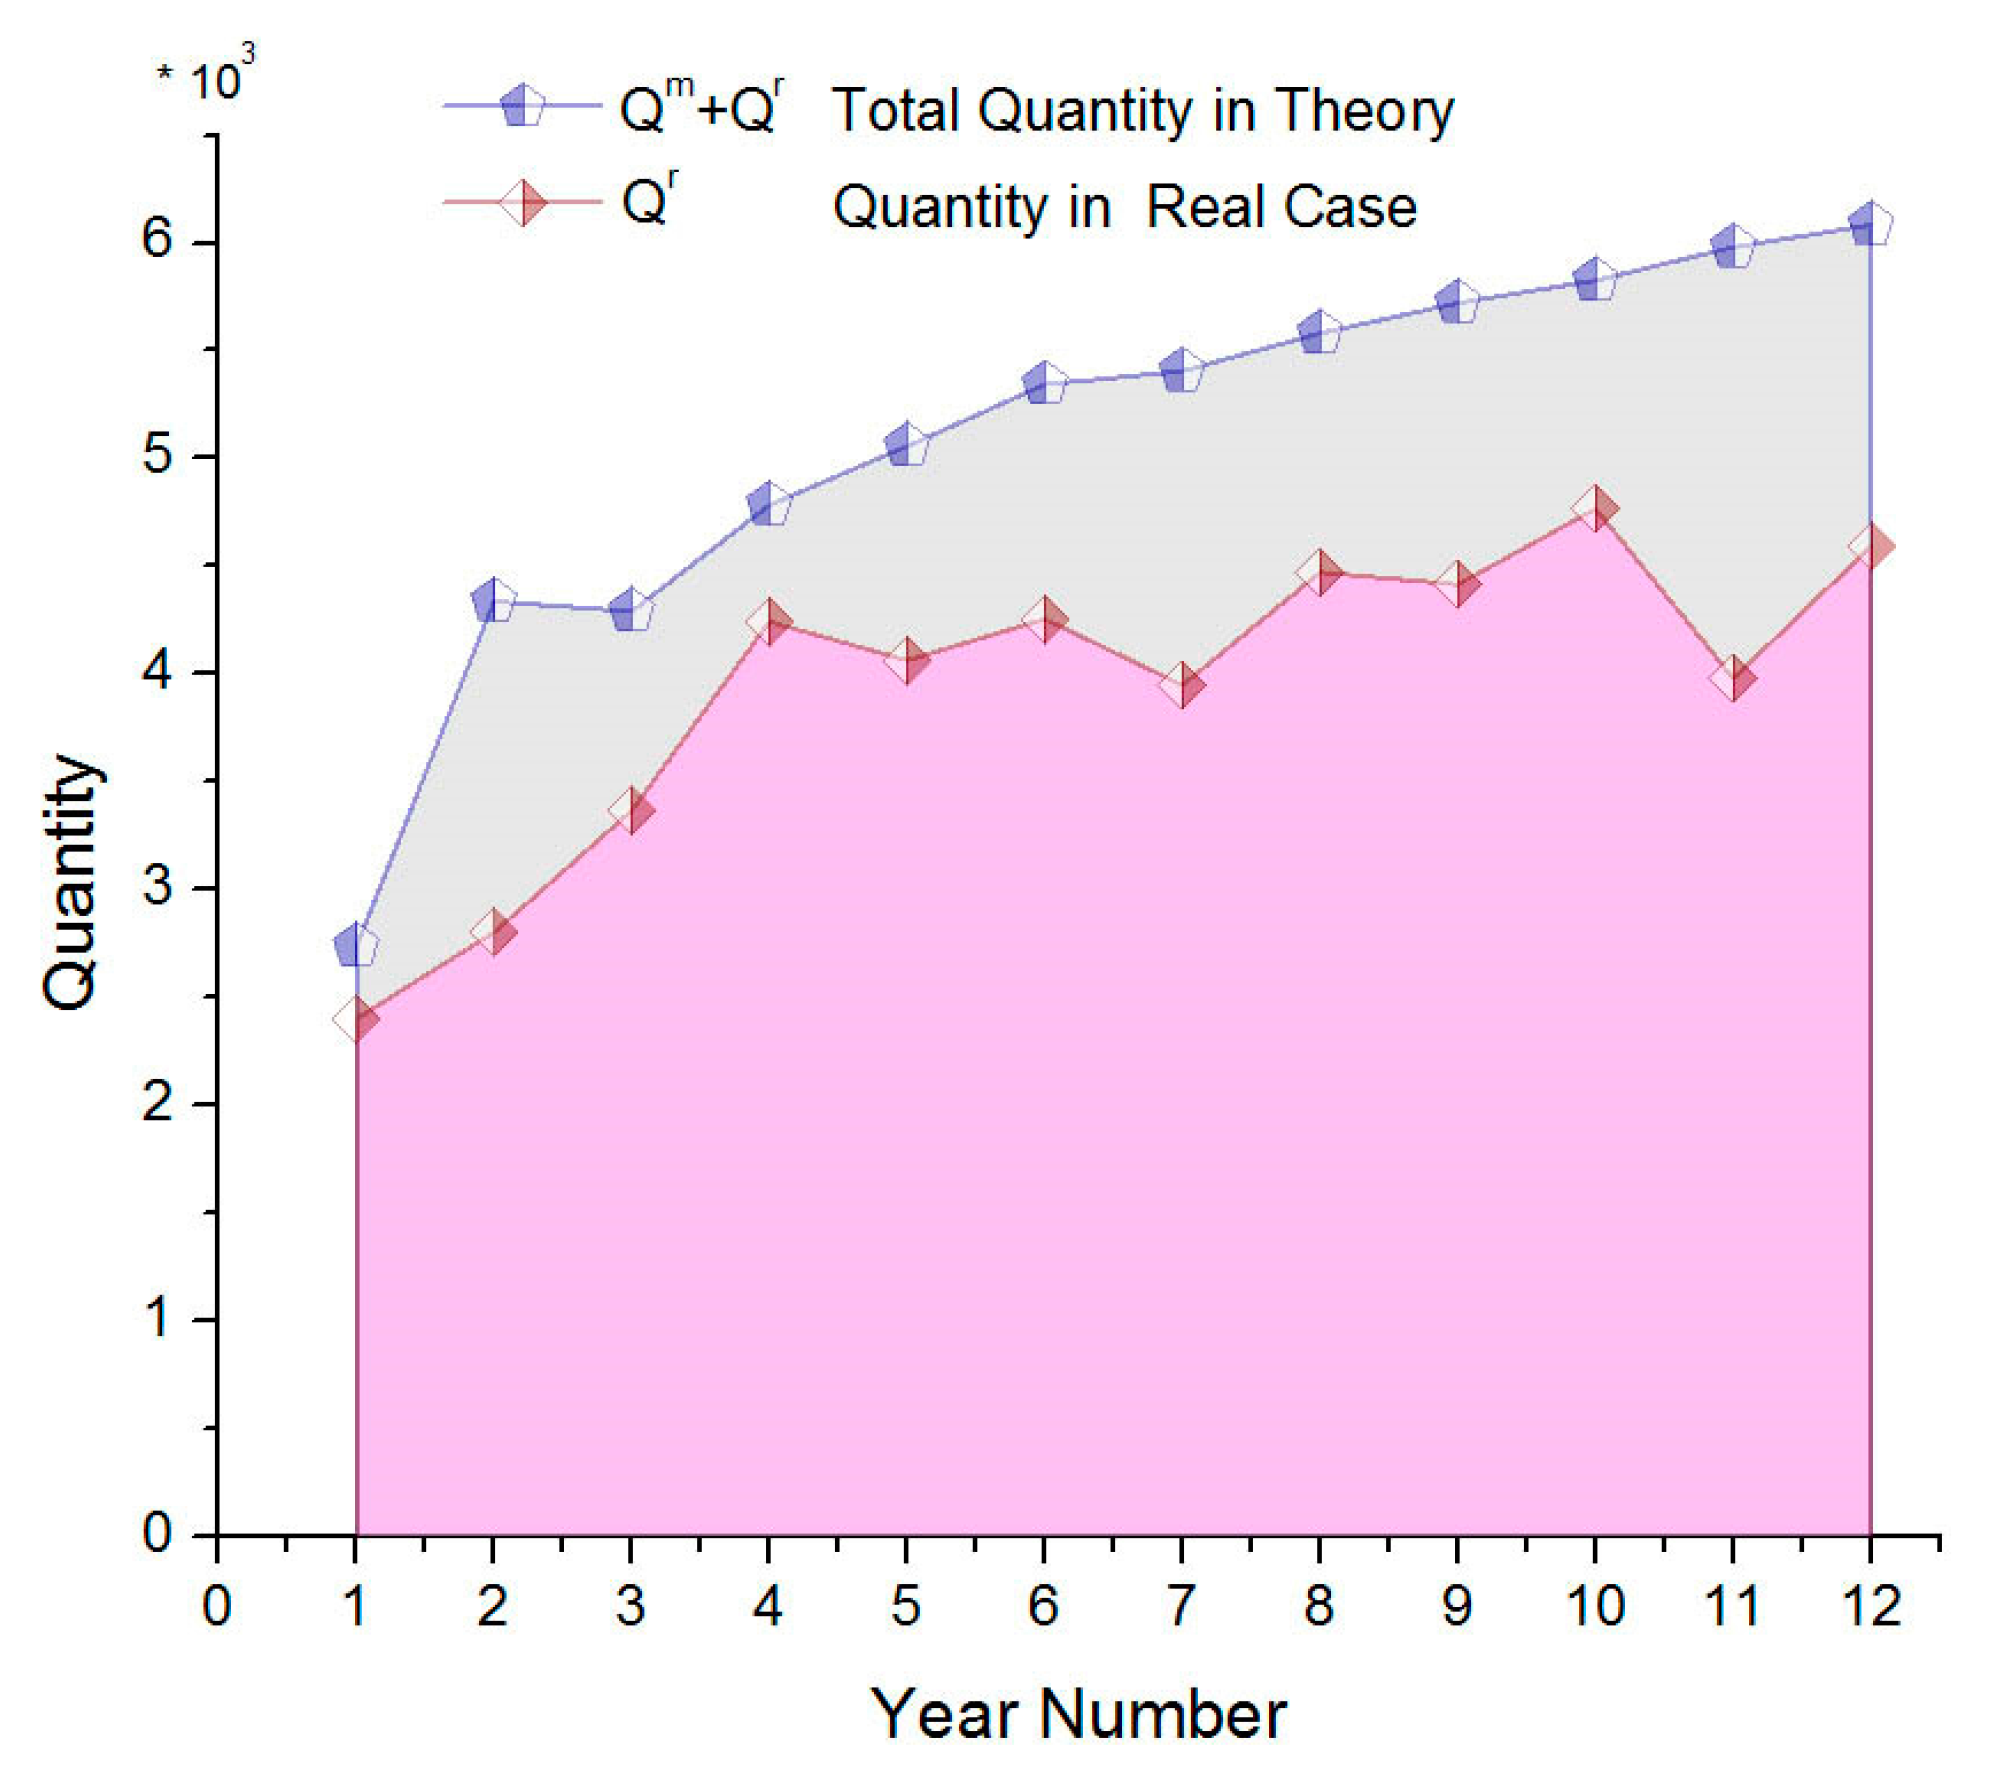
4.2. Real-Life Case Analysis
4.2.1. Comparison of the Joint Remanufacturing System with Single Remanufacturing of Real-life Case
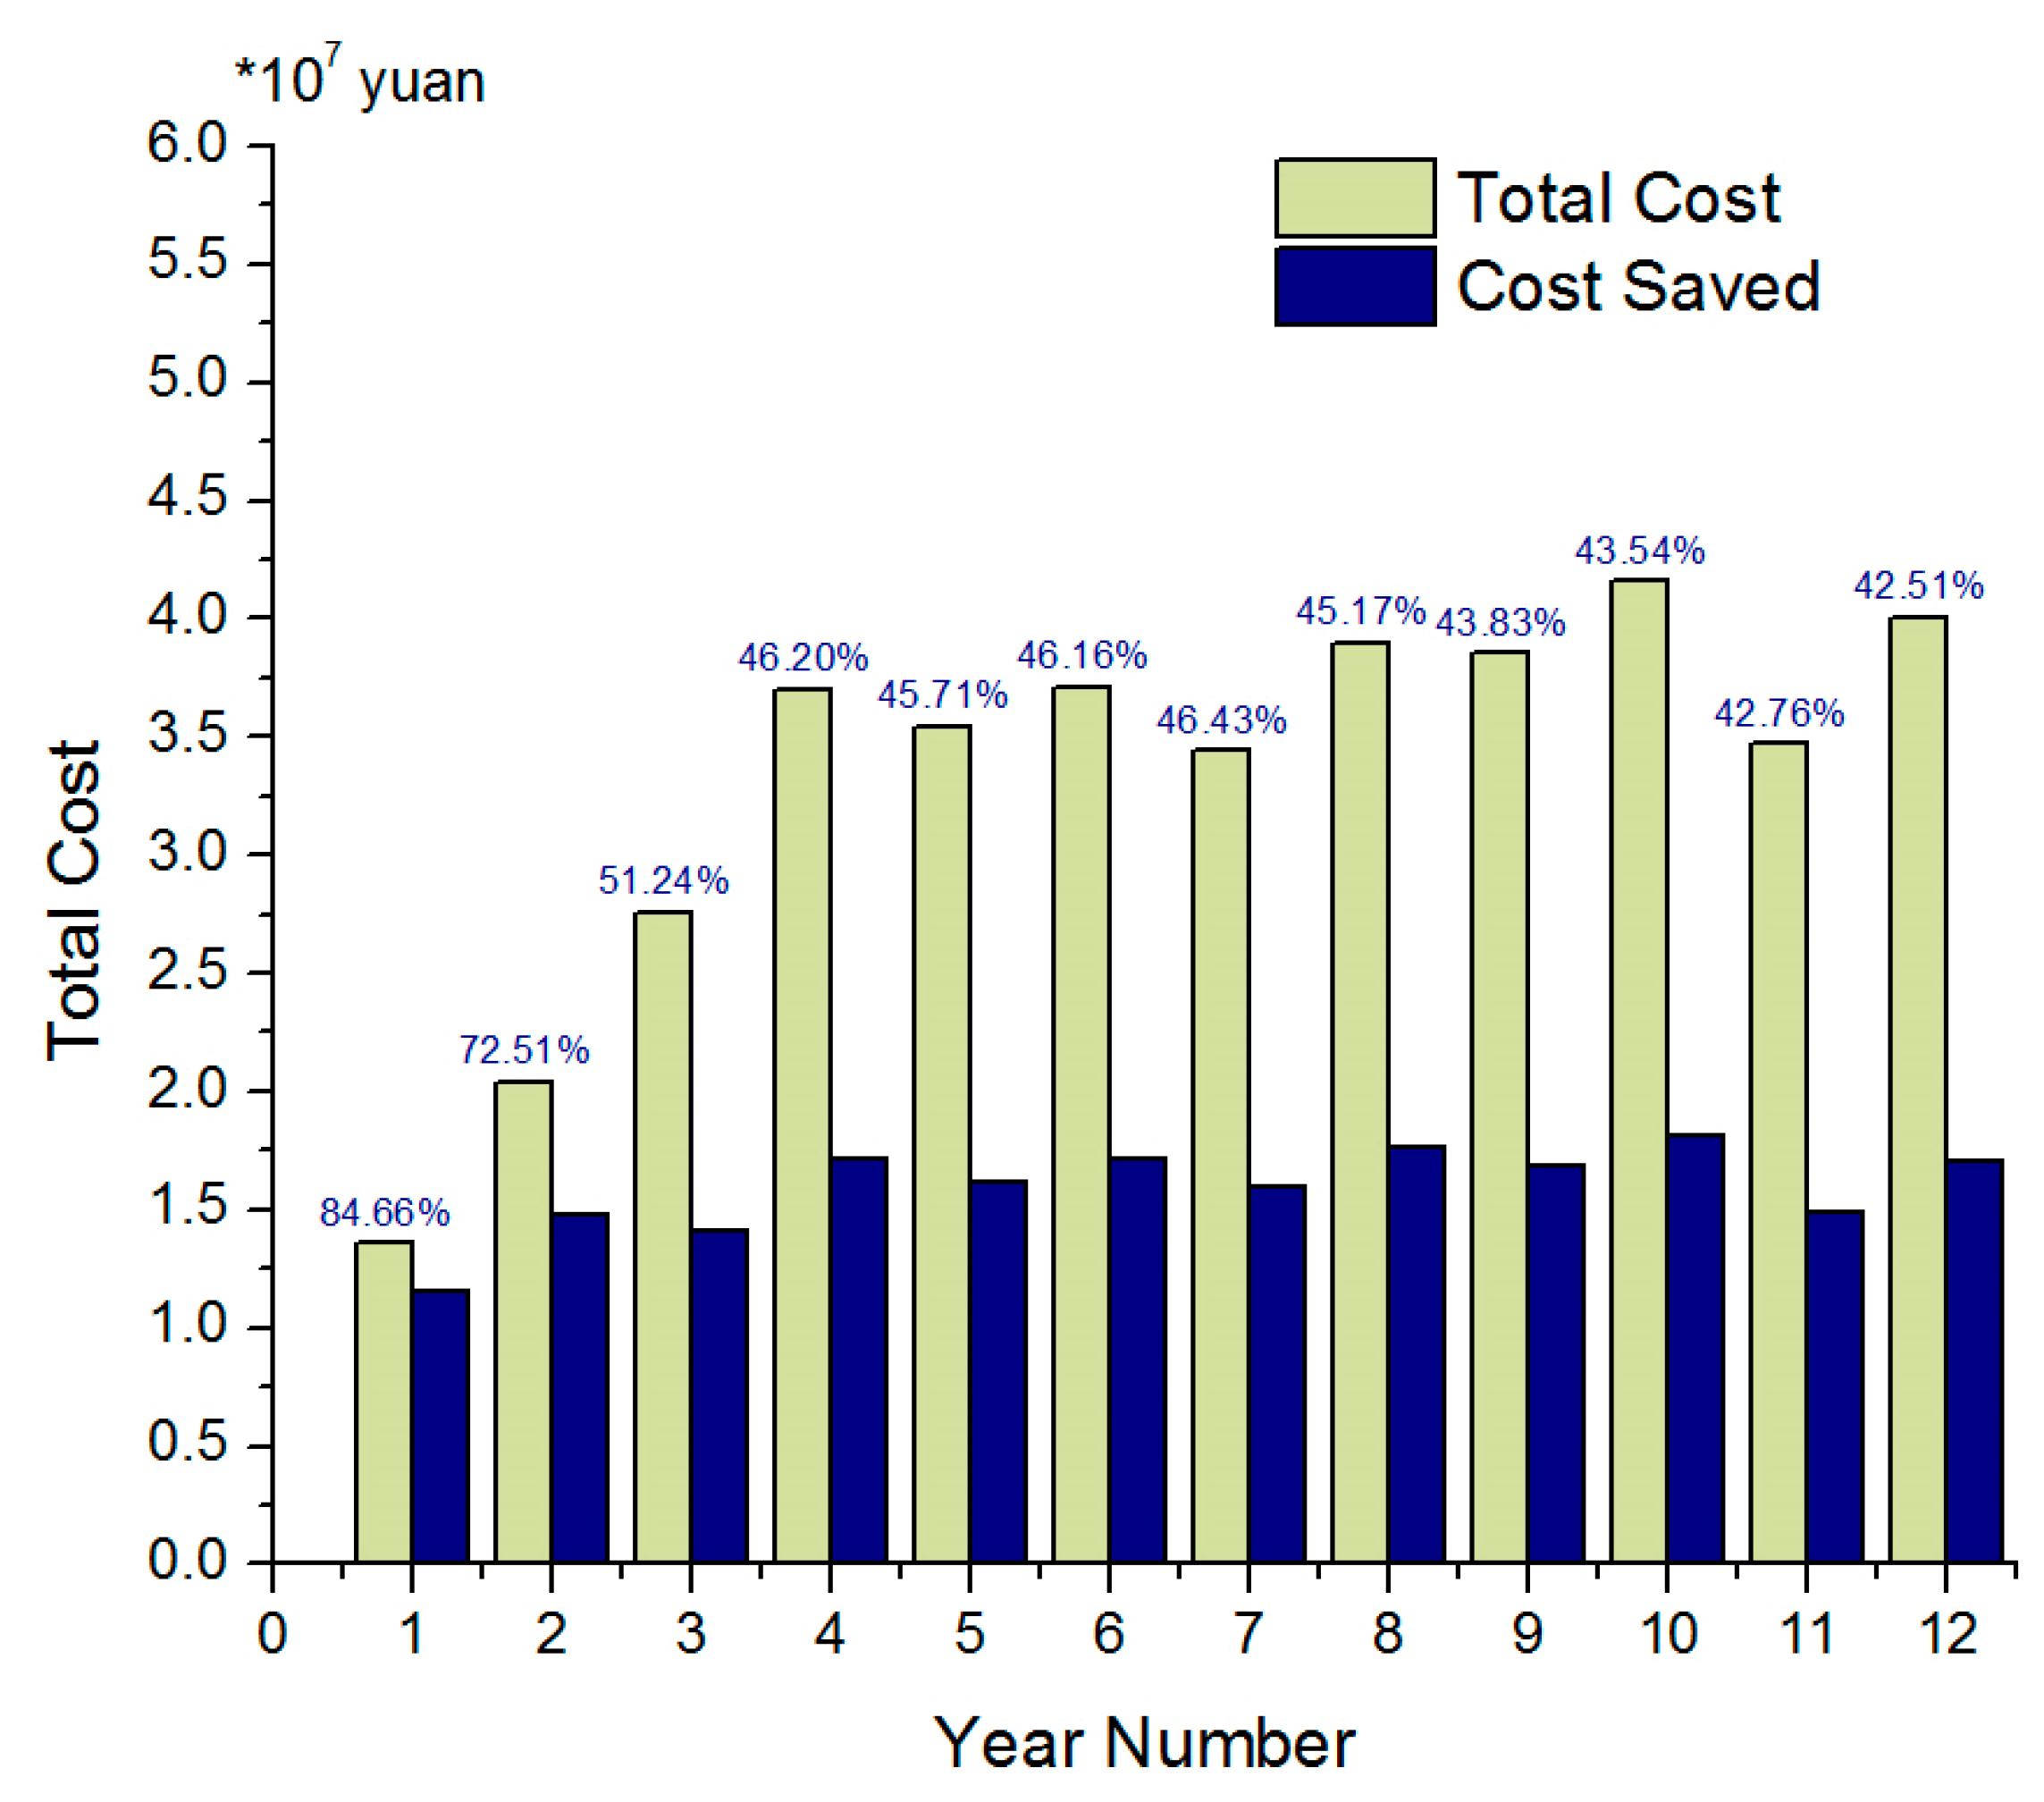
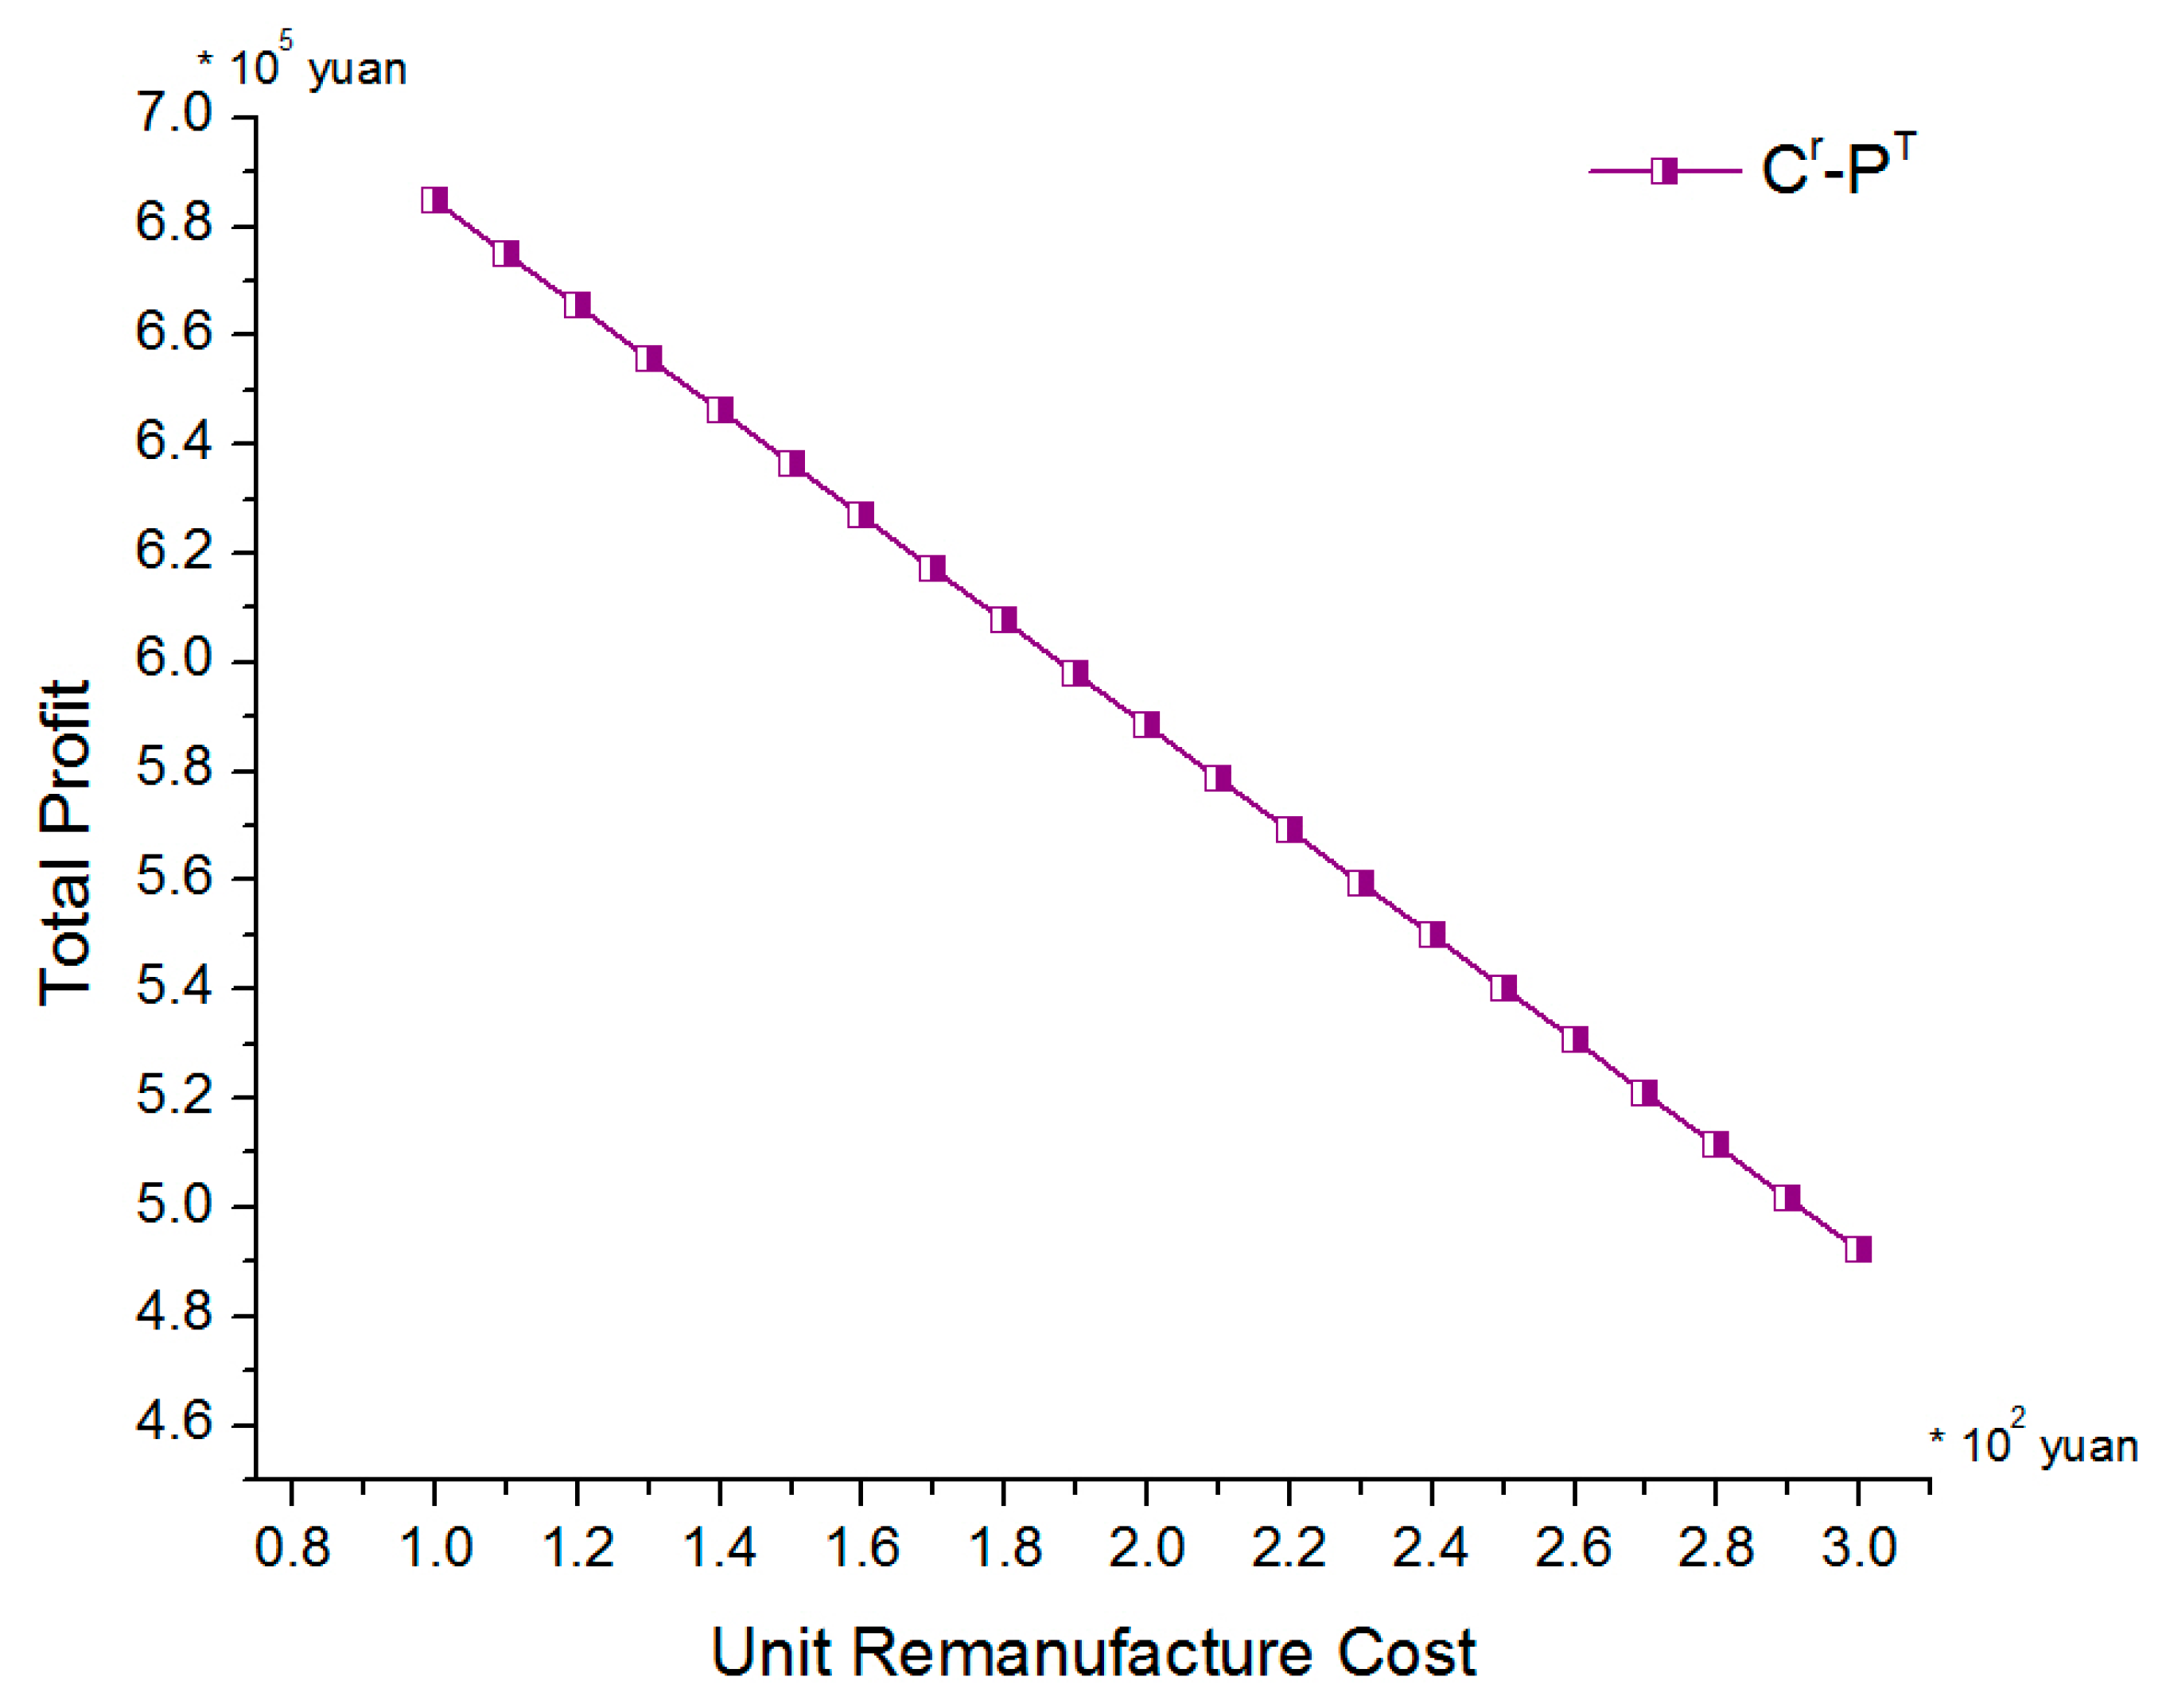
4.2.2. Comparison of the Remanufacture with Manufacture
5. Conclusions and Discussion
- (1)
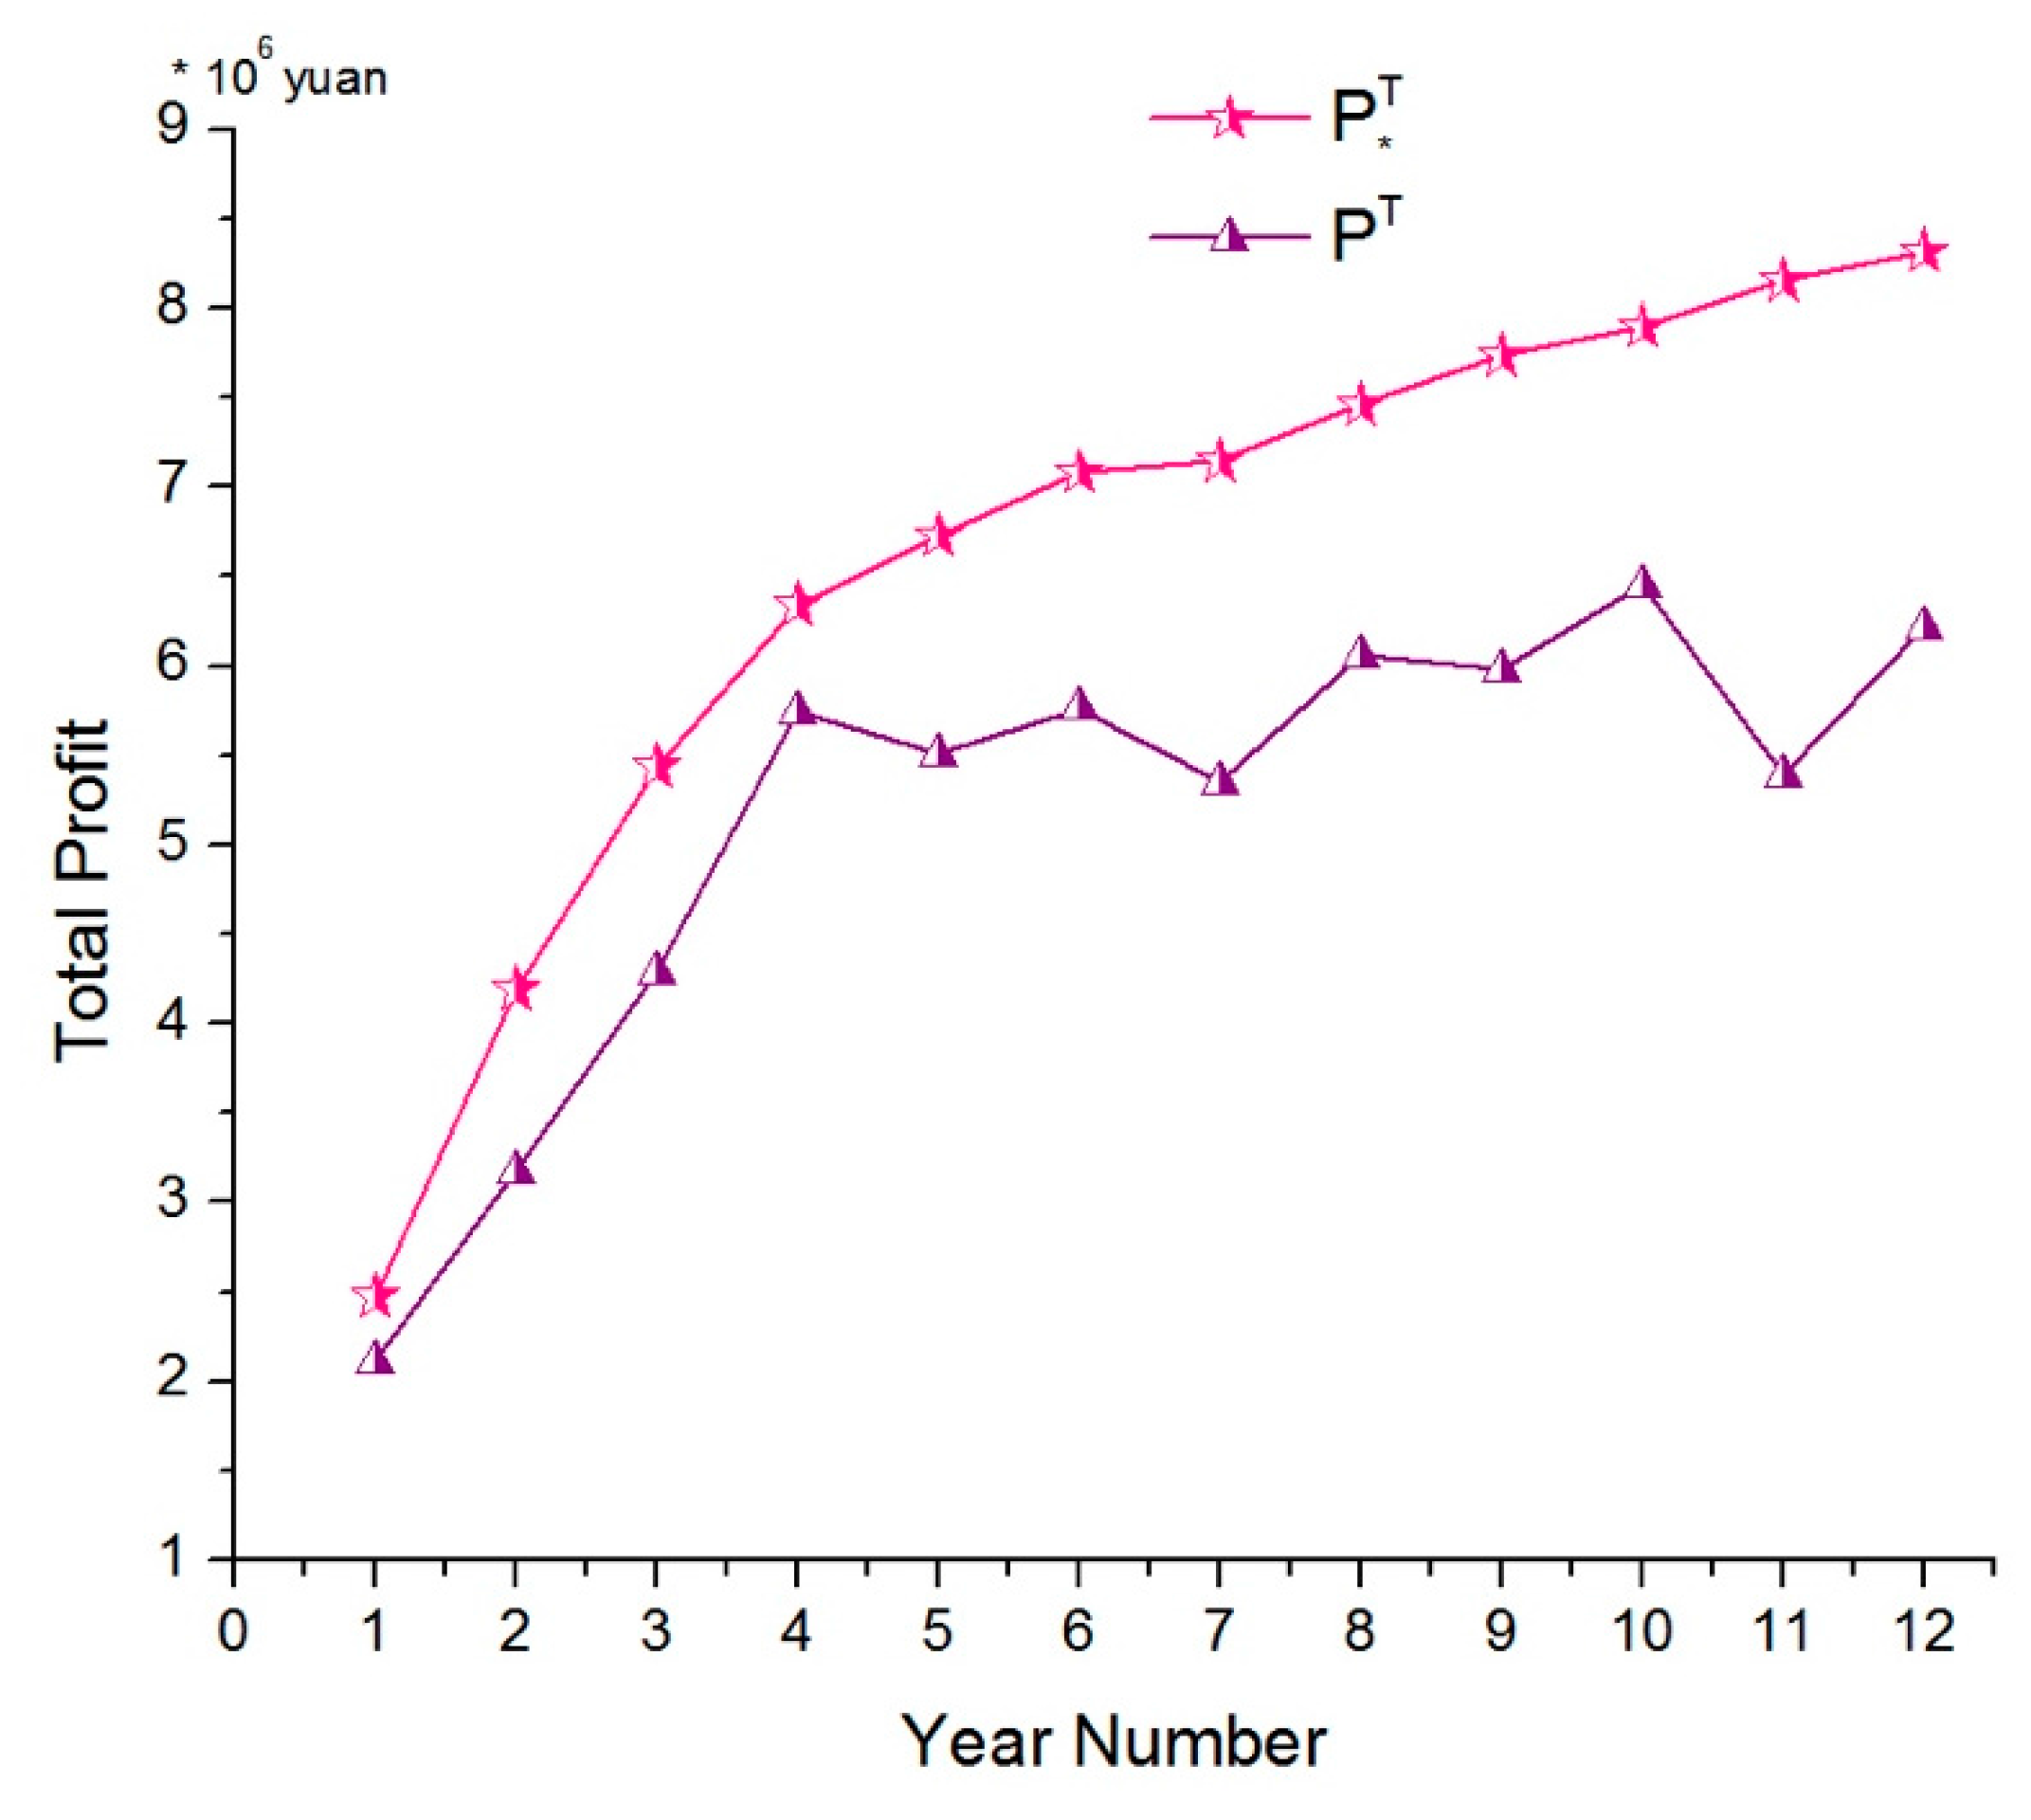
- The total profits can be boosted by about 20% (the first year)–40% (the eleventh year) according to the production policy developed in our model.
- (2)
- The average costs can be reduced by more than 25% according to the production policy developed in our theory model.
- (1)
- Comparing the theoretic result of optimal joint remanufacturing policy with the production in the original equipment manufacturing, the results indicate that a cost reduction of more than 40% could be achieved when the optimal remanufacturing policy of our model is implemented.
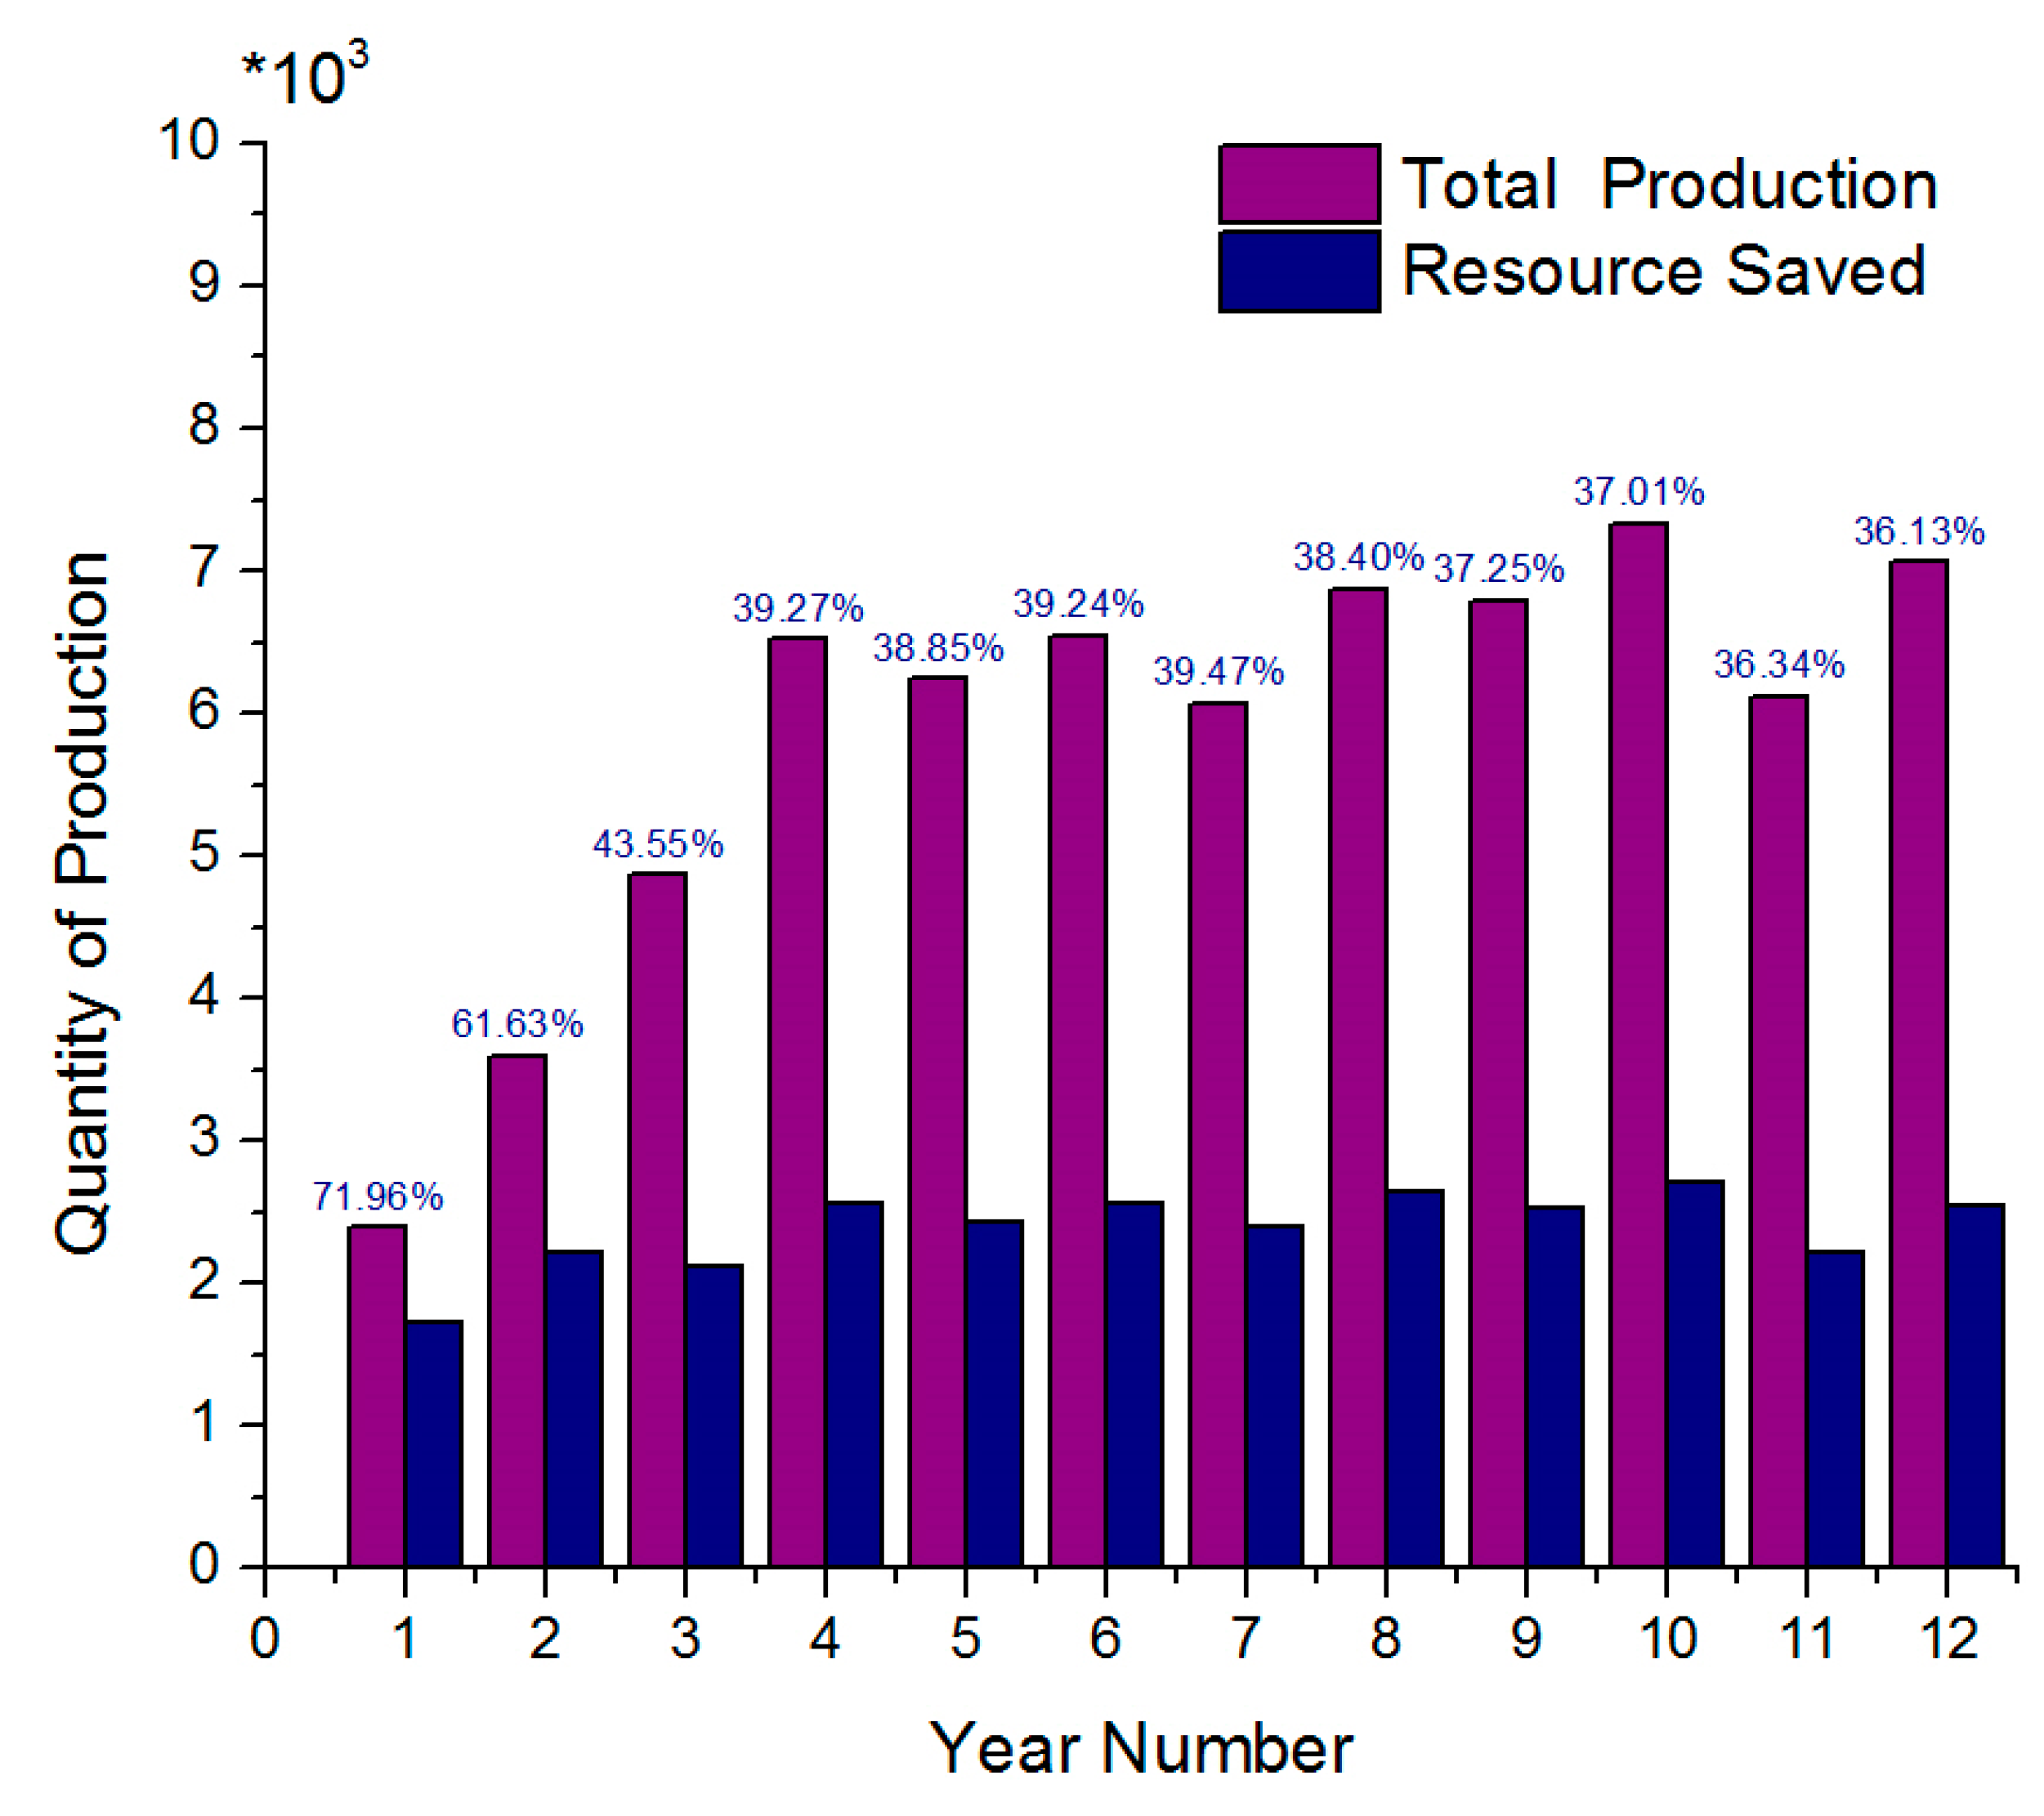
- (2)
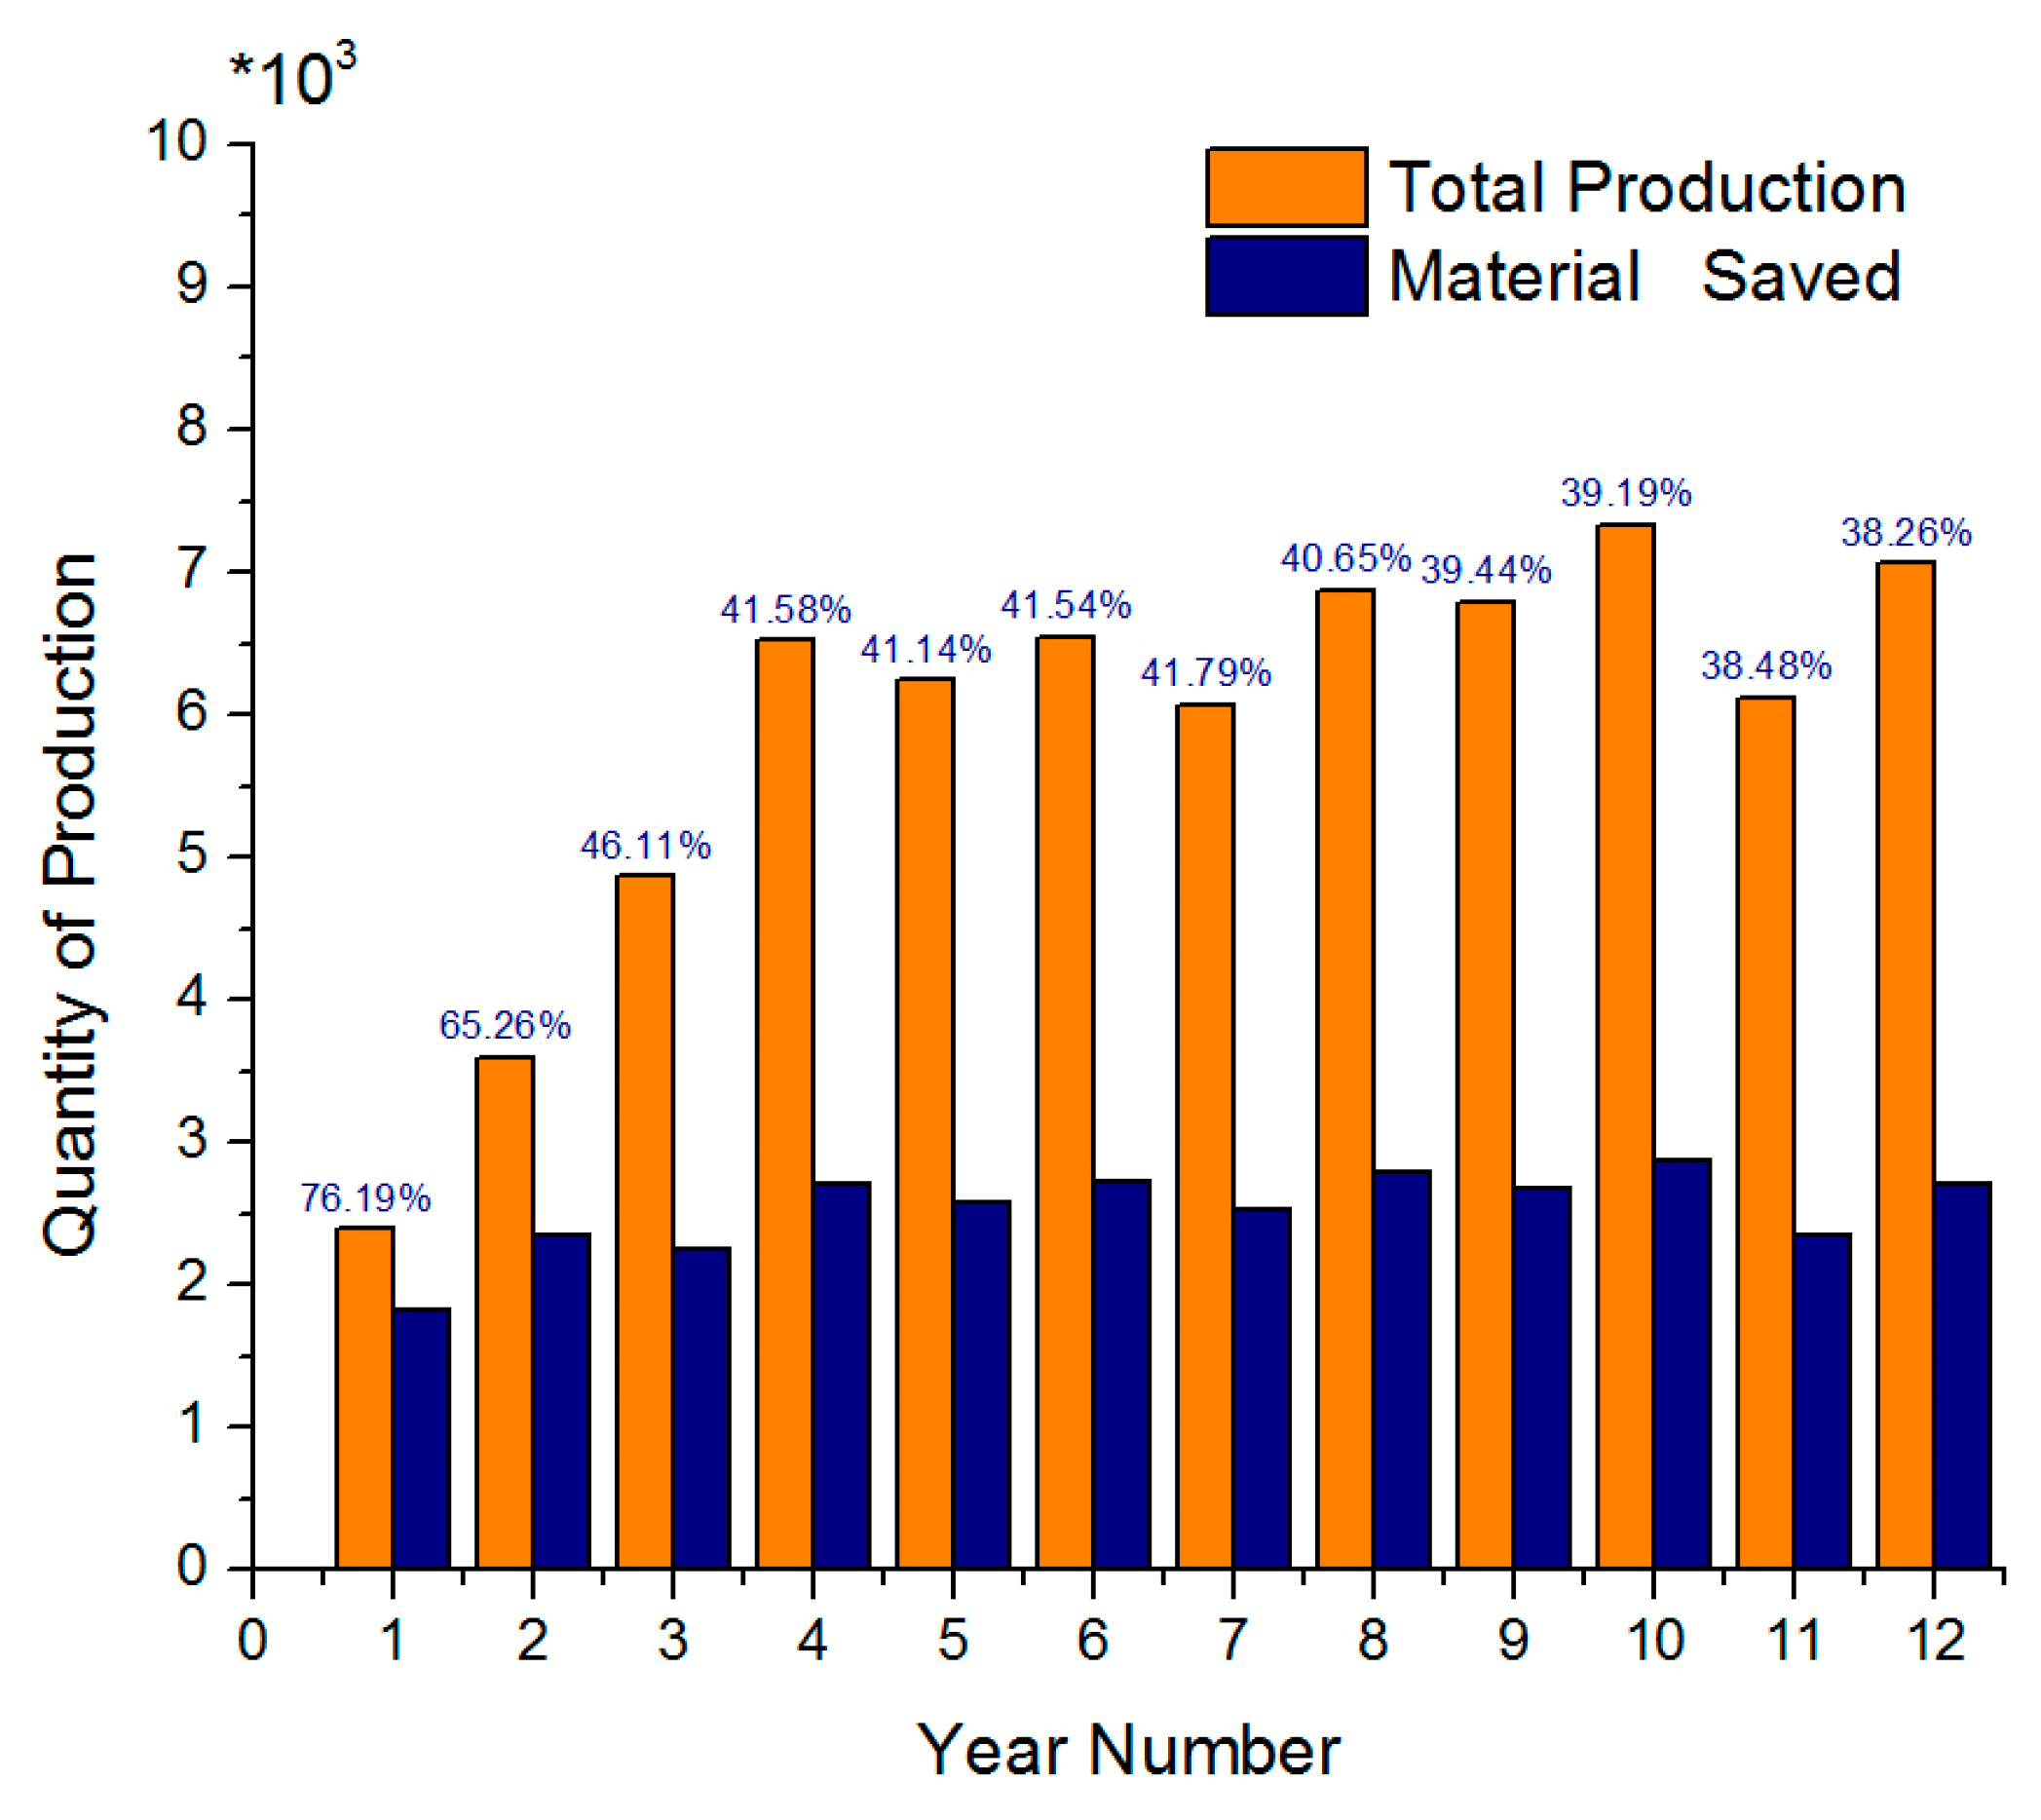
- Under the same conditions, a resource saving of more than 35% could be achieved when the optimal remanufacturing policy of our model is implemented.
- (3)
- Similarly, a material savings of more than 40% could be achieved in the model of the joint remanufacturing system created above when compared with the production in the original equipment manufacturing.
- (1)
- In this study, we assume the remanufactured products are completely the same as newly-produced products and sell them at the same price, and it will be meaningful to investigate the model in which the newly-produced products and remanufactured products have different demands and are sold at different prices.
- (2)
- Additionally, for convenience's sake, the manufacturing and remanufacturing lead times have been assumed negligible. In future research, it could be taken into account.
- (3)
- Furthermore, this study only considers the production in one lead time. In future research, it could be more interesting to apply a Markov process to the analysis of the joint remanufacturing system.
- (4)
- Finally, in this study, we analyze the total profit with respect to the quantity of manufacture and the remanufacturing rate separately by assuming another variable is fixed to obtain the profit maximization. In future study, we should take the total profits as the function of two variables and use the partial derivative to obtain its optimum value.
Acknowledgments
Author Contributions
Conflicts of Interest
References
- Gehin, A.; Zwolinski, P.; Brissaud, D. A tool to implement sustainable end-of-life strategies in the product development phase. J. Clean. Prod. 2008, 16, 566–576. [Google Scholar] [CrossRef]
- Wei, S.; Cheng, D.; Sundin, E.; Tang, O. Motives and barriers of the remanufacturing industry in China. J. Clean. Prod. 2015, 94, 340–351. [Google Scholar] [CrossRef]
- Ramirez, E.; Gonzalez, R.J.; Moreira, G.J. Barriers and bridges to the adoption of environmentally-sustainable offerings. Ind. Mark. Manag. 2014, 43, 16–24. [Google Scholar] [CrossRef]
- Maimoun, M.A.; Reinhart, D.R.; Gammoh, F.T.; Bush, P.M. Emissions from U.S. waste collection vehicles. Waste Manag. 2013, 33, 1079–1089. [Google Scholar] [CrossRef] [PubMed]
- Tsiliyannis, C.A. Sustainability by cyclic manufacturing: Assessment of resource preservation under uncertain growth and returns. Resour. Conserv. Recycl. 2015, 103, 155–170. [Google Scholar] [CrossRef]
- Kang, H.-Y.; Jun, Y.S.; Kim, Y.C.; Jo, H.J. Comparative analysis on cross-national system to enhance the reliability of remanufactured products. Procedia CIRP 2016, 40, 280–284. [Google Scholar] [CrossRef]
- Chen, K.C.; Huang, S.H.; Lian, I.W. The development and prospects of the end-of-life vehicle recycling system in Taiwan. Waste Manag. 2010, 30, 1661–1669. [Google Scholar] [CrossRef] [PubMed]
- Van der Laan, E.A.; Teunter, R.H. Simple heuristics for push and pull remanufacturing policies. Eur. J. Oper. Res. 2006, 175, 1084–1102. [Google Scholar] [CrossRef]
- Tsiliyannis, C.A. Internal cycle modeling and environmental assessment of multiple cycle consumer products. Waste Manag. 2012, 32, 177–193. [Google Scholar] [CrossRef] [PubMed]
- Tian, J.; Chen, M. Sustainable design for automotive products: Dismantling and recycling of end-of-life vehicles. Waste Manag. 2014, 34, 458–467. [Google Scholar] [CrossRef] [PubMed]
- Wei, H.; Jun, Y. Remanufacturing and benefits analysis of construction machinery hydraulic valves. China Surf. Eng. 2013, 26, 5. [Google Scholar]
- Giri, B.C.; Sharma, S. Optimal production policy for a closed-loop hybrid system with uncertain demand and return under supply disruption. J. Clean. Prod. 2016, 112, 2015–2028. [Google Scholar] [CrossRef]
- Koyanaka, S.; Kobayashi, K. Incorporation of neural network analysis into a technique for automatically sorting lightweight metal scrap generated by ELV shredder facilities. Resour. Conserv. Recycl. 2011, 55, 515–523. [Google Scholar] [CrossRef]
- Ohno, H.; Matsubae, K.; Nakajima, K.; Kondo, Y.; Nakamura, S.; Nagasaka, T. Toward the efficient recycling of alloying elements from end of life vehicle steel scrap. Resour. Conserv. Recycl. 2015, 100, 11–20. [Google Scholar] [CrossRef]
- Kim, T.; Glock, C.H. On the use of RFID in the management of reusable containers in closed-loop supply chains under stochastic container return quantities. Transp. Res. Part E Logist. Transp. Rev. 2014, 64, 12–27. [Google Scholar]
- Hjaila, K.; Laínez-Aguirre, J.M.; Zamarripa, M.; Puigjaner, L.; Espuña, A. Optimal integration of third-parties in a coordinated supply chain management environment. Comput. Chem. Eng. 2016, 86, 48–61. [Google Scholar] [CrossRef]
- Heiligers, B.; Ruf, J. Stochastic models for the return of used devices. In Advances in Stochastic Models for Reliability, Quality and Safety; Birkhäuser: Boston, MA, USA, 1998; pp. 113–123. [Google Scholar]
- Guo, J.H.; Li, Y. Jointed pricing decision of remanufacturing system under uncertain demand. Syst. Eng. Theory Pract. 2013, 33, 1949–1955. (In Chinese) [Google Scholar]
- Huang, Z.Q.; Zhang, B.Y. A stochastic inventory control model based on returned products permitted. In Proceedings of the 2007 International Conference on Wireless Communications, Networking and Mobile Computing, White Plains, NY, USA, 8–10 October 2007.
- Konstantaras, I.; Papachristos, S. Note on: An optimal ordering and recovery policy for reusable items. Comput. Ind. Eng. 2008, 55, 729–734. [Google Scholar] [CrossRef]
- Teunter, R.H.; Flapper, S.D.P. Optimal core acquisition and remanufacturing policies under uncertain core quality fractions. Eur. J. Oper. Res. 2011, 210, 241–248. [Google Scholar] [CrossRef]
- Mukhopadhyay, S.K.; Ma, H. Joint procurement and production decisions in remanufacturing under quality and demand uncertainty. Int. J. Prod. Econ. 2009, 120, 5–17. [Google Scholar] [CrossRef]
- Fang, Y.; Shou, B. Managing supply uncertainty under supply chain Cournot competition. Eur. J. Oper. Res. 2015, 243, 156–176. [Google Scholar] [CrossRef]
- Kumar Jena, S.; Sarmah, S.P. Price competition and co-operation in a duopoly closed-loop supply chain. Int. J. Prod. Econ. 2014, 156, 346–360. [Google Scholar] [CrossRef]
- Berzi, L.; Delogu, M.; Giorgetti, A.; Pierini, M. On-field investigation and process modelling of end-of-life vehicles treatment in the context of Italian craft-type authorized treatment facilities. Waste Manag. 2013, 33, 892–906. [Google Scholar] [CrossRef] [PubMed]
- Goepp, V.; Zwolinski, P.; Caillaud, E. Design process and data models to support the design of sustainable remanufactured products. Comput. Ind. 2014, 65, 480–490. [Google Scholar] [CrossRef]
- Rebitzer, G.; Köhler, A.; Suh, S.; Klöpffer, W.; Jolliet, O.; Saur, K. Theory and practical implementation of life cycle assessment. In Proceedings of the 13th SETAC-Europe Annual Meeting, Hamburg, Germany, 27 April–1 May 2003; pp. 235–240.
- Tang, O.; Grubbström, R.W. Considering stochastic lead times in a manufacturing/remanufacturing system with deterministic demands and returns. Int. J. Prod. Econ. 2005, 93, 285–300. [Google Scholar] [CrossRef]
- Kleineidam, U.; Lambert, A.J.; Blansjaar, J.; Kok, J.J.; Van Heijningen, R.J. Optimising product recycling chains by control theory. Int. J. Prod. Econ. 2000, 66, 185–195. [Google Scholar] [CrossRef]
- Wee, H.-M.; Lee, M.C.; Jonas, C.P.; Wang, C.E. Optimal replenishment policy for a deteriorating green product: Life cycle costing analysis. Int. J. Prod. Econ. 2011, 133, 603–611. [Google Scholar] [CrossRef]
- Marshall, S.E.; Archibald, T.W. Substitution in a hybrid remanufacturing system. Procedia CIRP 2015, 26, 583–588. [Google Scholar] [CrossRef] [Green Version]
- Zolfagharinia, H.; Hafezi, M.; Farahani, R.Z.; Fahimnia, B. A hybrid two-stock inventory control model for a reverse supply chain. Transp. Res. Part E Logist. Transp. Rev. 2014, 67, 141–161. [Google Scholar] [CrossRef]
- Ahiska, S.S.; Appaji, S.R.; King, R.E.; Warsing, D.P. A markov decision process-based policy characterization approach for a stochastic inventory control problem with unreliable sourcing. Int. J. Prod. Econ. 2013, 144, 485–496. [Google Scholar] [CrossRef]
- Fathi, M.; Zandi, F.; Jouini, O. Modeling the merging capacity for two streams of product returns in remanufacturing systems. J. Manuf. Syst. 2015, 37, 265–276. [Google Scholar] [CrossRef]
- Perez, A.P.; Zipkin, P. Dynamic scheduling rules for a multiproduct make-to-stock queue. Oper. Res. 1997, 45, 919–930. [Google Scholar] [CrossRef]
- Behret, H.; Korugan, A. Performance analysis of a hybrid system under quality impact of returns. Comput. Ind. Eng. 2009, 56, 507–520. [Google Scholar] [CrossRef]
- Karaer, Ö.; Lee, H.L. Managing the reverse channel with RFID-enabled negative demand information. Prod. Oper. Manag. 2007, 16, 625. [Google Scholar] [CrossRef]


| Notations | Description |
|---|---|
| Y | Random variable of acquisition quantity |
| X | Random variable of customers demand |
| Remanufacture rate | |
| h(x, y) | Joint probability density function of acquisition and demand |
| k | Random variable of quality level, k = 1, 2, 3, ... |
| Unit manufacturing cost | |
| Total manufacturing cost | |
| Unit remanufacturing cost | |
| Total remanufacturing cost | |
| Holding cost for unit core | |
| Penalty cost for unit unsatisfied demand | |
| Acquisition cost for unit core | |
| Unit remanufacturing cost for the cores of quality k, k = 1, 2, 3, ... | |
| Acquisition quantity of returned cores | |
| Manufacturing quantity | |
| Optimal quantity of acquisition | |
| Total production profit | |
| Unit salvage value |
| Remanufacturing Cost (Yuan/Engine) | ||
|---|---|---|
| Material costs | components | 1530 |
| end-of-life engine | 1900 | |
| Subsidiary material cost | cleaning agent | 8 |
| wood | 12 | |
| lubricant | 6 | |
| others | 15 | |
| Fuel expense | power fare | 514.07 |
| water fee | 0.379 | |
| gasoline | 2.73 | |
| Others | labor cost | 423 |
| managerial fee | 108.57 | |
| salvage material | −42.25 | |
| Total | 4476.7 | |
| Total Cost (Yuan/Per Engine) | |
|---|---|
| Transportation cost(backward) | 396.92 |
| Remanufacturing cost | 4476.70 |
| Cost of capital and depreciation | 87.09 |
| Selling cost | 314.00 |
| Transportation cost(forward) | 396.92 |
| Total | 5671.63 |
| Total profit of end-of-Life Engine Remanufacturing (×106 Yuan) | ||||||
|---|---|---|---|---|---|---|
| Year | 1 | 2 | 3 | 4 | 5 | 6 |
| Net profit | 2.113 | 3.170 | 4.284 | 5.747 | 5.503 | 5.764 |
| Year | 7 | 8 | 9 | 10 | 11 | 12 |
| Net profit | 5.346 | 6.055 | 5.980 | 6.4551 | 5.390 | 6.219 |
| Year | Net Profit × 106 Yuan | E[X] | E[Y] | ||
|---|---|---|---|---|---|
| 1 | 2.470 | 2375 | 360 | 6550 | 4750 |
| 2 | 4.189 | 3450 | 886 | 6550 | 5750 |
| 3 | 5.435 | 3163 | 1127 | 7550 | 5750 |
| 4 | 6.338 | 3326 | 1457 | 8550 | 6050 |
| 5 | 6.728 | 3493 | 1564 | 9050 | 6350 |
| 6 | 7.082 | 3713 | 1630 | 9550 | 6750 |
| 7 | 7.145 | 3768 | 1636 | 9650 | 6850 |
| 8 | 7.457 | 3826 | 1754 | 10,000 | 6950 |
| 9 | 7.734 | 3850 | 1870 | 10,300 | 7000 |
| 10 | 7.896 | 3905 | 1920 | 10,500 | 7100 |
| 11 | 8.154 | 3960 | 2020 | 10,800 | 7200 |
| 12 | 8.316 | 4015 | 2068 | 11,000 | 7300 |
© 2017 by the authors. Licensee MDPI, Basel, Switzerland. This article is an open access article distributed under the terms and conditions of the Creative Commons Attribution (CC BY) license ( http://creativecommons.org/licenses/by/4.0/).
Share and Cite
Liao, H.; Deng, Q.; Wang, Y. Optimal Acquisition and Production Policy for End-of-Life Engineering Machinery Recovering in a Joint Manufacturing/Remanufacturing System under Uncertainties in Procurement and Demand. Sustainability 2017, 9, 338. https://doi.org/10.3390/su9030338
Liao H, Deng Q, Wang Y. Optimal Acquisition and Production Policy for End-of-Life Engineering Machinery Recovering in a Joint Manufacturing/Remanufacturing System under Uncertainties in Procurement and Demand. Sustainability. 2017; 9(3):338. https://doi.org/10.3390/su9030338
Chicago/Turabian StyleLiao, Haolan, Qianwang Deng, and Yuanrui Wang. 2017. "Optimal Acquisition and Production Policy for End-of-Life Engineering Machinery Recovering in a Joint Manufacturing/Remanufacturing System under Uncertainties in Procurement and Demand" Sustainability 9, no. 3: 338. https://doi.org/10.3390/su9030338
APA StyleLiao, H., Deng, Q., & Wang, Y. (2017). Optimal Acquisition and Production Policy for End-of-Life Engineering Machinery Recovering in a Joint Manufacturing/Remanufacturing System under Uncertainties in Procurement and Demand. Sustainability, 9(3), 338. https://doi.org/10.3390/su9030338