Abstract
The aim of this paper is to optimize the building shape parameters and envelope parameters influencing the rural building energy consumption in cold winter and hot summer climate. Several typical models are established and optimized by integrated TRNSYS and GenOpt. Single-objective optimization has provided guidance to the multi-dimensional optimization. Building shape and envelope parameters are considered simultaneously by multi-dimensional optimization. Results of the optimization showed significant reduction in terms of EC (energy consumption). When O (building orientation) was SW (south by west) 10°, LWR (length-width ratio) was 1.1, WWRS (window-wall ratio in south) with the range of 0.6–0.8, ITE (insulation thickness of exterior wall) and ITR (insulation thickness of roof) was 0.05 m and 0.08 m respectively, the building had minimal energy consumption. The results also indicated that the optimal EWT (exterior window type) was plastic single-frame Low-E insulating glazing filled with inert gas, and the optimal shape of building is Re (rectangle). An effective method was provided to optimize the design of the rural building for the purpose of reducing building energy consumption in cold winter and hot summer climate.
1. Introduction
Currently, China has more than 600 million people, occupying 24 billion m2 of building space in vast rural area [1]. Considering urbanization trends and floor space expansion in China, the rural share of floor space is projected to be 29% in 2030 and 21% in 2050 [2]. Compared to urban buildings, rural buildings have higher energy consumption in China due to irrational design Related research shows that poor building envelope is the main reason for the lower temperature of rural buildings in North China [1]. Rural homes on average are significantly less efficient than urban ones, both because of their design and because of their use of inefficient traditional biomass [2]. According to research, 62% of rural occupants expected a warmer living environment in Hunan province, which is located in hot summer and cold winter zone of central southern China [3]. The research also indicated the cold tolerance of the rural occupants is higher than urban occupants possible due to the poor thermal performance of rural housing [3]. Although it has been a long time that people paid attention to rural building energy efficiency, the development of this work is still slow due to drawbacks of planning and design and heat preservation effect [4].
At present, the work on building energy efficiency mainly focused on the large scale communal building, commercial buildings and urban residential buildings, but little research work on rural residential building. Compared with residential buildings in cities, rural buildings have been long constructed by farmers relying on their experience rather than building construction codes, so the levels of building design and construction are lower than those in cities [5]. As the space heating load represents 41.5% of the total rural energy consumption in China, there is significant potential to reduce household energy consumption through improved building shape and envelope [6].
The author makes some investigations and surveys on 30 typical residential buildings located in three different suburban counties in Hangzhou, which is in the hot summer and cold winter climatic zone. Only few buildings had thermal insulation in the external walls and roof. All of them had single glazing and 80% of villagers have thermal discomfort in summer and winter. The heating and cooling energy consumption using air conditioner in rural area accounts for majority of energy consumption with the value of up to 67% and 80%, respectively. The growing desire of people to be comfortable aggravates the increase of building energy consumption. With the development of urbanization, economic and building a new countryside, rural residential performance must be improved. The main objective of this paper is providing the reference for new rural building energy-saving residential design in hot summer and cold winter zone of China.
The past decade has witnessed a huge development in simulation tools, bringing great advance on building energy efficiency at the same time. The reliability of these simulation tools has been tested and proved by various studies [7,8,9,10,11,12,13,14,15,16]. Huanget et al. focused on the simulation-based optimization of building envelope design, and they find the facts that single-objective optimization is still dominant in this area [17]. Jiying Liu et al. carried out a large amount of investigation in nearly 50 villages located in five different suburban counties in Jinan, China, and the results shows that the U-value of the existing typical building wall and roof are roughly six times and four times larger of the maximum value provided in national regulation, respectively [18]. The study of Seyedehzahra Mirrahimi et al. has shown that a strong relationship exists between various building components such as shading devices, external wall, external roof and external glazing and insulation and the reduction of energy consumption [19]. It is indicated that cool roofs can reduce energy consumption using simulation [20]. Gianpiero Caruso et al. use the hybrid evolutionary algorithm find the optimal building form that minimize the annual cumulative solar irradiation on the building’s envelope and minimize the air-conditioning needs by considering the algebraic contribution of solar irradiation on the building’s envelope with respect to the external temperature [21]. Houcem Eddine Mechriet et al. presents a new approach in which the Analysis Of Variance (ANOVA) is used to identify the design variables that have the most impact on the variation of the building energy performance for a typical office building and to allocate the contribution of each variable to this variation [22]. Actually, there are two main objectives in rural building design, namely building shape parameters and building envelope. In terms of construction and retrofitting, proper building materials and perfect construction methods should be adopted to achieve the goal of material saving and energy saving [5]. However, the focus was often placed only on single aspects, neglecting the relationships between the various building components such as building shape parameters and building envelope and the reduction of energy consumption. In particular, building depth, building wide and length-width ratio were not considered in the majority of the last cases, making it difficult to obtain results in a total energy perspective. In addition, research activities focused mainly on urban architecture while the rural building design is ignored in general.
Clearly, the simulation and optimization tools were valid that is validated by all of these previous reviews. In this study, a typical rural housing in hot summer and cold winter zone was simulated and optimized by integrated TRNSYS and GenOpt. After the combination of TRNSYS and GenOpt, GenOpt can automatically invoke the procedure of TRNSYS, and the two software programs performed hundreds of simulations, thus reducing the workload of simulation.
According to the factors that influence the building energy consumption, the building shape coefficient, building depth, building width, building length-width ratio and window-wall ratio in south were chosen as the variables to get the quantitative relationship between each building shape parameter setting and energy consumption. Moreover, the insulation thickness of exterior wall, the insulation thickness of roof and the thermal performance of external window are chosen as variables to get the quantitative relationship between each building envelope parameter setting and energy consumption. Single-objective optimization has provided guidance to the multi-dimensional optimization. The optimal value of each parameter are obtained by using the particle swarm optimization algorithm (PSO), Hybrid GPS Algorithm with PSO Algorithm and Generalized Pattern Search algorithm in Genopt software to synthetically optimize the parameters including building shape parameters and envelope parameters.
At present, in the field of architectural design, the building energy-saving design and program design is often out of touch. Architects usually design the program relying on experience or related energy efficiency standards, and put the energy consumption analysis at the end. The design process is irreversible, so that energy-saving design cannot play an effective guiding role in the program design. Moreover, most of the researches on residential building energy-saving design are multi-storey buildings and high-rise buildings in cities and towns, while there is little research on energy-saving design of rural buildings. In this paper, the quantitative relationship between the design parameters of building shape and envelope structure and building energy consumption was studied in Hangzhou rural area, which is located in hot summer and cold winter area. It is used to guide the design of rural residential building in hot summer and cold winter area to achieve the target of reducing energy consumption throughout the year.
2. Modeling Approach
2.1. Simulation Model
According to the results of the survey on 30 typical residential buildings in Hangzhou, rectangle is the main building shape, but also square, L, T and U. The houses oriented on North/South axis and East/West axis account for 60% and 40% respectively. Shape factor is a key factor to evaluate building energy efficiency. With the heated volume and the ground floor area remaining constant, the total annual energy demand for heating and cooling increases with the shape factor due to the enlarged size of the external envelope and the glass areas [23]. In addition, the shape factors of rectangle and square are lower than other building shape [23]. For this purpose, a typical representative rural building has been established, which is a three-storey building, as shown in Figure 1. The house has a simple rectangular layout with 3-m high story height and floor dimensions of 13.6 × 7.8 m. This type of housing with 100 m2 floor area is the most broadly built type in the district of Hangzhou. The floor plan for the reference house is shown in Figure 2. The house includes a toilet, a dining room, a kitchen, two bedrooms and a living room.
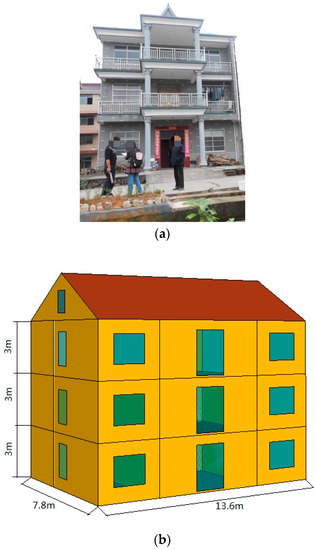
Figure 1.
(a) Actual typical rural building in Hangzhou; (b) Typical rural building model in Hangzhou.
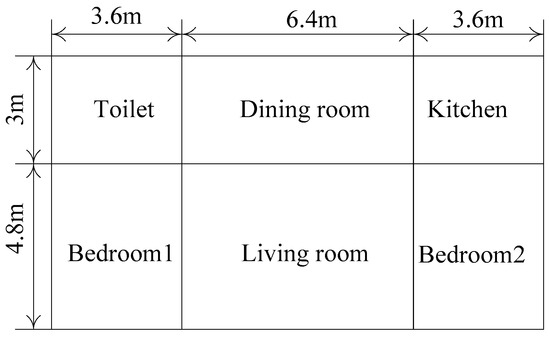
Figure 2.
Typical rural house plan with a living area of 106 m2.
Construction properties for the house are listed in Table 1. The construction materials of housings in this district are very similar, the roof is in pine with tile, the wall is in cement mortar (CM) and clay brick (CB). The floor is made up of CM and reinforced concrete (RC). The windows are single pane glazing with aluminum alloy or wood frame.

Table 1.
Construction properties for the house.
2.2. The Method of TRNSYS Combined with GenOpt
The energy software tool TRNSYS can calculate six complex buildings [24]. GenOpt is an optimization program for the minimization of a cost function that is evaluated by an external simulation program [25]. After the combination of TRNSYS and GenOpt, GenOpt can automatically invoke the procedure of TRNSYS, and the two software programs performed hundreds of simulations, thus reducing the workload of simulation. The main combination process of two software programs is presented in Figure 3. When associated with TRNSYS, GenOpt can automatically generate building (.bui) and deck (.dck) files, run TRNSYS with those files, save results, and restart again [25].
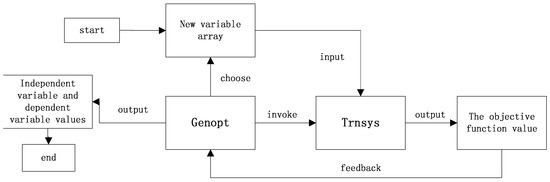
Figure 3.
Simulation and optimization flowchart.
2.3. Initialization Parameter Settings
Feng Qiet et al. found a new calculation method for shape factor of residential building using Google Earth [26]. The 44 rectangular residential buildings in Zhejiang province were calculated, and the results indicated that the shape factor of houses with flat roofs was similar with houses with pitched roofs [27]. Other studies have shown that the impact of the shape factor on energy demand also depends on the envelope heat transfer coefficient [28,29]. The pitched roofs with pine and tile and single pane glazing have high values of U with 2.155 and 5.74, respectively. The energy-saving potential is not evident by optimizing the pitched roofs and single pane glazing. Therefore, appropriate types of roofs and windows should be selected before the optimization. According to the design standard for energy efficiency of rural residential buildings in China [30], the flat-roof made of concrete and double glazing windows with a plastic-steel frame should be adopted. Construction properties for the house are listed in Table 2. The roof is made up of CM, RC and polystyrene board (PB).
Table 2.
Construction properties for the house.
The buildings of this district are mainly single-storey, double-storey and three-story housings. Therefore, the single-story, double-story housing with flat-roof have also been proposed with the ground floor area and the construction properties for the house remaining constant, as shown in Figure 4.
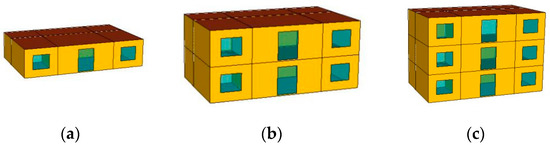
Figure 4.
(a) Single-storey building; (b) Double-storey building; (c) Three-storey building.
According to the design standard for energy efficiency of rural residential buildings in China [30], infiltration ventilation of the room is taken once per hour, and set the refrigeration temperature to 26 °C and the cooling time for the annual 1 June to 31 August. The heating calculated temperature of rural buildings should be set up to 14 °C. For the purpose of improving thermal comfort, the heating temperature was set to be 16 °C and the heating time from the 1 December to 28 February of the following year. The living room and bedroom of each layer were selected to be supplied heating. Table 3 shows that the opening time of cooling and heating equipment daily.
Table 3.
The opening time of cooling and heating equipment daily.
The heating and cooling equipment for household was air-source heat pump air conditioners. On the basis of the design standards of residential building energy efficiency in cold winter and warm summer climate, the cooling and heating rated EER set to 2.3 and 1.9, respectively. The simulation meteorological parameters correspond to typical meteorological year in Hangzhou. Figure 5 presents the simulation interface of TRNSYS.
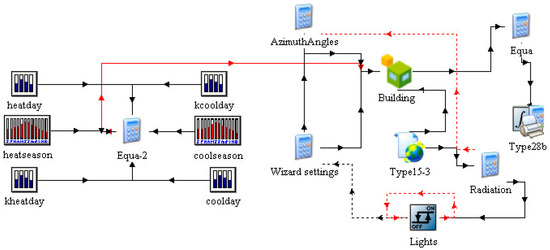
Figure 5.
TRNSYS simulation interface map.
3. Optimizations and Results
3.1. Single-Objective Optimization
3.1.1. Building Shape Parameters
If the building shape parameters are considered during the preliminary building conceptual design stage, it would dedicate to the building energy efficiency. Since the rectangle building has the lowest energy consumption, the shape of the building is set up to rectangle when research the other factors influencing the energy consumption. The building shape parameters include building shape factor, building width, building depth, window-wall ratio in south (WWRS) and length-width ratio (LWR). The relationships between these shape parameters and building energy consumption were analyzed one by one.
The Figure 6 explains the meaning of depth and width. The a2 stands for the depth of building, and the b is defined as width of building. With the relationship of building depth and the energy consumption analysis, as shown in Figure 7, the building energy consumption decreases with the increase of building depth. The energy need of single-storey building diminishes (from 37 kWh/m2 to 25 kWh/m2) as the depth a2 increases (from 3.0 m to 6.6 m). The double-storey and three-storey building have the same law with single-storey building.
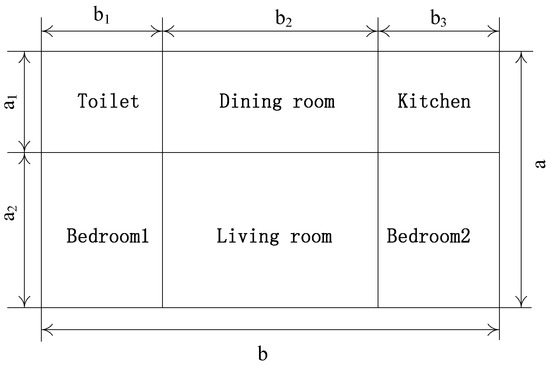
Figure 6.
Typical rural house plan with a variable depth (a2) and width (b).
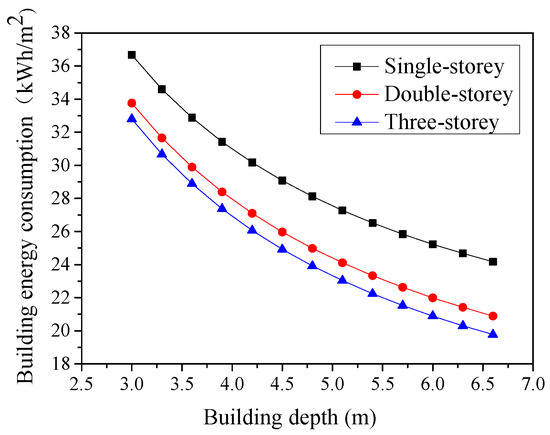
Figure 7.
Relationship of building energy consumption and building depth.
When the architectural plane shape is fixed to rectangle and the building depth is fixed to 7.8 m, the building width (b) is set up to variable in TRNSYS and a range of 8.2 m to 19 m in GenOpt. With the building width and the energy consumption analysis, as shown in Figure 8, the building energy consumption decreases with the increases of building width.
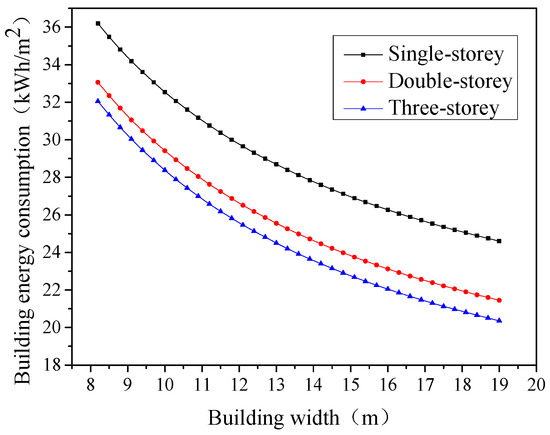
Figure 8.
Relationship of building energy consumption and building width.
The southern orientation of windows increases the quantity of daylight and reduces the energy demand for artificial light. However, the south window increases the energy consumption for cooling and decreases the energy consumption for heating. The window-wall ratio in the south is set as a variable in TRNSYS. It has a range of 0.2 to 0.8 in GenOpt and its calculation step is 0.05. With the building window-wall ratio in the south and the total energy consumption analysis, as shown in Figure 9a, the total building energy consumption increases with the increase of building window-wall ratio in south. With the increasing of building storeys, the energy consumption has decreasing trend. Figure 9b–d shows the relationship of window-wall ratio in the south and the energy consumption of each component. WWR should be as small as possible but must satisfy the request of lighting.
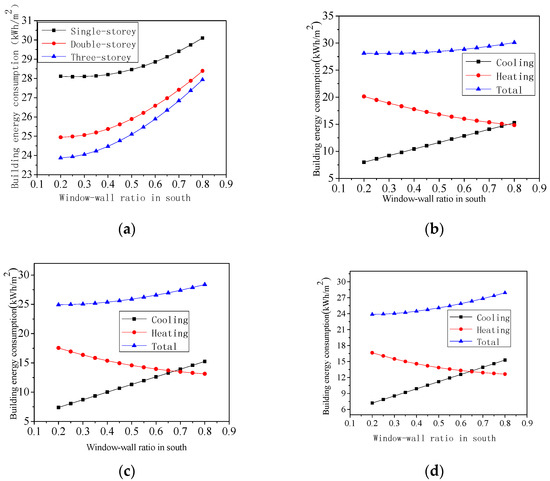
Figure 9.
Relationship of window-wall ratio in south (WWRS) and energy consumption. (a) Total energy consumption; (b) Single-storey building; (c) Double-storey building; (d) Three-storey building.
Many studies have shown that the building energy consumption is the lowest when the orientation is to the south. During the optimization simulation of orientation, other variables are fixed. The relationship of building energy consumption and orientation is shown in Figure 10, and the abscissa represents the degree from south to west (east). With the building facing south or west from east, the energy consumption has increasing trend.
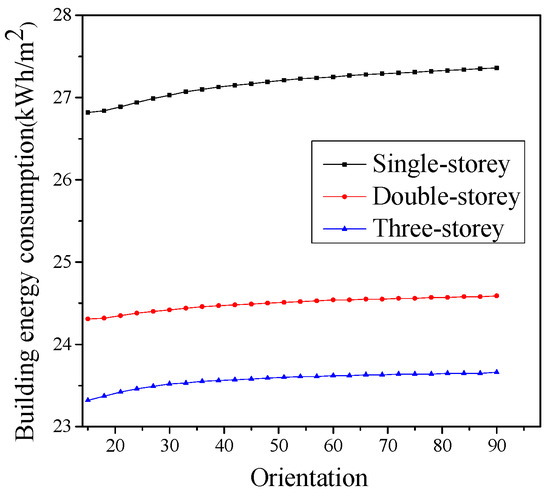
Figure 10.
Relationship of building energy consumption and orientation (O).
Length-width ratio (LWR) means building length divides width. LWR is set as variable in TRNSYS and has a range of 0.3 to 3.0 in GenOpt. With the energy consumption and length-width ratio consistency analysis, as shown in Figure 11, increasing LWR from 0.3 to 1.1 decreases the energy requirement. However, with the increasing continually of LWR, the energy consumption takes on a growth trend. Length-width ratio is set as a value of 1.1 leads to evident reduction in the energy need of house.
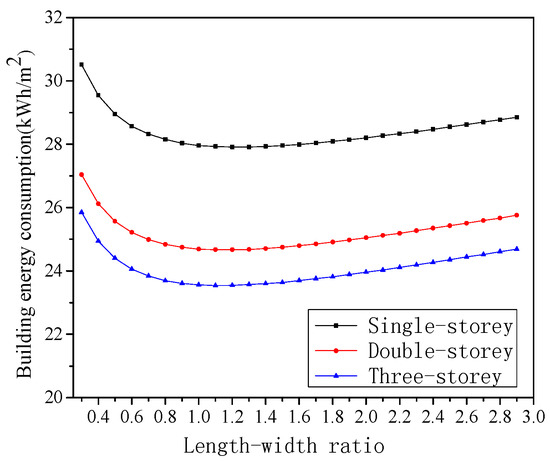
Figure 11.
Relationship of building energy consumption and length-width ratio (LWR).
3.1.2. Envelope Parameters
Polystyrene board (XPS) is the best thermal insulation material in variety of insulation materials commonly. The U-value of the exterior wall is changed by changing the thickness of the polystyrene board. Polystyrene board has a range of 0.01 to 0.05 m and as step of 0.005 m. With building energy consumption and insulation thickness of exterior wall consistency analysis, as shown in Figure 12, building energy consumption decreases with the increase of insulation thickness of exterior wall. The energy decreases (from 31.05 to 26.68 kWh/m2 for single-storey house, from 28.15 to 23.41 kWh/m2 for double-storey and from 27.17 to 22.31 kWh/m2 for three-storey house) with an increasing insulation thickness of exterior wall (from 0.01 m to 0.05 m).
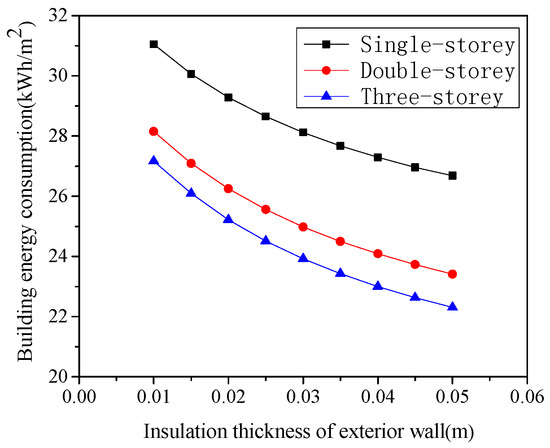
Figure 12.
Relationship of building energy consumption and insulation thickness of exterior wall (ITE).
The thickness of polystyrene board in roof is set as variable to get the relationship of energy consumption and insulation performance of roof. With the building energy consumption and the insulation thickness of exterior wall consistency analysis, as shown in Figure 13, building energy consumption decreases with the increase of insulation thickness of roof.
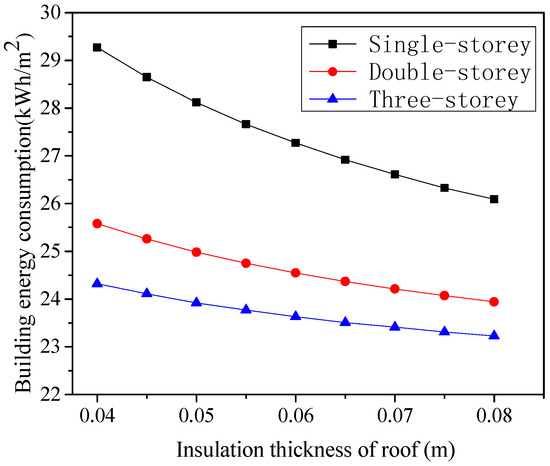
Figure 13.
Relationship of building energy consumption and insulation thickness of roof (ITR).
Table 4 presents the thermal performance of different external window type (EWT). Four types of external window with strikingly different U-value and similar solar heat gain (SHG) were presented; four types of external window with strikingly different SHG and similar U-value were also presented. With the building energy consumption and the insulation thickness of exterior window consistency analysis, as shown in Figure 14, U-value of exterior window has a positive correlation with building energy consumption when the solar heat gain factor is constant; solar heat gain factor has a negative correlation with building energy consumption when the U-value of exterior window is constant. Building energy consumption is considered as optimal result when the U-value of exterior window and solar heat gain factor with the value of 1.69 W/m2·K and 0.705, respectively.
Table 4.
Relationship of energy consumption and thermal performance of external window.
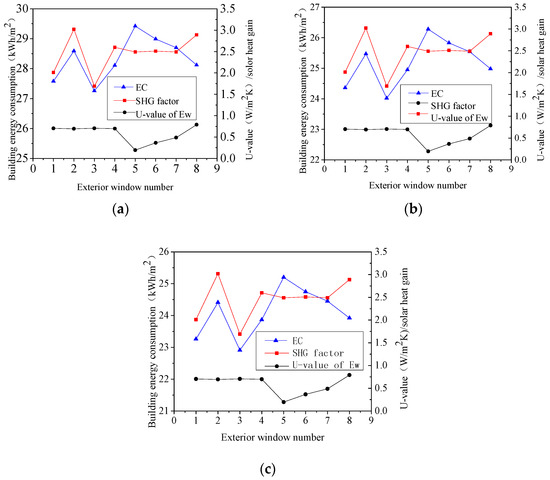
Figure 14.
The relationship of building energy consumption and the insulation thickness of exterior window. (a) Single-storey building; (b) Double-storey building; (c) Three-storey building.
3.2. Multi-Dimensional Optimization
There is a strong relationship between the reduction of energy consumption various and building components such as building shape factor, building depth, building width, window-wall ratio, length-width ratio and the thermal insulating property of exterior wall, roof, and exterior window. Based on TRNSYS and GenOpt, a new multi-dimensional optimization method for shape parameters and building envelope of residential building is presented in this paper. Variable settings of optimization process are presented in Table 5 according to the one-dimensional optimization.
Table 5.
Variable settings of optimization process.
3.2.1. Optimization Results of Particle Swarm Optimization Algorithm
Particle swarm algorithm (Particle Swarm Optimization, PSO) has been successfully applied in many optimization problems due to its easy to understand and convenient to implement [31,32]. PSO algorithm is a heuristic optimization algorithm based on population, through the inter sharing on particle information and experience of individual optimization to modify individual action strategy, finally obtaining the optimal solution of the problem [33]. PSO can solve multi-dimensional optimization problems with discrete variables or continuous variables [34,35]. Particle update equation include version with inertia weight or constriction coefficient and velocity clamping.
Table 6, Table 7 and Table 8 reports the optimization results of inertia weight algorithm, constriction coefficient algorithm and velocity clamping algorithm, respectively. The optimization results have tiny differences in different particle update equation algorithm.
Table 6.
The optimization results of inertia weight algorithm (IW).
Table 7.
The optimization results of constriction coefficient algorithm (CC).
Table 8.
The optimization results of velocity clamping algorithm (VC).
3.2.2. Optimization Results of Hybrid GPS Algorithm with PSO Algorithm
Hybrid GPS algorithm with PSO algorithm combines the GPS algorithm with PSO algorithm [36]. It has the features of global superiority in PSO and visible convergence property in GPS. Table 9 reports the optimization results of hybrid GPS algorithm with PSO algorithm.
Table 9.
The optimization results of hybrid GPS algorithm with PSO algorithm (HGP).
3.2.3. Optimization Results of Generalized Pattern Search Algorithm
Generalized Pattern Search algorithms only can solve multi-dimensional optimization problems with continuous variables [37]. Exterior window type is the only discrete variables in this optimization problem. According to the optimization results of exterior window performance, the exterior window with performance of type 3 is suitable. Generalized Pattern Search algorithm optimizes other continuous variables when the exterior window type is fixed to 3. Table 10 reports the optimization results of generalized pattern search algorithm.
Table 10.
The optimization results of generalized pattern search algorithm (GPS).
3.2.4. Comparative Results of Different Optimization Algorithms
After the comparison of different optimization algorithms in different building layers, Table 11, Table 12 and Table 13 reports the optimization results of different algorithms in different storey. A comparison of the optimization results of different algorithms and different storey house model is shown in Table 11, Table 12 and Table 13. Moreover, building with no optimization (NO) is also compared.
Table 11.
Comparative results of different optimization algorithms in single-storey house.
Table 12.
Comparative results of different optimization algorithms in double-storey house.
Table 13.
Comparative results of different optimization algorithms in three-storey house.
In terms of single story building, the building energy consumption of generalized pattern search algorithm, hybrid GPS algorithm with PSO algorithm and particle swarm optimization algorithm with the value of 21.88 kWh/m2, 22.08 kWh/m2, 22.71 kWh/m2, respectively. It is clear that the building energy consumption of generalized pattern search algorithm is minimal. Besides, generalized pattern search algorithm has a least iterations when it comes to the iterations, which means it has a fastest convergence rate. Comparing the value of each variable parameter in optimization results, the building orientation are all close to south; and the ranges of building length-width ratio, area ratio of window to wall in south and the insulation thickness of roof is 0.9–1.2, 0.65–0.80 and 0.07–0.08, respectively. In addition, insulation thickness of exterior wall is close to 0.05 m and the type of exterior window is number 3. After the popular algorithms were presented and compared, some interesting phenomena were reached. Similar optimization results are obtained through different algorithms.
In terms of the double-storey building and three-storey building, similar disciplines are obtained.
During the process of building energy consumption optimization, not only is the possibility of finding global optimum large using generalized pattern search algorithm, but also the convergence rate is very fast when all of the independent variable are continuous variables. However, when discrete variables and continuous variables exist simultaneously in independent variables, hybrid GPS algorithm with PSO algorithm is more likely to seek out the global optimum than the particle swarm optimization algorithm while the convergence rate is slower than the latter. Whichever algorithm is chosen, optimization is effective. To put it another way, the building energy consumption has a lower value after the optimization.
3.3. Summery
The parameters influencing the building energy consumption are optimized by several optimization algorithms to reduce the building energy consumption. The results can conduct the design of rural residential buildings in cold winter and hot summer climate zone. For a single-storey building, the GPS produces the smallest amount of energy; for a double-storey building, the HGP and GPS produces the smallest amount of energy; for a three-storey building, the GPS produces the smallest amount of energy; the optimization results are shown in Table 14. The result of Table 14 is that the building parameters are calculated by several algorithms when the building energy consumption is the minimum.
Table 14.
Optimization results of each parameter in rural residential buildings.
Comparing optimization buildings and existing buildings, the existing building’s design is different with optimization buildings. The optimization buildings have a similar building orientation with the existing buildings, and both of them closely toward the south. The LWR of optimization buildings decline from 1.74 to 1.10 compared with existing buildings. WWRS (window-wall ratio in south) climb from 0.60 to 0.80. A certain insulation thickness is added to the exterior wall and roof of optimization buildings. The U-value of exterior window drop from 5.44 W/(m2·K) to 1.69 W/(m2·K). Considering the energy consumption, energy saving ratio of the optimization buildings is 50%–58% corresponding with the existing buildings. The energy efficiency effect of optimization building is evident.
4. Discussion
The optimal result obtained by the optimization algorithms shows that the building energy consumption of a single-storey building, double-storey building, three-storey building is 21.88 kWh/m2, 19.91 kWh/m2, 19.25 kWh/m2, respectively. The optimization results in this study reveal that about 4 MJ/m2 is saved every year. The results of another optimization study that using building energy simulation and optimization showed that it is possible to cost effectively reduce the space heating and cooling energy requirement of a new house in Sydney where the annual space energy requirement is less than 5 MJ/m2 [38], but a photovoltaic system is sized to cover the remaining household electricity consumption over the course of a year. Combining optimum single-objective energy efficiency measures, the energy saving in the North-West of Algeriais is about 63.51% reduction of the original annual energy need [39], but it does not use the multi-dimensional optimization software and optimize the variables simultaneous. Energy saving ratio of the optimization buildings in this study is 50%–58% corresponding to the existing buildings.
In contrast with the previous results, it can be seen that the optimization results of this study can help designers deal with multidisciplinary and contrasting objectives in the early design stage. Since the early design stage presents the greatest opportunity to obtain high performance buildings, it is necessary for designers to be able to gather pertinent building performance information. Thermal performance and thermal comfort of the rural housing would be improved by transformation. By means of optimization algorithms, a multi-dimensional search was performed with the aim of minimizing the energy need for heating and cooling of a case study. The analyses were conducted in presence of a rural context in hot summer and cold winter zone.
However, the research of simulation-based lacks measured values. Future works should focus on the study of practical verification. Besides, in this paper, domestic air-conditioner is only used for energy supply equipment, and there is no introduction of energy-saving equipment. Future works should introduce solar collectors, wind tunnel and other systems combining the characteristics of local natural resources, local conditions for the purpose of energy efficiency. For the optimization algorithm parameter settings, the paper is mostly used experience value. Future works should focus on the study of effects of different parameter settings for optimal results.
Several similar research studies were conducted in the past several years. No matter what kind of optimization algorithm was used, optimization is effective. The optimized variables are continuous variables, so it is difficult to design experiments to develop practical verifications. However, optimizing simulation results require experimental verification to prove accuracy. It is necessary to find a reasonable experimental method and develop practical verifications.
5. Conclusions
This paper has focused on the simulation-based optimization of building shape parameter design and building envelope design. Research statuses were collected and discussed. Modeling approaches were explained. Optimization algorithms were presented and compared. Optimization results summarized and analyzed. Future works were proposed and put forward. Conclusions are made as follows:
- (1)
- The trend of building energy consumption is in good agreement with the shape coefficient. The building with the shape of rectangle is considered the most energy-efficient. The building energy consumption of the rectangle shape would increase with increasing the window-wall ratio in south, and it would decrease with increasing the width and depth. As for the constant area conditions, the building energy consumption is seen as minimum when the value of length-width ratio is close to 1.1.
- (2)
- Building energy consumption decreases with the increase of thermal insulating property of exterior wall and roof, but it tends to become stable. The building energy consumption is interrelated with U-value of exterior window, negatively interrelated with solar heat gain coefficient of exterior window.
- (3)
- The results of multi-dimensional optimization shows that optimal value of building orientation, length-width ratio, window-wall ratio in south, insulation thickness of exterior wall and roof is south by west 10°, 1.1, 0.6–0.8, 0.05 m and 0.08 m, respectively. The results also indicate that the optimal type of exterior window is deeded as plastic single-frame Low-E insulating glazing filled with inert gas. In addition, the generalized pattern search algorithm is not only more likely to find the optimal value when the independent variables are continuous variables, but also has a fast convergence rate. When both the continuous variables and discrete variables exist in independent variables, hybrid GPS algorithm with PSO algorithm has a higher possibility to find the optimal value than the particle swarm optimization algorithm, but hybrid GPS algorithm with PSO algorithm has a poor convergence rate. Optimization is useful and effective no matter which algorithm is selected and adopted.
Acknowledgments
This research has been supported by 12th Five Year National Science and Technology Support Key Project of China (Grant No. 2013BAL01B02-4).
Author Contributions
Shilei Lu conceived the research and designed the experiments; Xiaolei Tang analyzed the data, wrote and improved the paper; Liran Ji performed the experiments; Daixin Tu provided the support and analysis of building design standards.
Conflicts of Interest
The authors declare no conflict of interest.
Abbreviations
The following abbreviations are used in this manuscript:
| SW | south by west |
| ITE | insulation thickness of exterior wall |
| ITR | insulation thickness of roof |
| EW | external wall |
| Ew | exterior window |
| EWT | exterior window type |
| CM | Cement mortar |
| CB | clay brick |
| PB | polystyrene board |
| RC | reinforced concrete |
| TT | total thickness (m) |
| SHG | solar heat gain |
| EC | Energy consumption (kWh/m2) |
| NI | the number of iteration |
| IW | inertia weight |
| CC | constriction coefficient |
| VC | velocity clamping |
| HGP | hybrid GPS with PSO |
| GPS | Generalized pattern search |
| NO | no optimization |
| U | heat transfer coefficient (W/m2K) |
| Q | energy consumption of per building area (kWh/m2) |
| LWR | length-width ratio |
| WWRS | window-wall ratio in south |
| O | building orientation |
References
- Shan, M.; Wang, P.; Li, J.; Yue, G.; Yang, X. Energy and environment in Chinese rural buildings: Situations, challenges, and intervention strategies. Build. Environ. 2015, 91, 271–282. [Google Scholar] [CrossRef]
- Evans, M.; Yu, S.; Song, B.; Deng, Q.; Liu, J.; Delgado, A. Building energy efficiency in rural China. Energy Policy 2014, 64, 243–251. [Google Scholar] [CrossRef]
- Han, J.; Yang, W.; Zhou, J.; Zhang, G.; Zhang, Q.; Moschandreas, D.J. A comparative analysis of urban and rural residential thermal comfort under natural ventilation environment. Energy Build. 2009, 41, 139–145. [Google Scholar] [CrossRef]
- He, B.; Yang, L.; Ye, M. Building energy efficiency in China rural areas: Situation, drawbacks, challenges, corresponding measures and policies. Sustain. Cities Soc. 2014, 11, 7–15. [Google Scholar] [CrossRef]
- He, B.; Yang, L.; Ye, M.; Mou, B.; Zhou, Y. Overview of rural building energy efficiency in China. Energy Policy 2014, 69, 385–396. [Google Scholar] [CrossRef]
- Yu, J.; Tian, L.; Xu, X.; Wang, J. Evaluation on energy and thermal performance for office building envelope in different climate zones of China. Energy Build. 2015, 86, 626–639. [Google Scholar] [CrossRef]
- Toja-Silva, F.; Lopez-Garcia, O.; Peralta, C.; Navarro, J.; Cruz, I. An empirical–heuristic optimization of the building-roof geometry for urban wind energy exploitation on high-rise buildings. Appl. Energy 2016, 164, 769–794. [Google Scholar] [CrossRef]
- Negendahl, K.; Nielsen, T.R. Building energy optimization in the early design stages: A simplified method. Energy Build. 2015, 105, 88–99. [Google Scholar] [CrossRef]
- Cacabelos, A.; Eguía, P.; Míguez, J.L.; Granada, E.; Arce, M.E. Calibrated simulation of a public library HVAC system with a ground-source heat pump and a radiant floor using TRNSYS and GenOpt. Energy Build. 2015, 108, 114–126. [Google Scholar] [CrossRef]
- Li, X.; Wen, J.; Bai, E. Developing a whole building cooling energy forecasting model for on-line operation optimization using proactive system identification. Appl. Energy 2016, 164, 69–88. [Google Scholar] [CrossRef]
- Velik, R.; Nicolay, P. Energy management in storage-augmented, grid-connected prosumer buildings and neighborhoods using a modified simulated annealing optimization. Comput. Oper. Res. 2016, 66, 248–257. [Google Scholar] [CrossRef]
- Magnier, L.; Haghighat, F. Multiobjective optimization of building design using TRNSYS simulations, genetic algorithm, and Artificial Neural Network. Build. Environ. 2010, 45, 739–746. [Google Scholar] [CrossRef]
- Ascione, F.; Bianco, N.; De Masi, R.F.; De Stasio, C.; Mauro, G.M.; Vanoli, G.P. Multi-objective optimization of the renewable energy mix for a building. Appl. Therm. Eng. 2015, 101, 612–621. [Google Scholar] [CrossRef]
- Tan, B.; Yavuz, Y.; Otay, E.N.; Çamlıbel, E. Optimal selection of energy efficiency measures for energy sustainability of existing buildings. Comput. Oper. Res. 2016, 66, 258–271. [Google Scholar] [CrossRef]
- Valdiserri, P.; Biserni, C.; Tosi, G.; Garai, M. Retrofit Strategies Applied to a Tertiary Building Assisted by Trnsys Energy Simulation Tool. Energy Procedia 2015, 78, 765–770. [Google Scholar] [CrossRef]
- Ascione, F.; Bianco, N.; De Stasio, C.; Mauro, G.M.; Vanoli, G.P. Simulation-based model predictive control by the multi-objective optimization of building energy performance and thermal comfort. Energy Build. 2016, 111, 131–144. [Google Scholar] [CrossRef]
- Huang, Y.; Niu, J. Optimal building envelope design based on simulated performance: History, current status and new potentials. Energy Build. 2016, 117, 387–398. [Google Scholar] [CrossRef]
- Liu, J.; Liu, B.; He, L.; Gao, Y. Investigation on the Winter Building Energy Consumption in Rural Areas in Jinan, China. Procedia Eng. 2015, 121, 1819–1826. [Google Scholar] [CrossRef]
- Mirrahimi, S.; Mohamed, M.F.; Haw, L.C.; Ibrahim, N.L.N.; Yusoff, W.F.M.; Aflaki, A. The effect of building envelope on the thermal comfort and energy saving for high-rise buildings in hot–humid climate. Renew. Sustain. Energy Rev. 2016, 53, 1508–1519. [Google Scholar] [CrossRef]
- Dabaieh, M.; Wanas, O.; Hegazy, M.A.; Johansson, E. Reducing cooling demands in a hot dry climate: A simulation study for non-insulated passive cool roof thermal performance in residential buildings. Energy Build. 2015, 89, 142–152. [Google Scholar] [CrossRef]
- Caruso, G.; Kämpf, J.H. Building shape optimisation to reduce air-conditioning needs using constrained evolutionary algorithms. Sol. Energy 2015, 118, 186–196. [Google Scholar] [CrossRef]
- Mechri, H.E.; Capozzoli, A.; Corrado, V. USE of the ANOVA approach for sensitive building energy design. Appl. Energy 2010, 87, 3073–3083. [Google Scholar] [CrossRef]
- Premrov, M.; Žegarac Leskovar, V.; Mihalič, K. Influence of the building shape on the energy performance of timber-glass buildings in different climatic conditions. Energy 2016, 108, 201–211. [Google Scholar] [CrossRef]
- Pagliarini, G.; Corradi, C.; Rainieri, S. Hospital CHCP system optimization assisted by TRNSYS building energy simulation tool. Appl. Therm. Eng. 2012, 44, 150–158. [Google Scholar] [CrossRef]
- Asadi, E.; Da Silva, M.G.; Antunes, C.H.; Dias, L. A multi-objective optimization model for building retrofit strategies using TRNSYS simulations, GenOpt and MATLAB. Build. Environ. 2012, 56, 370–378. [Google Scholar] [CrossRef]
- Qi, F.; Wang, Y. A new calculation method for shape coefficient of residential building using Google Earth. Energy Build. 2014, 76, 72–80. [Google Scholar] [CrossRef]
- Casals, X.G. Analysis of building energy regulation and certification in Europe: Their role, limitations and differences. Energy Build. 2006, 38, 381–392. [Google Scholar] [CrossRef]
- Oral, G.K.L.; Yilmaz, Z. Building form for cold climatic zones related to building envelope from heating energy conservation point of view. Energy Build. 2003, 35, 383–388. [Google Scholar] [CrossRef]
- Oral, G.K.L.; Yilmaz, Z. The limit U values for building envelope related to building form in temperate and cold climatic zones. Build. Environ. 2002, 37, 1173–1180. [Google Scholar] [CrossRef]
- Design standard for energy efficiency of rural residential buildings. In GB/T 50824–2013; China Architecture and Building Press: Beijing, China, 2013.
- Fang, W.; Sun, J.; Chen, H.; Wu, X. A decentralized quantum-inspired particle swarm optimization algorithm with cellular structured population. Inf. Sci. 2016, 330, 19–48. [Google Scholar] [CrossRef]
- Fukuyama, Y. Verification of Dependability on Parallel Particle Swarm Optimization Based Voltage and Reactive Power Control. IFAC-PapersOnLine 2015, 48, 167–172. [Google Scholar] [CrossRef]
- Zhao, F.; Si, J.; Wang, J. Research on optimal schedule strategy for active distribution network using particle swarm optimization combined with bacterial foraging algorithm. Int. J. Electr. Power Energy Syst. 2016, 78, 637–646. [Google Scholar] [CrossRef]
- Eberhart, R.; Kennedy, J. A new optimizer using particle swarm theory. In Proceedings of the Sixth International Symposium on Micro Machine and Human Science, Nagoya, Japan, 4–6 October 1995.
- Nickabadi, A.; Ebadzadeh, M.M.; Safabakhsh, R. A novel particle swarm optimization algorithm with adaptive inertia weight. Appl. Soft Comput. 2011, 11, 3658–3670. [Google Scholar] [CrossRef]
- Wetter, M. Generic Optimization Program—User Manual, Version 3.0.0; Lawrence Berkeley National Laboratory: Berkeley, CA, USA, 2009. [Google Scholar]
- Polak, E.; Wetter, M. Generalized Pattern Search Algorithms with Adaptive Precision Function Evaluations; Lawrence Berkeley National Laboratory: Berkeley, CA, USA, 2003. [Google Scholar]
- Bambrook, S.M.; Sproul, A.B.; Jacob, D. Design optimisation for a low energy home in Sydney. Energy Build. 2011, 43, 1702–1711. [Google Scholar] [CrossRef]
- Missoum, M.; Hamidat, A.; Loukarfi, L.; Abdeladim, K. Impact of rural housing energy performance improvement on the energy balance in the North-West of Algeria. Energy Build. 2014, 85, 374–388. [Google Scholar] [CrossRef]
© 2017 by the authors. Licensee MDPI, Basel, Switzerland. This article is an open access article distributed under the terms and conditions of the Creative Commons Attribution (CC BY) license ( http://creativecommons.org/licenses/by/4.0/).