Article

Simple Technique for Tracking Chloride Penetration in Concrete Based on the Crack Shape and Width under Steady-State Conditions

1
Department of Plant Architectural Engineering, Kyonggi University, Suwon 16227, South Korea
2
Innovative Durable Building and Infrastructure Research Center, Hanyang University, Ansan 15588, South Korea
3
School of Architecture Chonnam National University, Gwangju 61186, South Korea
4
Civil and Environmental Engineering, Hannam University, Daejeon 34430, South Korea
*
Author to whom correspondence should be addressed.
Sustainability 2017, 9(2), 282; https://doi.org/10.3390/su9020282
Submission received: 3 November 2016 / Accepted: 7 February 2017 / Published: 15 February 2017

Abstract

:
Chloride attack is considered one of the most threatening deterioration mechanisms in concrete. Any cracks or other imperfections on the surface open up additional routes for chloride intrusion. This paper develops existing anisotropic (1-D) and isotropic (2-D) models for chloride diffusion in concrete with cracks by considering the crack shape and roughness. In order to verify the proposed model, concrete samples with crack widths from 0.0 to 0.4 mm were prepared and the chloride diffusion coefficients under steady-state conditions evaluated. The proposed model for a wedge-shaped model with roughness reduced chloride diffusion and provided more reasonable results than previous models based on rectangular shaped cracks with no roughness, which have tended to overestimate the effect. Our results revealed that including roughness in the model produced a 10%–20% reduction in chloride diffusion.

1. Introduction

As a construction material, concrete is very attractive due to its stable supply system, plasticity in construction, high durability, and low cost. However, it contains pores and these serve as the main routes for the intrusion of water and various ions [1,2,3,4]. In order to increase the material’s resistance to chloride attack for a given cover depth, several techniques have been suggested, including reducing the diffusion coefficient and increasing the absorption of chlorides [5,6,7,8], both of which can be achieved by replacing ordinary Portland cement (OPC) with mineral admixtures, such as fly ash (FA), ground granulated blast furnace slag (GGBFS), rice husk ash (RHA), and silica fume (SF). Numerical models and related tests based on material properties such as water permeability and accelerated diffusion have been conducted by a number of researchers in order to characterize chloride behavior and explore ways to improve the material’s durability [9,10,11].
Cracks in concrete occur very easily due to the material used and the boundary restraint during the hardening process. The high-performance concrete (HPC) typically used in large-scale construction projects requires a large unit content of binder, so cracks often form as a result of hydration heat and drying shrinkage [1,4,12]. Concrete containing cracks provides additional paths for chloride ion intrusion from outside. Consequently, the time to steel corrosion is shortened due to this accelerated corrosion initiation [1,3,4,13].
In order to understand the effect of cracks on chloride diffusion, a great deal of research has been conducted. Previous studies have tended to use very similar parameters when considering crack width, with a rectangular-shaped crack generally being used in both anisotropic and isotropic models to provide quantitative modeling of chloride diffusion in cracked concrete [3,14]. However these models do not take into account crack patterns and surface roughness, which leads to a considerable degree of overestimation when the model predictions are compared with the results of experimental tests. The diffusion mechanism in cracked concrete is usually explained in terms of the representative element volume (REV), where the total ion flow is taken to be the sum of the ion flow across the crack width and in sound concrete [1,2,3,4]. Although chloride diffusion increases rapidly with increasing crack width, it remains almost constant under steady-state conditions. If a steady-state condition is assumed, the diffusion mechanism for an REV containing a weakness (for example, a crack or construction joint) can be applied to both the material’s water permeability [1,4] and its carbonation mechanism [15]. Research on the effect of cracks on chloride behavior are generally performed through field investigations [2,16,17] utilizing specialized techniques such as electron probe microanalysis (EPMA) [13]. Recently, numerical models of chloride diffusion in cracked concrete have been proposed based on early-aged concrete behavior, such as pore structure development, hydration, and chloride binding capacity [18,19,20]. These models can handle non steady-state conditions and complicated chloride ion behavior in porous media, but have only a limited ability to deal with properties such as crack density and isotropic condition.
Assuming REV theory in cracked concrete, crack shape and pattern is very important since the intrusion area available for ion transport can vary considerably depending on the crack shape, even in cracks with the same width. The surface roughness in the cracked section also has a significant effect [21,22]. Several Concrete Specifications discuss the effect of crack width on chloride diffusion for durability evaluation and service life prediction [14,23].
This study presents a simplified model for diffusion in cracked concrete under steady-state conditions for both a 1-D intrusion (anisotropic model) and a 2-D intrusion (isotropic model). The crack pattern and roughness are both taken into account and the results from the proposed model are compared with experimental test results. The results show that chloride penetration is heavily dependent on crack depth, crack density, and width. Crack width is often measured in field investigations since this is considered a major parameter for evaluating a structure’s condition and performance. Although complex parameters that consider both local saturation and crack torture can be utilized, the effect of crack width is clearly the predominant feature. Crack depth and density may be considered in future work. Several simulations with varying crack parameters were also performed for comparison with the model predictions and the results are presented here.

2. Previous Research on Chloride Diffusion in Cracked Concrete

In the previous research on this topic [3], REV theory is adopted when considering both isotropic and anisotropic conditions, as shown in Figure 1. This requires conditions of constant temperature with no physical/chemical interaction between the ions, which represents a steady-state condition. These prior models utilize a crack spacing factor (f), which is defined based on the average crack spacing and average crack width, as shown in Equation (1):
f 1 = L 1 L 4
where L1 and L4 are the average crack spacing and average crack width, respectively.
In the steady-state and anisotropic condition, the flux remains constant so the total flow (Ft) consists of the sum of the flow through the crack (Fc) and that through the sound concrete (Fs):
F t = F c + F s
Assuming a steady-state condition, the equivalent flux ( J t ) for the REV can be calculated using Equation (3) based on the flux and the cross-sectional area. Here, J and A are the flux and area, and the subscripts s and c signify the sound concrete and the crack, respectively.
J t = [ J c A c + J s A s ] / [ A c + A s ]
Equation (3) takes into account both the diffusion coefficient (D0) in sound concrete (reference diffusion coefficient) and the diffusion coefficient in the crack (D1). The equivalent diffusion coefficient ( D ¯ ) in REV can be written as Equation (4) by incorporating the area ratio parameter (S = As/Ac).
D ¯ = [ D 1 A c + D 0 A s ] / [ A c + A s ] = D 0 [ ( D 1 / D 0 + S ) / ( 1 + S ) ]
By applying the area ratio parameter shown in Equation (5), the equivalent diffusion coefficient for the anisotropic condition ( D ¯ ) can finally be obtained, as Equation (6):
S = A s / A c = ( L 1 L 4 ) / L 4 = f 1
D ¯ = D 0 [ ( D 1 / D 0 f ) + 1 ]
Following the same procedure, the equivalent diffusion coefficient for the isotropic condition can be obtained, shown in Equation (8), by applying the area ratio parameter in Equation (7):
S = A s / A c = ( f 1 ) 2 f + 1 f / 2
D ¯ = D 0 [ ( 2 D 1 / D 0 f ) + 1 ]
where As and Ac are L 1 2 ( f 1 f ) 2 and L 1 2 [ 1 ( f 1 f ) 2 ] , respectively, for the isotropic condition.

3. Analytical Model for Diffusion Coefficient Based on the Crack Shape

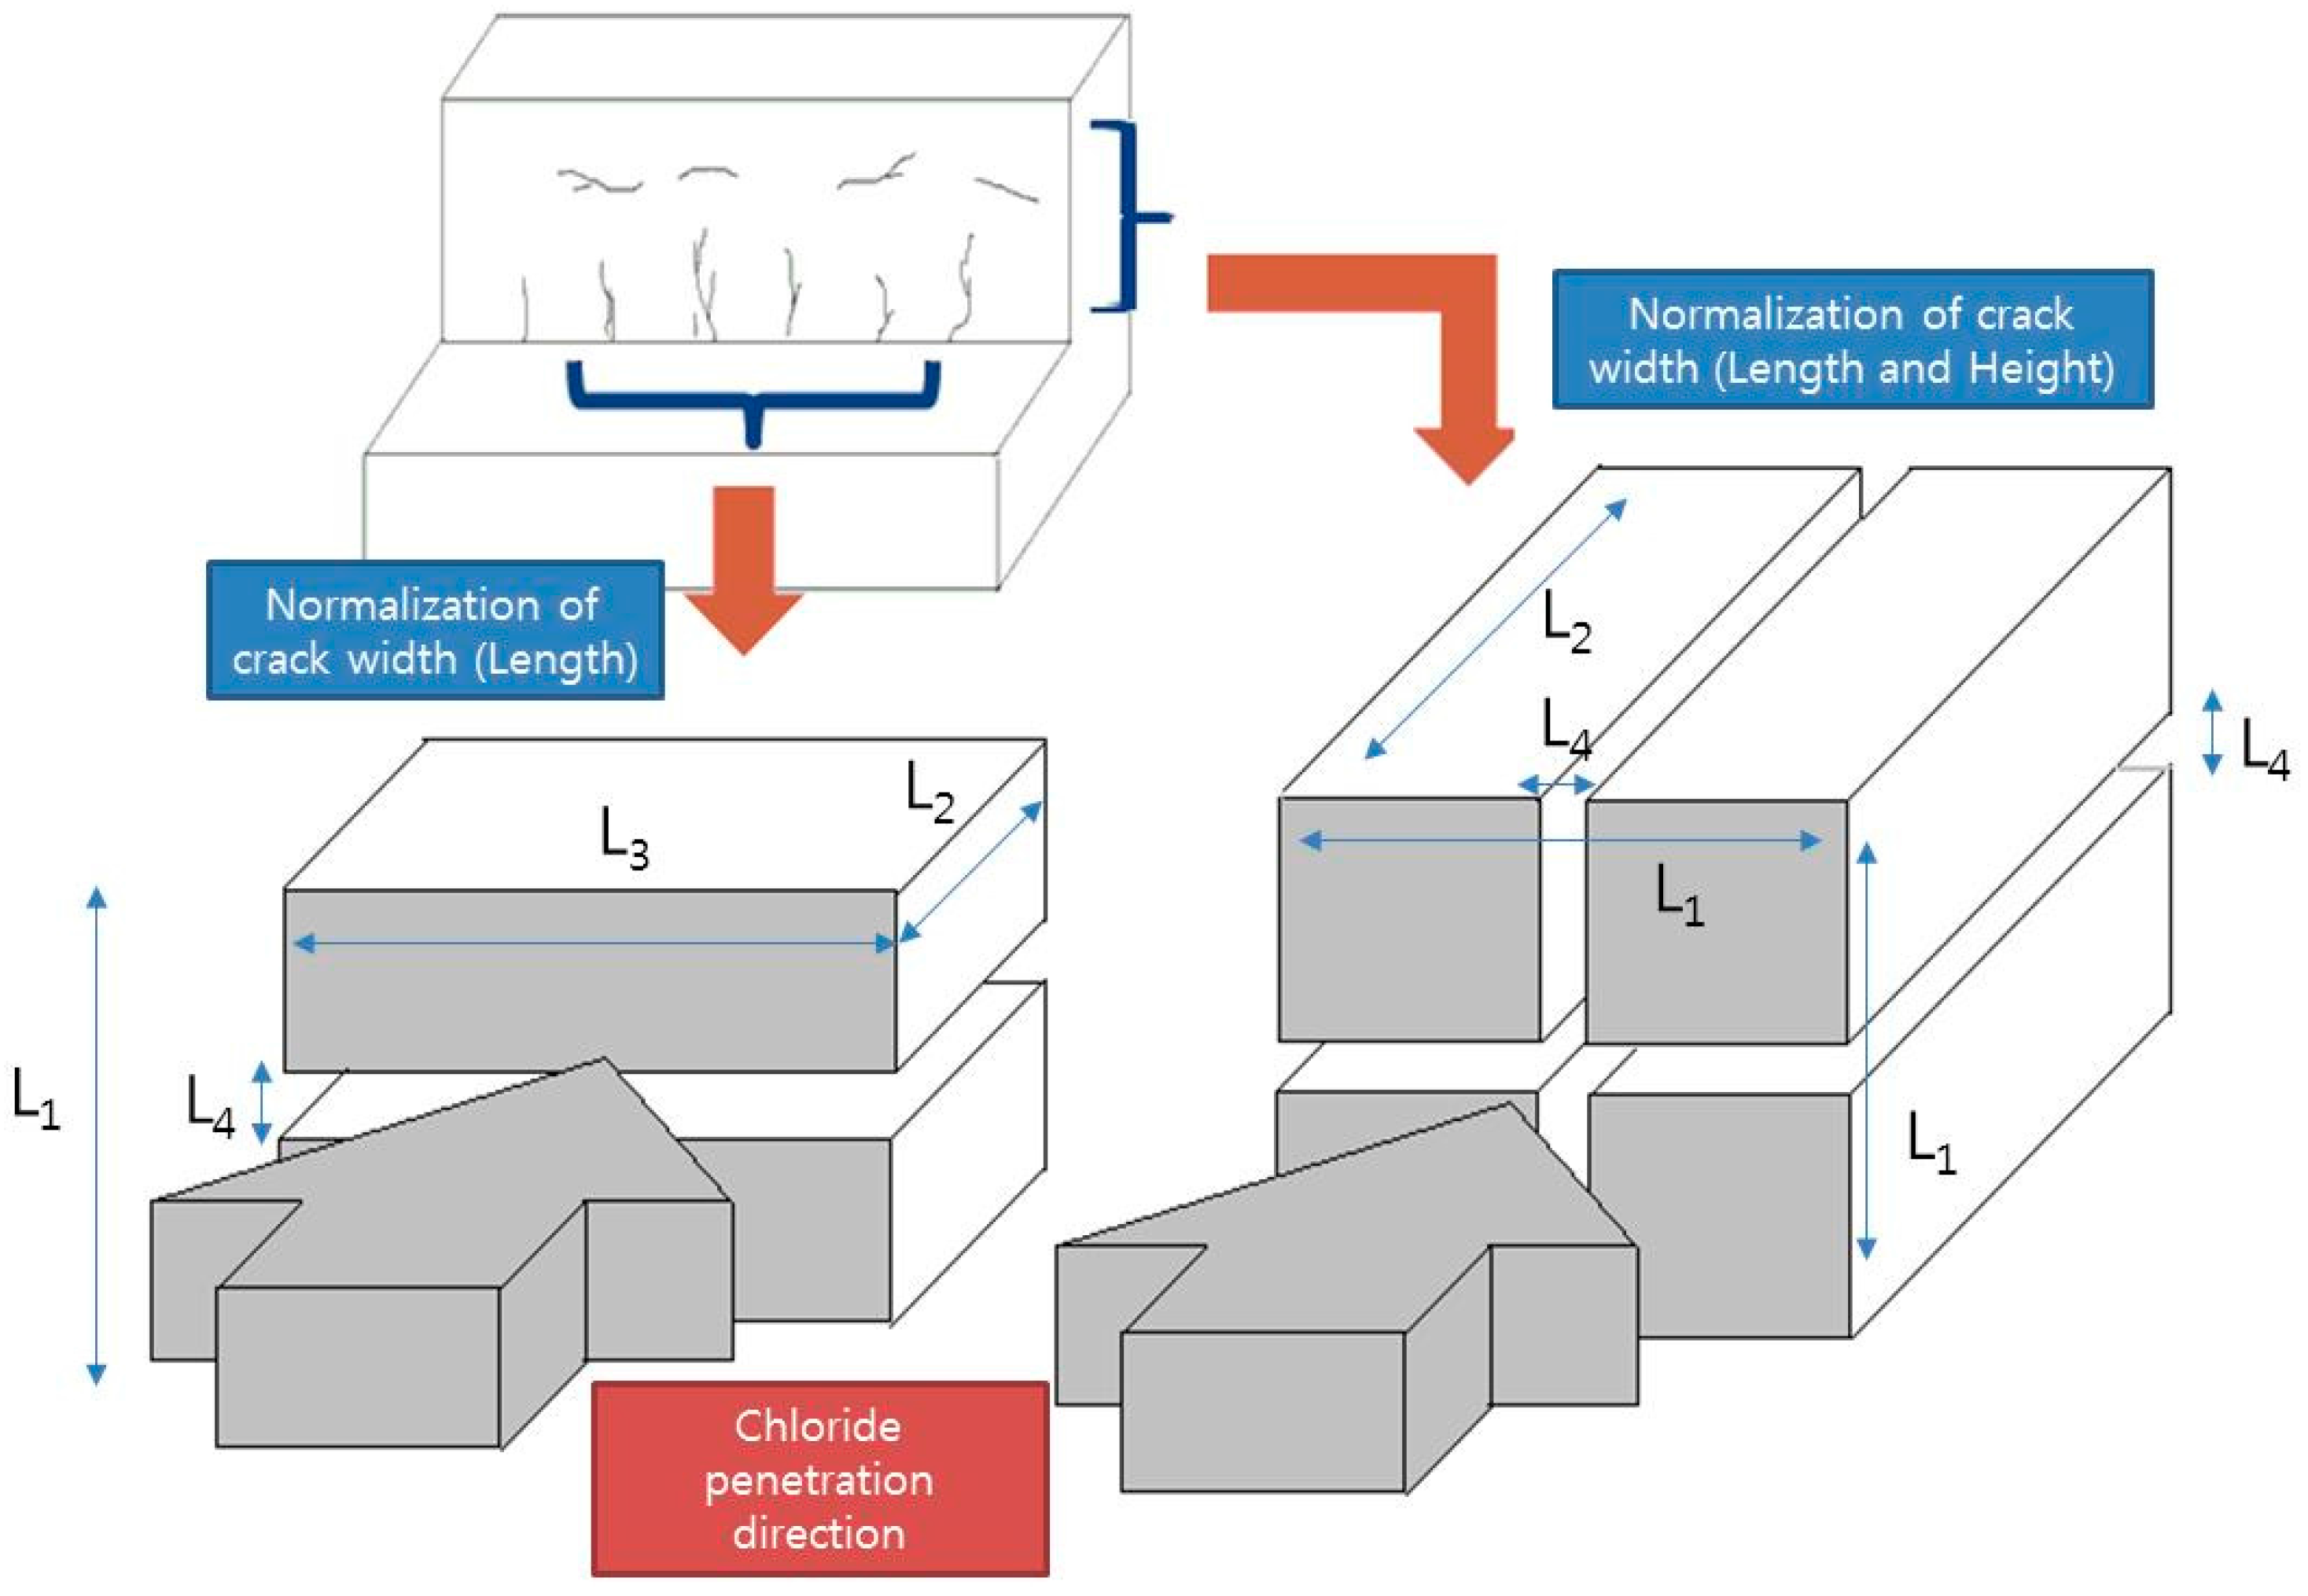
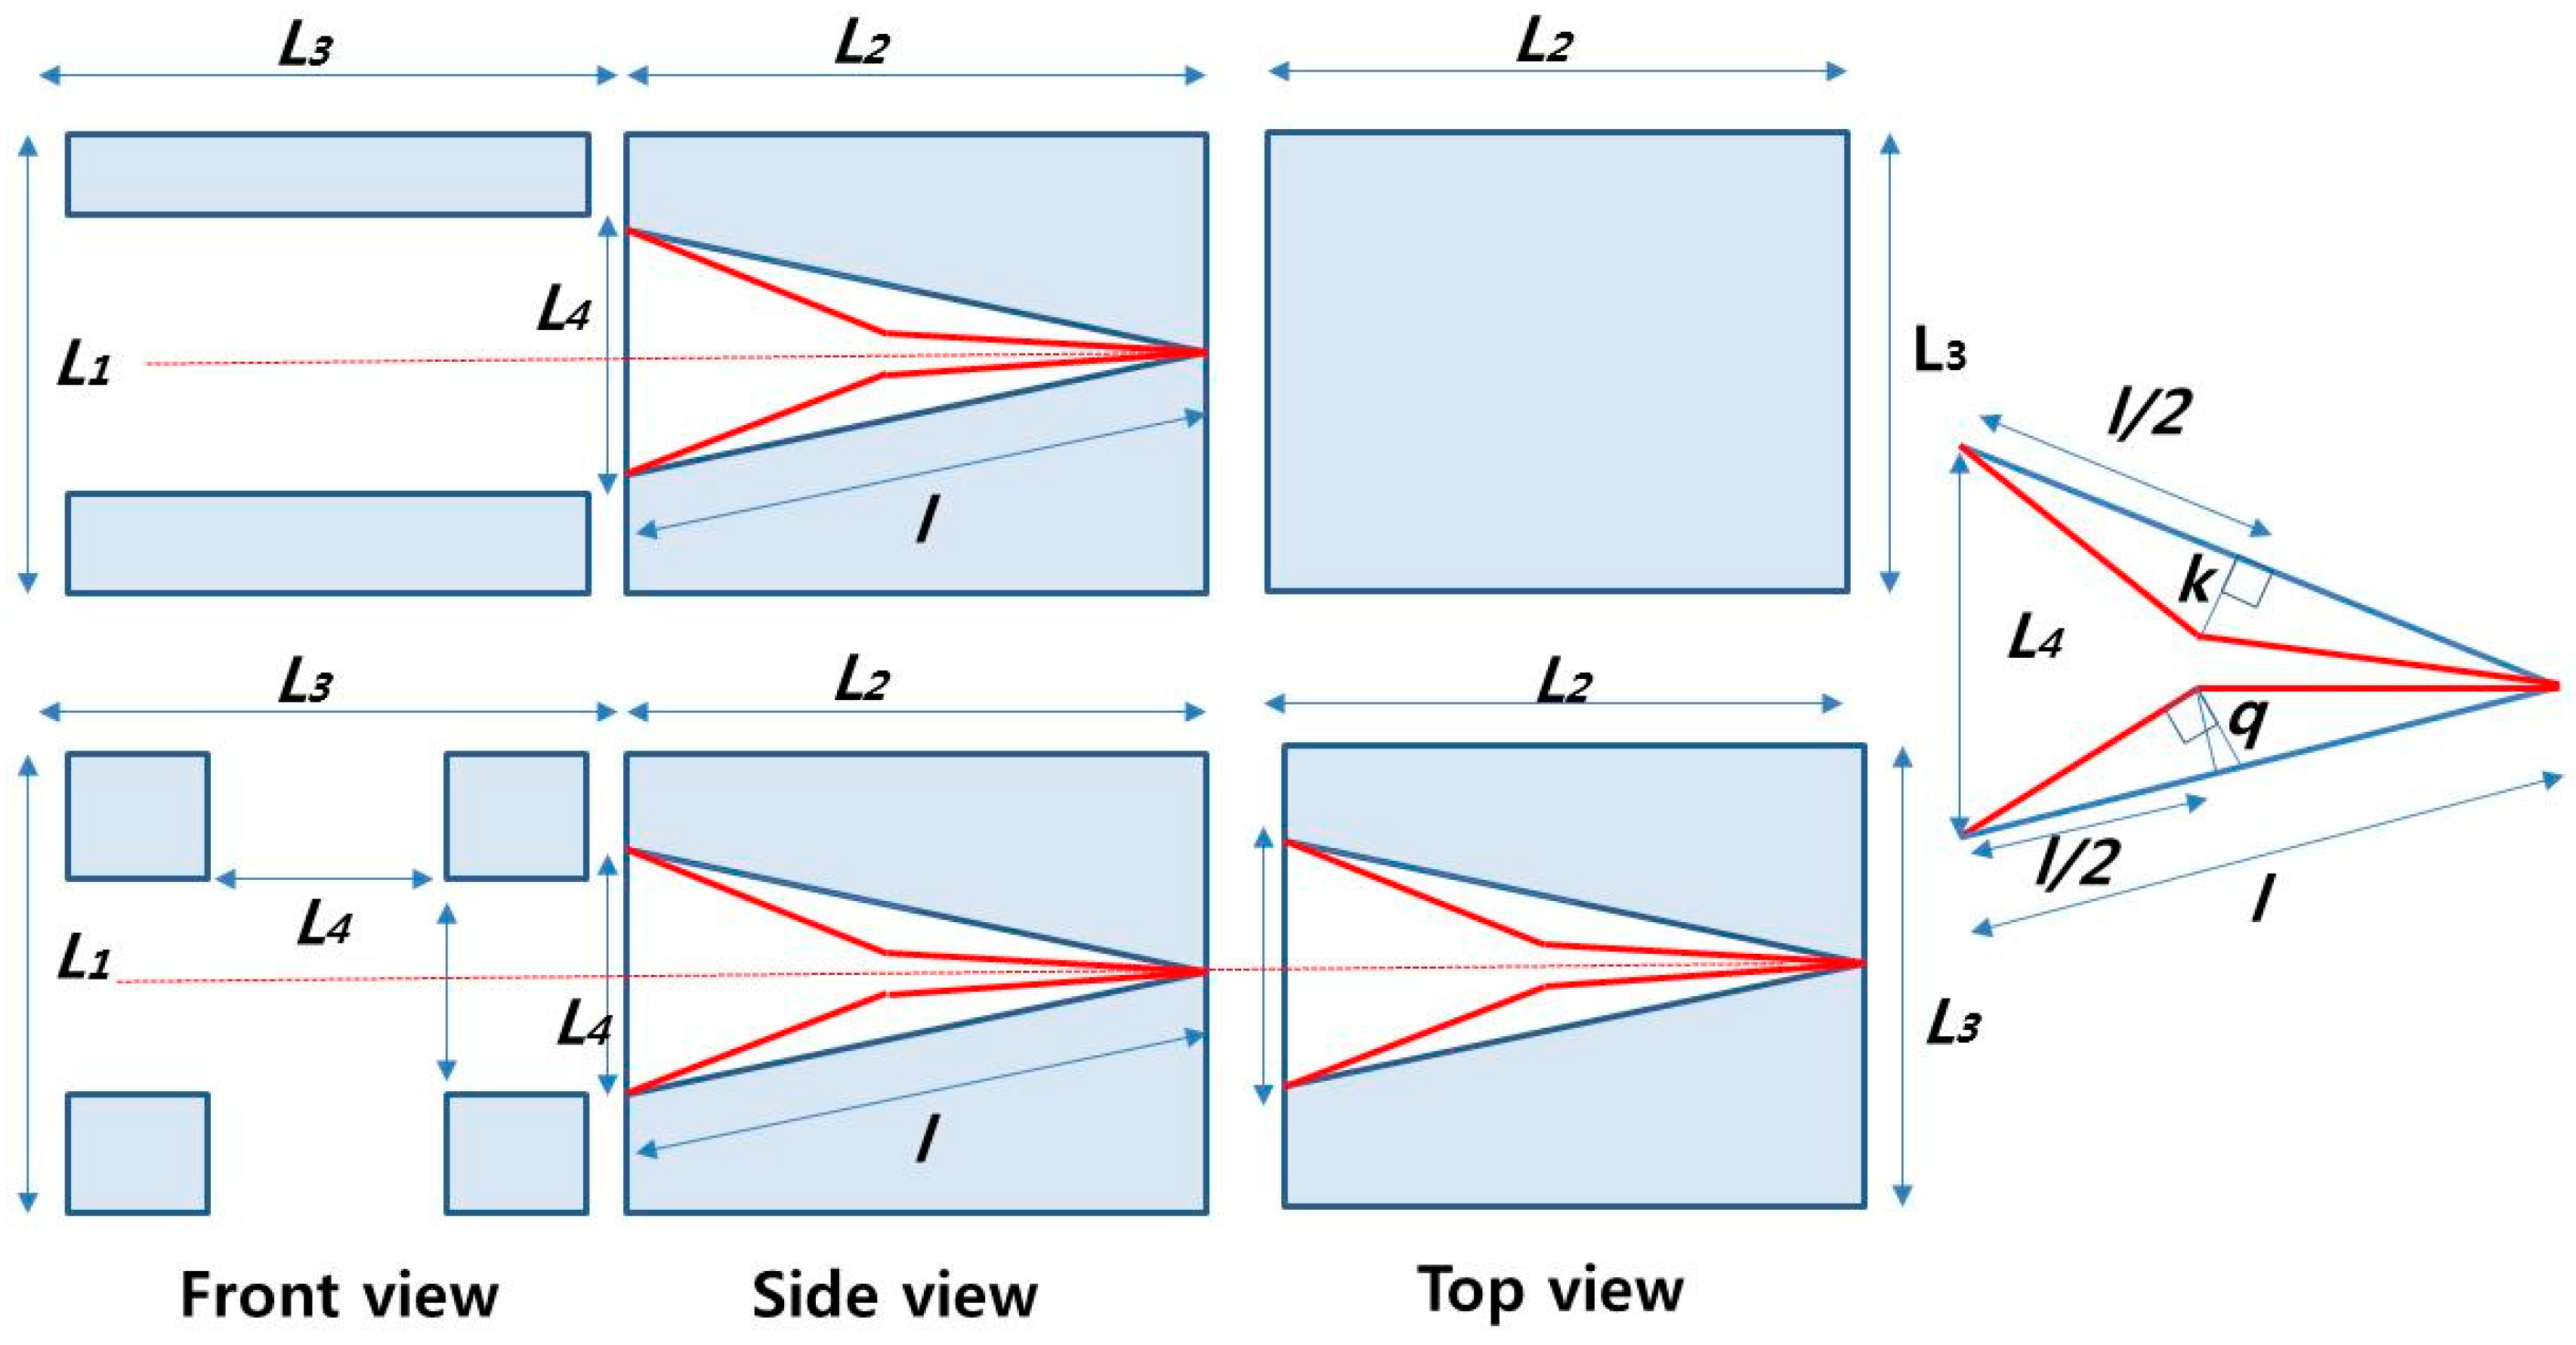
3.1. Shape of Crack Area with Roughness

The previous models assumed a rectangular crack shape, but the cross-sections of cracks that open up on concrete surfaces actually decrease with concrete depth. The surface of a cracked section is also very unlikely to be smooth and this will also impede ion intrusion, the so-called roughness or torturity effect [21,22].
In the model proposed here, the crack shape is assumed to be wedge-shaped and the exposed surfaces are rough, as shown in Figure 2. Actual cracked sections have very complicated surfaces, so a bi-linear shape along the depth direction is assumed to simplify the calculations. In Figure 2, k represents the height of the surface roughness at the midpoint of the crack length (l). q is the length perpendicular not to l/2 but to half of crack length (red line in Figure 2).

3.2. Formulation of Diffusion

3.2.1. Anisotropic Diffusion Model

For an REV with unit depth, Equation (4) can be written as Equation (9) to include both the sound (Vs) and crack volume (Vc). These are expressed as Equations (10) and (11), respectively:
D ¯ = D 0 [ D 1 / D 0 + V 1 + V ] , V = V u V c
V s = ( L 1 L 4 ) L 2 L 3
V c = 1 2 ( L 2 L 3 L 4 ) l k L 3
In the triangular crack area shown in Figure 2, L4 (the width at the mouth of the crack) is much smaller than L2 (the crack length), so l can be reduced to:
l = ( L 4 / 2 ) 2 + L 2 2 L 2
Given that f >> 1, the volume ratio of V takes the form of Equation (13), yielding the equivalent diffusion coefficient in anisotropic condition shown in Equation (14):
V = 2 ( L 1 L 4 ) L 2 L 3 ( L 2 L 3 L 4 ) l k L 3 = 2 ( L 1 L 4 ) L 4 2 p L 4 = 2 ( f 1 ) 1 p 2 f 1 2 p
D ¯ = D 0 [ D 1 ( 1 2 p ) 2 f D 0 + 1 ]
where the parameter p is the ratio of k to the crack width, i.e., k/L4.

3.2.2. Isotropic Diffusion Model

As shown in Figure 2, the crack is assumed to have a wedge shape and a rough surface. In the isotropic condition, V s and V c can be calculated using Equations (15) and (16), respectively.
V s = L 1 2 L 2 ( f 1 ) 2 / f 2
V c = 2 A L 1 V m = L 1 L 2 L 4 ( 1 2 p ) V m
In Equation (16), A is the cross-sectional area of the mouth of the wedge shape and Vm denotes the overlapped volume of the triangular pyramid shape, calculated as Equation (17). L4 is so small compared with L2 that Equation (18) leads to the reasonable approximation that q is equal to k:
V m = L 4 2 L 2 6 + 1 3 ( L 4 2 2 q ) 2 ( L 2 2 )
q = 2 p L 4 ( 4 p 2 + 1 / 16 ) L 4 2 + L 2 2 / 4 ( L 2 2 + L 4 2 / 4 ) p L 4 = k
The volume ratio (V) can be formulated as Equation (19) based on Equations (15)–(17) when f has a very high value (f >> 1):
V = V s V c = L 1 2 ( f 1 ) 2 f 2 { L 1 L 4 ( 1 2 p ) L 4 2 / 6 [ 1 + ( 1 / 2 2 p ) 2 ] }
= ( f 1 ) 2 ( 1 2 p ) f 1 / 6 [ 1 + ( 1 / 2 2 p ) 2 ] f 2 ( 1 2 p ) f / ( 1 2 p )
The value for V obtained from Equation (19) then allows us to obtain the equivalent diffusion coefficient for isotropic REV shown in Equation (20):
D ¯ = D 0 [ D 1 ( 1 2 p ) f D 0 + 1 ]
Compared with the previous models [3], the model proposed here reduces the area of the crack by 50% by incorporating the maximum roughness parameter (p).

4. Verification of the Model

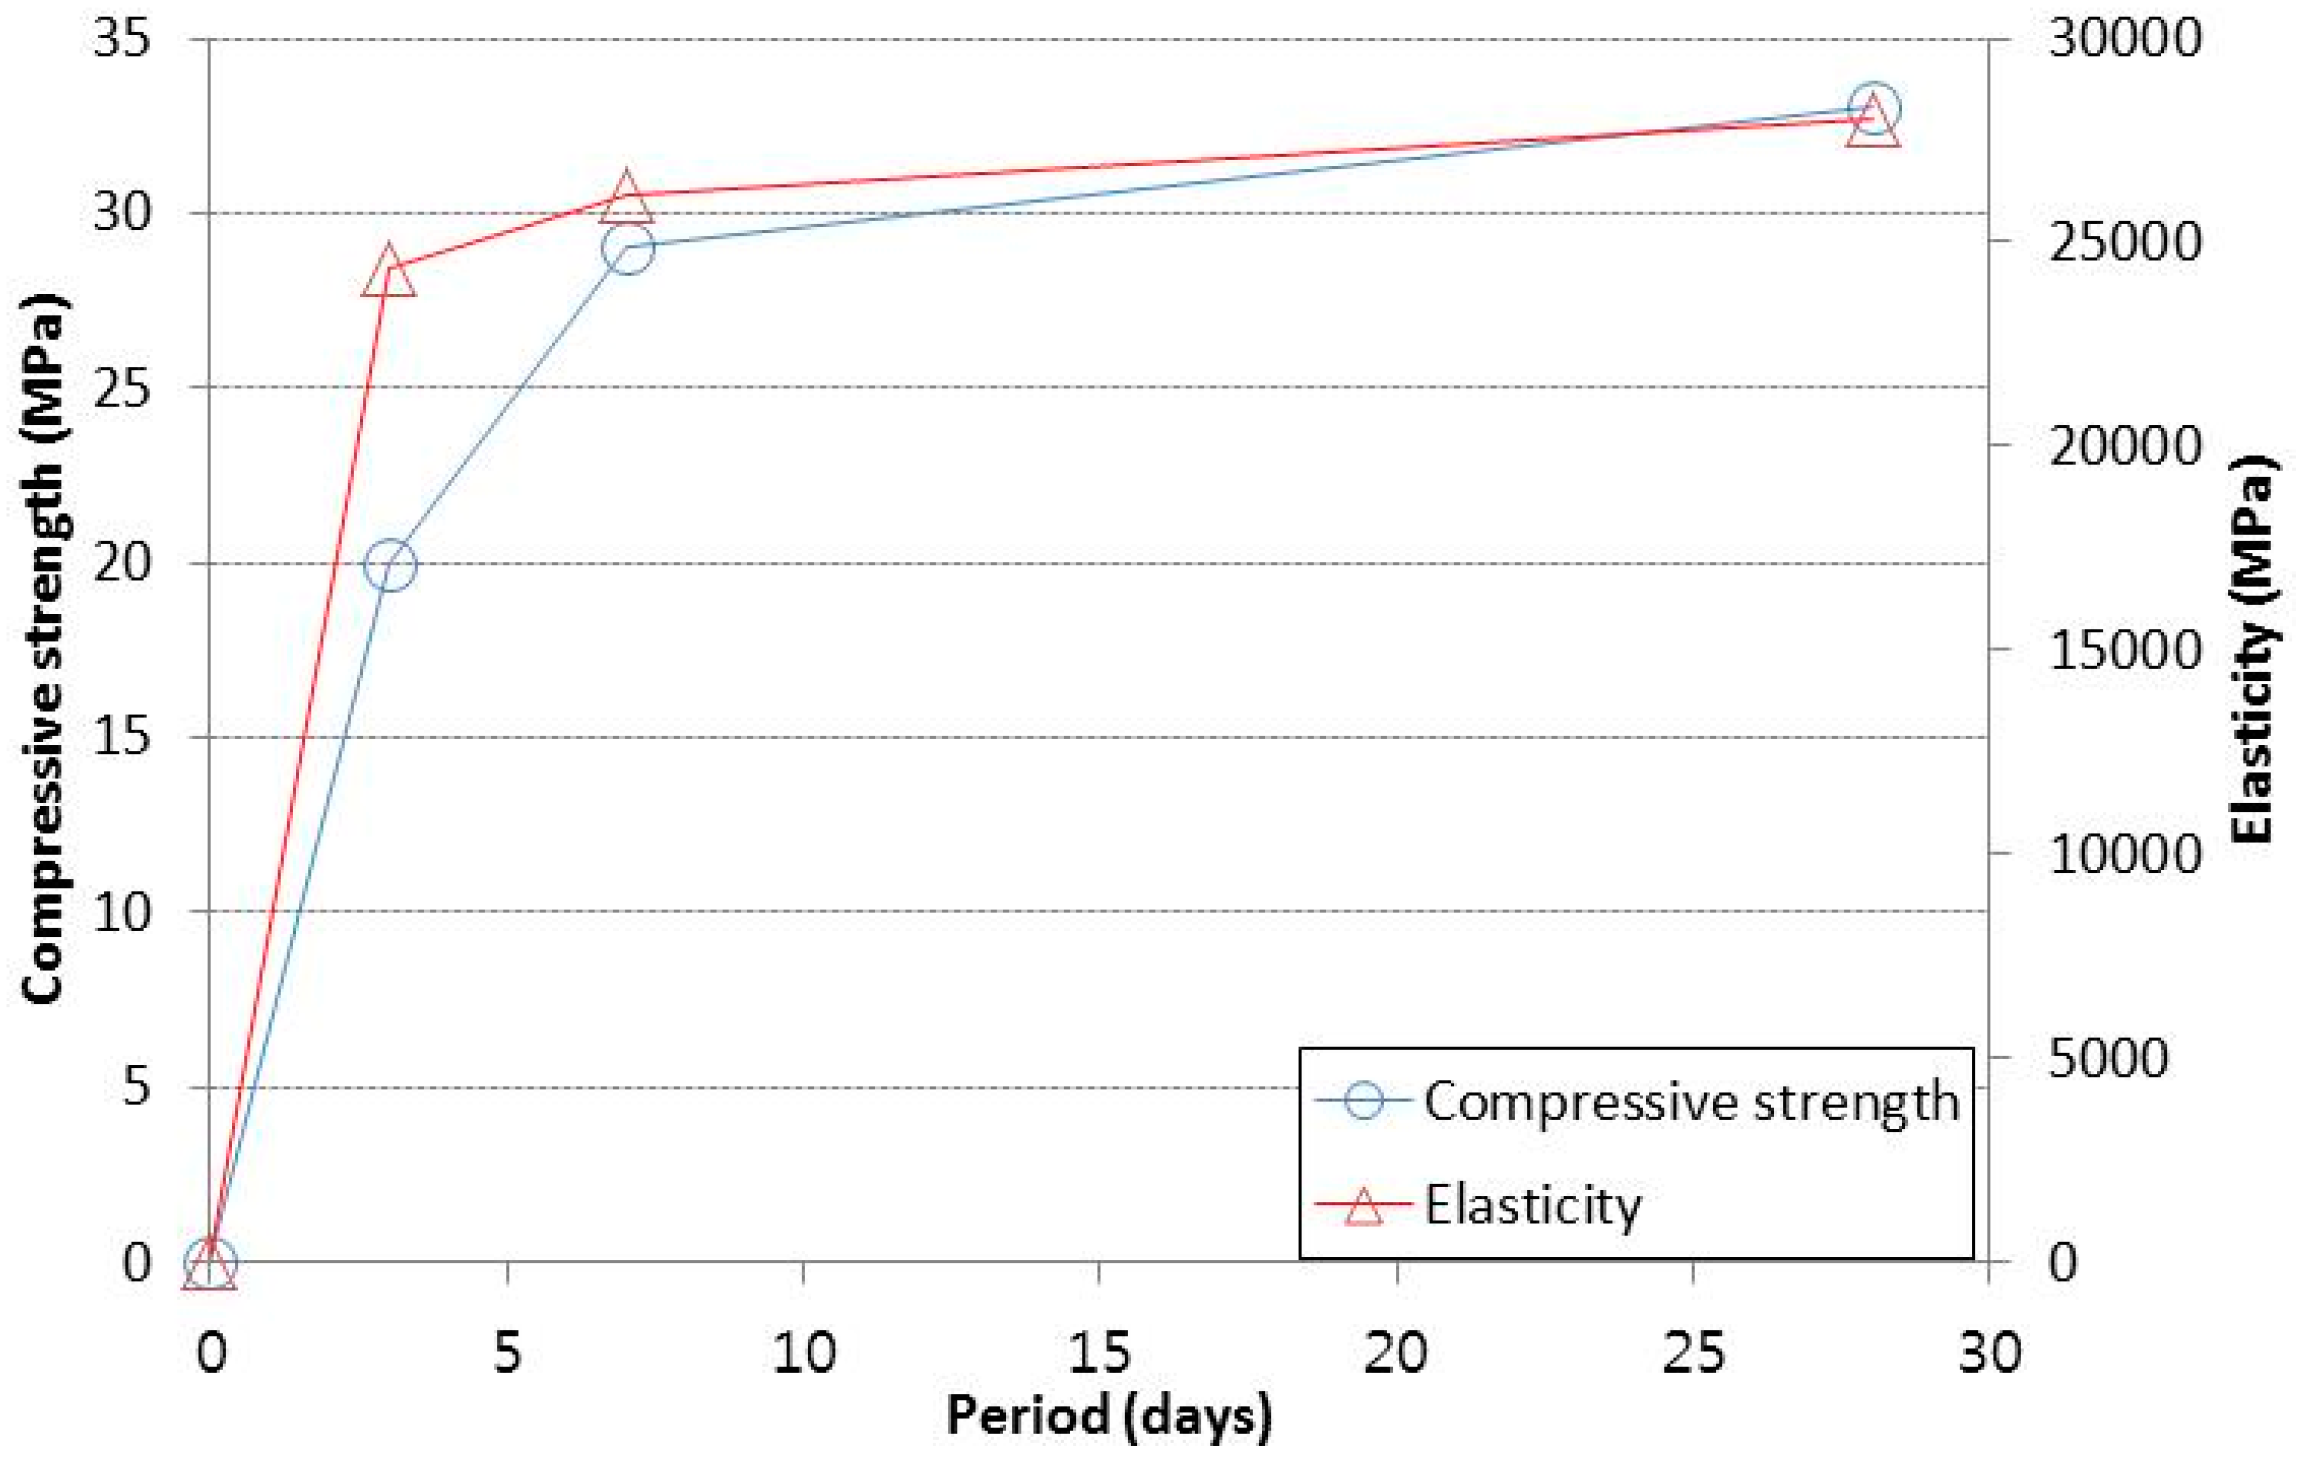
4.1. Experimental Program

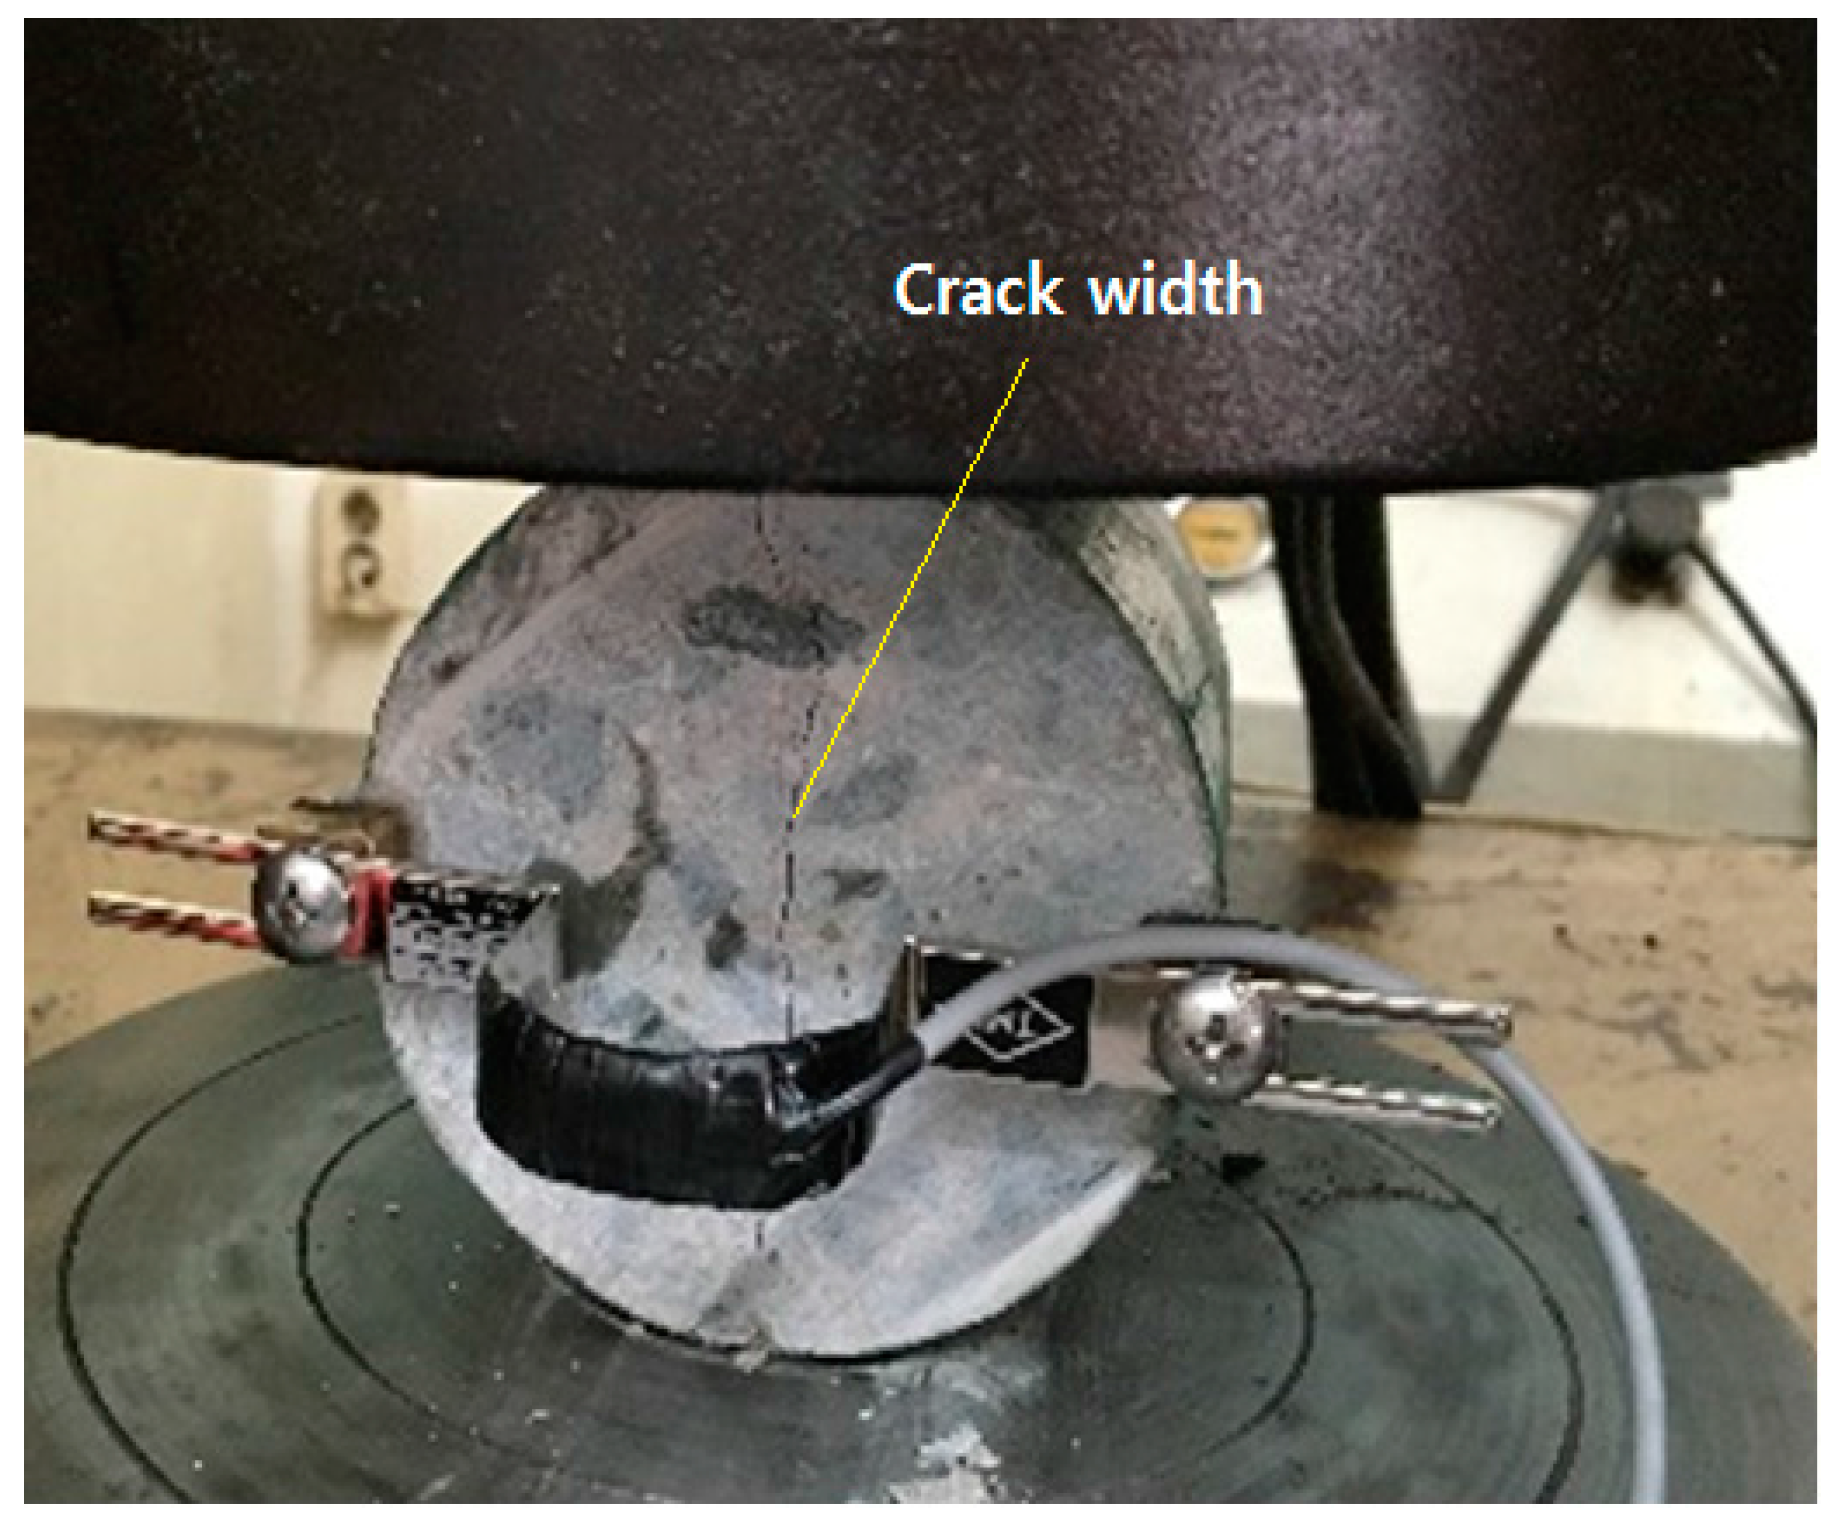
4.1.1. Concrete Preparation with Crack

To create the concrete samples with cracks, twenty cylindrical concrete samples with a length of 200 mm and a cross-sectional diameter of 100 mm were prepared. After 28 days curing submerged in tap water at a temperature of 20 °C, the samples were cut into 20 disk samples, each 100 mm in diameter and 50 mm thick. In order to induce cracks of the desired widths, a linear variable differential transformer (LVDT) was applied to the concrete surface perpendicular to the loading direction. The crack width increased during the loading process and then decreased slightly as the loading was removed. Once this process was completed, the crack widths were measured prior to the chloride diffusion test. Due to the difficulty of obtaining specific crack widths, the resulting samples were grouped into 0.1 mm intervals depending on their individual crack widths. The concrete mix proportions are listed in Table 1, with a design slump of 100 mm. The properties of the OPC, and the fine and coarse aggregates used are listed in Table 2 and Table 3, respectively.
The strength and elasticity of the concrete samples are shown in Figure 3, measured using conventional mechanical methods.

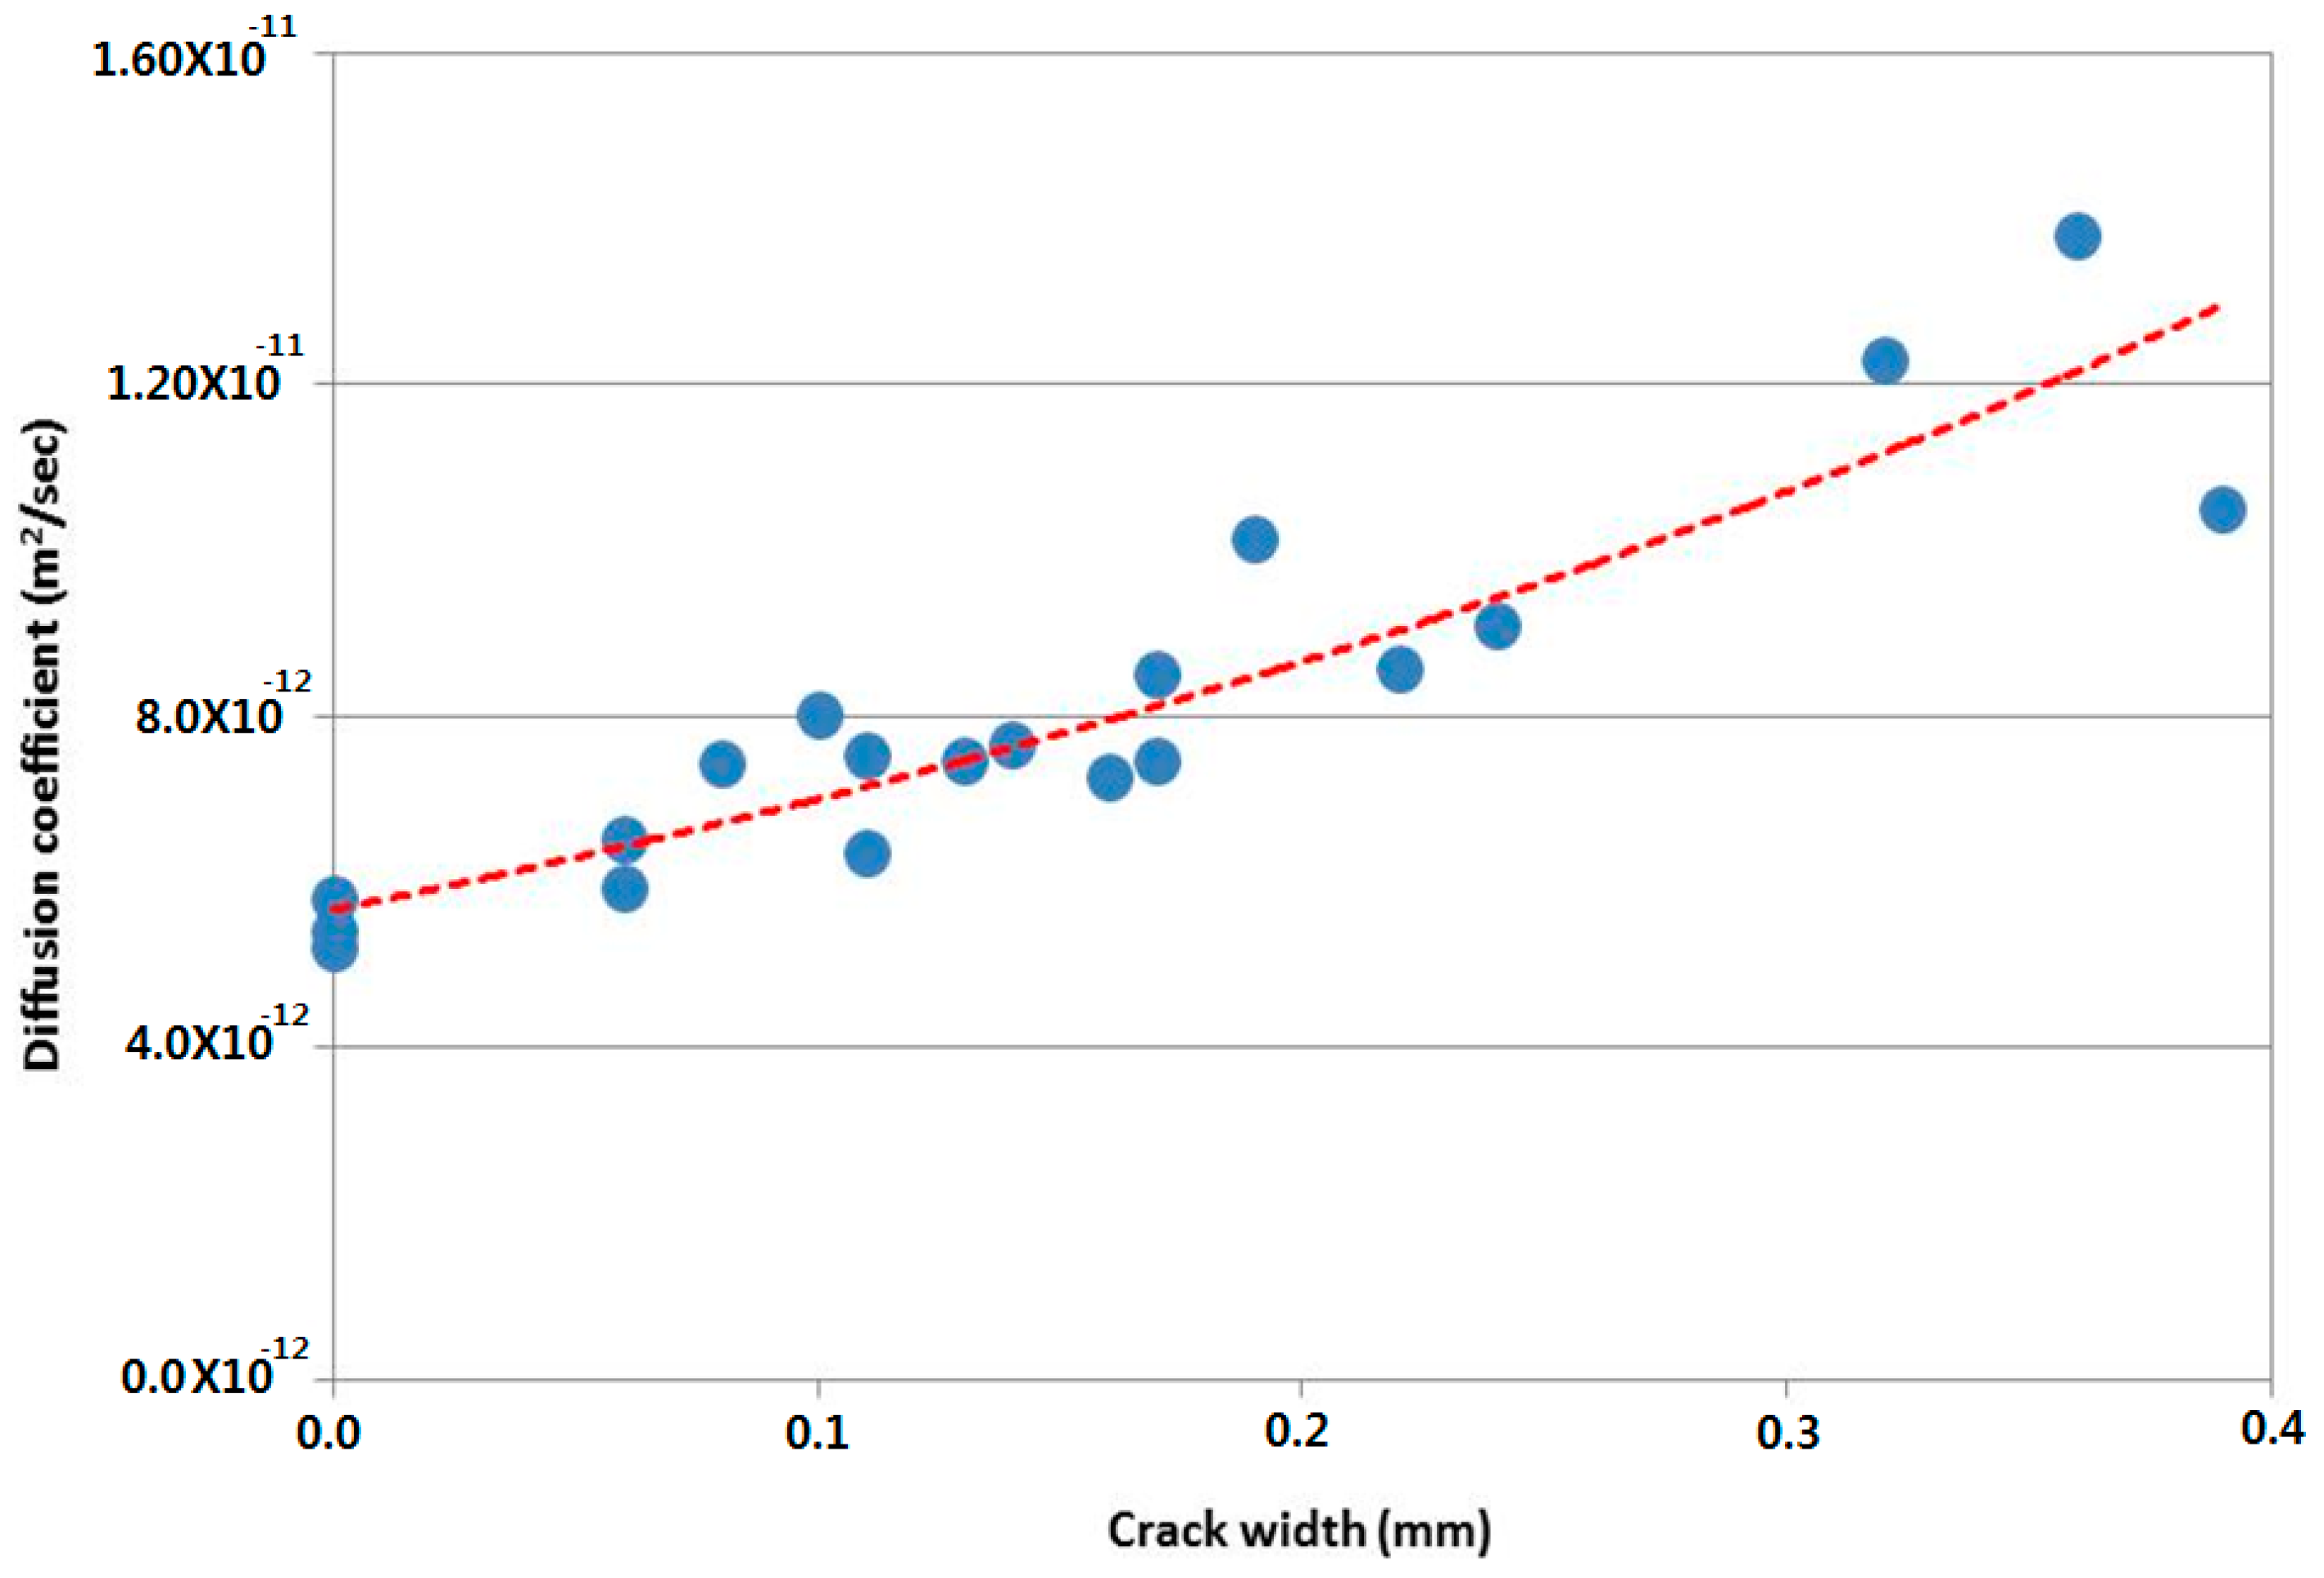
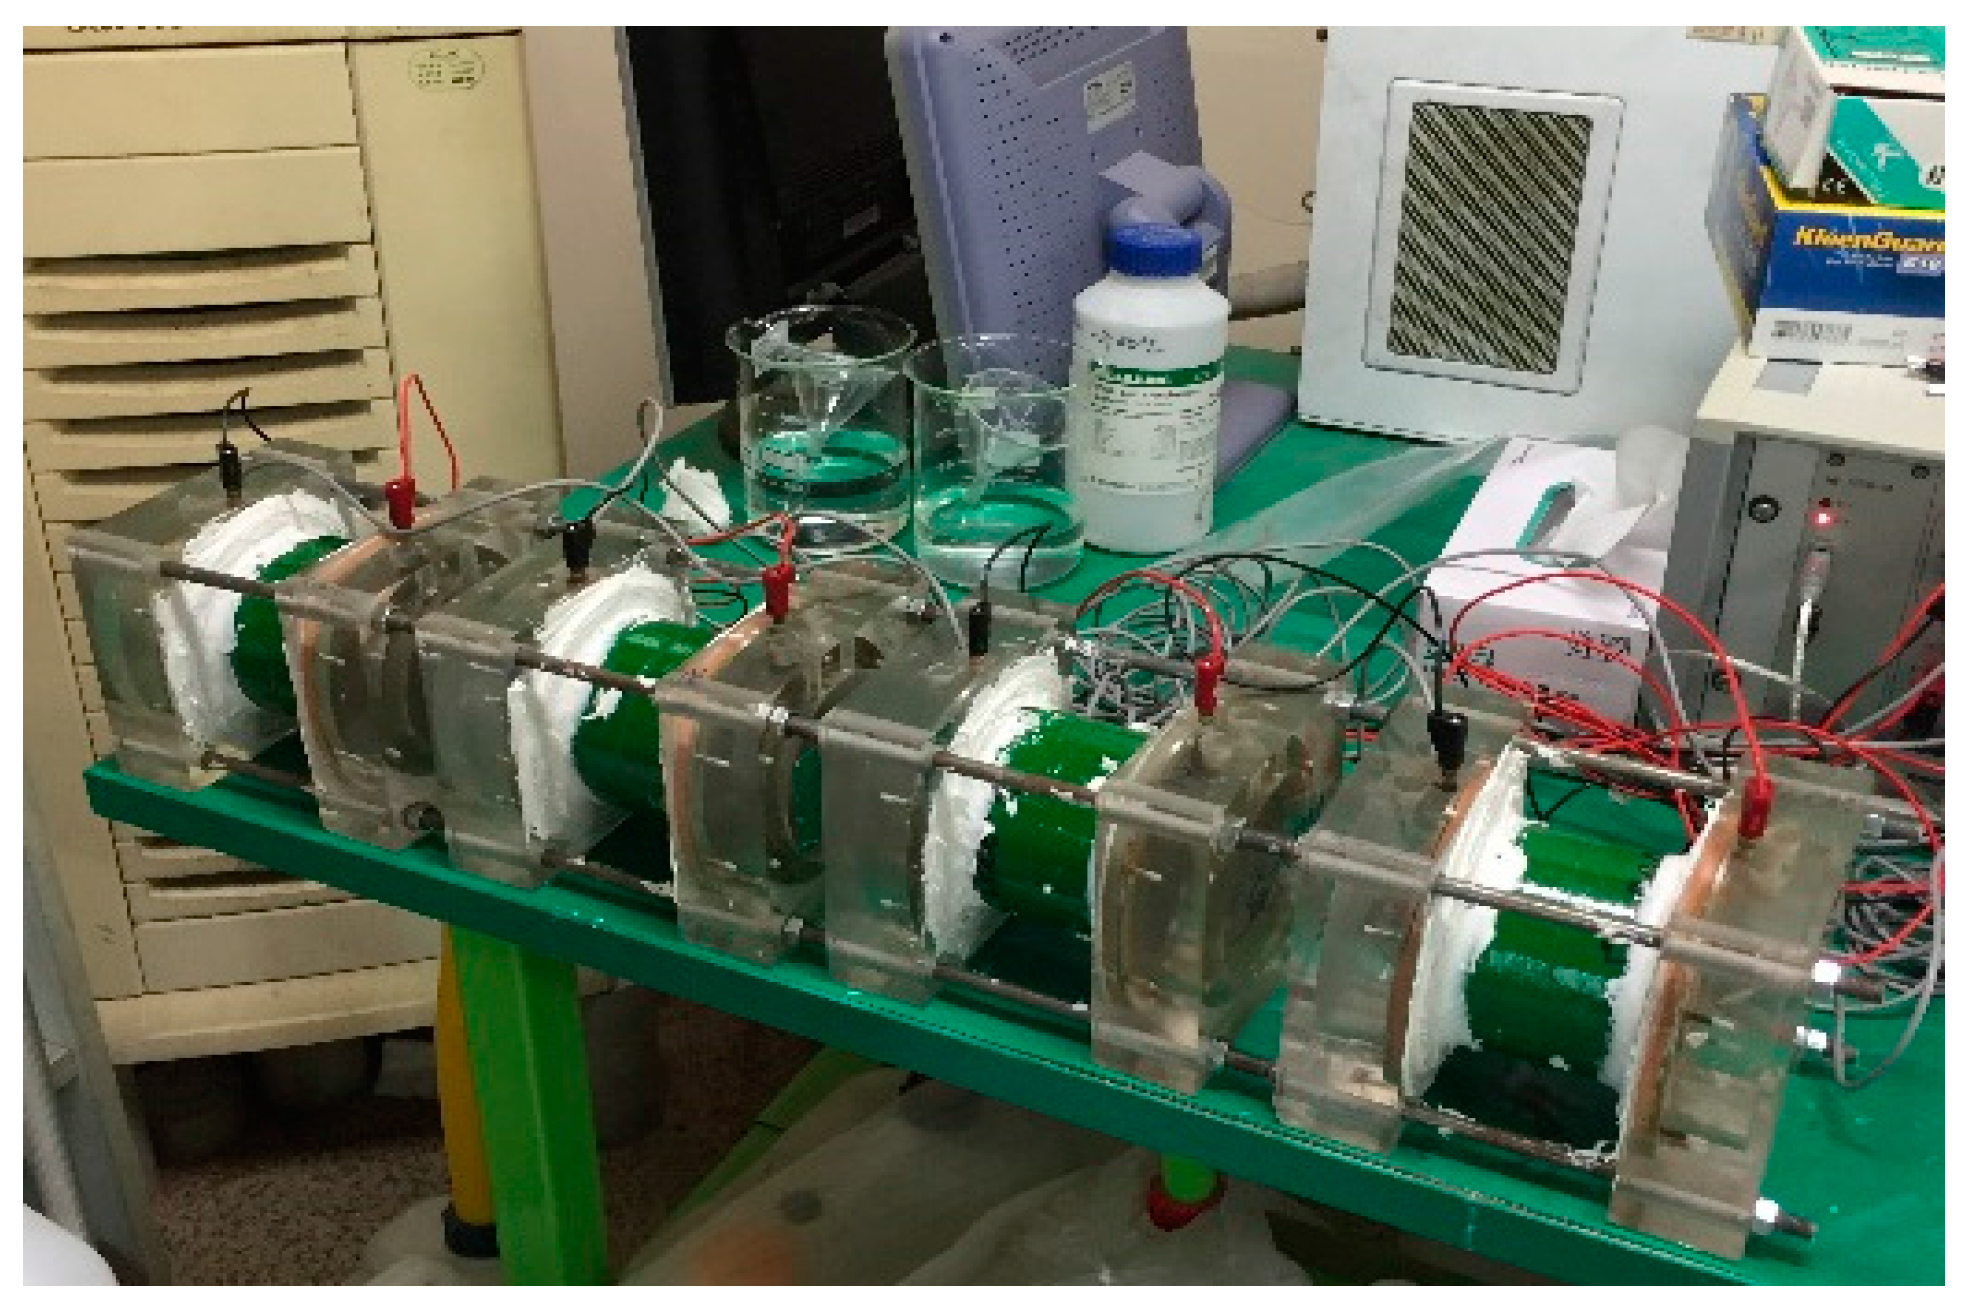
4.1.2. Diffusion Coefficient under steady-state Conditions

In order to evaluate the equivalent diffusion in concrete with a crack, an accelerated migration test in the steady-state condition was selected, the so-called Andrade method, based on the recommendations of previous researchers [24]. The effective diffusion coefficient (Deff) in cracked concrete can be obtained as Equation (21) and is comparable to the equivalent diffusion coefficient in cracked REV shown in Equation (14). For the test, a 0.5 M solution of NaCl and a 0.1 M solution of NaOH were used for the catholyte and anolyte, respectively, in the migration cell [24].
D e f f = R T i t c l l n F 2 Δ E A C c l Z
where R is the universal gas constant (8.314 J/K·mol), T is the absolute temperature (K), i is the current (Amp), t c l is the transference number (0.4336 in the case of 0.1 M NaOH and 0.5 M NaCl), l is the thickness of the sample (m), n is 1.0, F is Faraday’s constant (9.648 × 10⁴ J/V·mol), Δ E is the applied potential (30 V), A is the cross-section of the concrete sample (m2), Z is the ion valence, and Ccl is the concentration of the chloride ions in the diffusion cell (mol/L). The current varied initially but then became almost constant after 23 days. The diffusion coefficients measured using this procedure were then compared with the values predicted by the proposed model for the anisotropic condition. Photographs showing how the cracks were induced and the diffusion test are shown in Figure 4 and Figure 5, respectively.
The test results showing the chloride diffusion coefficients measured for various crack widths are listed in Table 4 and Figure 6. As the graph shows, the equivalent diffusion coefficient has increased by a factor of about 2.5 by the time the crack width reaches 0.4 mm. The regression result is obtained using Equation (22) for a crack width w (mm):
D e f f = 6 × 10 12 e 2 . 1247 w , R 2 = 0.856
In previous tests under non steady-state conditions, the diffusion coefficient for crack widths over 0.2 mm were reported to increase significantly [1,4], although this increase was slow due to the buffering effect of the large volume of sound concrete.

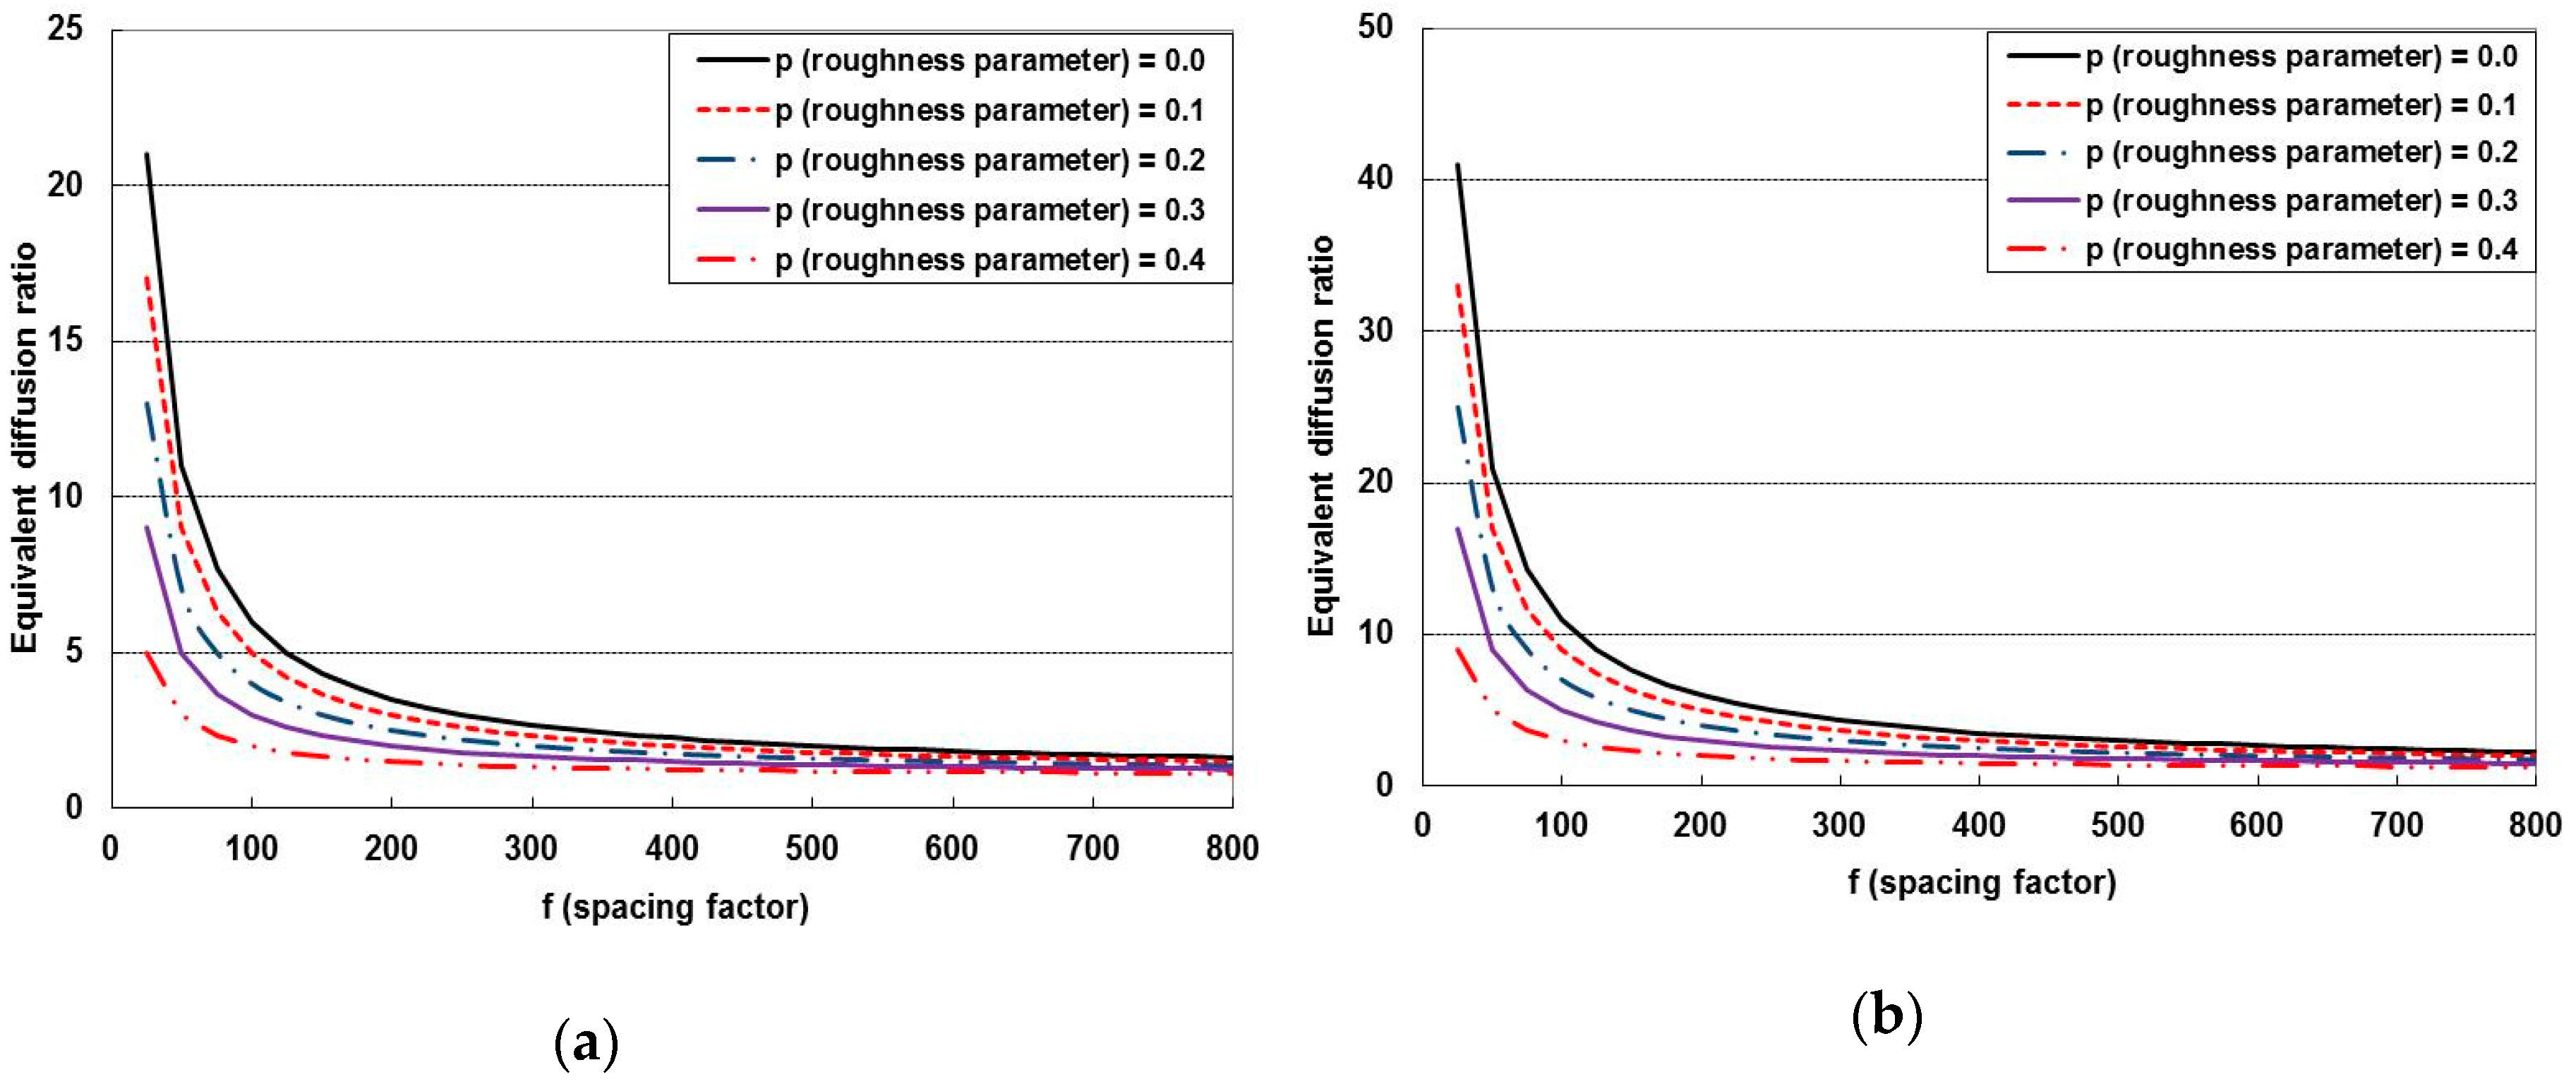
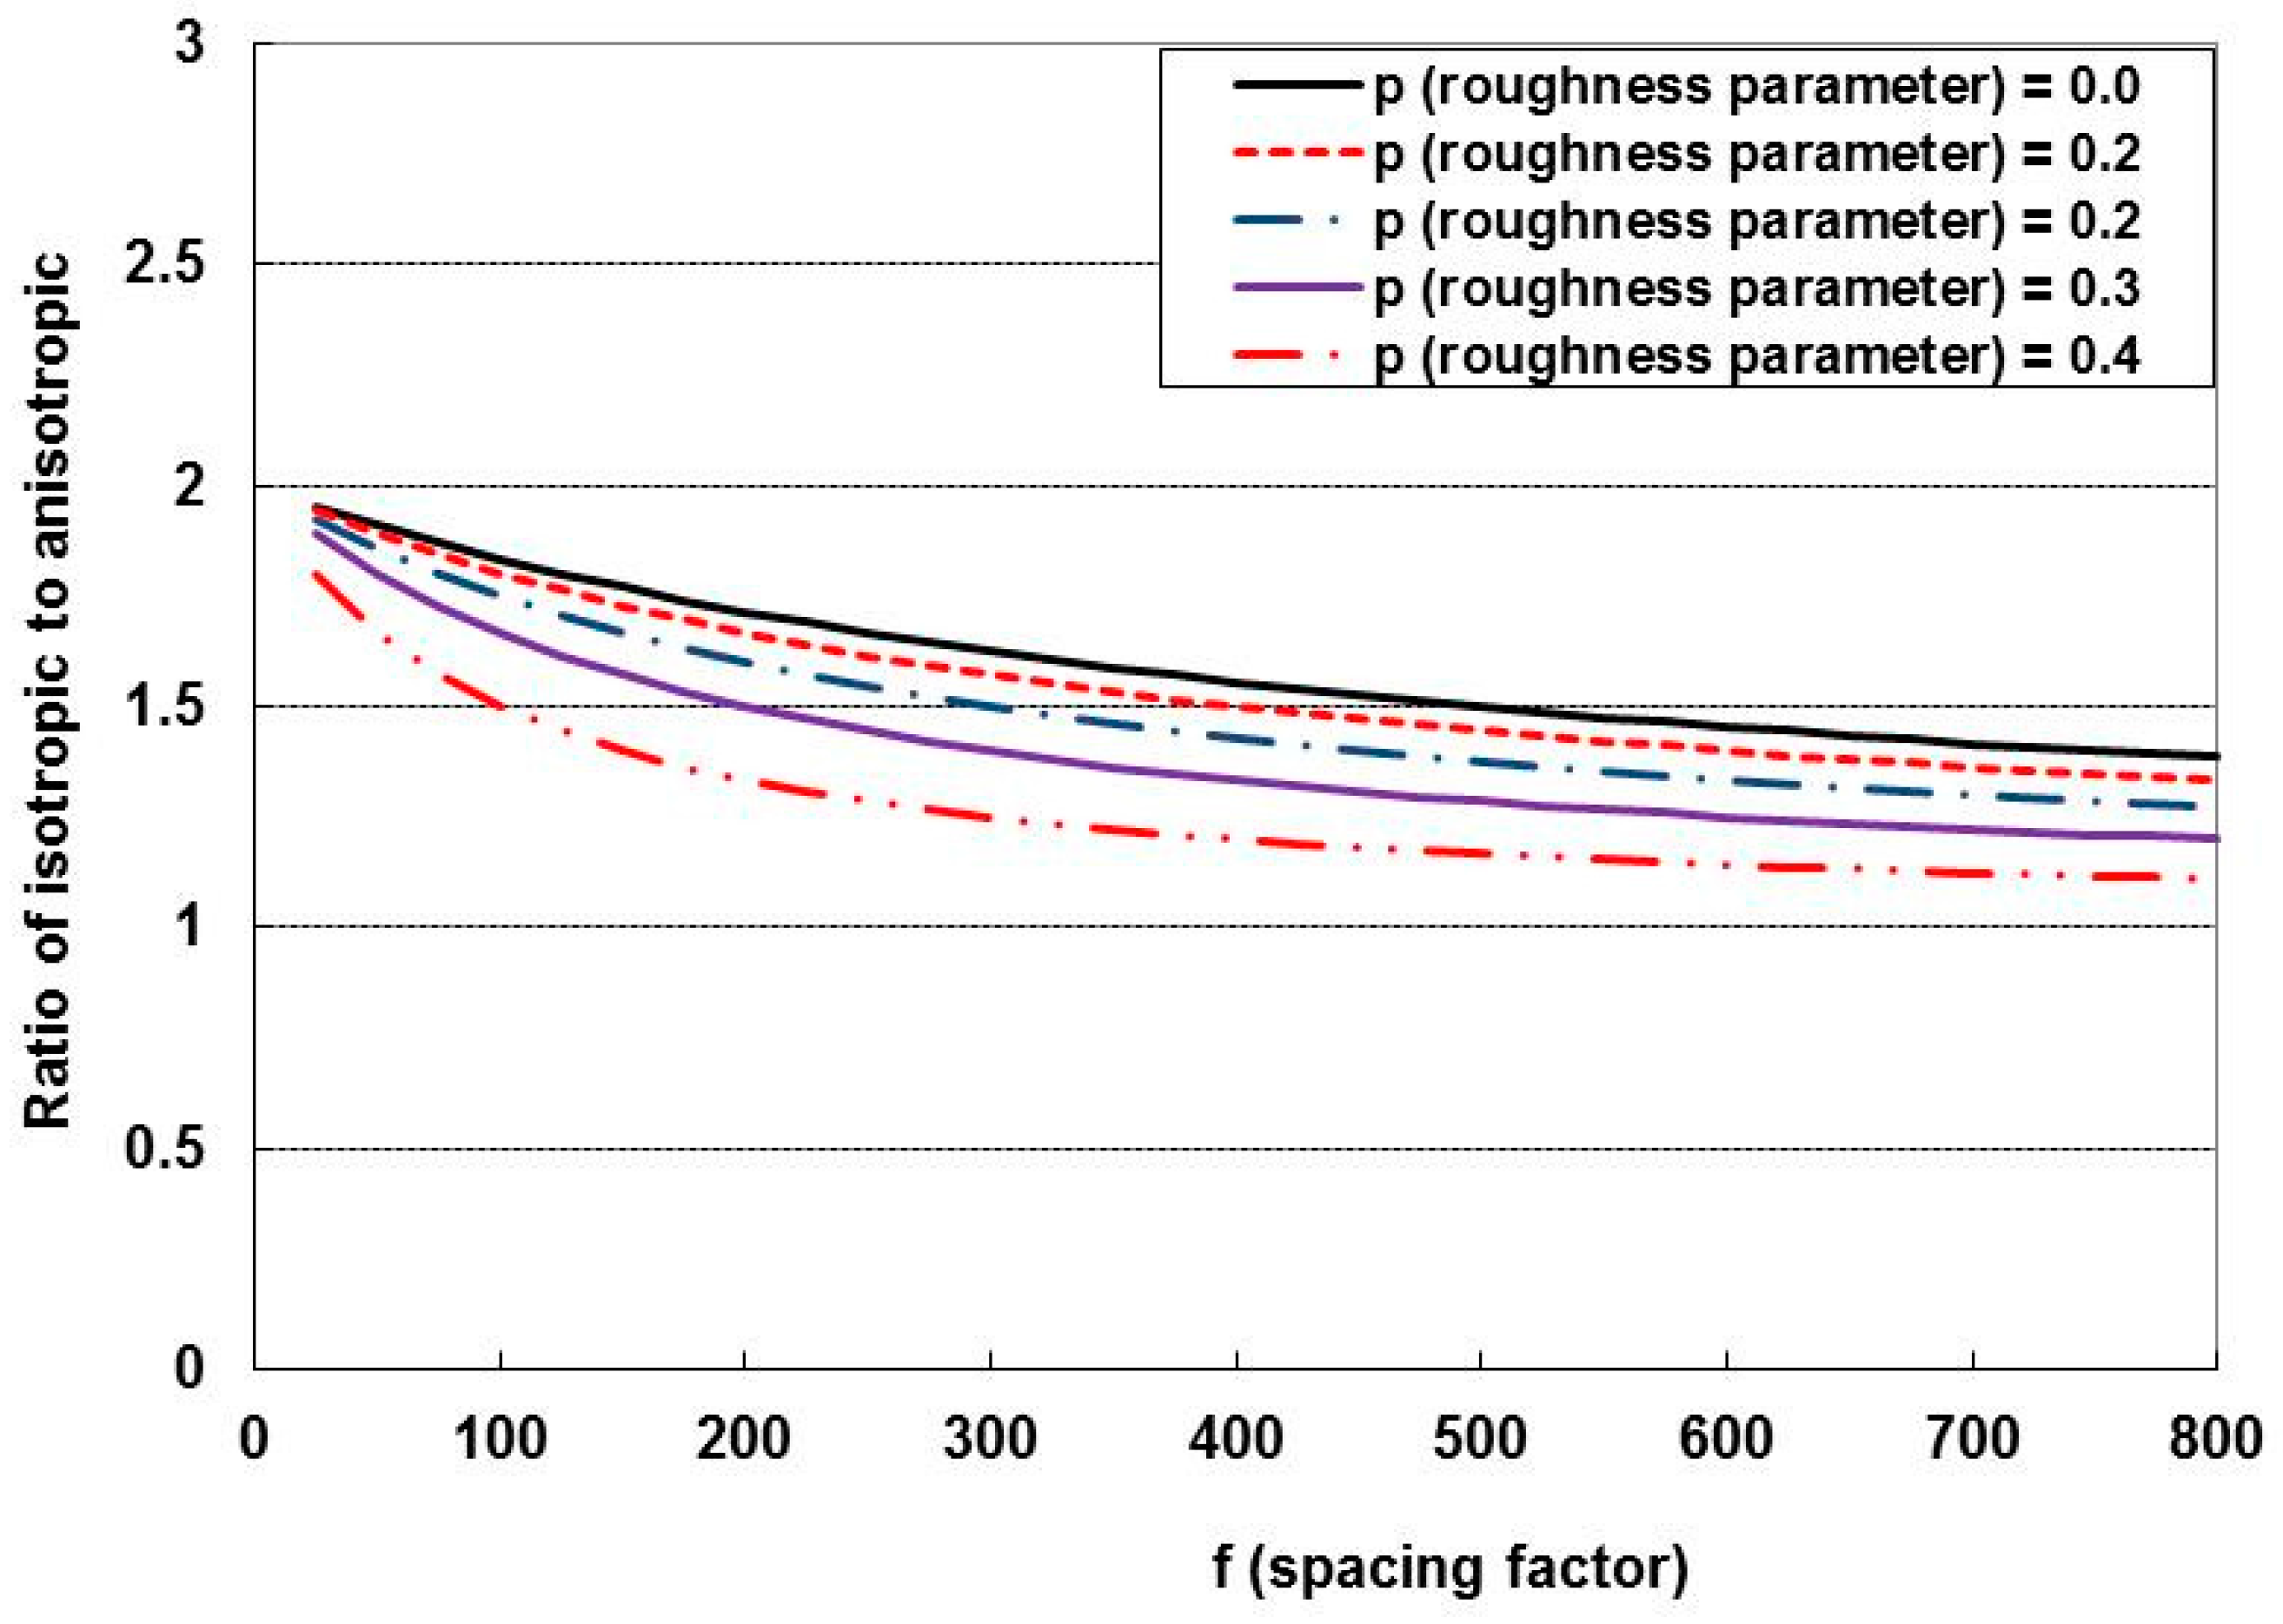
4.2. Simulation with Varying Parameters

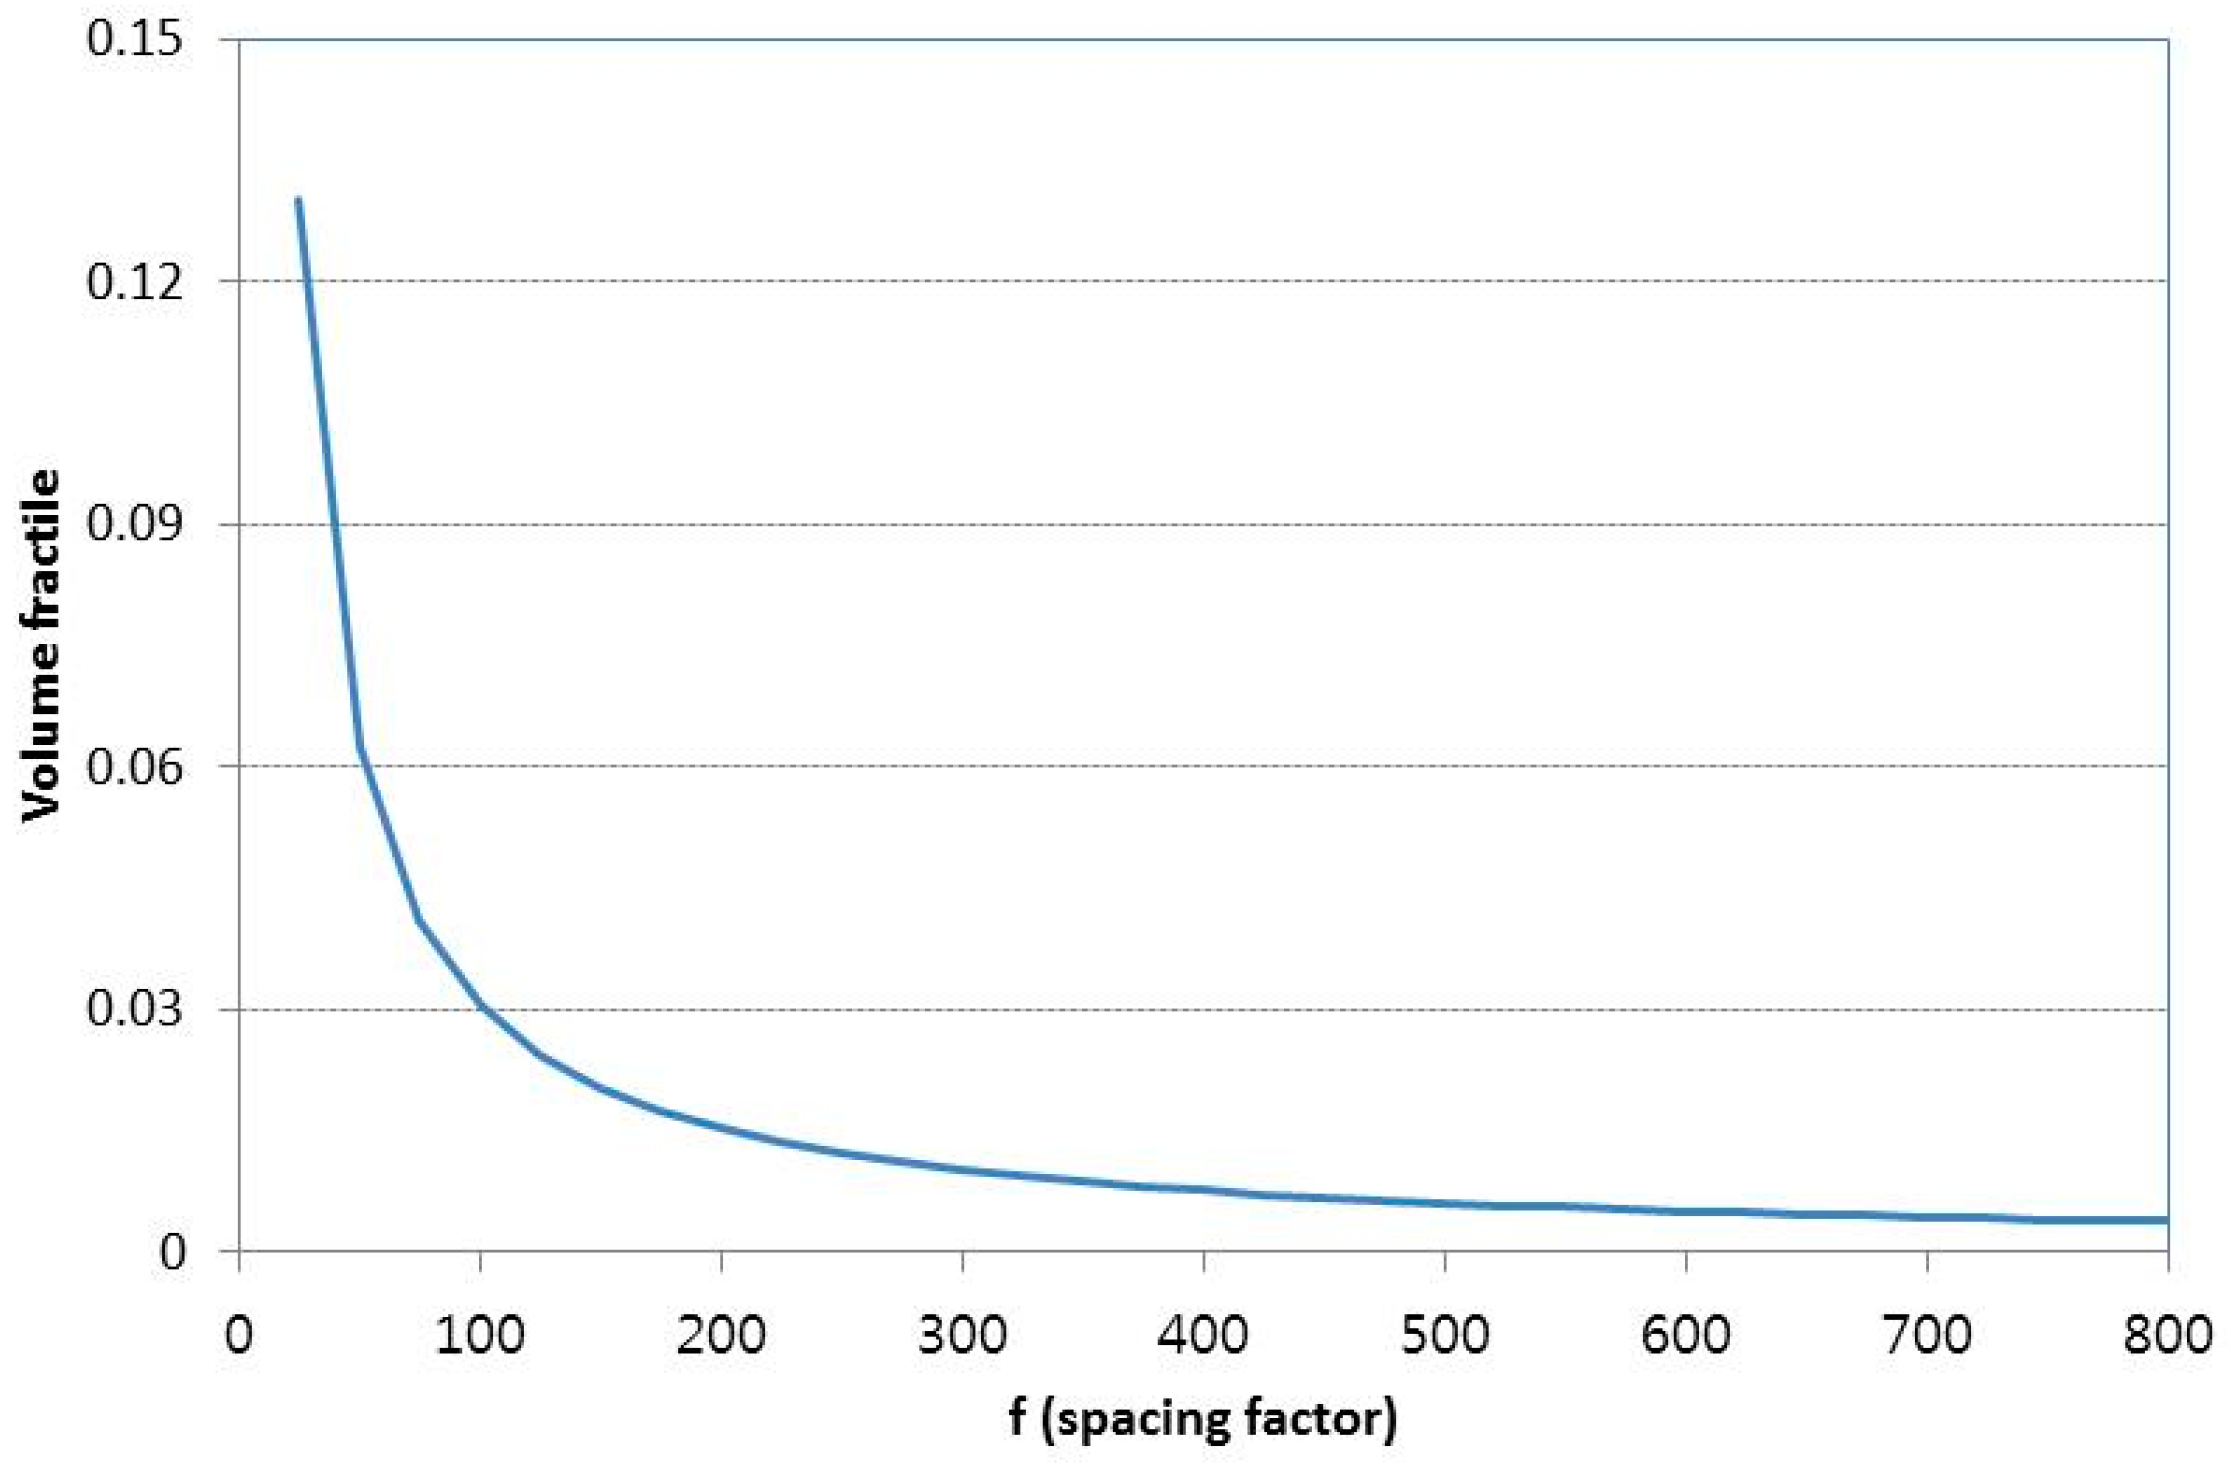
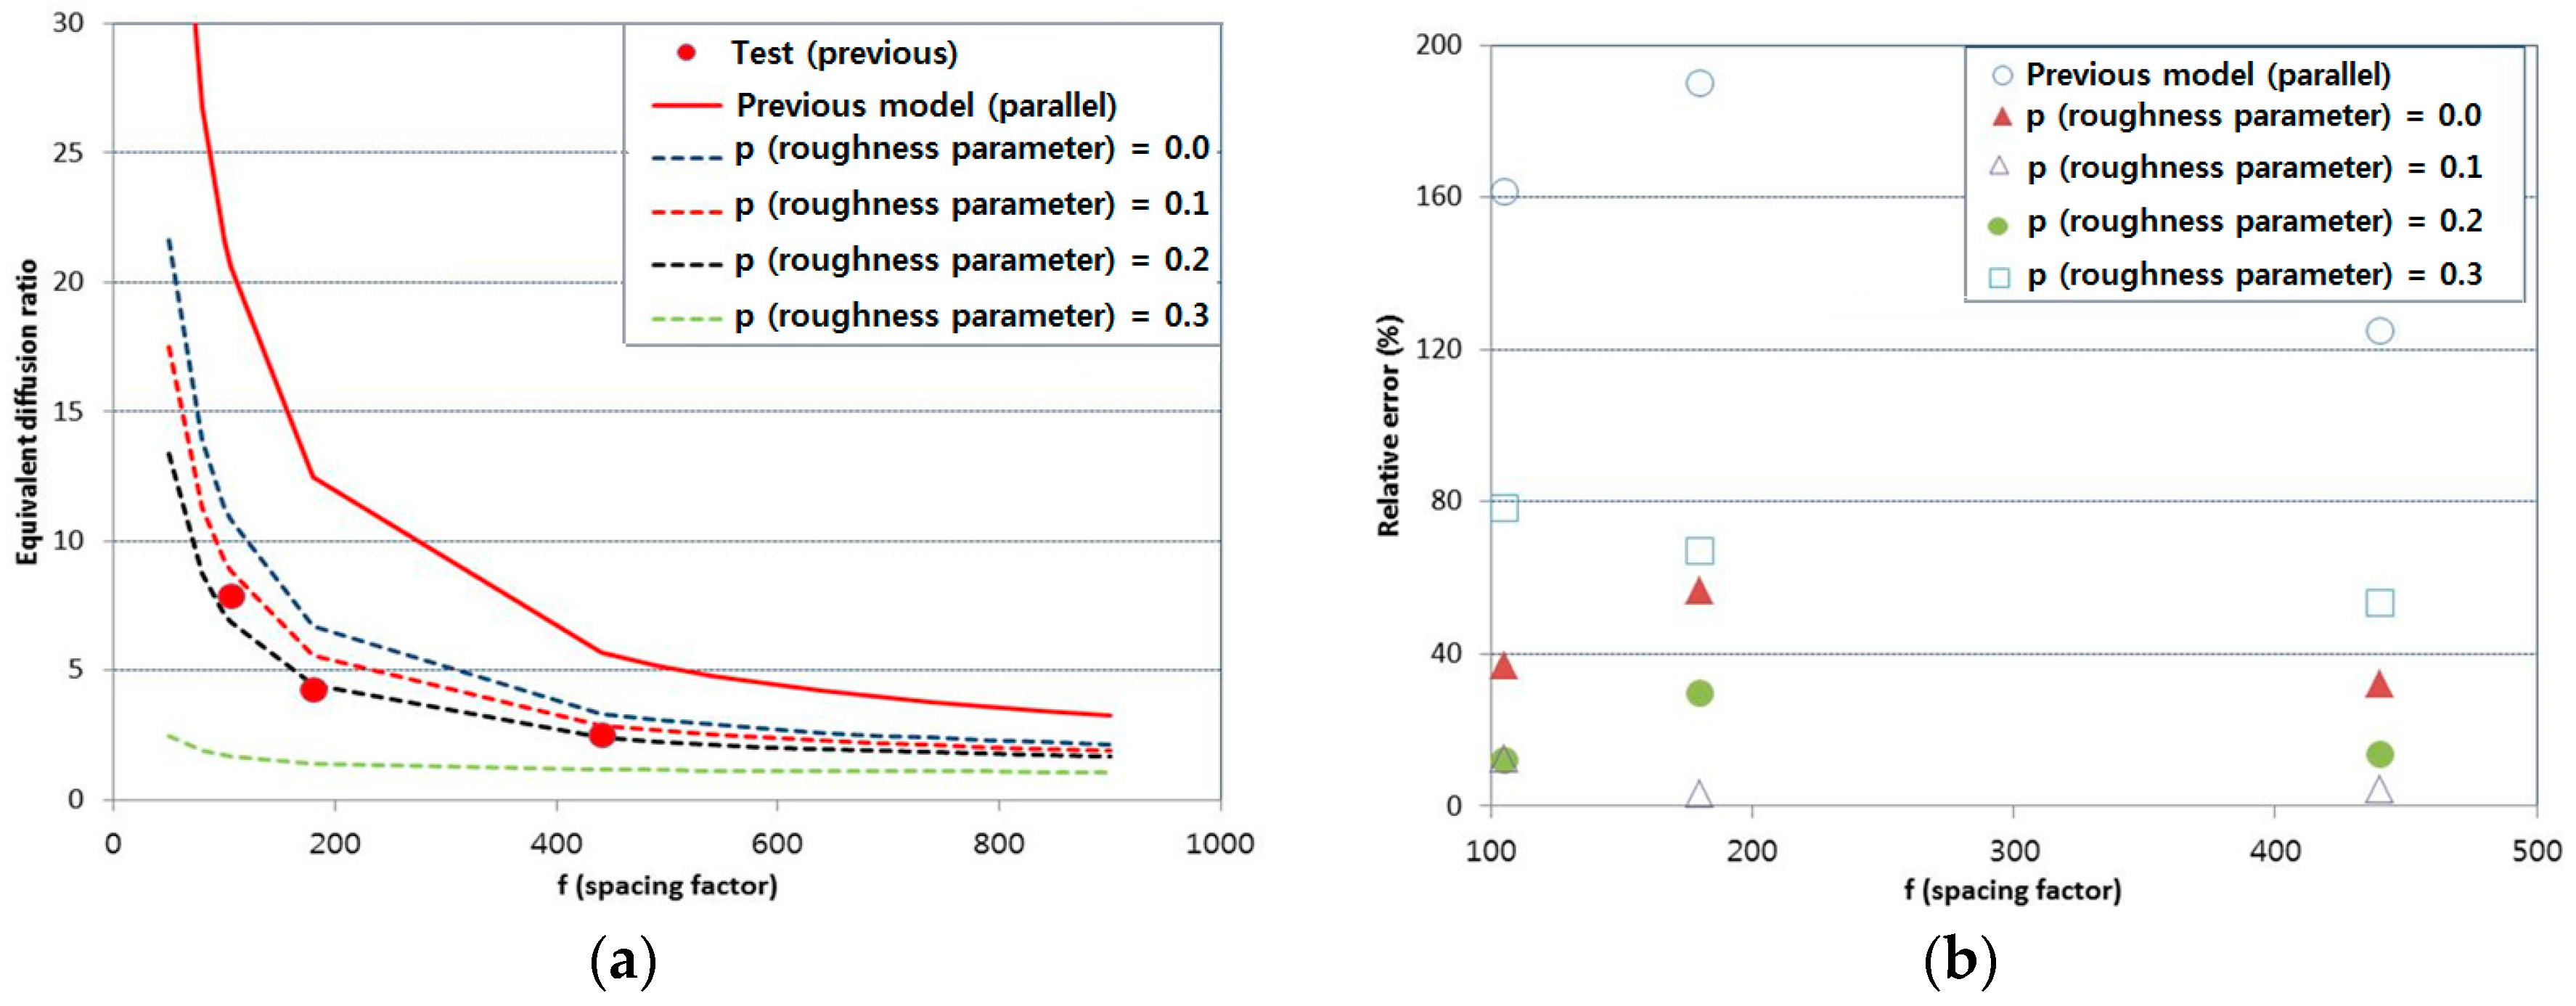
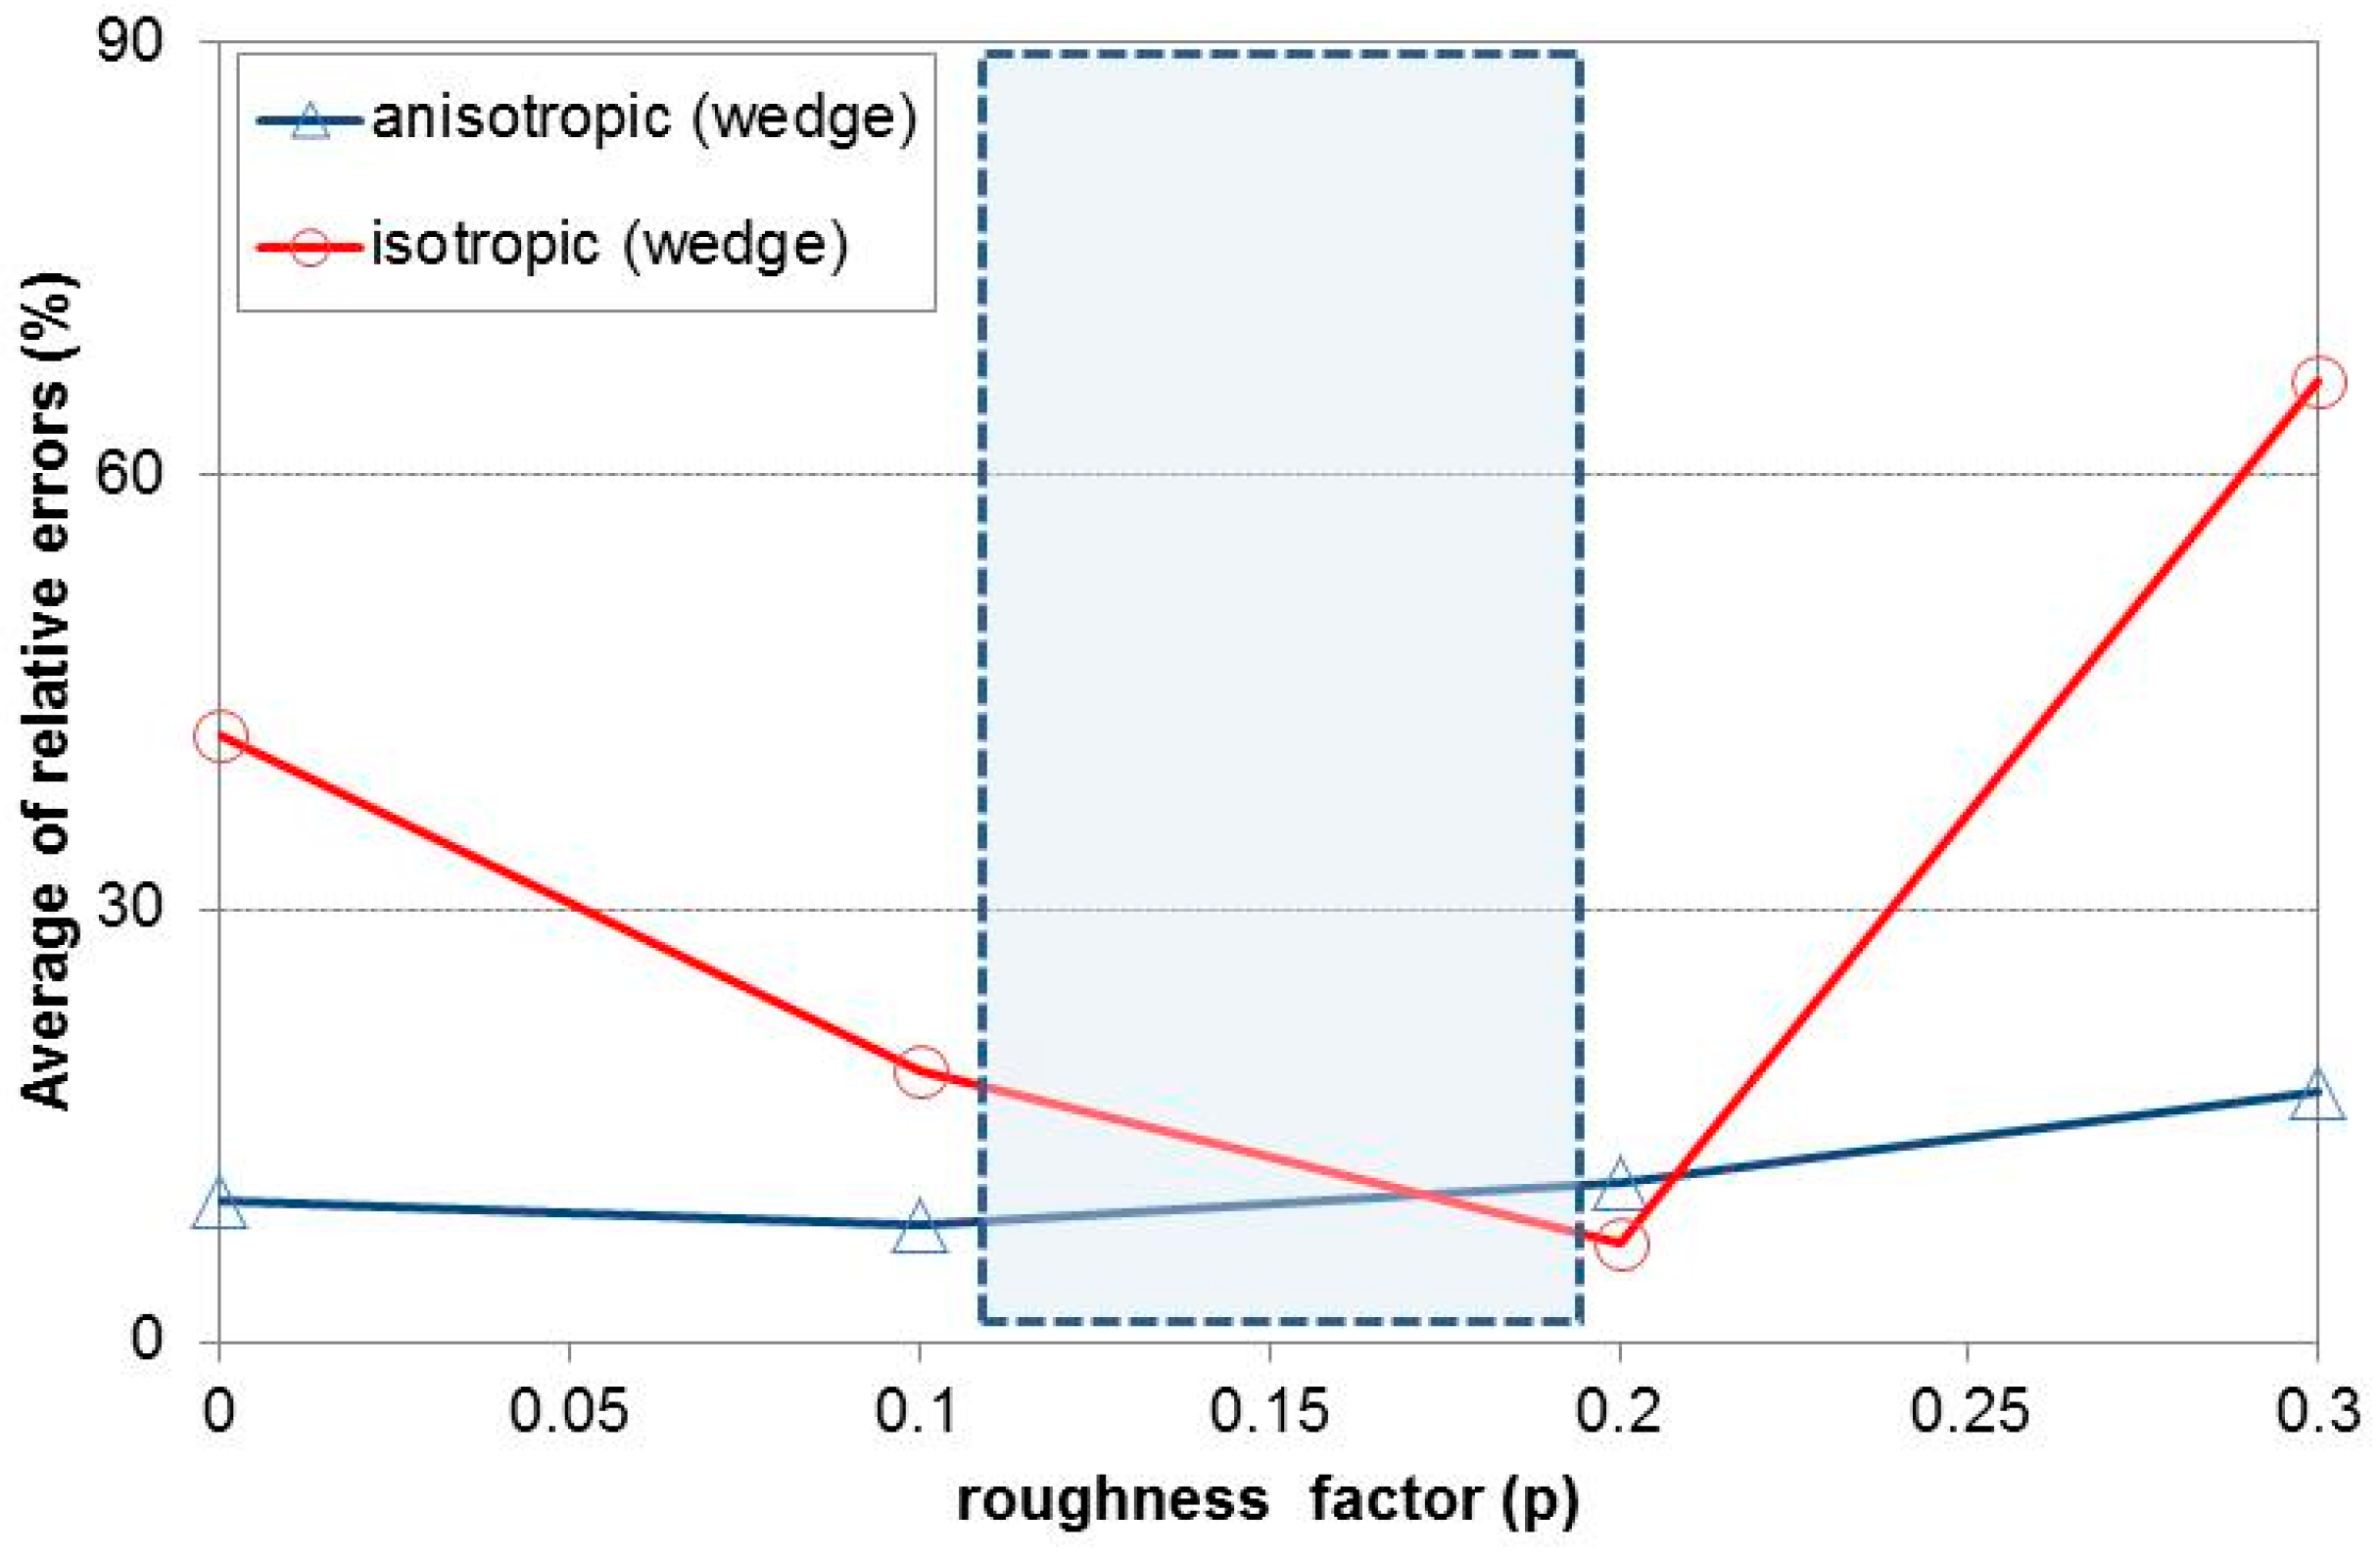
4.2.1. Roughness and Crack Density Effect

In this section, a normalized chloride diffusion coefficient is simulated with varying p and f. D0 is the reference diffusion coefficient in sound concrete and usually falls within the range 1.0 × 10⁻¹²~10.0 × 10⁻¹² m2/s. For the simulation, the reference diffusion coefficient (D0) is set as 1.0 × 10⁻¹² m2/s and the equivalent diffusion coefficients are simulated with varying p and f.
The simulated results are shown in Figure 7 for both the anisotropic and isotropic conditions. With increasing f, the equivalent diffusion ratio decreases significantly, dropping to 1.0, since the effect of diffusion in the reference diffusion coefficient dominates.
For values of f between 25 and 800, the equivalent diffusion coefficient decreases from 21 to 1.625 in the anisotropic condition and from 42 to 2.250 in isotropic condition as f increases. The enlarged p means greater hindrance affecting the chloride diffusion, with a corresponding reduction in the chloride intrusion area. When p goes to 0.4 and f increases to 800, the equivalent diffusion coefficient decreases to 7.74%~22.5% for the anisotropic condition and 5.48%~13.89% for the isotropic condition.
The ratio of the isotropic to anisotropic values must be in the range of 1.0~2.0. The ratio (Rd) can be determined using Equation (23), where Equation (20) is divided by Equation (14):
R = D 1 [ ( 1 2 p ) / ( f D 0 ) + 1 ] D 1 [ ( 1 2 p ) / ( 2 f D 0 ) + 1 ] = 2 D 1 ( 1 2 p ) + 2 f D 0 D 1 ( 1 2 p ) + 2 f D 0
If f increases from 1 to infinite, R reduces from 2.0 to 1.0. With increasing p, R converges to 1.0 more rapidly due to the reduced intrusion of chloride ions in the crack width. This indicates that a greater roughness (p) effectively acts as a higher crack spacing factor (f). The simulation results are plotted in Figure 8.

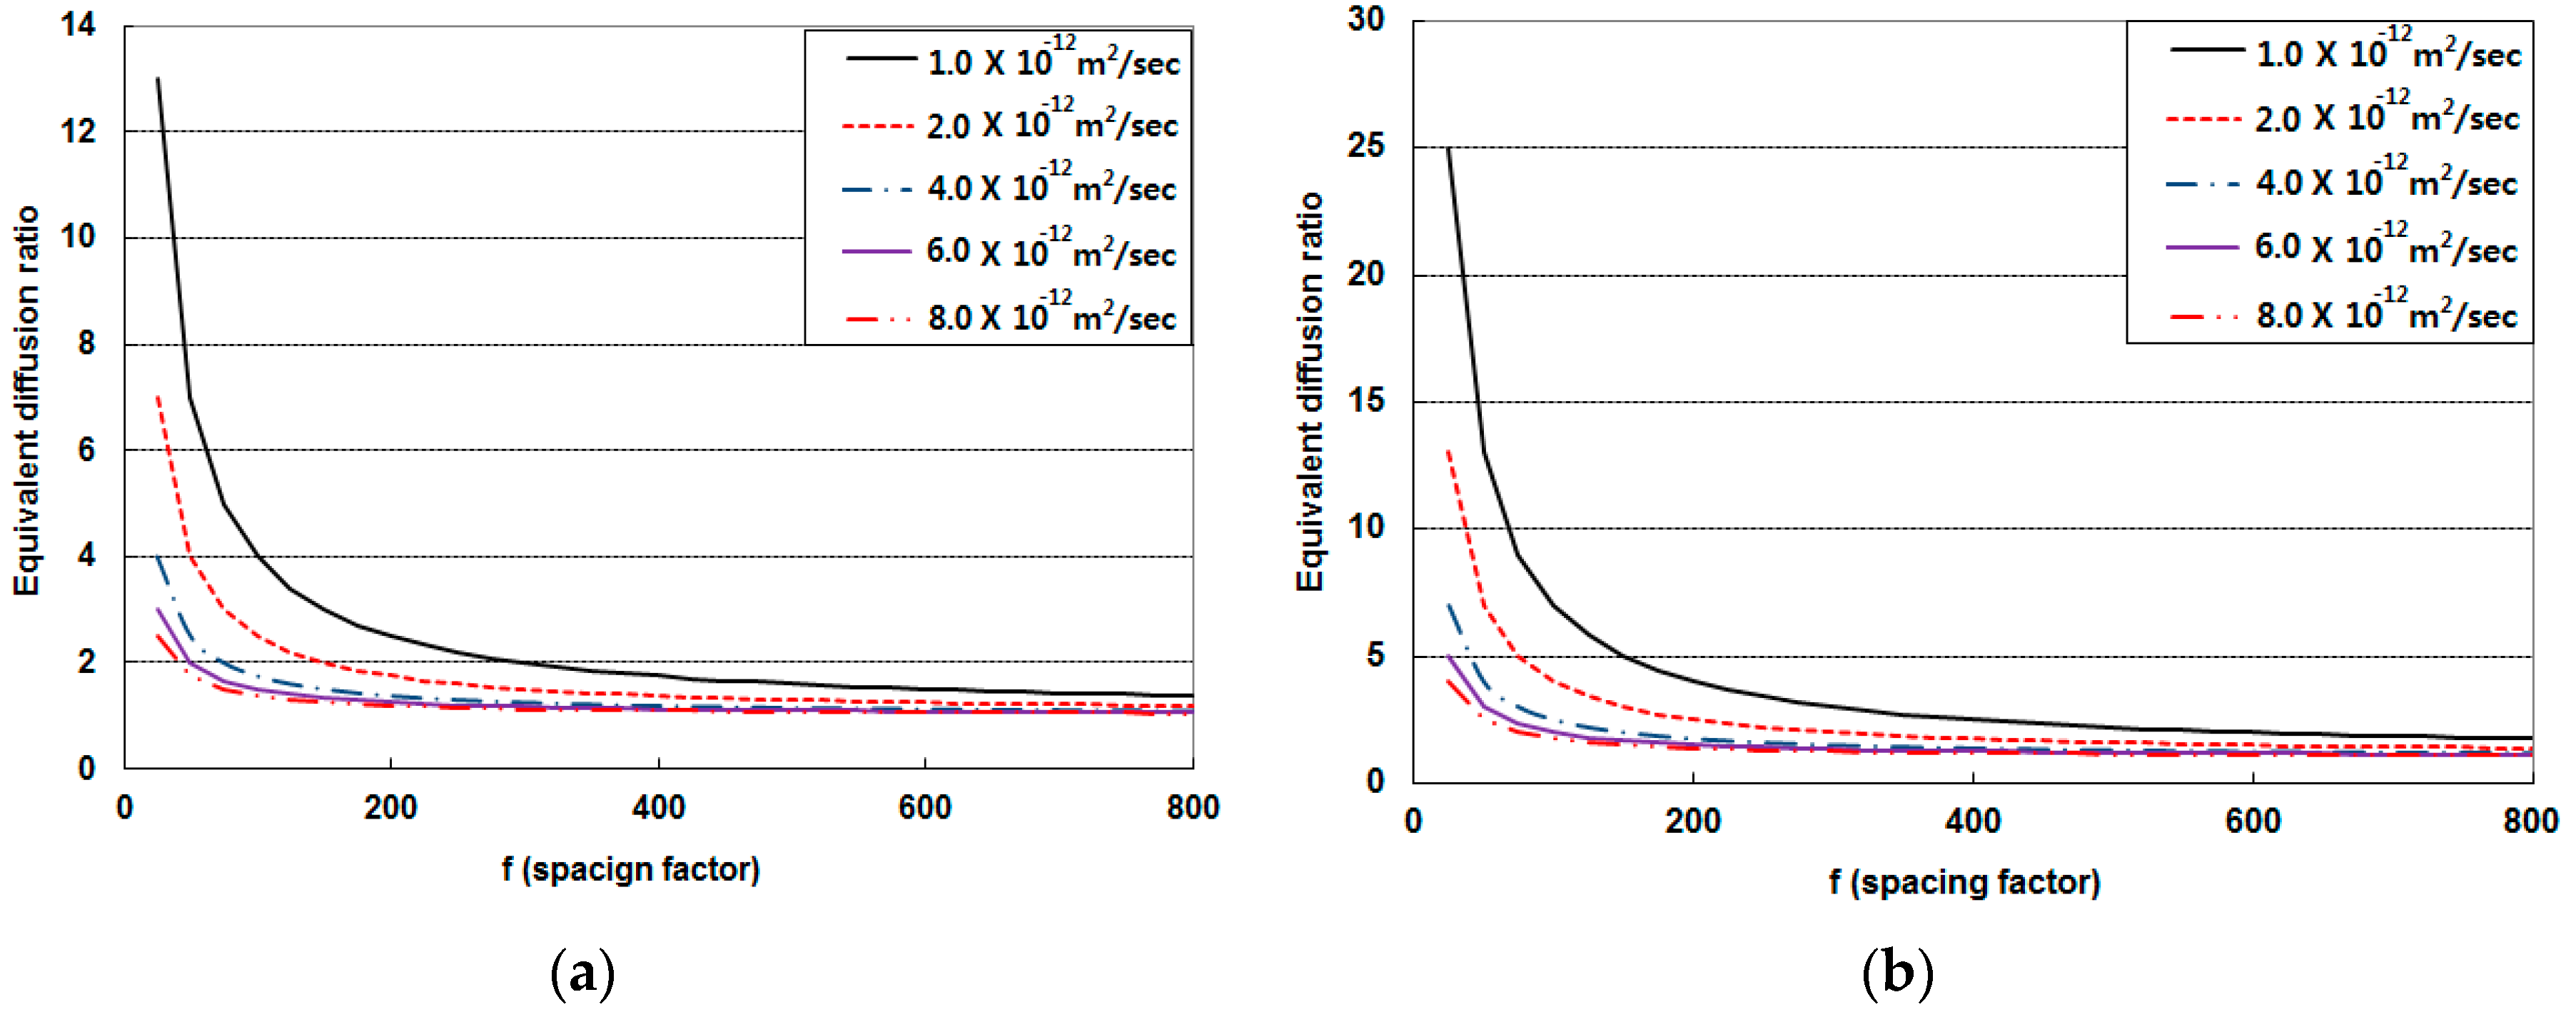
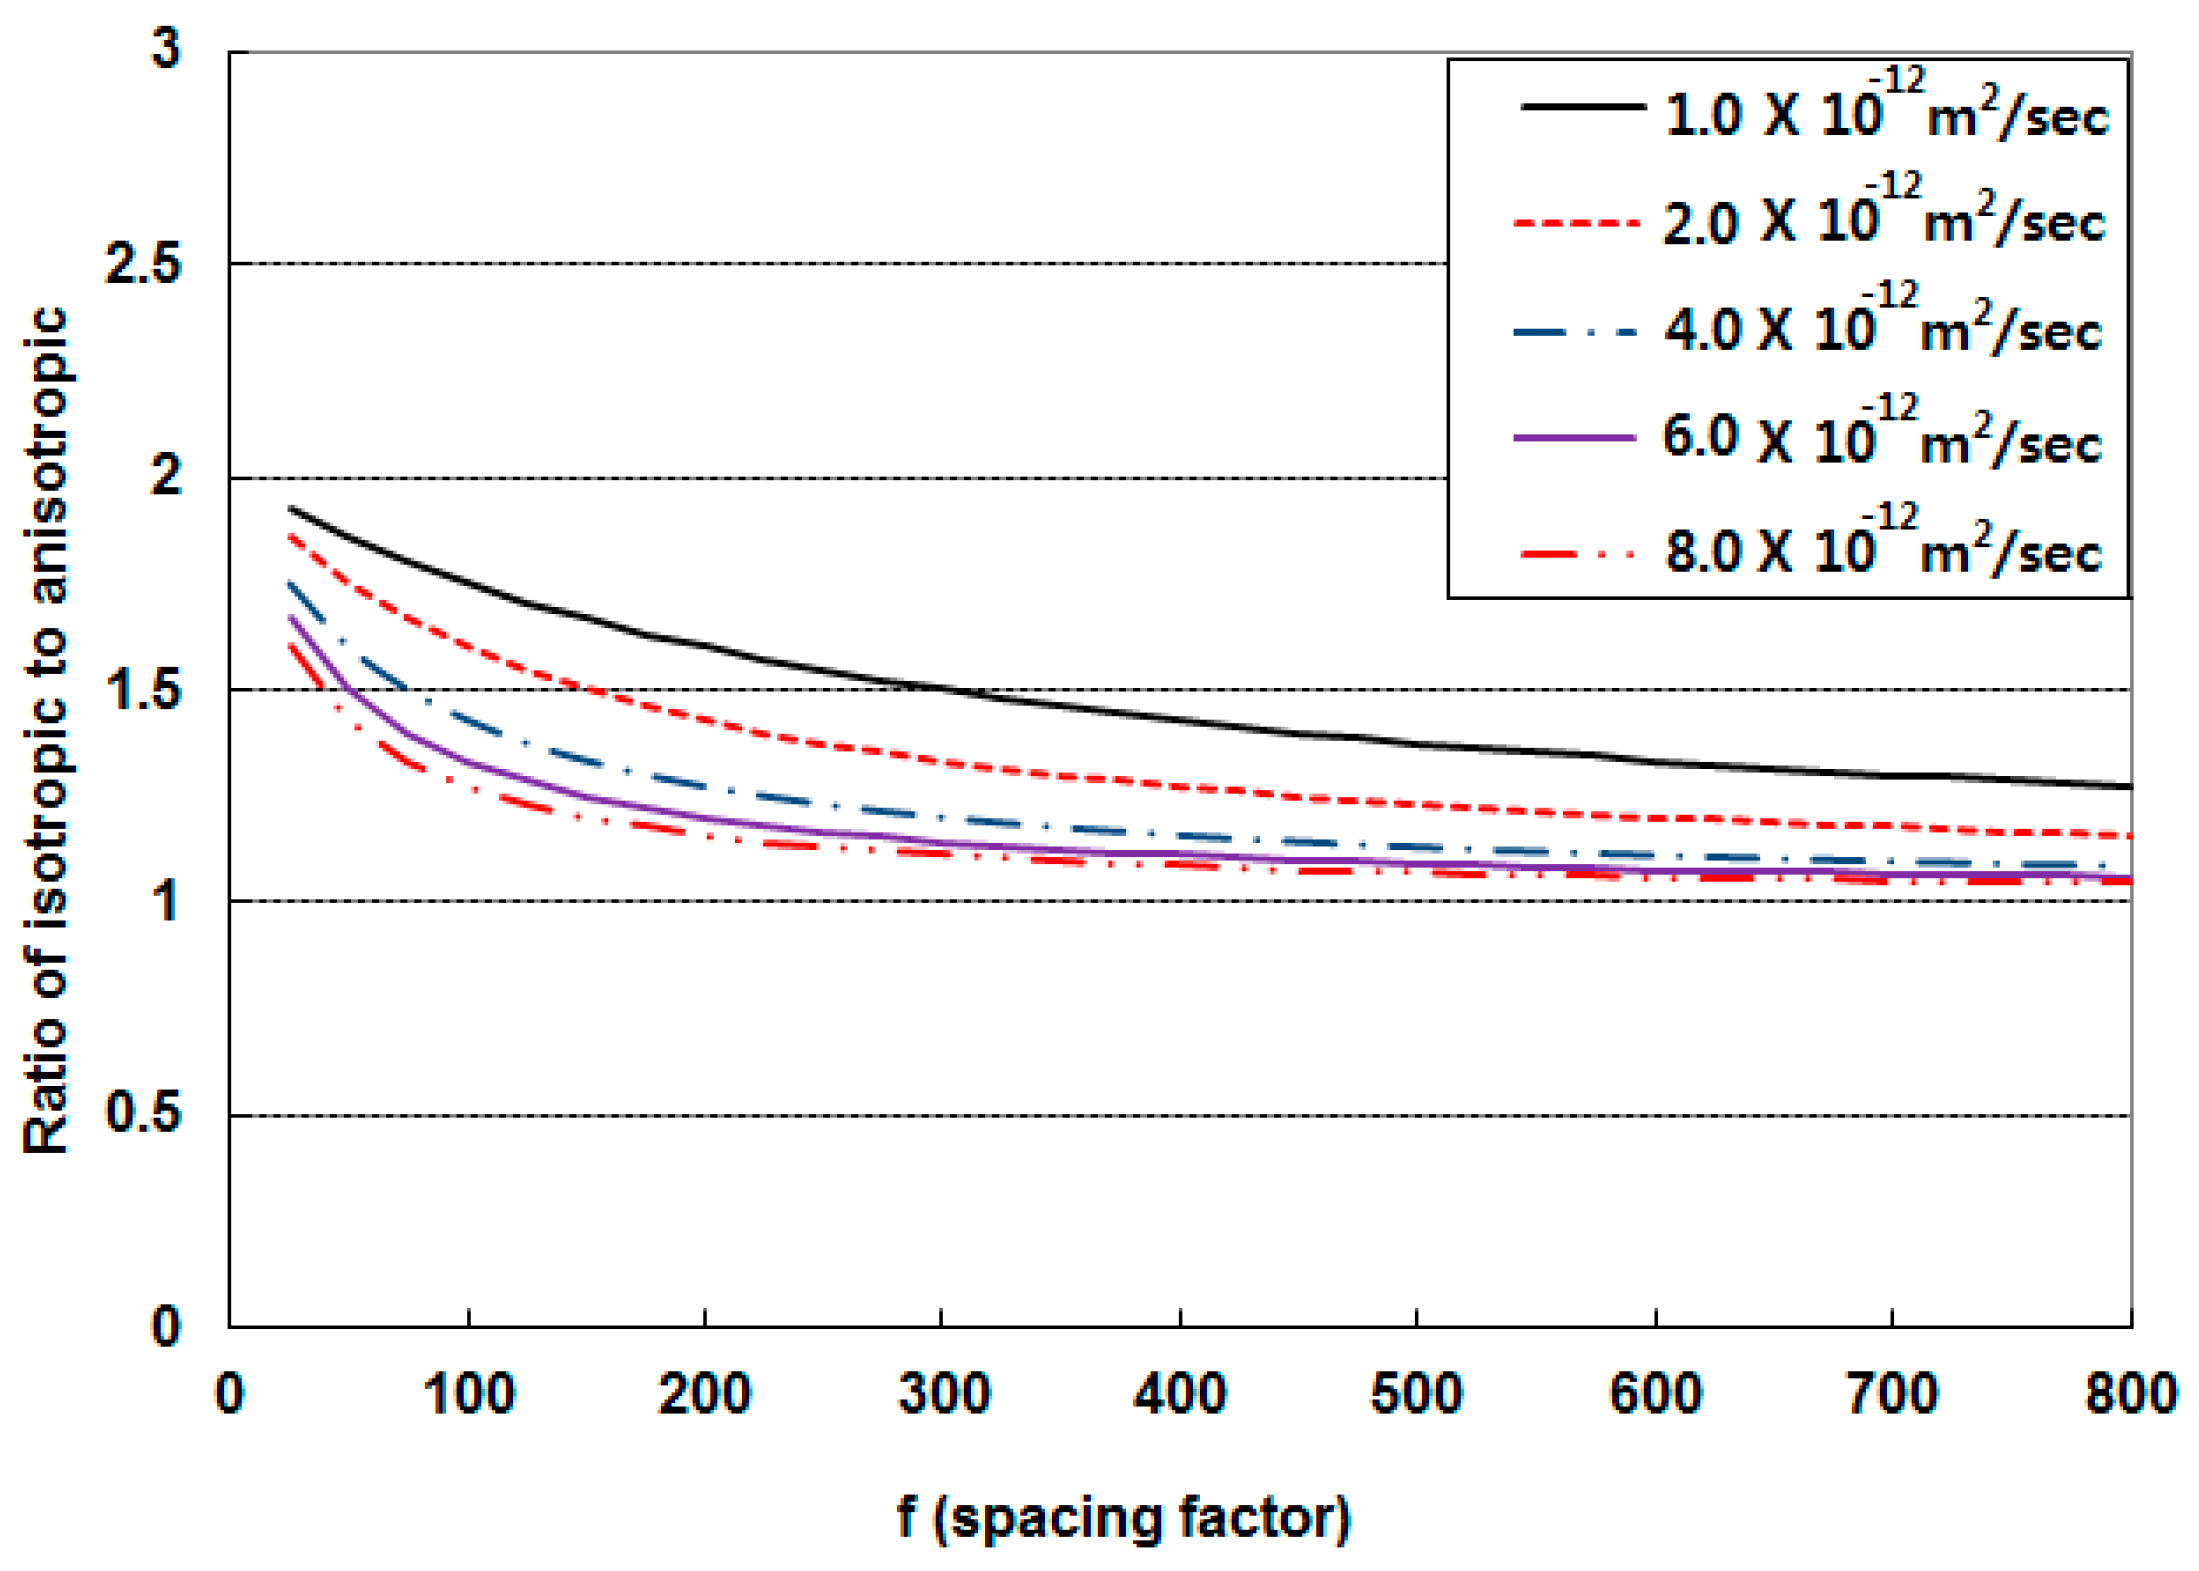
4.2.2. Reference Diffusion Coefficient Effect

Any increase in the reference diffusion coefficient will have an impact on the equivalent diffusion coefficient, with a lower diffusion coefficient indicating that the concrete has a low w/c ratio and high strength. In the given condition of p = 0.2, the equivalent diffusion coefficient is simulated by varying D0 from 1.0 × 10⁻¹² to 8.0 × 10⁻¹². The results are shown in Figure 9 for both the anisotropic and isotropic conditions.
As the diffusion coefficient in high strength concrete decreases, this causes the equivalent diffusion ratio to increase significantly, so the effect of cracks on diffusion will affect high-strength concrete more severely. The effect of cracks on deterioration is quite remarkable in high-strength concrete since the ingress of harmful ions is very limited in the absence of cracks. This trend is clearly shown in previous research on chloride attacks [1,4,25] and carbonation [15,25].
When f increases to 800 under anisotropic conditions, the equivalent diffusion decreases significantly, dropping by 10.57% for 1.00 × 10⁻¹² m2/s (high strength concrete) and 41.88% for 8.00 × 10⁻¹² m2/s. For the isotropic condition, it decreases to 7.00% for 1.00 × 10⁻¹² m2/s and 27.34% for 8.00 × 10⁻¹² m2/s. The effect of the reference diffusion on R is similar to the effect of roughness, as shown in Figure 10.

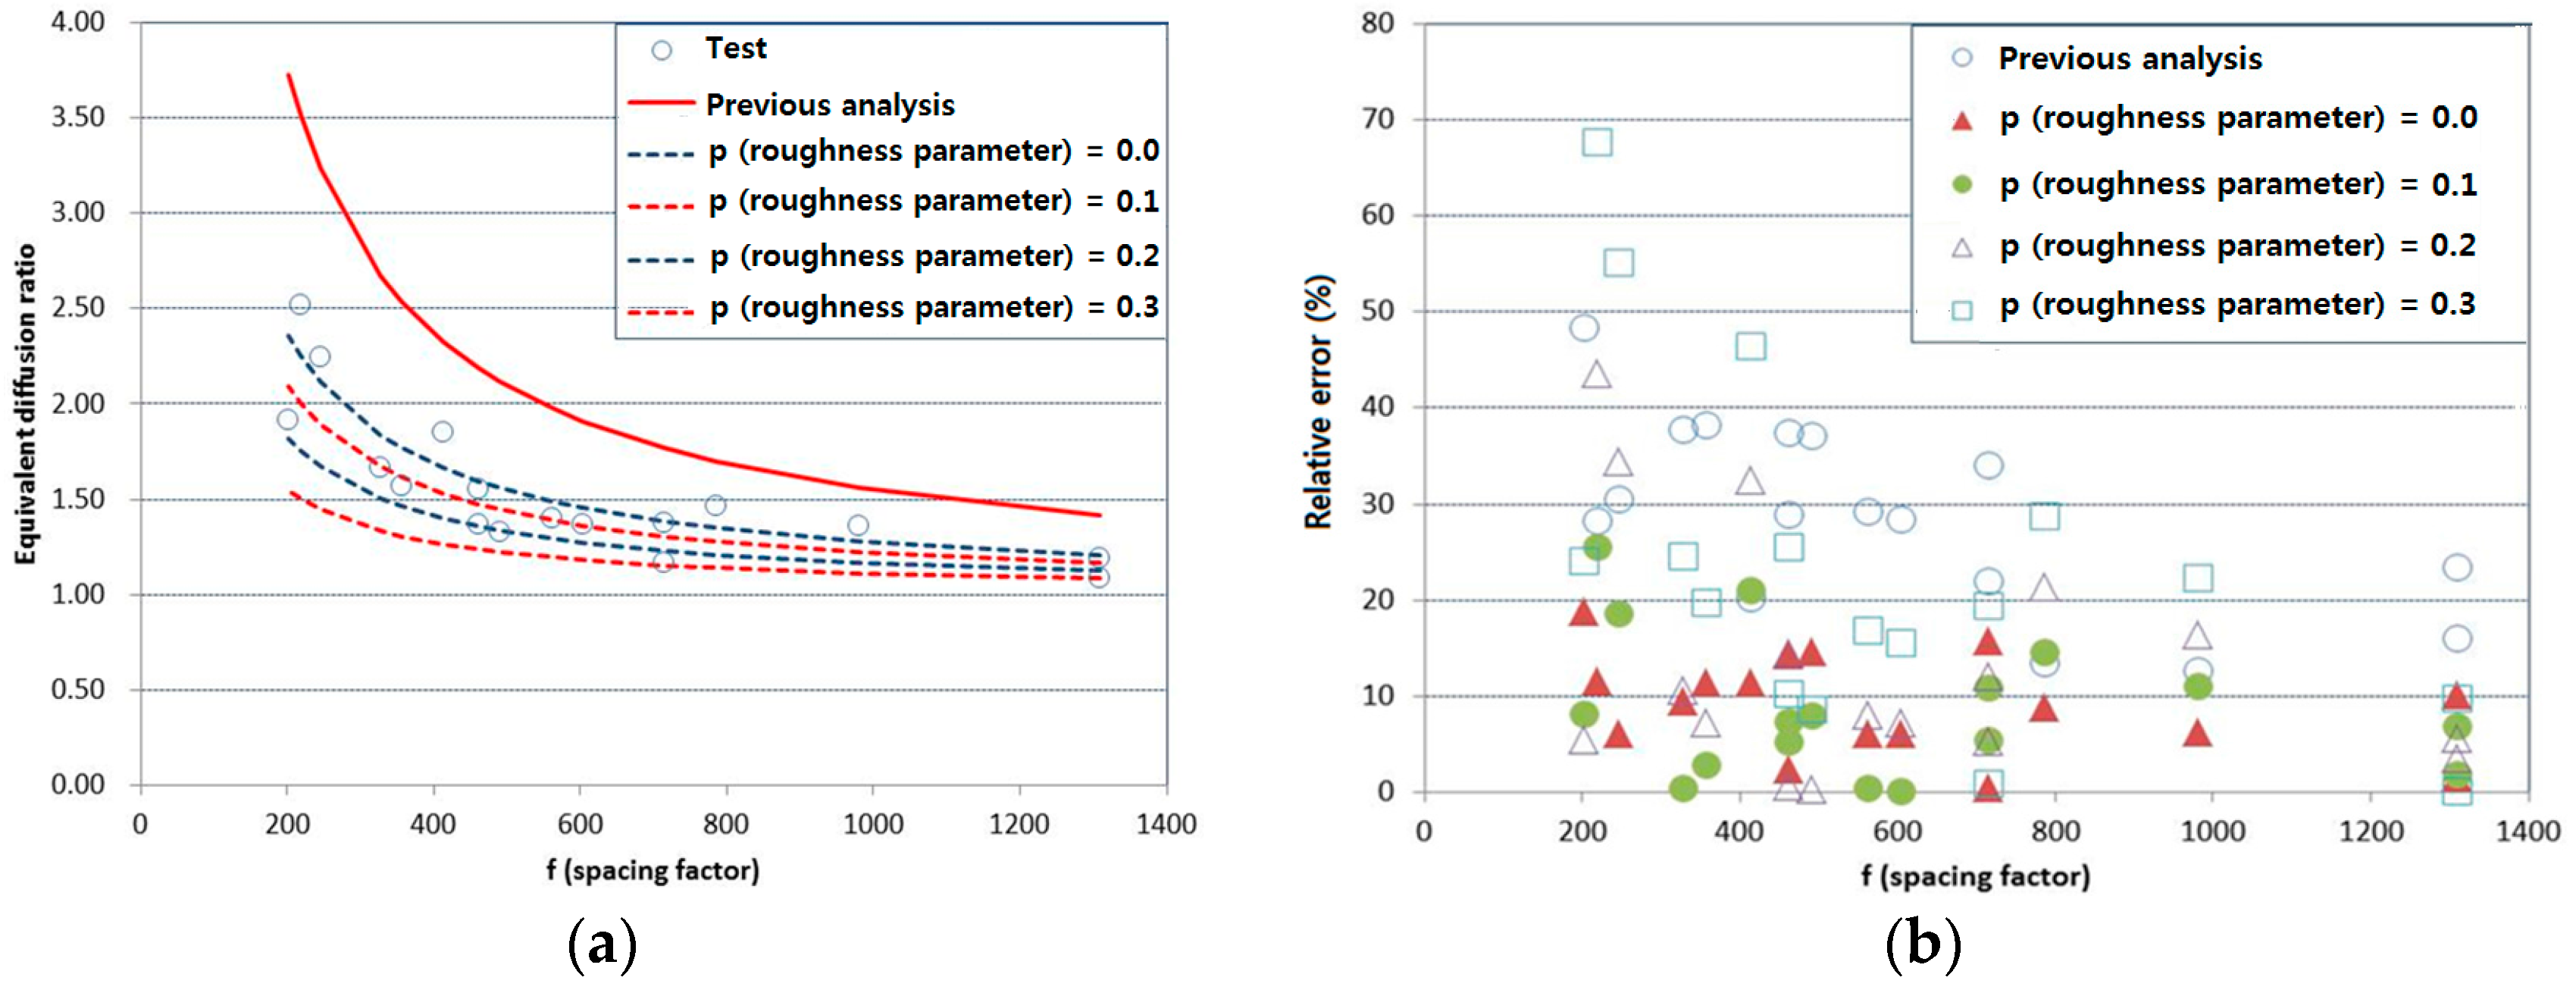
4.3. Verification of the Proposed Model

4.3.1. Anisotropic Diffusion Model

The concrete area in the diffusion test differs from that in the REV model shown in Figure 2 since the concrete area used in the diffusion test has a circular section with a diameter of 100 mm. The height of the concrete REV (L1) is taken to be 100π/4 (mm) for the same equivalent exposure area for diffusion. It is important to ensure that the diffusion coefficient in the cracked area is for the free water condition in an electrical field. In previous research [3], it was assumed to be 1.0 × 10⁻⁹ m2/s for an applied voltage of 10 V. In the verification procedure used here, the diffusion coefficient of D1 is assumed to be 3.0 × 10⁻⁹ m2/s since the applied potential in the test was 30 V, which is larger than that used in the previous work [3] by a factor of three. It is difficult to define the ionic migration in free water for a varying electrical potential, so here D1 is assumed to increase linearly with the applied voltage. The verification results for the anisotropic condition are shown in Figure 11, which shows that the proposed diffusion models with a wedge shape and a roughness factor (p) of 0.1~0.2 are a good match for the experimental test results. The relative error ( R e ) between the simulation result ( D s i m ) and the test result ( D t e s t ) is defined as:
R e ( % ) = | D s i m D t e s t | × 100 D t e s t
The averaged relative errors are 28.6% for the previous parallel shape model, 9.15% for the wedge model, 8.79% for the wedge model with p = 0.1, 13.49% for the wedge model with p = 0.2, and 23.30% for the wedge model with p = 0.3. This confirms that using a wedge shaped crack with suitable roughness provides a reasonably good model for the reduced diffusion of chloride in concrete with cracks.

4.3.2. Isotropic Diffusion Model

It is very difficult to obtain specific crack widths under isotropic conditions. In previous research on this topic [26], concrete specimens subjected to freezing and thawing action were used for verification by considering the weight loss. The crack spacing factor f is derived from Equation (25) under isotropic conditions [3,26]:
Δ V V = A c A m = f 3 ( f 1 ) 3 1
where ΔV and V are the change in volume and the initial volume, respectively, and Ac and Am are the crack area and initial representative concrete area, respectively. The relationship between volume fractile and spacing factor is shown in Figure 12.
In previous research [26], the reference diffusion coefficient (D0) was 9.7 × 10⁻¹³ m2/s, and several crack spacing factors and their related diffusion coefficients were measured. In the verification simulation here, 1.0 × 10⁻⁹ m2/s is used as the diffusion coefficient in the cracked area (D1) since the previous work was performed at a lower potential of 10 V. A comparison between the previous results (test and analysis) and that achieved by the new model proposed here is shown in Figure 13, where Figure 13a,b present the equivalent diffusion coefficient and the relative errors, respectively.
As this comparison shows, the proposed wedge model with 0.1~0.2 of roughness produces the most reasonable results, which are consistent with the equivalent results for the anisotropic model. The averaged relative errors are 159.0% for the previous parallel model, 42.1% for the wedge model, 18.7% for the wedge model with p = 0.1, 6.9% for the wedge model with p = 0.2, and 66.5% for the wedge model with p = 0.3. The changes in the relative errors are shown in Figure 14; the shaded area in blue indicates the roughness range of 0.1~0.2.

5. Conclusions

This paper has presented a new, simple model for chloride diffusion in cracked REV that can be applied under both anisotropic and isotropic conditions. Previous models have been based on a rectangular crack shape; the proposed model achieves improved results by also considering the crack shape and roughness. In the experimental verification test carried out for chloride diffusion under steady-state conditions, the equivalent diffusion coefficient linearly increased with crack width. When the crack width reached 0.4 mm, the ratio of the diffusion coefficient had increased by 2.0–2.5 in sound concrete. The proposed model is confirmed to have reasonable applicability for a wedge-shaped crack with 0.1–0.2 factor of roughness. So far, the proposed model has only been verified for concrete with OPC. Further work is required to determine whether these results also apply to HPC with GGBFS or FA, as the effect of cracks on REV may differ. To extend the application of the new model, further tests on HPC with various mineral admixtures are needed.

Acknowledgments

This research was supported by the Basic Science Research Program through the National Research Foundation of Korea (NRF), funded by the Ministry of Science, ICT & Future Planning (No. 2015R1A5A1037548). This research was also supported by a grant (16SCIP-B103706-02) from Construction Technology Research Program funded by Ministry of Land, Infrastructure and Transport of Korean government.

Author Contributions

Yang performed the evaluation of chloride diffusion behavior and played an important role in modeling the 1-D conditions. Singh and Lee investigated the previous research in this area and participated in the test for RCPT. Kwon organized and planned the research and the test procedures, and conducted the verification for chloride penetration under 2-D intrusion conditions.

Conflicts of Interest

The authors declare no conflicts of interest.

References

  1. Park, S.S.; Kwon, S.J.; Jung, S.H. Analysis technique for chloride penetration in cracked concrete using equivalent diffusion and permeation. Const. Build. Mater. 2012, 29, 183–192. [Google Scholar] [CrossRef]
  2. Kwon, S.J.; Na, U.J.; Park, S.S.; Jung, S.H. Service life prediction of concrete wharves with early-aged crack: Probabilistic approach for chloride diffusion. Struct. Safe 2009, 31, 75–83. [Google Scholar] [CrossRef]
  3. Gerard, B.; Marchand, J. Influence of cracking on the diffusion properties of cement-based materials Part I: Influence of continuous cracks on the steady-state regime. Cem. Concr. Res. 2000, 30, 37–43. [Google Scholar] [CrossRef]
  4. Park, S.S.; Kwon, S.J.; Jung, S.H.; Lee, S.W. Modeling of water permeability in early aged concrete with cracks based on micro pore structure. Const. Build. Mater. 2012, 27, 597–604. [Google Scholar] [CrossRef]
  5. Thomas, M.D.A.; Bamforth, P.B. Modeling chloride diffusion in concrete: Effect of fly ash and slag. Cem. Concr. Res. 1999, 29, 487–495. [Google Scholar] [CrossRef]
  6. Saraswathy, V.; Muralidharan, S.; Thangavel, K.; Srinivasan, S. Influence of activated fly ash on corrosion resistance and strength of concrete. Cem. Concr. Compos. 2003, 25, 673–680. [Google Scholar] [CrossRef]
  7. Elfmaekova, V.; Spiesz, P.; Brouwers, H.J.H. Determination of the chloride diffusion coefficient in blended cement mortars. Cem. Concr. Res. 2015, 78, 190–1999. [Google Scholar] [CrossRef]
  8. Yoo, S.W.; Kwon, S.J. Effects of cold joint and loading conditions on chloride diffusion in concrete containing GGBFS. Const. Build. Mater. 2016, 115, 247–255. [Google Scholar] [CrossRef]
  9. Chen, J.W.; Fu, C.; Jin, N. Prediction of chloride binding isotherm for blended cement. Comput. Concr. 2016, 17, 655–672. [Google Scholar]
  10. Yoon, L.S.; Nam, J.W. New experiment recipe for chloride penetration in concrete under water pressure. Comput. Concr. 2016, 17, 189–199. [Google Scholar] [CrossRef]
  11. Song, Z.; Jiang, L.; Zhang, Z. Chloride diffusion in concrete associated with single, dual and multi cation types. Comput. Concr. 2016, 17, 53–66. [Google Scholar] [CrossRef]
  12. Song, H.W.; Cho, H.J.; Park, S.S.; Byun, K.J.; Maekawa, K. Early-age cracking resistance evaluation of concrete structure. Concr. Sci. Eng. 2001, 3, 62–72. [Google Scholar]
  13. Win, P.P.; Watanabe, M.; Machida, A. Penetration profile of chloride ion in cracked reinforced concrete. Cem. Concr. Res. 2004, 34, 1073–1079. [Google Scholar] [CrossRef]
  14. JSCE-Concrete Committee. Standard Specification for Concrete Structures; JSCE-Concrete Committee: Tokyo, Japan, 2007. [Google Scholar]
  15. Song, H.W.; Kwon, S.J.; Byun, K.J.; Park, C.K. Predicting carbonation in early-aged cracked concrete. Cem. Concr. Res. 2006, 36, 979–989. [Google Scholar] [CrossRef]
  16. Yokozeki, K.; Okada, K.; Tsutsumi, T.; Watanabe, K. Prediction of the service life of RC with crack exposed to chloride attack. Jpn. Symp. Rehabil. Concr. Struct. 1998, 10, 1–6. [Google Scholar]
  17. Pang, L.; Li, Q. Service life prediction of RC structures in marine environment using long term chloride ingress data: Comparison between exposure trials and real structure surveys. Const. Build. Mater. 2016, 113, 979–987. [Google Scholar] [CrossRef]
  18. Ishida, T.; Iqbal, P.O.; Anh, H.T.L. Modeling of chloride diffusivity coupled with non-linear binding capacity in cound and cracked concrete. Cem. Concr. Res. 2009, 39, 913–923. [Google Scholar] [CrossRef]
  19. Iqbal, P.O.; Ishida, T. Modeling of chloride transport coupled with enhanced moisture conductivity in concrete exposed to marine environment. Cem. Concr. Res. 2009, 39, 329–339. [Google Scholar] [CrossRef]
  20. Ishida, T.; Luan, Y.; Sagawa, T.; Nawa, T. Modeling of early age behavior of blast furnace slag concrete based on micro-physical properties. Cem. Concr. Res. 2011, 41, 1357–1367. [Google Scholar] [CrossRef]
  21. Maekawa, K.; Ishida, T.; Kishi, T. Multi-Scale modeling of concrete performance. J. Adv. Conc. Tech. 2003, 1, 91–126. [Google Scholar] [CrossRef]
  22. Maekawa, K.; Ishida, T.; Kishi, T. Multi-scale modeling of structural performance. Taylor Fr. 2009, 322–325. [Google Scholar]
  23. Korea Concrete Institute. Concrete Standard Specification-Durability Part; Korea Concrete Institute: Seoul, Korea, 2009. [Google Scholar]
  24. Andrade, C. Calculation of chloride diffusion coefficients in concrete from ionic migration measurement. Cem. Concr. Res. 1993, 23, 724–742. [Google Scholar] [CrossRef]
  25. Song, H.W.; Kim, H.J.; Lee, S.J.; Byun, K.J.; Park, C.K. Prediction of service life in cracked reinforced concrete structures subjected to chloride arrack and carbonation. In Proceedings of the 6th International Congress Global Construction: Ultimate Concrete Opportunities, Dundee, Scotland, 5–7 July 2005; pp. 767–776.
  26. Jacobsen, S.; Marchand, J.; Boisvert, L. Effect of cracking and healing on chloride transport in OPC concrete. Cem. Concr. Res. 1996, 26, 869–881. [Google Scholar] [CrossRef]
Figure 1. Chloride diffusion in the steady-state condition through cracked concrete.
Sustainability 09 00282 g001
Figure 2. Modified representative element volume (REV) with crack and roughness (isotropic and anisotropic model).
Sustainability 09 00282 g002
Figure 3. Compressive strength and elasticity with time.
Sustainability 09 00282 g003
Figure 4. The crack induction procedure and the resulting crack pattern.
Sustainability 09 00282 g004
Figure 5. Test setup showing four diffusion cells in the steady-state condition.
Sustainability 09 00282 g005
Figure 6. Diffusion coefficients with increasing crack width (steady-state condition).
Sustainability 09 00282 g006
Figure 7. Simulation results with varying roughness: (a) anisotropic condition; and (b) isotropic condition.
Sustainability 09 00282 g007
Figure 8. Diffusion ratio of isotropic to anisotropic conditions with changing p and f.
Sustainability 09 00282 g008
Figure 9. Simulation results for varying the reference diffusion coefficient: (a) anisotropic condition; and (b) isotropic condition.
Sustainability 09 00282 g009
Figure 10. Diffusion ratio of isotropic to anisotropic condition with changing reference diffusion coefficient.
Sustainability 09 00282 g010
Figure 11. (a) Equivalent diffusion coefficient and (b) relative errors (anisotropic condition).
Sustainability 09 00282 g011
Figure 12. Volume fractile and crack spacing factor.
Sustainability 09 00282 g012
Figure 13. (a) Equivalent diffusion coefficient and (b) relative errors (isotropic condition).
Sustainability 09 00282 g013
Figure 14. Roughness factor and relative errors (average).
Sustainability 09 00282 g014
Table 1. Mix proportions for concrete samples.
w/cS/a (%)Gmax (mm)Unit Mass (kg/m3)Chemical Ad (mL)
WCSGAE 1WRA 2
0.4444.525179.0406.9787.8982.917.31951.0
1 Air Entrainer; 2 Water Reducing Agent.
Table 2. Chemical and physical properties of ordinary Portland cement (OPC).
ItemChemical Composition (%)Physical Properties
TypeSiO2Al2O3Fe2O3CaOMgOSO3Ig. LossSpecific Gravity (g/cm3)Blaine (cm2/g)
OPC21.965.273.4463.412.131.960.793.163214
Table 3. Properties of the aggregate materials used.
ItemGmax (mm)Specific Gravity (g/cm3)Absorption (%)Fineness Modulus
Type
Fine aggregate-2.561.082.82
Coarse aggregate252.630.816.81
Table 4. Equivalent diffusion coefficients in cracked representative element volume (REV) samples.
Measured Crack Width (mm)Diffusion Coefficient (m2/s)Measured Crack Width (mm)Diffusion Coefficient (m2/s)
05.80 × 10−120.147.66 × 10−12
05.42 × 10−120.167.29 × 10−12
05.22 × 10−120.177.48 × 10−12
0.065.95 × 10−120.178.51 × 10−12
0.066.52 × 10−120.191.02 × 10−11
0.087.45 × 10−120.228.58 × 10−12
0.18.04 × 10−120.249.11 × 10−12
0.116.38 × 10−120.321.23 × 10−11
0.117.55 × 10−120.361.38 × 10−11
0.137.48 × 10−120.391.05 × 10−11

