Article

Decomposition Analysis of Carbon Emission Factors from Energy Consumption in Guangdong Province from 1990 to 2014

1
Xinjiang Laboratory of Lake Environment and Resources in Arid Zone, School of Geography Science and Tourism, Xinjiang Normal University, Urumqi 830054, China
2
Guangdong Open Laboratory of Geospatial Information Technology and Application, Guangzhou Institute of Geography, Guangzhou 510070, China
3
School of Geographical Science, Nanjing Normal University, Nanjing 210046, China
*
Authors to whom correspondence should be addressed.
Sustainability 2017, 9(2), 274; https://doi.org/10.3390/su9020274
Submission received: 19 January 2017 / Revised: 8 February 2017 / Accepted: 12 February 2017 / Published: 15 February 2017

Abstract

:
Carbon emissions research based on regional perspective is necessary and helpful for China to achieve its reduction targets. This research aims at analyzing the energy-related carbon emissions and finding out the most important driving forces for the carbon emissions increments in Guangdong province. LMDI (Logarithmic Mean Divisia Index) method based on the extended Kaya identity has been used to explore the main driving factors for energy-related carbon emissions in Guangdong province annually between 1990 and 2014. Research results show that the impacts and influences of various factors on carbon emissions are different in the different development stages. Economic growth effect and population size effect are the two most important driving factors for the increased carbon emissions. Energy intensity effect played the dominant role in curbing carbon emissions. Energy structure effect and technical progress effect had different but relatively minor effects on carbon emissions during the five different development stages.

1. Introduction

Controlling greenhouse gas emissions and curbing global warming have become priorities in developing strategies for a sustainable future [1,2,3,4,5,6,7]. China has become the world’s largest carbon source after decades of rapid economic growth [8,9,10]. The carbon emissions problem is now receiving the extensive and sustained interest of government policy makers, industrial manufacturers, and researchers [11,12,13,14,15]. This is due to the pressure of public opinion from international climate negotiations, but also due to the need to reduce and conserve domestic energy consumption in relation to resource and environmental constraints. Under these circumstances, China announced a binding mitigation target, namely to achieve peak carbon emissions prior to 2030 [16,17]. The 13th Five-Year Plan (2016–2020) of China proposed that the consumption of non-fossil fuel energy resources should be 15% of the total primary energy consumption, thus the per unit GDP energy consumption and per unit carbon dioxide emission should be reduced by 15% and 18% in 2020 compared with the 2015 level, respectively. The importance and urgency of carbon emission research is becoming increasingly evident in the light of concerns about whether promises to mitigate carbon emissions could be fulfilled with binding force, and at the same time maintain stable development of the social economy. Wei et al. used an extended Slacks-Based Measure (SBM) model to identify how much carbon emissions reduction burden will be allocated for each province after the Copenhagen conference [18]. Yang et al. developed an allocation model to allocate the national carbon intensity reduction target among 35 industrial sectors based on equity and efficiency principle, aiming to establish a unified national carbon trading market [19]. Therefore, in-depth studies on the factors driving energy-related carbon emissions need to be performed for China, especially at the regional and provincial levels [20,21,22,23]. This is required because there are profound differences in resource endowment, economic structure, development models, residential lifestyles, consumption levels, and available technology across the different provinces within China [24,25,26,27].
Guangdong province is a developed region in the east of China. GDP of Guangdong increased from 155.90 billion Yuan in 1990 to 6780.99 billion Yuan in 2014, making Guangdong the most developed province in China. Along with the rapid economic development, total energy consumption of Guangdong has increased from 36.90 million tons of coal equivalent (tce) in 1990 to 256.36 million tons of coal equivalent (tce) in 2014. In addition, Guangdong province is an important manufacturing base as well as a pilot zone for low-carbon development. Therefore, Guangdong province may serve as a demonstration of how to complete the targets of energy conservation and carbon emission reduction, thereby highlighting the representativeness of Guangdong province and the importance of studying its influence factors of carbon emissions in detail.
Index decomposition analysis (IDA) and structural decomposition analysis (SDA) are the most commonly applied research methods for the scientific evaluation and quantitative analysis of factors influencing carbon emissions [28,29,30,31,32,33,34,35]. The IDA model employs any available data at any aggregation level to analyze how changes in various factors in a period-wise or time-series manner, including demography, economy, and structural factors, have a direct effect on the generation of carbon emissions [36,37]. The advantages of IDA model made it been applied successfully so far [38,39,40]. LMDI method was then introduced and refined by Ang [41,42,43], which was known as the perfect decomposition technique in IDA [44]. By using the LMDI method, Wang et al. studied the changes of increased carbon emissions in China during 1957–2000 [45]. Wu et al. focused on the stagnancy of carbon emissions in China during 1996–1999 [46]. Zhang et al. decomposed the changes of China’s carbon emissions and its intensity from 1996 to 2010 based on the energy structure and industrial structure perspective, respectively [47]. Economic growth effect was confirmed as the most important driving factor for China’s carbon emissions increments, while the energy efficiency and energy structure effects were highlighted for curbing carbon emissions. Wang et al. [26] used the LMDI method to decompose the changes of carbon emissions in Shandong province from 1995 to 2011, and demonstrated that rapid economic growth and coal based energy consumption structure played strong driving effects on carbon emissions. Wang et al. applied the LMDI method to decompose the changes of carbon emissions in Xinjiang province from 1952 to 2010, and decomposition results show that economic growth and population size were the two most important contributors to carbon emission increments [48]. Wang et al. [49] found that slowing and maintaining healthy growth rates of economy and population could effectively control the total carbon emission in Suzhou city by using the LMDI method. Kang et al. [50] performed the LMDI method to disentangle the carbon emissions in Tianjin city from 2001 to 2009, and the decomposition results showed that economic growth was the most important factor driving the emissions growth, while energy efficiency gains were primarily responsible for the decrease in emissions. Therefore, a thorough and wide-ranging study of the factors impacting carbon emissions at the provincial level even city level is urgently required, to enable regional contributions to be made towards the fulfilment of carbon reduction pledges at the national level.
The contribution and innovation of our study compared with other references mainly lies in the following two aspects. Firstly, the Kaya-decomposition method used in this study was improved. Secondly, influencing factors affecting carbon emissions with comparative analysis of different development stages may have different conclusions. It was aimed to provide theoretical references for making more targeted policies on “energy saving and emission reduction” in Guangdong.

2. Data Management and Research Method

2.1. Data Management

Data resources include the economic and population growth, and total energy consumption covers the period from 1990 to 2014 are all available. Economic and population data were collected from various issues of Guangdong Statistical Yearbook (GSY, 1990–2015) [51,52,53,54,55,56,57,58,59,60,61,62,63,64,65,66,67,68,69,70,71,72,73,74,75,76], China Statistical Yearbook (CSY, 1990–2015) [77,78,79,80,81,82,83,84,85,86,87,88,89,90,91,92,93,94,95,96,97,98,99,100,101,102]. Economic data were measured by gross domestic product (GDP) in million yuan in time series from 1990 to 2014. Energy data were collected from a series of Guangdong Statistical Yearbook (GSY, 1990–2015) [51,52,53,54,55,56,57,58,59,60,61,62,63,64,65,66,67,68,69,70,71,72,73,74,75,76], and China Energy Statistical Yearbook (CESY, 1990–2015) [103,104,105,106,107,108,109,110,111,112,113,114,115,116,117,118,119,120,121,122,123,124,125,126,127,128], which were compiled by the National and Provincial Bureau of Statistics of China and Guangdong.

2.2. Estimation of Energy-Related Carbon Emissions

Energy-related carbon emissions were calculated according to the IPCC Guidelines for National Greenhouse Gas Inventories [26,48], computational formula are as follows:
C t = i E t i × L C V i × C F t i × O i
In Equation (1), the subscript i is the various fuels in our study, the subscript t represents the time in years, C t on the left in Equation (1) represents total energy-related carbon emissions in year t (in million tons, Mt), E t i on the right in Equation (1) represents the total energy consumption including the various fuels in year t ; L C V i , C F t i and O i represent the lower calorific value, the carbon emissions factors, and the oxidation rate of fuel type i , respectively.

2.3. Analysis along Kaya Factors

Kaya identity [2,129,130,131,132] expressed carbon emissions as a result of four relevant influencing factors:
C = P × ( G P ) × ( E G ) × ( C E )
In Equation (2), P represents the total population size, G represents the gross domestic product (GDP), E represents the total energy consumption; G P represents the per capita GDP, E G represents the energy consumption intensity and C E represents the energy carbon intensity.

2.4. Extended Kaya-Decomposition for Carbon Emissions

C = P × ( G P ) × ( E G ) × ( F E E ) × ( C F E ) = p g e s f
In Equation (3), P , G , and E have the same definitions as in Equation (2), F E represents the fossil fuel energy consumption. The variables are defined as follows:
  • C , total carbon emissions from all fossil fuels energy consumption
  • P , population
  • G , gross domestic product (GDP)
  • F E , total fossil energy consumption including coal, oil, and natural gas
  • E , total energy consumption including F E and renewable energy
  • p = P , represents the total population size
  • g = G P , represents the per capita GDP
  • e = E G , represents the energy consumption intensity
  • s = F E E , represents the share of fossil energy consumption in total energy consumption
  • f = C F E , represents the energy carbon intensity

2.5. Logarithmic Mean Divisia Index

LMDI method based on an extended Kaya identity was then applied as the method to decompose function (3) [38,133,134].
From Equation (3), changes of the emission levels between two years can be further decomposed as:
Δ C = C t C 0 = Δ C p e f f e c t + Δ C g e f f e c t + Δ C e e f f e c t + Δ C s e f f e c t + Δ C f e f f e c t
In Equation (4), Δ C on the left represents the difference of carbon emissions between a base year 0 and a target year t . Δ C can be further decomposed to five influencing factors as follows: Δ C p e f f e c t represents the population size effect, Δ C g e f f e c t represents the economic growth effect, Δ C e e f f e c t represents the energy intensity effect, Δ C s e f f e c t represents the energy structure effect, and Δ C f e f f e c t represents the technical progress effect, respectively.
Δ C p e f f e c t = C t C 0 ln C t ln C 0 ln ( p t p 0 )
Δ C g e f f e c t = C t C 0 ln C t ln C 0 ln ( g t g 0 )
Δ C e e f f e c t = C t C 0 ln C t ln C 0 ln ( e t e 0 )
Δ C s e f f e c t = C t C 0 ln C t ln C 0 ln ( s t s 0 )
Δ C f e f f e c t = C t C 0 ln C t ln C 0 ln ( f t f 0 )

3. Empirical Analyses in Guangdong Province

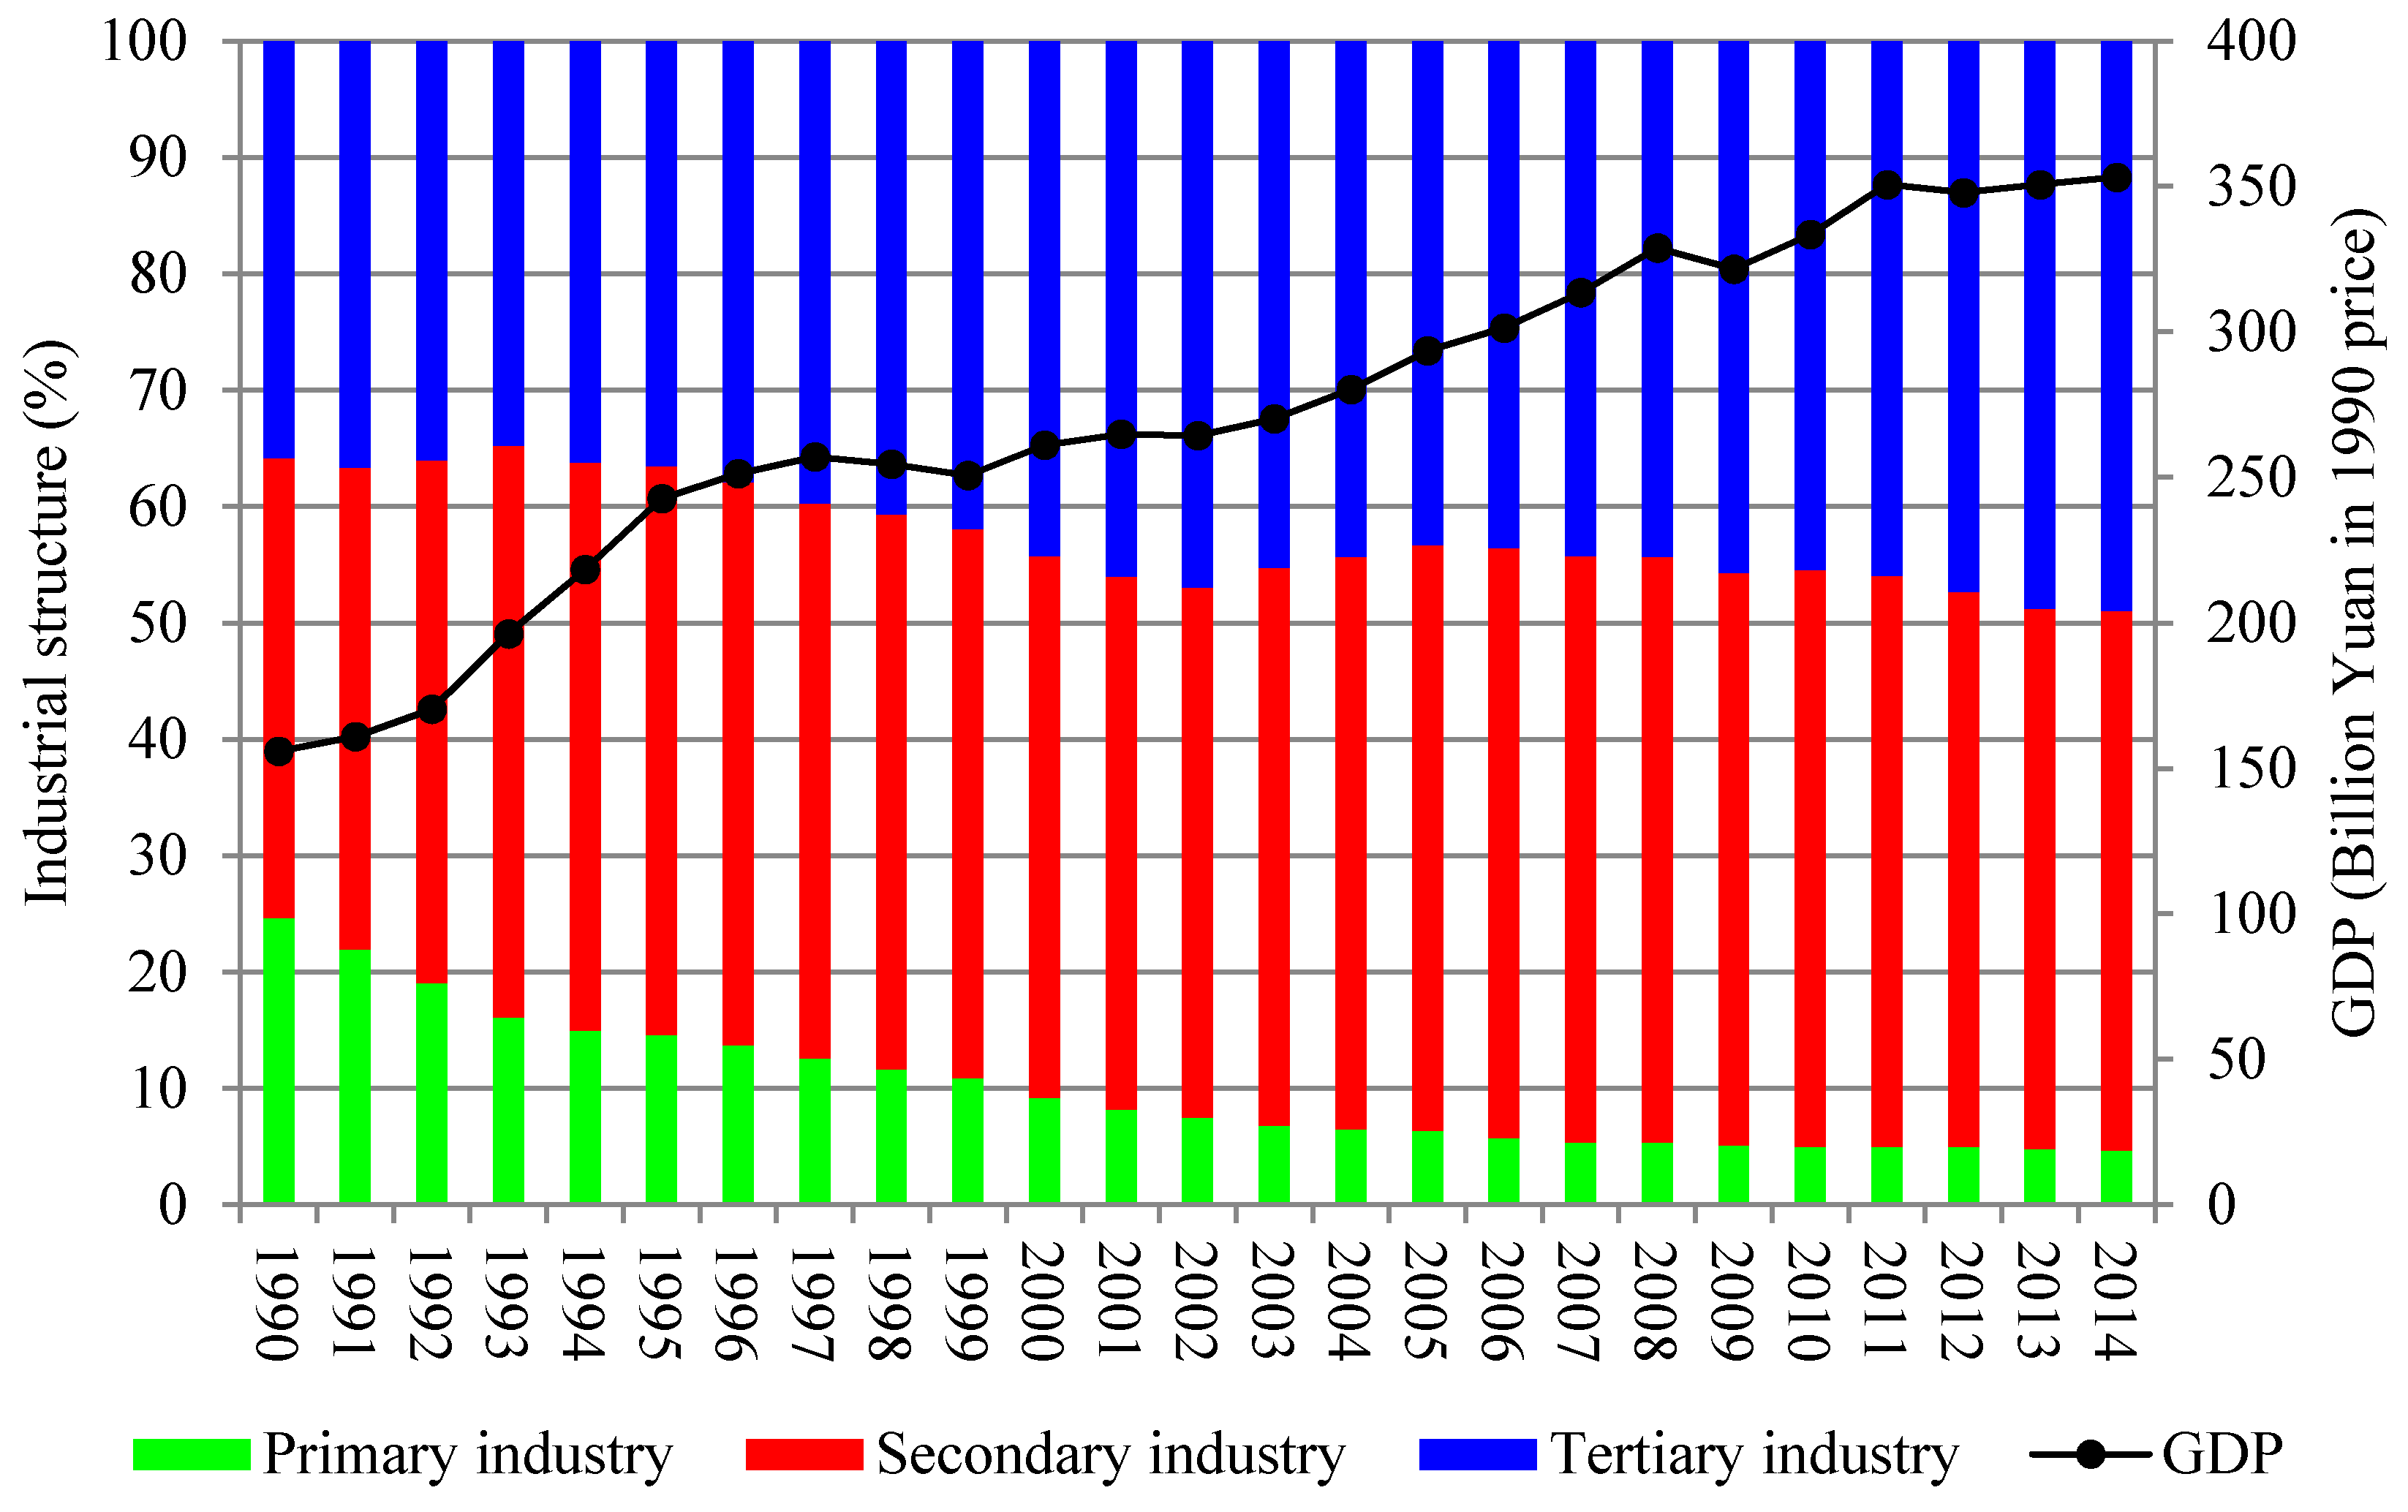
3.1. Economic Growth and Economic Structure in Guangdong Province

Economic growth in Guangdong province was described with the GDP (Figure 1), and the GDP data was converted into the 1990 constant prices in order to avoid the inflation impact. The economy scale in Guangdong province has increased from 155.90 billion Yuan in 1990 to 353.18 billion Yuan in 2014. Changes of industrial structure from 1990 to 2014 in Guangdong province were also shown in Figure 2. The shares of primary industries performed an obvious decrease from 24.66% in 1990 to 4.67% in 2014. At the same time, the shares of secondary industries and tertiary industries performed an increase tendency, from 39.50% in 1990 to 46.34% in 2014 and from 35.84% in 1990 to 48.99% in 2014, respectively.

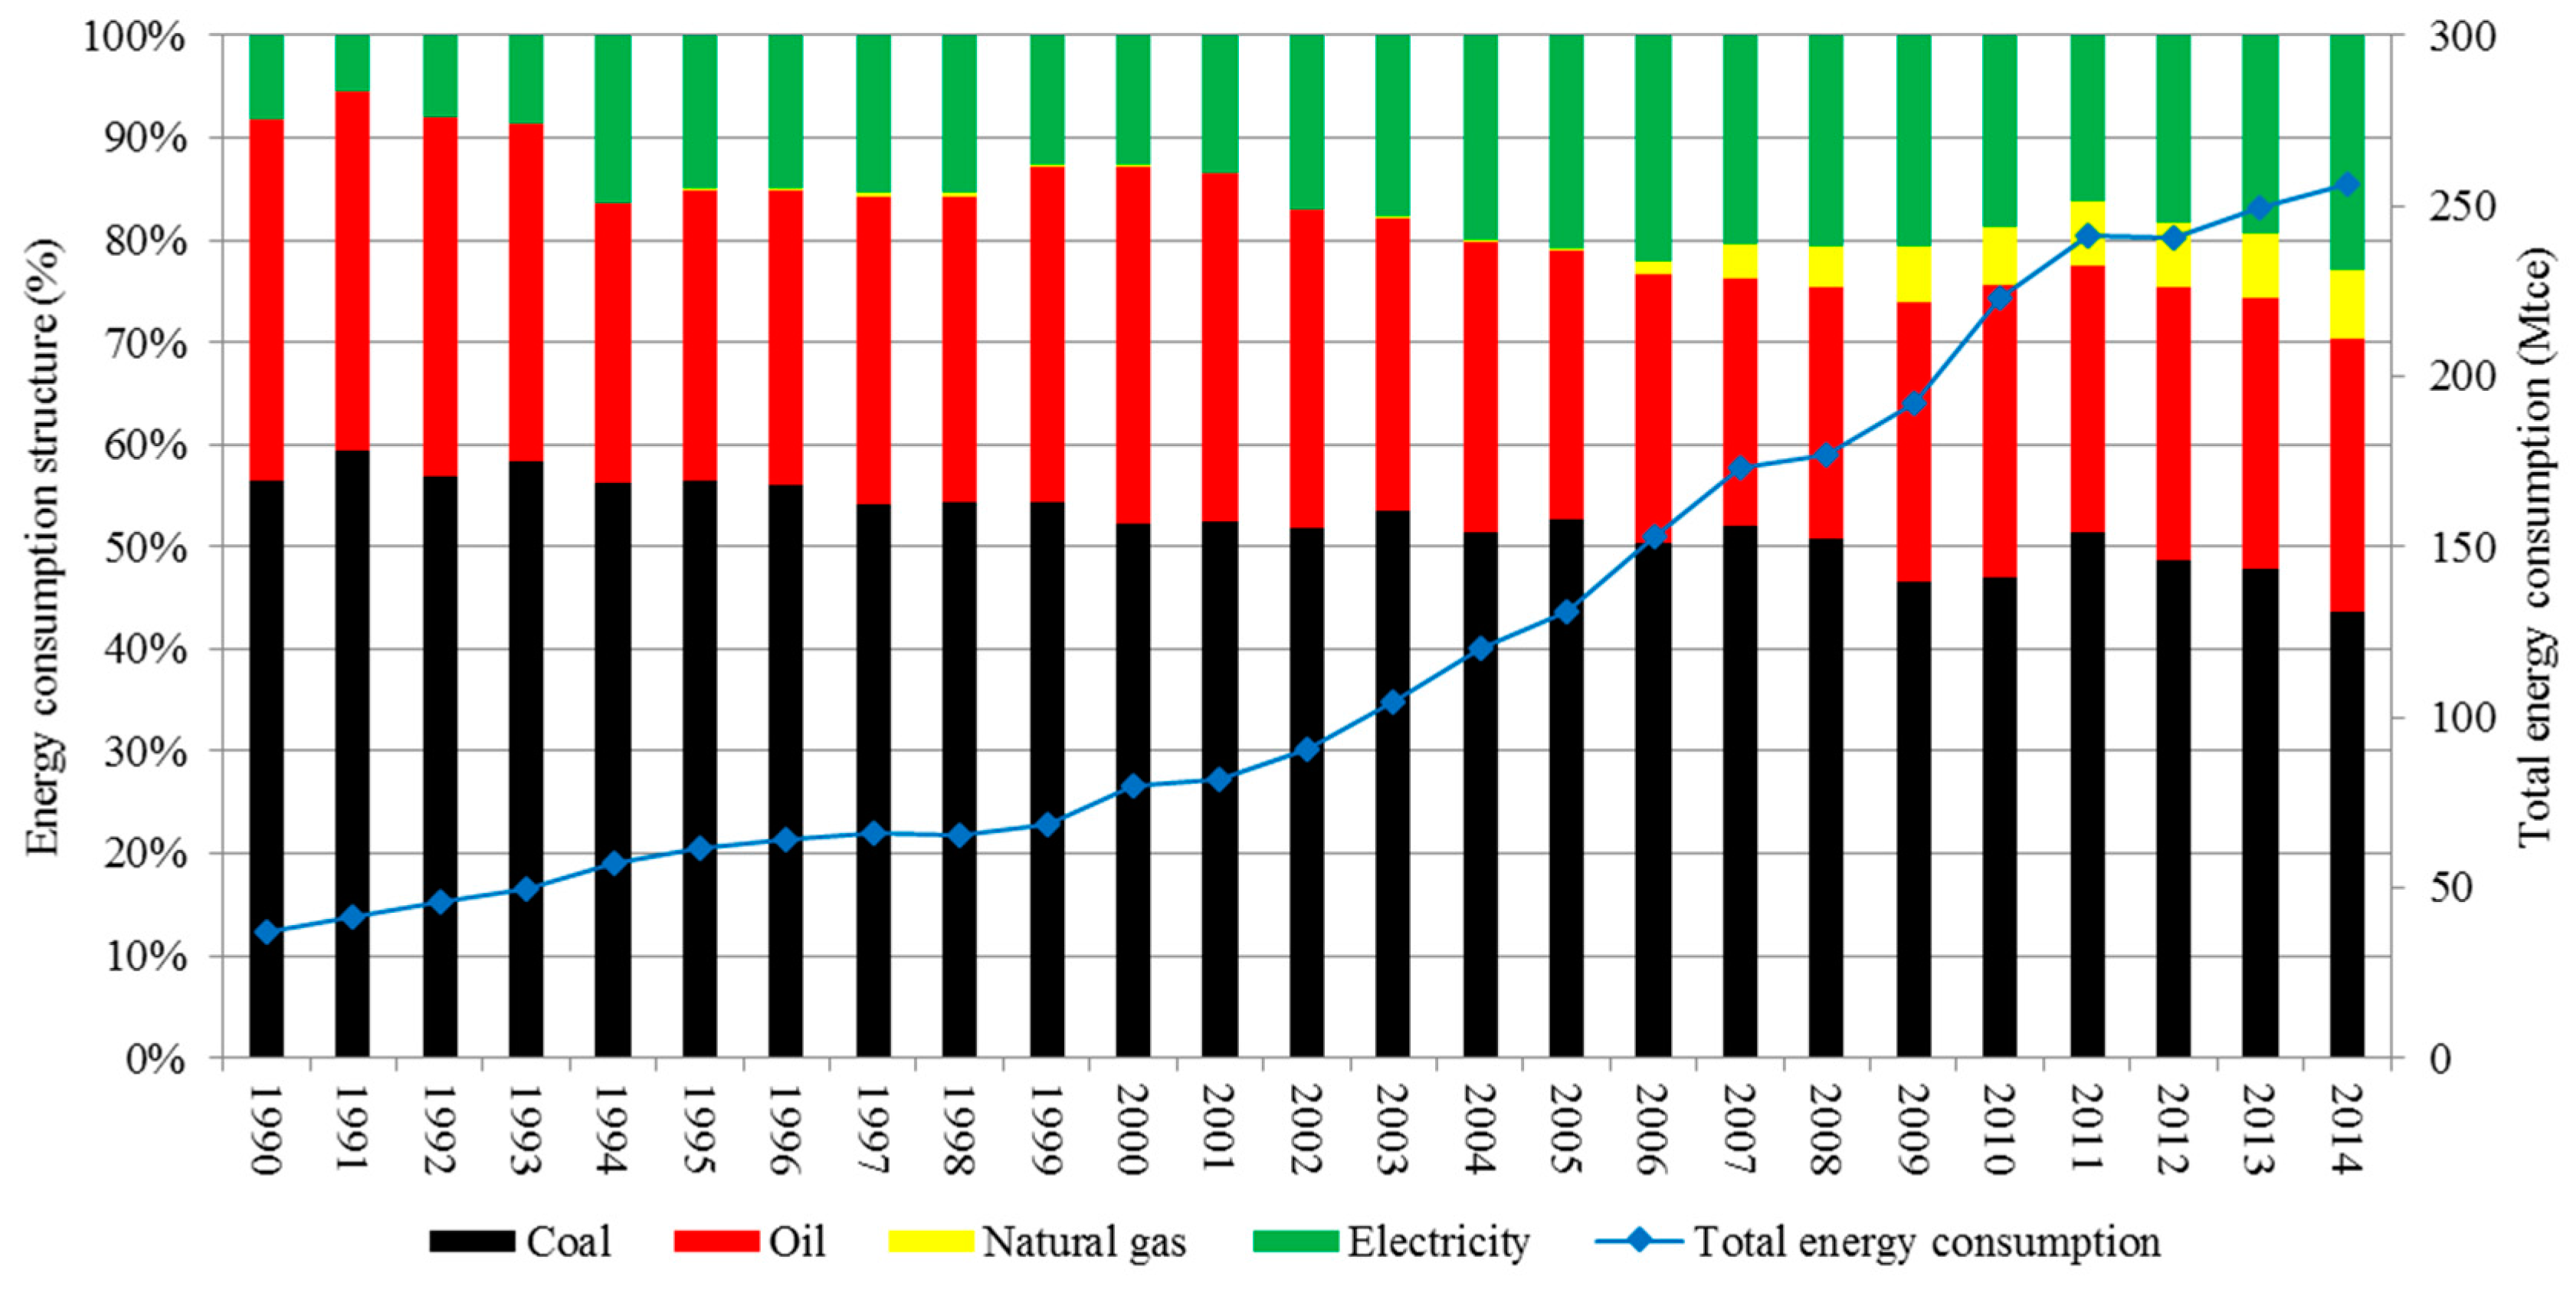
3.2. Total Energy Consumption and Energy Consumption Structure in Guangdong Province

As indicated in Figure 2, overall primary energy consumption in Guangdong province has been steadily increasing. Coal consumption increased from 36.90 million tons of coal equivalent (tce) in 1990 to 256.36 million tce in 2014, showing a 5.95-fold increase over a period of 24 years. The eighth Five-Year Plan was implemented between 1990 and 1995, and China’s eastern coastal regions experienced rapid economic growth, especially the Guangdong province. GDP grew by 19.64% and primary energy consumption increased by 10.75% annually. During the period of the ninth Five-Year Plan (1996–2000), the growth of the opening economy in Guangdong significantly slowed due to the Asian financial crisis in 1997. As a result, average annual GDP growth was 11.96%, which caused the average annual growth rate of primary energy consumption to decrease to 5.74%. Accordingly, primary energy consumption decreased from 65.87 million tce in 1997 to 65.70 million tce in 1998. During the period of the tenth Five-Year Plan (2001–2005), China joined the World Trade Organization (WTO), and the foreign trade economy in Guangdong province developed rapidly. The average annual GDP growth rate was 13.63%, while that of primary energy consumption was 12.50%. During the period of the eleventh Five-Year Plan (2006–2010), the “Four Trillion Yuan Stimulus Plan” after 2008 enabled the economic development of Guangdong to maintain its growth rate, despite the impact of the U.S. subprime mortgage crisis. The average annual GDP growth rate was 12.69%, while the average annual growth rate of primary energy consumption was 9.93%. During the period of the twelfth Five-Year Plan (2011–2014), economic development in Guangdong significantly decreased due to global economic recovery and national macroeconomic conditions. Consequently, the average annual GDP growth rate declined to 8.08%. As this reduction in the rate of economic growth led to a decrease in energy consumption demand, the annual average growth rate of primary energy consumption was only 3.09%. Specifically, total energy consumption decreased from 241.31 million tce in 2011 to 240.81 million tce in 2012.
Between 1990 and 2014, the energy consumption structure of Guangdong province was dominated by coal. The percentage of coal consumption decreased from 56.5% in 1990 to 43.7% in 2014. The percentage of oil consumption showed an overall decrease, from 35.3% in 1990 to 26.6% in 2014. On the other hand, the percentage of electricity consumption showed an increasing trend overall, from 8.2% in 1990 to 22.9% in 2014. The proportion of natural gas consumption was relatively small, and increased from 0.2% in 1995 to 6.8% in 2014.

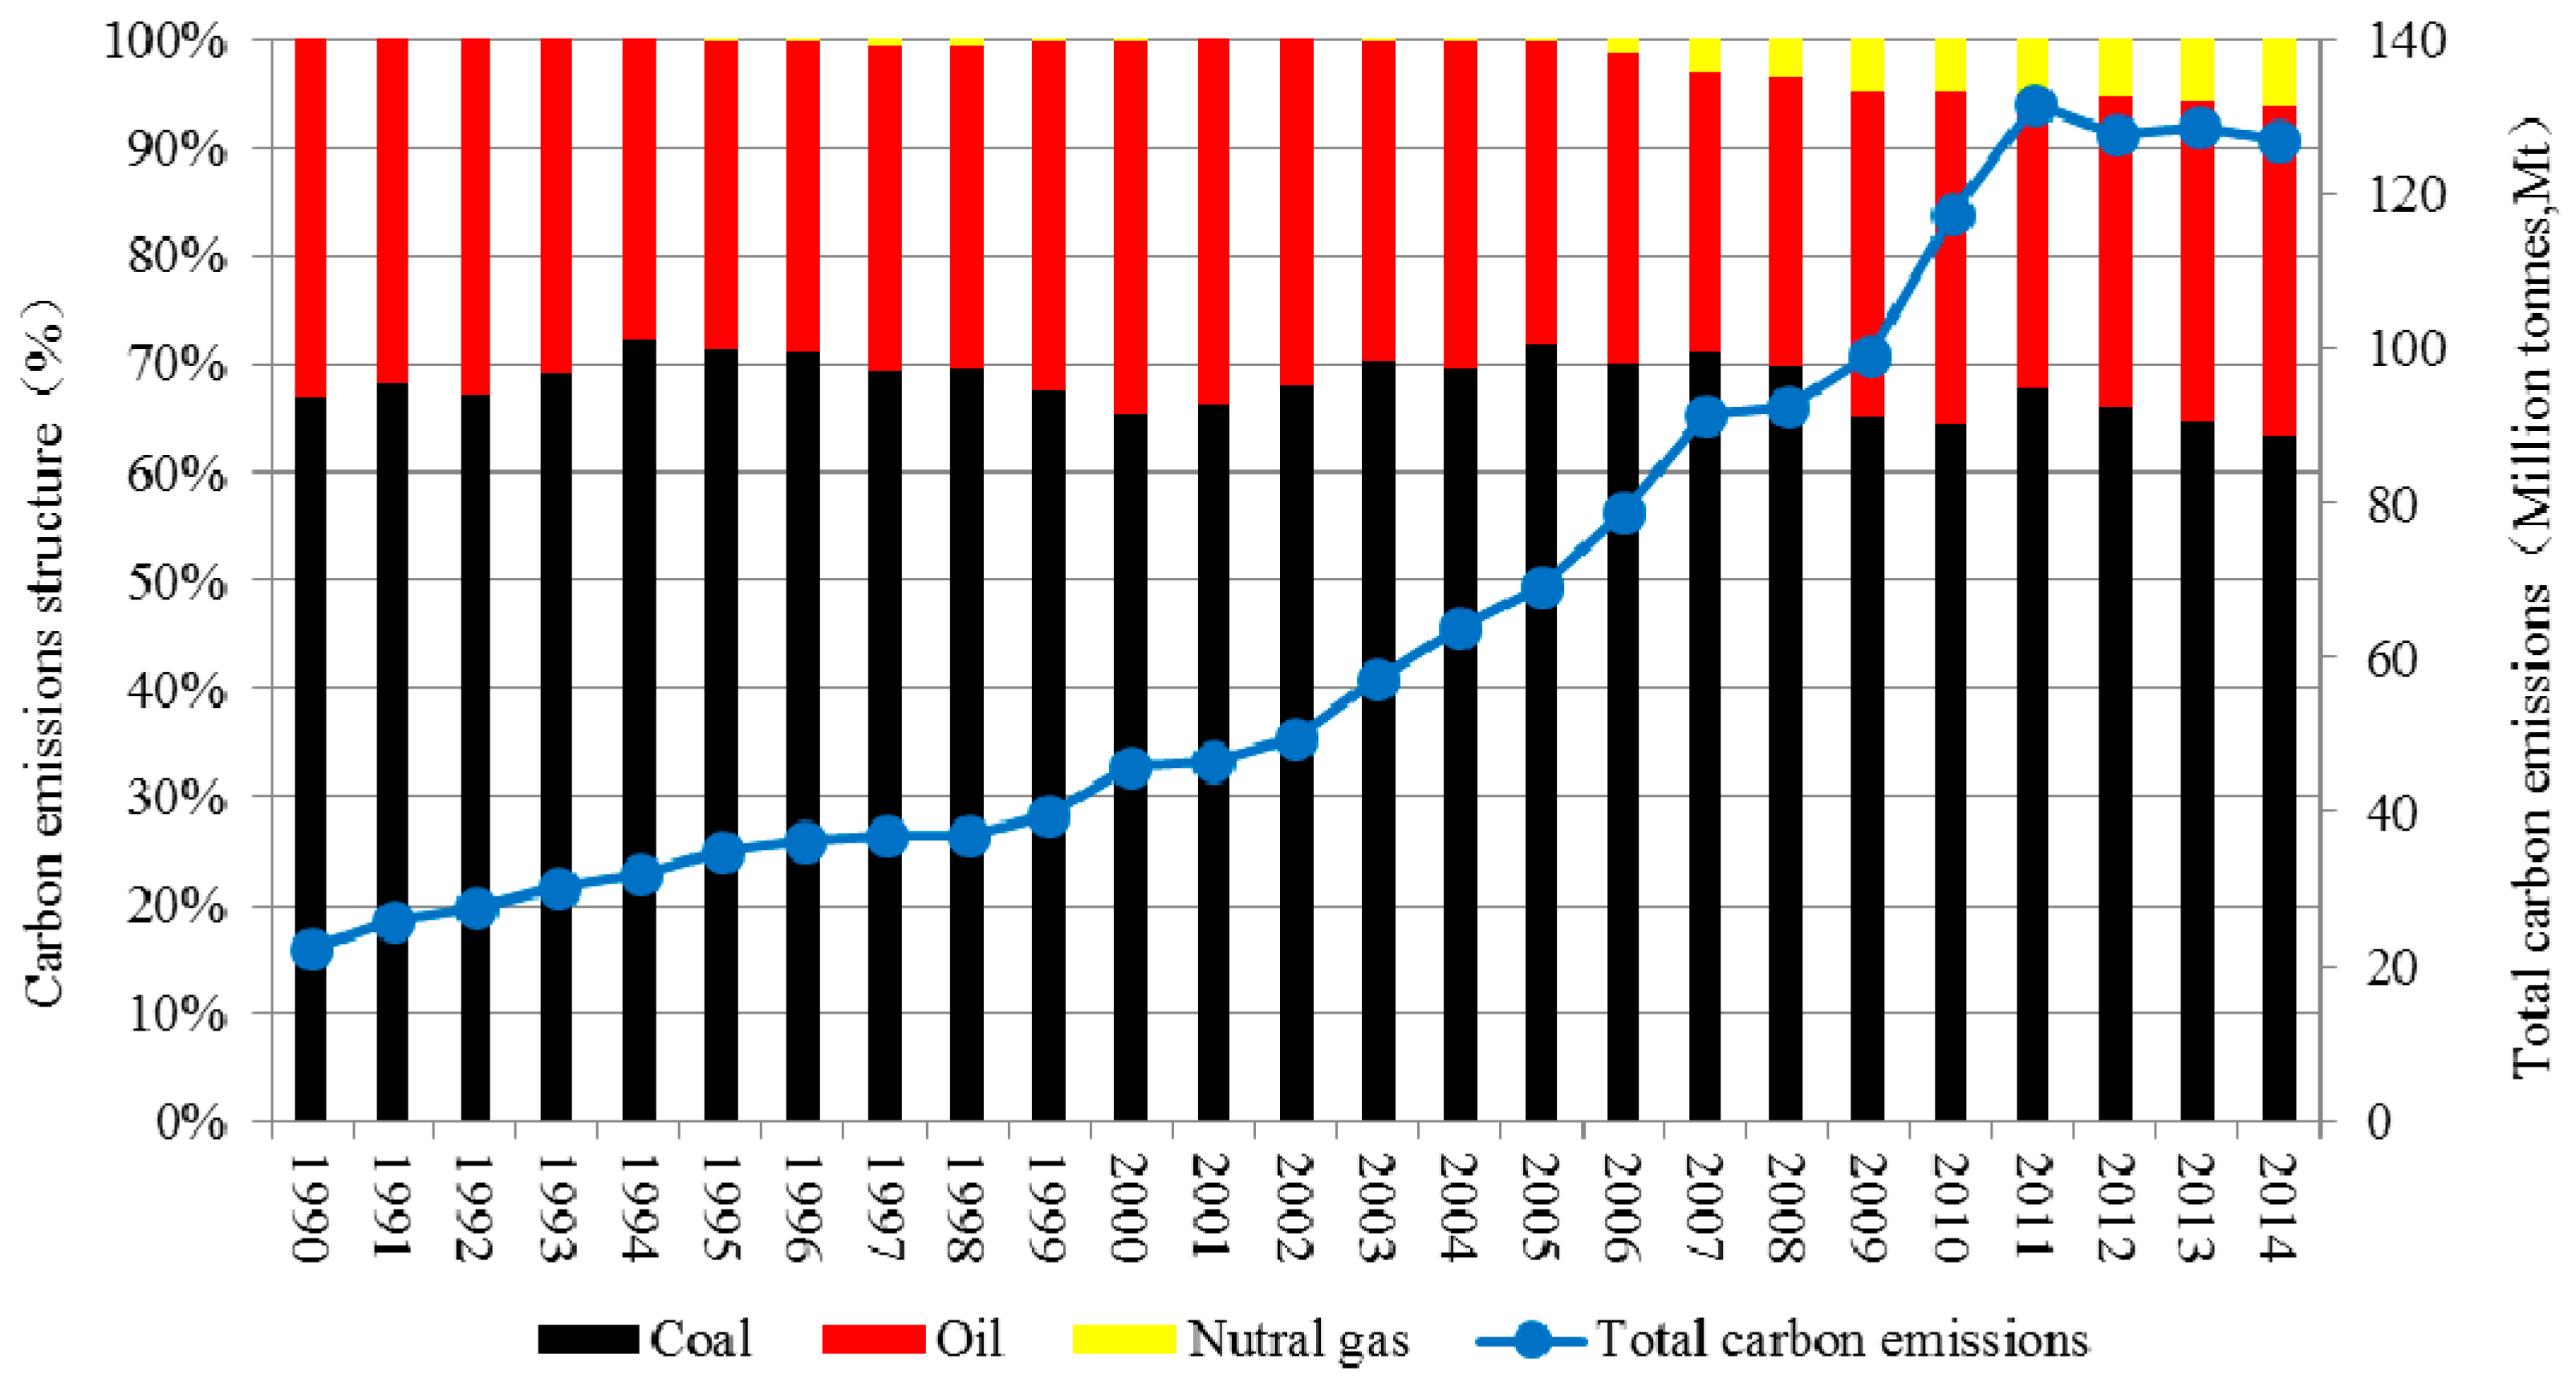
3.3. Total Carbon Emissions and Carbon Emission Structure in Guangdong Province

Based on the results of carbon emission accounting using Equation (1), carbon emissions from primary energy consumption in Guangdong province showed an overall increase during the period between 1990 and 2014. Emissions increased from 22.40 million tons in 1990 to 127.10 million tons in 2014 (Figure 3). Two periods (1990 to 1995 and 1996 to 2000) saw a modest increase in carbon emissions from primary energy consumption in Guangdong. Annual growth rates were 9.31% and 6.11%, respectively. From 2001 to 2005 and 2006 to 2010, carbon emissions from primary energy consumption in Guangdong increased rapidly; annual growth rates were 10.40% and 10.38%, respectively. The growth rate for 2011 to 2014 showed a fluctuating and decreasing trend. Carbon emissions decreased from 131.86 million tons in 2011 to 127.10 million tons in 2014.
Between 1990 and 2014, coal consumption was the primary source of carbon emissions. Carbon emissions due to coal consumption increased from 15.01 million tons in 1990 to 80.66 million tons in 2014. Coal consumption is the biggest contributor to the total carbon emissions increase in Guangdong.

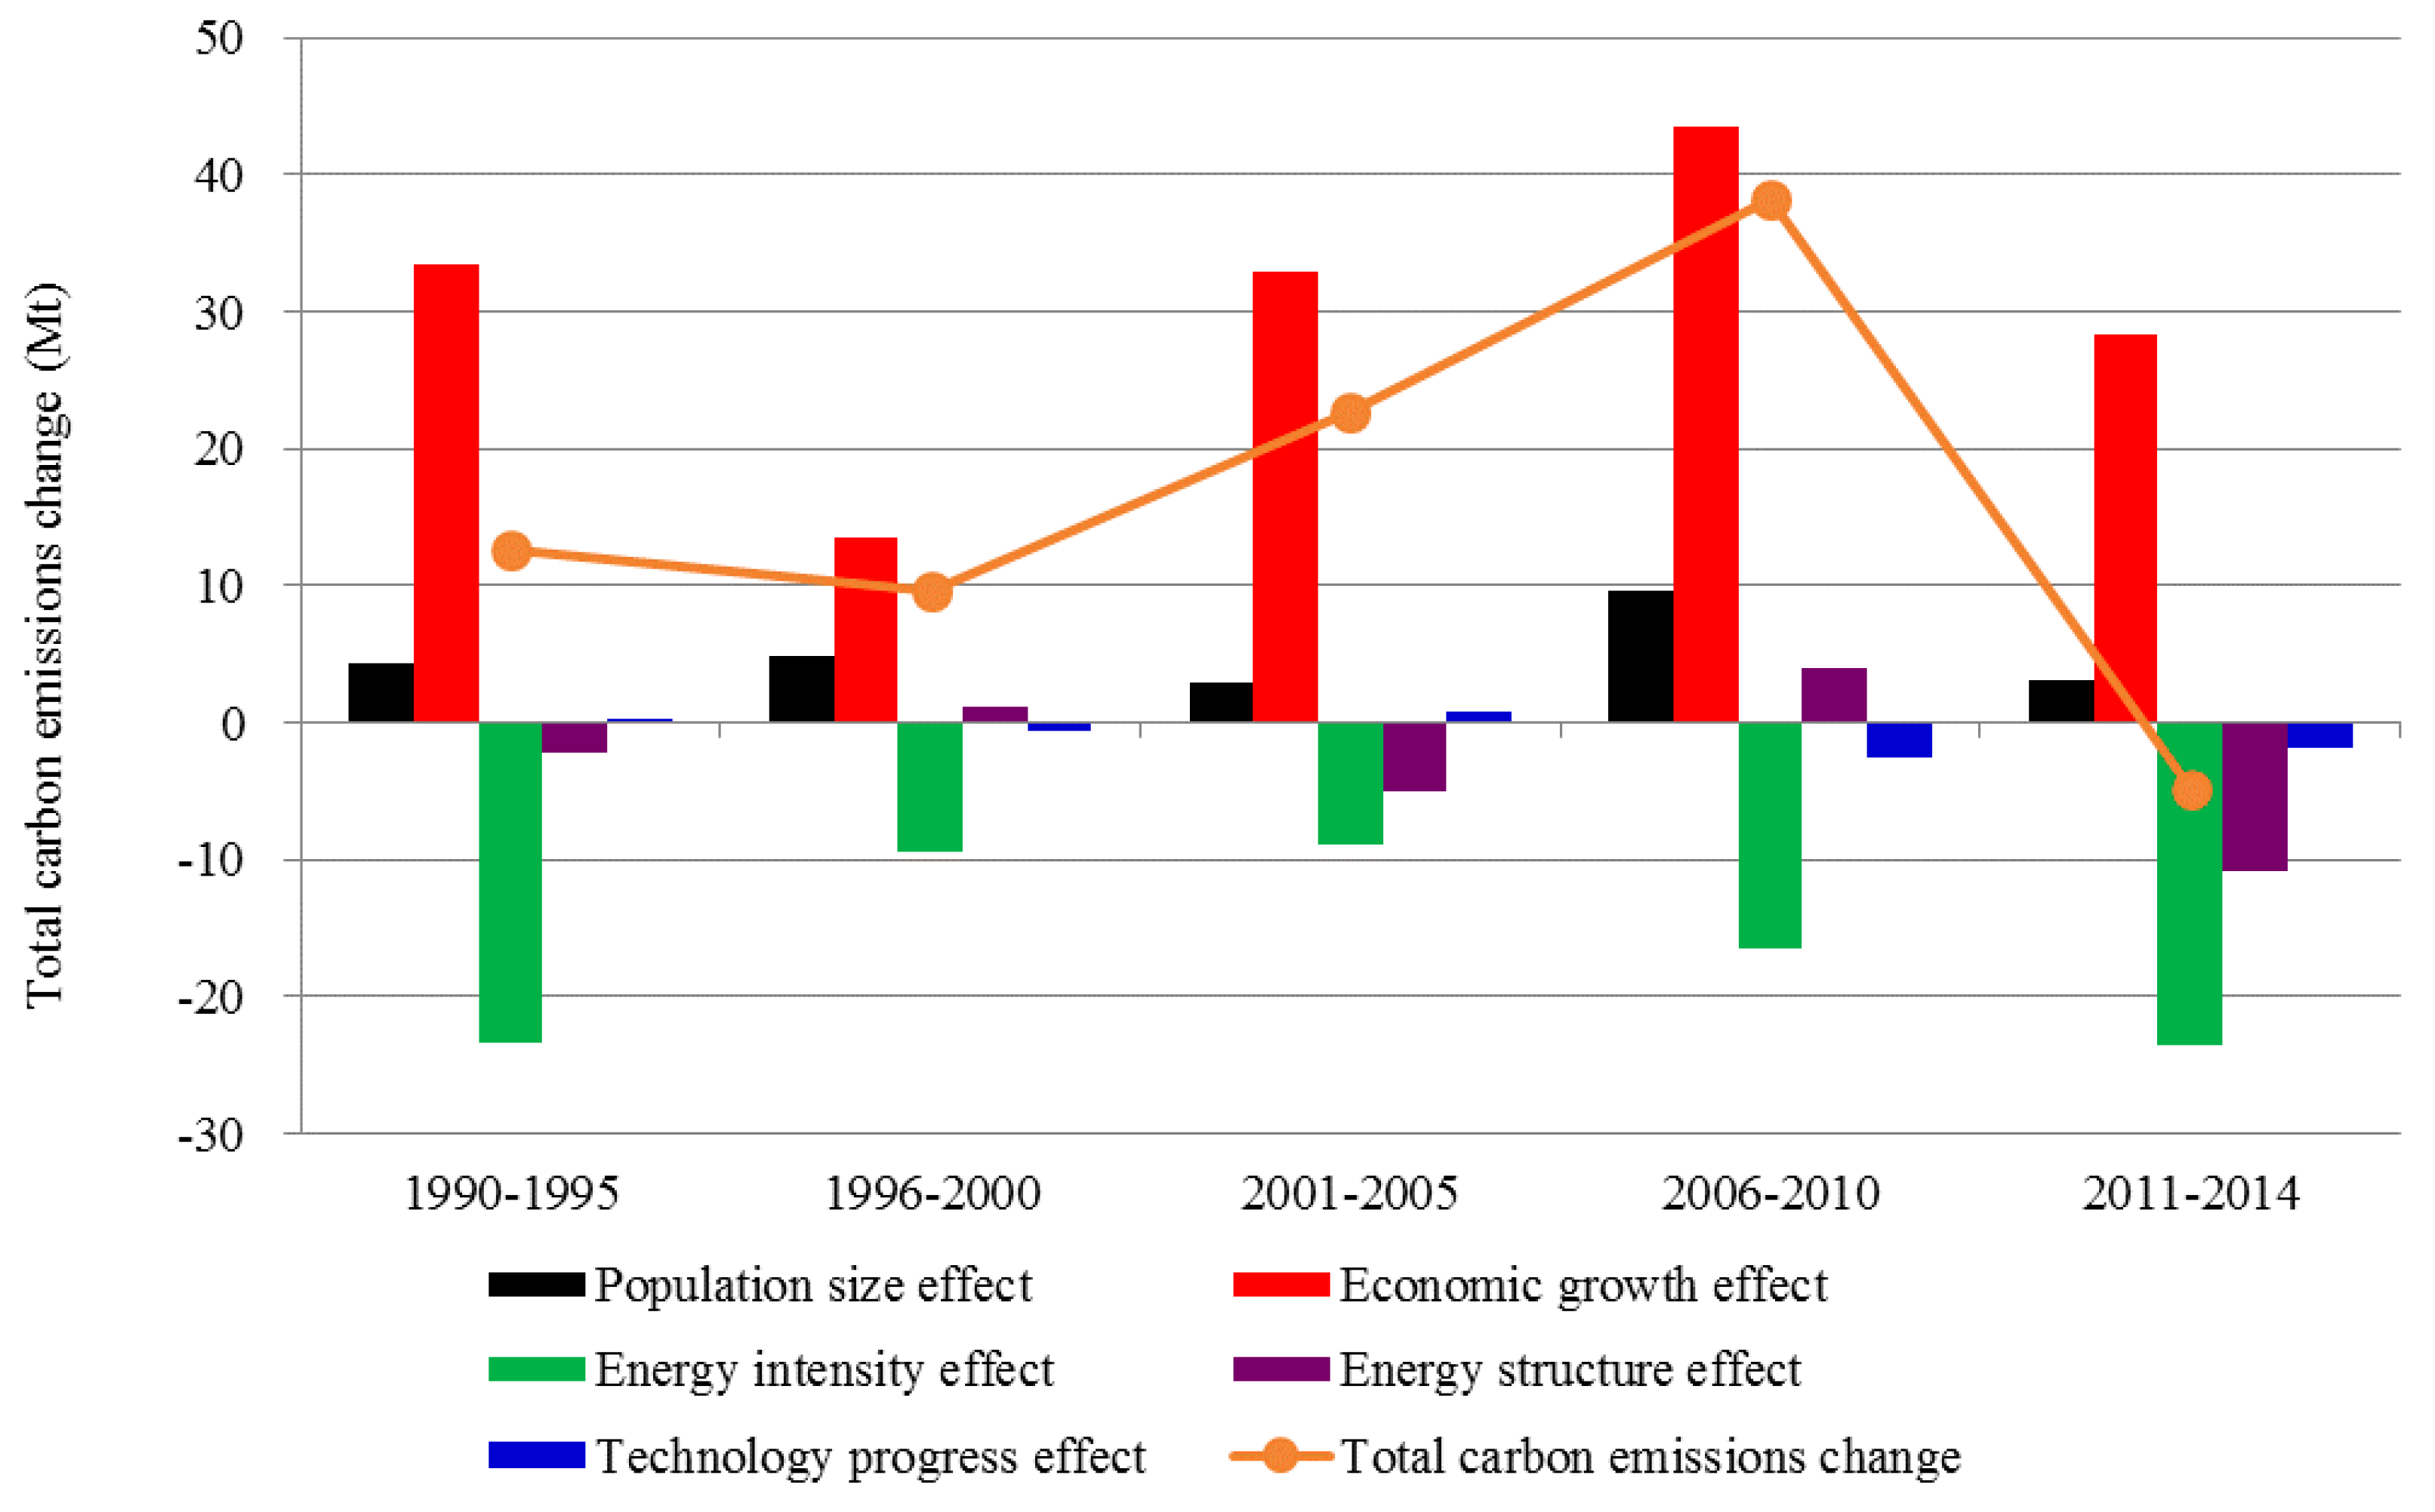
3.4. Decomposition Analysis of Carbon Emissions from Energy Consumption in Guangdong Province

Using the LMDI complete decomposition model based on the extended Kaya identity, the factors influencing annual carbon emissions from energy consumption in Guangdong were analyzed for the period between 1990 and 2014. This was combined with the development background of the Five-Year Plans (shown in Table 1) to quantitatively analyze the influence of economic growth, population size, energy intensity, energy structure, and technology progress on changes in total carbon emissions in Guangdong over these five periods (as indicated in Figure 4).
Between 1990 and 1995, total carbon emissions in Guangdong increased by 12.56 million tons. During this period (the eighth Five-Year Plan), the economy of Guangdong developed rapidly. Thus, economic growth was the primary factor affecting growth in carbon emissions, which was 33.45 million tons. Simultaneously, energy consumption intensity declined substantially, which caused energy intensity to be the primary contributing factor to reductions in carbon emissions in this period, resulting in a growth in carbon emissions of −23.31 million tons. Population size had a positive effect on carbon emissions, contributing 4.26 million tons to carbon emission growth. The proportion of electricity and renewable energy consumption increased from 8.2% in 1990 to 14.9% in 1995. Changes in energy structure intended to reduce carbon emissions began to take effect; thus energy structure had a negative effect on carbon emissions, leading to an increase in carbon emissions of −2.14 million tons. Although the proportion of electricity and renewable energy consumption increased, this could not offset the effect of carbon emissions from fossil energy. As a result, the technological progress effect led to a slight increase in carbon emissions, causing 0.29 million tons of growth in carbon emissions.
From 1996 to 2000, the total growth in carbon emissions in Guangdong Province was 9.7 million tons. During the ninth Five-Year Plan, Guangdong experienced the Asian financial crisis. Although economic growth was still the primary factor influencing carbon emissions, its contribution was significantly lower than in the previous period, resulting in 13.57 million tons of growth in carbon emissions. Energy intensity was still the primary factor inhibiting carbon emissions, contributing −9.34 tons of growth in carbon emissions. The population size effect led to increased carbon emissions, with 4.91 million tons of growth in carbon emissions. The use of electricity and renewable energy sources declined from 15.0% in 1996 to 12.6% in 2000; thus energy consumption structure had a positive effect on carbon emissions, leading to an increase of 0.01 million tons of carbon emissions. Although the percentage of fossil energy sources increased from 85% in 1996 to 87.4% in 2000, the proportion of coal consumption, which has relatively high carbon emissions, decreased from 56.0% in 1996 to 52.2% in 2000. Therefore, the proportion of the carbon emission coefficient from fossil energy sources decreased. Moreover, technology progress produced a decline in carbon emissions, causing a carbon emission growth of −0.58 million tons.
Total growth in carbon emissions in Guangdong during 2001 to 2005 was 22.66 million tons. During the tenth Five-Year Plan, China joined the WTO, and the export oriented economy developed rapidly, especially the Guangdong province in China’s eastern coastal regions. Rapid growth in GDP caused economic growth to be the primary factor for carbon emissions, contributing 32.97 million tons of increases in carbon emissions. Energy intensity remained the primary factor inhibiting carbon emissions, resulting in an increase of −8.97 million tons of carbon emissions. The population size effect caused an increase of 2.96 million tons of carbon emissions. Electricity and renewable energy consumption increased from 13.5% in 2001 to 20.8% in 2005; readjustment of the energy consumption structure had a negative effect on growth of carbon emissions, leading to −5.05 million tons of increase in carbon emissions. Although use of electricity and renewable energy sources decreased the percentage of fossil energy sources, consumption of high-carbon coal increased from 52.5% in 2001 to 52.8% in 2005. As a result, carbon emissions from fossil energy resources were effectively not reduced. This in turn caused technology progress to have a slight positive effect on carbon emissions, resulting in 0.75 million tons of increase in carbon emissions.
Total growth in carbon emissions in Guangdong was 38.27 million tons from 2006 to 2010. In the eleventh Five-Year Plan, despite the impact of the U.S. subprime mortgage crisis in 2008, the economy of Guangdong continued to develop rapidly due to the national “Four Trillion Yuan Stimulus Plan.” Economic growth was the primary factor increasing carbon emissions, causing 43.59 million tons of growth in carbon emissions. Its contribution to carbon emission growth was greater than in the previous three periods. Energy intensity was still the primary factor limiting carbon emissions, resulting in −16.45 million tons of growth in carbon emissions. Population size had a positive effect on growth of carbon emissions, resulting in 9.58 million tons of carbon emission growth. Electricity and renewable energy consumption decreased from 22.1% in 2006 to 18.8% in 2010. This caused the energy consumption structure to have a positive effect on carbon emission growth, leading to 4.02 million tons of carbon emissions. Although the percentage of fossil energy sources increased from 77.9% in 2006 to 81.2% in 2010, high-carbon coal consumption declined from 50.4% in 2006 to 47.1% in 2010. Thus, the carbon emission coefficient of fossil energy sources was effectively reduced. As a result, technology progress had an inhibitory effect, contributing −2.46 million tons of carbon emission growth.
Between 2011 and 2014, total carbon emissions declined by 4.77 million tons in Guangdong. After a prolonged increase, carbon emissions in Guangdong began fluctuating and then decreasing, demonstrating the effect of energy conservation and emissions reduction. In the twelfth Five-Year Plan, economic development in Guangdong slowed significantly due to global economic recovery and national macroeconomic conditions. Although economic growth was still the primary factor affecting carbon emission growth, its contribution was substantially reduced, leading to 28.32 million tons of carbon emission growth. Energy intensity was still the primary factor inhibiting carbon emission growth, leading to −23.56 million tons of carbon emission growth. Population size had a positive effect on growth of carbon emissions, producing 3.07 million tons of carbon emission growth. In this period, consumption of electricity and renewable energy rose continuously (from 16.2% in 2011 to 22.9% in 2014). Simultaneously, coal consumption decreased significantly (from 51.5% in 2011 to 43.7% in 2014). A combination of the effects of energy structure and technology progress collectively inhibited growth in carbon emissions, leading to −10.79 and −1.81 million tons of carbon emission growth, respectively. Specifically, energy structure optimization had a significant effect on carbon emissions.
In summary, the two periods from 1990 to 1995 and 1996 to 2000 saw relatively fast growth in carbon emissions from energy consumption in Guangdong. The most rapid growth in carbon emissions occurred during the two periods from 2001 to 2005 and 2006 to 2010; whereas 2011 to 2014 was a period of slow growth of carbon emissions. The increase in carbon emissions was strongly correlated with growth in GDP. It was also significantly affected by national economic planning and international economic conditions. Growth in population size led to high population density; hence population size always had a positive effect on carbon emission growth, although this contribution was far less than that of economic growth. The gradual reduction in energy consumption intensity caused energy intensity effect to be the primary factor inhibiting growth in carbon emissions in Guangdong. Due to the complexity of energy consumption in Guangdong, an initial upward trend in the proportion of electricity and renewable energy consumption could not be maintained. Furthermore, the proportion of coal in fossil energy consumption showed a fluctuating trend, but no fundamental change has taken place in Guangdong in terms of the predominance of coal in the energy consumption structure. Thus, although renewable energy consumption is increasing, the carbon emission coefficient of fossil energy has not been effectively reduced. Only in the twelfth Five-Year Plan did energy structure and technological progress have sufficient negative effects to simultaneously inhibit carbon emissions. Nevertheless, their contributions to the reduction in total carbon emissions were generally low. Therefore, there is still much room for further improvement in the structural adjustment of energy consumption, and the reduction of carbon emissions from fossil energy.

4. Discussion and Conclusions

Using the LMDI complete decomposition method based on the extended Kaya identity, we analyzed the factors influencing carbon emissions from energy consumption in Guangdong province annually between 1990 and 2014. This was combined with the development background of the Five-Year Plans to quantitatively analyze the influence of economic growth, population size, energy intensity, energy structure, and technology progress on changes in total carbon emissions in Guangdong province.
Economic growth was the most important factor affecting carbon emissions from energy consumption in Guangdong. Depending on national economic planning and the global economic background, economic growth had different contributions to growth of carbon emissions in each period. Increases in population size led to population agglomeration, implying that population size always has a positive effect on carbon emission growth. However, its contribution to carbon emissions was far smaller than that of economic growth. Although the total population played relatively minor effects on carbon emissions, the age distribution’s effect on carbon emissions also should be further discussed in the future [135]. The steady decrease in energy consumption intensity implies that energy intensity is the most important factor for limiting growth of carbon emissions from energy consumption in Guangdong. Within different time frames, energy structure and technology progress played different roles in carbon emission growth. They did not fully exert their inhibitory effects on carbon emission growth due to the lack of fundamental change in energy consumption structure; coal remained the primary energy source in Guangdong. Furthermore, the use of renewable energy did not continue its initial trend of rapid and stable growth.
The development of low carbon emissions in the future economic and societal conditions of Guangdong Province will require more emphasis to be placed on the reduction of energy consumption intensity, optimization of energy structure, and the continuous upgrade of energy technologies. To reduce energy consumption intensity, efforts should focus on optimizing the industrial structure, reducing industrial energy consumption, and monitoring energy-intensive industries. Particular attention should be paid to reducing energy consumption and eliminating obsolete technology in the six most energy-intensive industries in Guangdong, including the processing and coking of petroleum, and processing of nuclear fuel; manufacture of chemical raw materials and chemical products; manufacture of non-metallic mineral products; smelting and rolling of ferrous and non-ferrous metals; and production and distribution of electricity and heat. In order to optimize the energy structure, production and consumption of renewable and new energies will be important. Therefore, the development of new and clean energies such as nuclear, wind, solar, and biomass should be accelerated, thereby reducing domestic and industrial dependence on fossil energy. Owing to development projects such as the Daya Bay and Ling Ao Nuclear Power Plants, Guangdong can further optimize its energy structure and reduce the proportion of fossil energy consumption. Progress in energy technology should focus on increasing the efficiency of energy processing and conversion, especially the coal utilization efficiency of thermal power plants, and the conversion efficiency of petroleum refining processes and coal liquification. This will allow further improvement of the utilization efficiency of energy resources through application of better technologies. In addition, the potential for energy saving and emission reduction in Guangdong can be stimulated via market mechanisms, through the construction of pilots of low-carbon cities and carbon trading schemes. Furthermore, pollution offshoring might also be highlighted [24,136]. Carbon emission arising from international and inter-provincial trades during the development of its export-oriented economy in Guangdong should also be further discussed. This will enable in-depth investigations to be conducted on energy and low carbon development planning, thus achieving the coordination of sustainable development that balances energy, the economy, and the environment.

Acknowledgments

This work was supported by the National Natural Science Foundation of China (No. 41501144), the Guangdong Academy of Sciences Youth Science Foundation (qnjj201501), the Xinjiang Laboratory of Lake Environment and Resources in Arid Zone, Xinjiang Uygur Autonomous Region Key Laboratory Foundation (XJDX0909-2015-03), Xinjiang Normal University Doctoral Research Foundation (XJNUBS1538), the National Key Research and Development Program (No. 2016YFA0602801); the Natural Science Foundation of Guangdong Province, China (2015A030313809); the High-level Leading Talent Introduction Program of GDAS (2016GDASRC-0101), the Scientific Platform and Innovation Capability Construction Program of GDAS (2016GDASPT-0210).

Author Contributions

Changjian Wang designed research; Fei Wang, Changjian Wang, Lixia Jin, Yongxian Su, Yang Wang and Xinlin Zhang performed research, Fei Wang and Changjian Wang contributed new analytic tools; All authors wrote the paper. All authors have read and approved the final manuscript.

Conflicts of Interest

The authors declare no conflict of interest.

References

  1. Myers, N.; Kent, J. New Consumers: The Influence of Affluence on the Environment. Proc. Natl. Acad. Sci. USA 2003, 100, 4963–4968. [Google Scholar] [CrossRef] [PubMed]
  2. Raupach, M.R.; Marland, G.; Ciais, P.; Le Quere, C.; Canadell, J.G.; Klepper, G.; Field, C.B. Global and regional drivers of accelerating CO2 emissions. Proc. Natl. Acad. Sci. USA 2007, 104, 10288–10293. [Google Scholar] [CrossRef]
  3. Pi, G.; Dong, X.; Dong, C.; Guo, J.; Ma, Z. The Status, Obstacles and Policy Recommendations of Shale Gas Development in China. Sustainability 2015, 7, 2353–2372. [Google Scholar] [CrossRef]
  4. Tu, Z.G.; Shen, R.J. Can China’s Industrial SO2 Emissions Trading Pilot Scheme Reduce Pollution Abatement Costs? Sustainability 2014, 6, 7621–7645. [Google Scholar] [CrossRef]
  5. Wang, C.; Wang, Q.; Wang, F. Is Vietnam Ready for Nuclear Power? Environ. Sci. Technol. 2012, 46, 5269–5270. [Google Scholar] [CrossRef] [PubMed]
  6. Wang, C.; Wang, F.; Li, L.; Zhang, X. Wake-up Call for China to Re-Evaluate Its Shale-Gas Ambition. Environ. Sci. Technol. 2013, 47, 11920–11921. [Google Scholar] [CrossRef] [PubMed]
  7. Wang, C.; Wang, F.; Du, H.; Zhang, X. Is China really ready for shale gas revolution—Re-evaluating shale gas challenges. Environ. Sci. Policy 2014, 39, 49–55. [Google Scholar] [CrossRef]
  8. Guan, D.; Peters, G.P.; Weber, C.L.; Hubacek, K. Journey to world top emitter: An analysis of the driving forces of China’s recent CO2 emissions surge. Geophys. Res. Lett. 2009, 36, L04709. [Google Scholar] [CrossRef]
  9. Wang, Q.; Liu, P.; Yuan, X.; Cheng, X.; Ma, R.; Mu, R.; Zuo, J. Structural Evolution of Household Energy Consumption: A China Study. Sustainability 2015, 7, 3919–3932. [Google Scholar] [CrossRef]
  10. Wang, C.; Wang, F.; Zhang, H.; Ye, Y.; Wu, Q. China’s Carbon Trading Scheme is a Priority. Environ. Sci. Technol. 2014, 48, 13559. [Google Scholar] [CrossRef] [PubMed]
  11. Streets, D.G.; Jiang, K.; Hu, X.; Sinton, J.E.; Zhang, X.-Q.; Xu, D.; Jacobson, M.Z.; Hansen, J.E. Recent Reductions in China’s Greenhouse Gas Emissions. Science 2001, 294, 1835–1837. [Google Scholar] [CrossRef] [PubMed]
  12. Cyranoski, D. China struggles to square growth and emissions. Nature 2007, 446, 954–955. [Google Scholar] [CrossRef] [PubMed]
  13. Qiu, J. China asks world to step up on climate. Nature 2008, 456, 151. [Google Scholar] [CrossRef] [PubMed]
  14. Zeng, N.; Ding, Y.; Pan, J.; Wang, H.; Gregg, J. Climate change—The Chinese challenge. Science 2008, 319, 730–731. [Google Scholar] [CrossRef] [PubMed]
  15. Pan, J. China expects leadership from rich nations. Nature 2009, 461, 1055. [Google Scholar] [CrossRef] [PubMed]
  16. Malakoff, D. China’s peak carbon pledge raises pointed questions. Science 2014, 346, 903. [Google Scholar] [CrossRef] [PubMed]
  17. Tollefson, J. US—China climate deal raises hopes for Lima talks. Nature 2014, 515, 473–474. [Google Scholar] [CrossRef] [PubMed]
  18. Wei, C.; Ni, J.; Du, L. Regional allocation of carbon dioxide abatement in China. China Econ. Rev. 2012, 23, 552–565. [Google Scholar] [CrossRef]
  19. Yang, B.; Liu, C.; Su, Y.; Jing, X. The Allocation of Carbon Intensity Reduction Target by 2020 among Industrial Sectors in China. Sustainability 2017, 9, 148. [Google Scholar] [CrossRef]
  20. Liu, Z.; Geng, Y.; Lindner, S.; Guan, D. Uncovering China’s greenhouse gas emission from regional and sectoral perspectives. Energy 2012, 45, 1059–1068. [Google Scholar] [CrossRef]
  21. Dong, L.; Liang, H. Spatial analysis on China’s regional air pollutants and CO2 emissions: Emission pattern and regional disparity. Atmos. Environ. 2014, 92, 280–291. [Google Scholar] [CrossRef]
  22. Dong, H.; Dai, H.; Dong, L.; Fujita, T.; Geng, Y.; Klimont, Z.; Inoue, T.; Bunya, S.; Fujii, M.; Masui, T. Pursuing air pollutant co-benefits of CO2 mitigation in China: A provincial leveled analysis. Appl. Energy 2015, 144, 165–174. [Google Scholar] [CrossRef]
  23. Wang, C.; Wang, F.; Zhang, X.; Yang, Y.; Su, Y.; Ye, Y.; Zhang, H. Examining the driving factors of energy related carbon emissions using the extended STIRPAT model based on IPAT identity in Xinjiang. Renew. Sustain. Energy Rev. 2017, 67, 51–61. [Google Scholar] [CrossRef]
  24. Feng, K.; Davis, S.J.; Sun, L.; Li, X.; Guan, D.; Liu, W.; Liu, Z.; Hubacek, K. Outsourcing CO2 within China. Proc. Natl. Acad. Sci. USA 2013, 110, 11654–11659. [Google Scholar] [CrossRef] [PubMed] [Green Version]
  25. Feng, K.; Hubacek, K.; Sun, L.; Liu, Z. Consumption-based CO2 accounting of China’s megacities: The case of Beijing, Tianjin, Shanghai and Chongqing. Ecol. Indic. 2014, 47, 26–31. [Google Scholar] [CrossRef]
  26. Wang, C.; Wang, F.; Zhang, H.; Ye, Y.; Wu, Q.; Su, Y. Carbon emissions decomposition and environmental mitigation policy recommendations for sustainable development in Shandong province. Sustainability 2014, 6, 8164–8179. [Google Scholar] [CrossRef]
  27. Wang, C.; Wang, F. Structural decomposition analysis of carbon emissions and policy recommendations for energy sustainability in Xinjiang. Sustainability 2015, 7, 7548–7567. [Google Scholar] [CrossRef]
  28. Ang, B.W.; Wang, H. Index decomposition analysis with multidimensional and multilevel energy data. Energy Econ. 2015, 51, 67–76. [Google Scholar] [CrossRef]
  29. Ang, B.W.; Xu, X.Y. Tracking industrial energy efficiency trends using index decomposition analysis. Energy Econ. 2013, 40, 1014–1021. [Google Scholar] [CrossRef]
  30. Ang, B.W.; Xu, X.Y.; Su, B. Multi-country comparisons of energy performance: The index decomposition analysis approach. Energy Econ. 2015, 47, 68–76. [Google Scholar] [CrossRef]
  31. Su, B.; Ang, B.W. Structural decomposition analysis applied to energy and emissions: Some methodological developments. Energy Econ. 2012, 34, 177–188. [Google Scholar] [CrossRef]
  32. Su, B.; Ang, B.W. Structural decomposition analysis applied to energy and emissions: Aggregation issues. Econ. Syst. Res. 2012, 24, 299–317. [Google Scholar] [CrossRef]
  33. Su, B.; Ang, B.W. Attribution of changes in the generalized Fisher index with application to embodied emission studies. Energy 2014, 69, 778–786. [Google Scholar] [CrossRef]
  34. Su, B.; Ang, B.W. Multiplicative decomposition of aggregate carbon intensity change using input–output analysis. Appl. Energy 2015, 154, 13–20. [Google Scholar] [CrossRef]
  35. Su, B.; Ang, B.W.; Low, M. Input-output analysis of CO2 emissions embodied in trade and the driving forces: Processing and normal exports. Ecol. Econ. 2013, 88, 119–125. [Google Scholar] [CrossRef]
  36. Ang, B.W. Decomposition methodology in industrial energy demand analysis. Energy 1995, 20, 1081–1095. [Google Scholar] [CrossRef]
  37. Ang, B.W.; Zhang, F.Q. A survey of index decomposition analysis in energy and environmental studies. Energy 2000, 25, 1149–1176. [Google Scholar] [CrossRef]
  38. Ang, B.W. The LMDI approach to decomposition analysis: A practical guide. Energy Policy 2005, 33, 867–871. [Google Scholar] [CrossRef]
  39. Xu, X.Y.; Ang, B.W. Index decomposition analysis applied to CO2 emission studies. Ecol. Econ. 2013, 93, 313–329. [Google Scholar] [CrossRef]
  40. Xu, X.Y.; Ang, B.W. Analysing residential energy consumption using index decomposition analysis. Appl. Energy 2014, 113, 342–351. [Google Scholar] [CrossRef]
  41. Ang, B.W.; Lee, S.Y. Decomposition of industrial energy consumption: Some methodological and application issues. Energy Econ. 1994, 16, 83–92. [Google Scholar] [CrossRef]
  42. Ang, B.W.; Choi, K.H. Decomposition of aggregate energy and gas emission intensities for industry: A refined Divisia index method. Energy J. 1997, 18, 59–73. [Google Scholar] [CrossRef]
  43. Ang, B.W.; Zhang, F.Q.; Choi, K.-H. Factorizing changes in energy and environmental indicators through decomposition. Energy 1998, 23, 489–495. [Google Scholar] [CrossRef]
  44. Ang, B.W.; Liu, N. Handling zero values in the logarithmic mean Divisia index decomposition approach. Energy Policy 2007, 35, 238–246. [Google Scholar] [CrossRef]
  45. Wang, C.; Chen, J.; Zou, J. Decomposition of energy-related CO2 emission in China: 1957–2000. Energy 2005, 30, 73–83. [Google Scholar] [CrossRef]
  46. Wu, L.; Kaneko, S.; Matsuoka, S. Driving forces behind the stagnancy of China’s energy-related CO2 emissions from 1996 to 1999: The relative importance of structural change, intensity change and scale change. Energy Policy 2005, 33, 319–335. [Google Scholar] [CrossRef]
  47. Zhang, Y.-J.; Da, Y.-B. The decomposition of energy-related carbon emission and its decoupling with economic growth in China. Renew. Sustain. Energy Rev. 2015, 41, 1255–1266. [Google Scholar] [CrossRef]
  48. Wang, C.; Zhang, X.; Wang, F.; Lei, J.; Zhang, L. Decomposition of energy-related carbon emissions in Xinjiang and relative mitigation policy recommendations. Front. Earth Sci. 2015, 9, 65–76. [Google Scholar] [CrossRef]
  49. Wang, H.; Wang, Y.; Wang, H.; Liu, M.; Zhang, Y.; Zhang, R.; Yang, J.; Bi, J. Mitigating greenhouse gas emissions from China’s cities: Case study of Suzhou. Energy Policy 2014, 68, 482–489. [Google Scholar] [CrossRef]
  50. Kang, J.; Zhao, T.; Liu, N.; Zhang, X.; Xu, X.; Lin, T. A multi-sectoral decomposition analysis of city-level greenhouse gas emissions: Case study of Tianjin, China. Energy 2014, 68, 562–571. [Google Scholar] [CrossRef]
  51. Provincial Bureau of Statistics of Guangdong. Guangdong Statistical Yearbook 1990; Provincial Bureau of Statistics of Guangdong: Guangdong, China, 1990. (In Chinese)
  52. Provincial Bureau of Statistics of Guangdong. Guangdong Statistical Yearbook 1991; Provincial Bureau of Statistics of Guangdong: Guangdong, China, 1991. (In Chinese)
  53. Provincial Bureau of Statistics of Guangdong. Guangdong Statistical Yearbook 1992; Provincial Bureau of Statistics of Guangdong: Guangdong, China, 1992. (In Chinese)
  54. Provincial Bureau of Statistics of Guangdong. Guangdong Statistical Yearbook 1993; Provincial Bureau of Statistics of Guangdong: Guangdong, China, 1993. (In Chinese)
  55. Provincial Bureau of Statistics of Guangdong. Guangdong Statistical Yearbook 1994; Provincial Bureau of Statistics of Guangdong: Guangdong, China, 1994. (In Chinese)
  56. Provincial Bureau of Statistics of Guangdong. Guangdong Statistical Yearbook 1995; Provincial Bureau of Statistics of Guangdong: Guangdong, China, 1995. (In Chinese)
  57. Provincial Bureau of Statistics of Guangdong. Guangdong Statistical Yearbook 1996; Provincial Bureau of Statistics of Guangdong: Guangdong, China, 1996. (In Chinese)
  58. Provincial Bureau of Statistics of Guangdong. Guangdong Statistical Yearbook 1997; Provincial Bureau of Statistics of Guangdong: Guangdong, China, 1997. (In Chinese)
  59. Provincial Bureau of Statistics of Guangdong. Guangdong Statistical Yearbook 1998; Provincial Bureau of Statistics of Guangdong: Guangdong, China, 1998. (In Chinese)
  60. Provincial Bureau of Statistics of Guangdong. Guangdong Statistical Yearbook 1999; Provincial Bureau of Statistics of Guangdong: Guangdong, China, 1999. (In Chinese)
  61. Provincial Bureau of Statistics of Guangdong. Guangdong Statistical Yearbook 2000; Provincial Bureau of Statistics of Guangdong: Guangdong, China, 2000. (In Chinese)
  62. Provincial Bureau of Statistics of Guangdong. Guangdong Statistical Yearbook 2001; Provincial Bureau of Statistics of Guangdong: Guangdong, China, 2001. (In Chinese)
  63. Provincial Bureau of Statistics of Guangdong. Guangdong Statistical Yearbook 2002; Provincial Bureau of Statistics of Guangdong: Guangdong, China, 2002. (In Chinese)
  64. Provincial Bureau of Statistics of Guangdong. Guangdong Statistical Yearbook 2003; Provincial Bureau of Statistics of Guangdong: Guangdong, China, 2003. (In Chinese)
  65. Provincial Bureau of Statistics of Guangdong. Guangdong Statistical Yearbook 2004; Provincial Bureau of Statistics of Guangdong: Guangdong, China, 2004. (In Chinese)
  66. Provincial Bureau of Statistics of Guangdong. Guangdong Statistical Yearbook 2005; Provincial Bureau of Statistics of Guangdong: Guangdong, China, 2005. (In Chinese)
  67. Provincial Bureau of Statistics of Guangdong. Guangdong Statistical Yearbook 2006; Provincial Bureau of Statistics of Guangdong: Guangdong, China, 2006. (In Chinese)
  68. Provincial Bureau of Statistics of Guangdong. Guangdong Statistical Yearbook 2007; Provincial Bureau of Statistics of Guangdong: Guangdong, China, 2007. (In Chinese)
  69. Provincial Bureau of Statistics of Guangdong. Guangdong Statistical Yearbook 2008; Provincial Bureau of Statistics of Guangdong: Guangdong, China, 2008. (In Chinese)
  70. Provincial Bureau of Statistics of Guangdong. Guangdong Statistical Yearbook 2009; Provincial Bureau of Statistics of Guangdong: Guangdong, China, 2009. (In Chinese)
  71. Provincial Bureau of Statistics of Guangdong. Guangdong Statistical Yearbook 2010; Provincial Bureau of Statistics of Guangdong: Guangdong, China, 2010. (In Chinese)
  72. Provincial Bureau of Statistics of Guangdong. Guangdong Statistical Yearbook 2011; Provincial Bureau of Statistics of Guangdong: Guangdong, China, 2011. (In Chinese)
  73. Provincial Bureau of Statistics of Guangdong. Guangdong Statistical Yearbook 2012; Provincial Bureau of Statistics of Guangdong: Guangdong, China, 2012. (In Chinese)
  74. Provincial Bureau of Statistics of Guangdong. Guangdong Statistical Yearbook 2013; Provincial Bureau of Statistics of Guangdong: Guangdong, China, 2013. (In Chinese)
  75. Provincial Bureau of Statistics of Guangdong. Guangdong Statistical Yearbook 2014; Provincial Bureau of Statistics of Guangdong: Guangdong, China, 2014. (In Chinese)
  76. Provincial Bureau of Statistics of Guangdong. Guangdong Statistical Yearbook 2015; Provincial Bureau of Statistics of Guangdong: Guangdong, China, 2015. (In Chinese)
  77. National Bureau of Statistics of China. China Statistical Yearbook 1990; National Bureau of Statistics of China: Beijing, China, 1990. (In Chinese)
  78. National Bureau of Statistics of China. China Statistical Yearbook 1991; National Bureau of Statistics of China: Beijing, China, 1991. (In Chinese)
  79. National Bureau of Statistics of China. China Statistical Yearbook 1992; National Bureau of Statistics of China: Beijing, China, 1992. (In Chinese)
  80. National Bureau of Statistics of China. China Statistical Yearbook 1993; National Bureau of Statistics of China: Beijing, China, 1993. (In Chinese)
  81. National Bureau of Statistics of China. China Statistical Yearbook 1994; National Bureau of Statistics of China: Beijing, China, 1994. (In Chinese)
  82. National Bureau of Statistics of China. China Statistical Yearbook 1995; National Bureau of Statistics of China: Beijing, China, 1995. (In Chinese)
  83. National Bureau of Statistics of China. China Statistical Yearbook 1996; National Bureau of Statistics of China: Beijing, China, 1996. (In Chinese)
  84. National Bureau of Statistics of China. China Statistical Yearbook 1997; National Bureau of Statistics of China: Beijing, China, 1997. (In Chinese)
  85. National Bureau of Statistics of China. China Statistical Yearbook 1998; National Bureau of Statistics of China: Beijing, China, 1998. (In Chinese)
  86. National Bureau of Statistics of China. China Statistical Yearbook 1999; National Bureau of Statistics of China: Beijing, China, 1999. (In Chinese)
  87. National Bureau of Statistics of China. China Statistical Yearbook 2000; National Bureau of Statistics of China: Beijing, China, 2000. (In Chinese)
  88. National Bureau of Statistics of China. China Statistical Yearbook 2001; National Bureau of Statistics of China: Beijing, China, 2001. (In Chinese)
  89. National Bureau of Statistics of China. China Statistical Yearbook 2002; National Bureau of Statistics of China: Beijing, China, 2002. (In Chinese)
  90. National Bureau of Statistics of China. China Statistical Yearbook 2003; National Bureau of Statistics of China: Beijing, China, 2003. (In Chinese)
  91. National Bureau of Statistics of China. China Statistical Yearbook 2004; National Bureau of Statistics of China: Beijing, China, 2004. (In Chinese)
  92. National Bureau of Statistics of China. China Statistical Yearbook 2005; National Bureau of Statistics of China: Beijing, China, 2005. (In Chinese)
  93. National Bureau of Statistics of China. China Statistical Yearbook 2006; National Bureau of Statistics of China: Beijing, China, 2006. (In Chinese)
  94. National Bureau of Statistics of China. China Statistical Yearbook 2007; National Bureau of Statistics of China: Beijing, China, 2007. (In Chinese)
  95. National Bureau of Statistics of China. China Statistical Yearbook 2008; National Bureau of Statistics of China: Beijing, China, 2008. (In Chinese)
  96. National Bureau of Statistics of China. China Statistical Yearbook 2009; National Bureau of Statistics of China: Beijing, China, 2009. (In Chinese)
  97. National Bureau of Statistics of China. China Statistical Yearbook 2010; National Bureau of Statistics of China: Beijing, China, 2010. (In Chinese)
  98. National Bureau of Statistics of China. China Statistical Yearbook 2011; National Bureau of Statistics of China: Beijing, China, 2011. (In Chinese)
  99. National Bureau of Statistics of China. China Statistical Yearbook 2012; National Bureau of Statistics of China: Beijing, China, 2012. (In Chinese)
  100. National Bureau of Statistics of China. China Statistical Yearbook 2013; National Bureau of Statistics of China: Beijing, China, 2013. (In Chinese)
  101. National Bureau of Statistics of China. China Statistical Yearbook 2014; National Bureau of Statistics of China: Beijing, China, 2014. (In Chinese)
  102. National Bureau of Statistics of China. China Statistical Yearbook 2015; National Bureau of Statistics of China: Beijing, China, 2015. (In Chinese)
  103. National Bureau of Statistics of China. China Energy Statistical Yearbook 1990; National Bureau of Statistics of China: Beijing, China, 1990. (In Chinese)
  104. National Bureau of Statistics of China. China Energy Statistical Yearbook 1991; National Bureau of Statistics of China: Beijing, China, 1991. (In Chinese)
  105. National Bureau of Statistics of China. China Energy Statistical Yearbook 1992; National Bureau of Statistics of China: Beijing, China, 1992. (In Chinese)
  106. National Bureau of Statistics of China. China Energy Statistical Yearbook 1993; National Bureau of Statistics of China: Beijing, China, 1993. (In Chinese)
  107. National Bureau of Statistics of China. China Energy Statistical Yearbook 1994; National Bureau of Statistics of China: Beijing, China, 1994. (In Chinese)
  108. National Bureau of Statistics of China. China Energy Statistical Yearbook 1995; National Bureau of Statistics of China: Beijing, China, 1995. (In Chinese)
  109. National Bureau of Statistics of China. China Energy Statistical Yearbook 1996; National Bureau of Statistics of China: Beijing, China, 1996. (In Chinese)
  110. National Bureau of Statistics of China. China Energy Statistical Yearbook 1997; National Bureau of Statistics of China: Beijing, China, 1997. (In Chinese)
  111. National Bureau of Statistics of China. China Energy Statistical Yearbook 1998; National Bureau of Statistics of China: Beijing, China, 1998. (In Chinese)
  112. National Bureau of Statistics of China. China Energy Statistical Yearbook 1999; National Bureau of Statistics of China: Beijing, China, 1999. (In Chinese)
  113. National Bureau of Statistics of China. China Energy Statistical Yearbook 2000; National Bureau of Statistics of China: Beijing, China, 2000. (In Chinese)
  114. National Bureau of Statistics of China. China Energy Statistical Yearbook 2001; National Bureau of Statistics of China: Beijing, China, 2001. (In Chinese)
  115. National Bureau of Statistics of China. China Energy Statistical Yearbook 2002; National Bureau of Statistics of China: Beijing, China, 2002. (In Chinese)
  116. National Bureau of Statistics of China. China Energy Statistical Yearbook 2003; National Bureau of Statistics of China: Beijing, China, 2003. (In Chinese)
  117. National Bureau of Statistics of China. China Energy Statistical Yearbook 2004; National Bureau of Statistics of China: Beijing, China, 2004. (In Chinese)
  118. National Bureau of Statistics of China. China Energy Statistical Yearbook 2005; National Bureau of Statistics of China: Beijing, China, 2005. (In Chinese)
  119. National Bureau of Statistics of China. China Energy Statistical Yearbook 2006; National Bureau of Statistics of China: Beijing, China, 2006. (In Chinese)
  120. National Bureau of Statistics of China. China Energy Statistical Yearbook 2007; National Bureau of Statistics of China: Beijing, China, 2007. (In Chinese)
  121. National Bureau of Statistics of China. China Energy Statistical Yearbook 2008; National Bureau of Statistics of China: Beijing, China, 2008. (In Chinese)
  122. National Bureau of Statistics of China. China Energy Statistical Yearbook 2009; National Bureau of Statistics of China: Beijing, China, 2009. (In Chinese)
  123. National Bureau of Statistics of China. China Energy Statistical Yearbook 2010; National Bureau of Statistics of China: Beijing, China, 2010. (In Chinese)
  124. National Bureau of Statistics of China. China Energy Statistical Yearbook 2011; National Bureau of Statistics of China: Beijing, China, 2011. (In Chinese)
  125. National Bureau of Statistics of China. China Energy Statistical Yearbook 2012; National Bureau of Statistics of China: Beijing, China, 2012. (In Chinese)
  126. National Bureau of Statistics of China. China Energy Statistical Yearbook 2013; National Bureau of Statistics of China: Beijing, China, 2013. (In Chinese)
  127. National Bureau of Statistics of China. China Energy Statistical Yearbook 2014; National Bureau of Statistics of China: Beijing, China, 2014. (In Chinese)
  128. National Bureau of Statistics of China. China Energy Statistical Yearbook 2015; National Bureau of Statistics of China: Beijing, China, 2015. (In Chinese)
  129. Lima, F.; Nunes, M.L.; Cunha, J.; Lucena, A.F.P. A cross-country assessment of energy-related CO2 emissions: An extended Kaya Index Decomposition Approach. Energy 2016, 115, 1361–1374. [Google Scholar] [CrossRef]
  130. Štreimikienė, D.; Balezentis, T. Kaya identity for analysis of the main drivers of GHG emissions and feasibility to implement EU “20-20-20” targets in the Baltic States. Renew. Sustain. Energy Rev. 2016, 58, 1108–1113. [Google Scholar] [CrossRef]
  131. Remuzgo, L.; Sarabia, J.M. International inequality in CO2 emissions: A new factorial decomposition based on Kaya factors. Environ. Sci. Policy 2015, 54, 15–24. [Google Scholar] [CrossRef]
  132. Duro, J.A. Weighting vectors and international inequality changes in environmental indicators: An analysis of CO2 per capita emissions and Kaya factors. Energy Econ. 2013, 39, 122–127. [Google Scholar] [CrossRef]
  133. Ang, B.W.; Liu, F.L. A new energy decomposition method: Perfect in decomposition and consistent in aggregation. Energy 2001, 26, 537–548. [Google Scholar] [CrossRef]
  134. Ang, B.W.; Liu, F.L.; Chew, E.P. Perfect decomposition techniques in energy and environmental analysis. Energy Policy 2003, 31, 1561–1566. [Google Scholar] [CrossRef]
  135. Lugauer, S.; Jensen, R.; Sadler, C. An Estimate of the Age Distribution’s Effect on Carbon Dioxide Emissions. Econ. Inq. 2014, 52, 914–929. [Google Scholar] [CrossRef]
  136. Wang, C.; Wang, F.; Zhang, X.; Zhang, H. Influencing mechanism of energy-related carbon emissions in Xinjiang based on the input-output and structural decomposition analysis. J. Geogr. Sci. 2017, 27, 365–384. [Google Scholar] [CrossRef]
Figure 1. Economic growth and industrial structure changes in Guangdong during 1990 to 2014.
Sustainability 09 00274 g001
Figure 2. Total energy consumption and energy consumption structure in Guangdong from 1990 to 2014.
Sustainability 09 00274 g002
Figure 3. Total carbon emissions and carbon emissions structure in Guangdong during 1990–2014.
Sustainability 09 00274 g003
Figure 4. Complete decomposition of carbon emission changes in million tones in five stages in Guangdong.
Sustainability 09 00274 g004
Table 1. Brief description of five division stages in Guangdong province.
Assessed CriteriaPeriod 1 (1990–1995)Period 2 (1996–2000)Period 3 (2001–2005)Period 4 (2006–2010)Period 5 (2011–2014)
Eighth Five-Year PlanNinth Five-Year PlanTenth Five-Year PlanEleventh Five-Year PlanTwelfth Five-Year Plan
Population growth, %3.063.041.292.500.79
Annual GDP growth rate, %19.6411.9613.6312.698.42
Annual energy consumption growth rate, %10.755.7412.509.932.04
Annual carbon emission growth rate, %9.316.1110.4010.38−1.23
Annual carbon emission growth rate per ten thousand Yuan GDP, %−19.51−5.52−5.97−3.92−7.21
Annual carbon emission growth rate per capita, %6.062.978.997.68−2.04

