Discussion

Chinese Electric Power Development Coordination Analysis on Resource, Production and Consumption: A Provincial Case Study

1
School of Economics and Management, North China Electric Power University, Beijing 102206, China
2
Department of Economics, University of Toronto, Toronto, ON M5S 3G7, Canada
*
Author to whom correspondence should be addressed.
Sustainability 2017, 9(2), 209; https://doi.org/10.3390/su9020209
Submission received: 23 November 2016 / Revised: 12 January 2017 / Accepted: 31 January 2017 / Published: 4 February 2017
(This article belongs to the Special Issue Sustainable Electric Power Systems Research)

Abstract

:
In line with the pressures of energy shortage and economic development, Chinese government has adopted a series of measures and policies to promote the exploitation and utilization efficiency of electric power. China is urgently reconsidering its electric power development level and coordinating between power supply and demand sides. Therefore, in this paper, Chinese industrial structure of electric power was constructed according to its production process from resource, production and consumption sides. With the constructed industrial structure, the influencing factors on each side were selected to build a measurable evaluation system. Thirty-one Chinese provinces were chosen to explore their development coordination level based on the projection pursuit model and coupling coordination model. By the projection pursuit model, improved projection directions and best projection vectors of each province were found to describe the development level of each side. The coupling coordination model was adopted to explore the provincial supply and demand relations between electric power industry side via the indexes of coupling degree, coordination degree and relative development degree. By using ArcGIS mapping analysis, the results show the changes in Chinese provincial coupling and coordination development levels from 2011 to 2014. Finally, using the evaluation results, optimal strategies were discussed for improving the coordination of Chinese electric power development from different aspects, such as technical support, project approval and supervision, and demand side management. The findings prove that projection pursuit model and coupling coordination model can evaluate the electric power development level and describe their dynamic changing coordination relations effectively.

1. Introduction

As one of the world’s largest economies, China needs huge power resources to maintain its rapid economic growth pace. Meanwhile, to fulfill the long-term goals of energy conservation and emission reduction, sustainable power and utilization development are critical to China’s future economy and society. At present, China’s power industry chain has achieved obvious progress in each link, but the links’ coordination needs to be improved for rational allocation and moderate exploitation in power industry. For example, according to the statistical report from National Bureau of Statistics of China, the total installed capacity in China had reached 1508.28 GW by the end of 2015, including 990.21 GW thermal power, 319.37 GW hydro power, 26.08 GW nuclear power, 129.44 GW wind power, and 43.18 GW photovoltaic power [1,2]; however, some renewable energy problems are wide spread, such as the abandon ratios of generated wind power and photovoltaic power were, respectively, 15.5% and 12.6% in 2015 [3,4]. The rising Chinese energy efficiency was also lower than developed countries [5]. The coordinated development of resource, production and consumption plays an important role for the sustainable growth of Chinese power industry. Thus, it is necessary to evaluate the current development level of Chinese electric power industry and test the coordination of the industrial links, which is critical to balance power supply and demand, optimize industrial distribution and promote energy efficiency in China.
Chinese government is aware of the importance of increasing efficiency and coordination development in the electric power industry. Many countermeasures have been taken to solve these problems in recent years, such as generation restructuring and industrial upgrading [6,7,8]. Especially since the electric power industry reform in 2015, several policies were made to improve the coordinated development in power industry related to the power supply and demand, power plant planning, renewable energy utilization and so on [9]. All of these policies were aimed at promoting the coordinated development level of electric power industry from different sides. In this new round of power industry reform, the main purposes are to enhance the efficiency between each electric power industrial side, to unleash the generation potentials of multiple power resources and to promote the reasonable consumption of various power resources. Thus, it is necessary to establish factors identification and evaluation systems for coordination of the electric power industry. Especially, the factors influenced by resource reserves and economic development levels are complicated, and the development characteristics of the electric power industry in different Chinese provinces are not same [10]. An effective evaluation method will be explored to help central and local governments to understand the coordination development level of provincial power industry and the relationships among resources, production and consumption.
This paper adopts a new perspective to explore China’s power industry development level based on the power industrial supply and demand situations from resource, production and consumption sides [11,12,13,14]. To evaluate the development level of electric power industry in China, typical factors are selected to present the features in each industrial chain link. The energy development evaluation factors were selected accordingly. Then, based on the electric power industry data of 31 provinces in China, the development coordination of electric power industry in each province was analyzed via coupling degree, coordination degree and relative development degree. These indexes are useful to assess the development levels of power resource exploitation, power generation efficiency and the demand of power consumption. Finally, according to the analysis results, some optimal strategies were proposed to help local government and enterprises to improve their development coordination in different industrial chain links. This coordination exploration for provincial electric power development provides an effective evaluation tool for industrial management and power efficiency optimization.

2. Literature Reviews

To explore the coordination of Chinese provincial electric power industry, it is necessary to review the literature from different perspectives. In recent years, there are various studies focusing on the energy or power industry. Those references will provide helps for choosing the coordination methods and building the research models in this paper.
(1) Energy development level evaluation
Different methods have been used to explore and measure the energy development levels, such as total factor structure analysis, computable general equilibrium model (CGE), data envelopment analysis model (DEA), and long-range energy alternatives planning system (LEAP) [15,16,17,18]. Especially, following the enterprise’s assessment system (RENERGY), a holistic approach was used to analyze the sustainable energy development at regional level [19]. Most of the methods on energy development level focus on its influencing factors. These analysis methods were adopted to evaluate the current level of energy development level or forecast the future level of energy system. Based on these methods, the development level evaluation of electric power industry can be classified by the industrial structure and its influencing factors.
(2) The relations between energy supply and demand
Traditional energy market was driven by energy supply. However, energy supply is mainly determined by energy demand [20]. More complicated to power grid, the bilateral uncertainties from generation side and consumption side make power supply and demand more difficult [21]. Facing the complex and dynamic energy environment, scenarios are common ways to analyze the development trends or relationships between energy supply and demand according to specific energy projects or energy products, e.g., coal, electricity and heat electrification [22,23,24]. However, the relationships between energy supply side and demand side in different regions are not targeted, especially at the regional or provincial levels.
(3) Energy efficiency
Regarding the study of energy efficiency in China, some methods have been adopted to analyze its promotion potentials. For example, by tracking CO2 emissions, a radial stochastic DEA model was proposed to test Chinese energy saving potentials based on chance constrained programming [25]. In addition, the factors that influence energy efficiency were identified through specific industry analysis [26,27]. Increasing the production share of renewable energy in energy supply structure and promoting the guidance function of energy demand in energy system have great influences on energy efficiency [28]. Thus, the energy demand or energy consumption should be analyzed more broadly by considering the economic, environmental and energy factors comprehensively.
Based on the literature review above, the coordination analysis on electric power industry should be studied from the supply and demand relationship and the industrial structure perspectives. With different regional characteristics, the influencing factors from the resource, production and consumption sides should be collected to evaluate the provincial development levels. Employed from other research fields [29,30], projection pursuit model and coupling coordination model were selected to explore the Chinese provincial energy problems due to their brilliant quantitative analysis function for exploring multi-objects in complex systems. The main adopted methods in this paper will be analyzed as follows.

3. Research Process

The research methodology and process on Chinese provincial electric power development coordination is shown in Figure 1.
First, based on the power production process, Chinese electric power industry structure model was constructed from its resource side, production side and consumption side to understand the relationships between power supply and demand. To identify the influencing factors on each side, quantitative evaluation indexes for development coordination were selected to evaluate the provincial electric power development level.
Second, by employing the projection pursuit model, provincial energy development level can be described through the improved projection direction and best projection vector. Combined with the projection results, the coupling coordination model was adopted to explore the coordination between each side through the evaluation indexes of coupling degree, coordination degree and relative development degree. These indexes are helpful to test the power resource exploitation level and power generation efficiency.
Finally, data from Chinese 31 provinces were used to make an empirical analysis. ArcGIS model was taken as a tool to explain the changes of electric power development coordination in each province. With the analysis results, improvement strategies for electric power development coordination were discussed from the aspects of technical support on resource side, project approval and supervision on production side, and demand side management on consumption side.

4. Development Index Selection of Electric Power Industry

4.1. Electric Power Industry Structure Construction

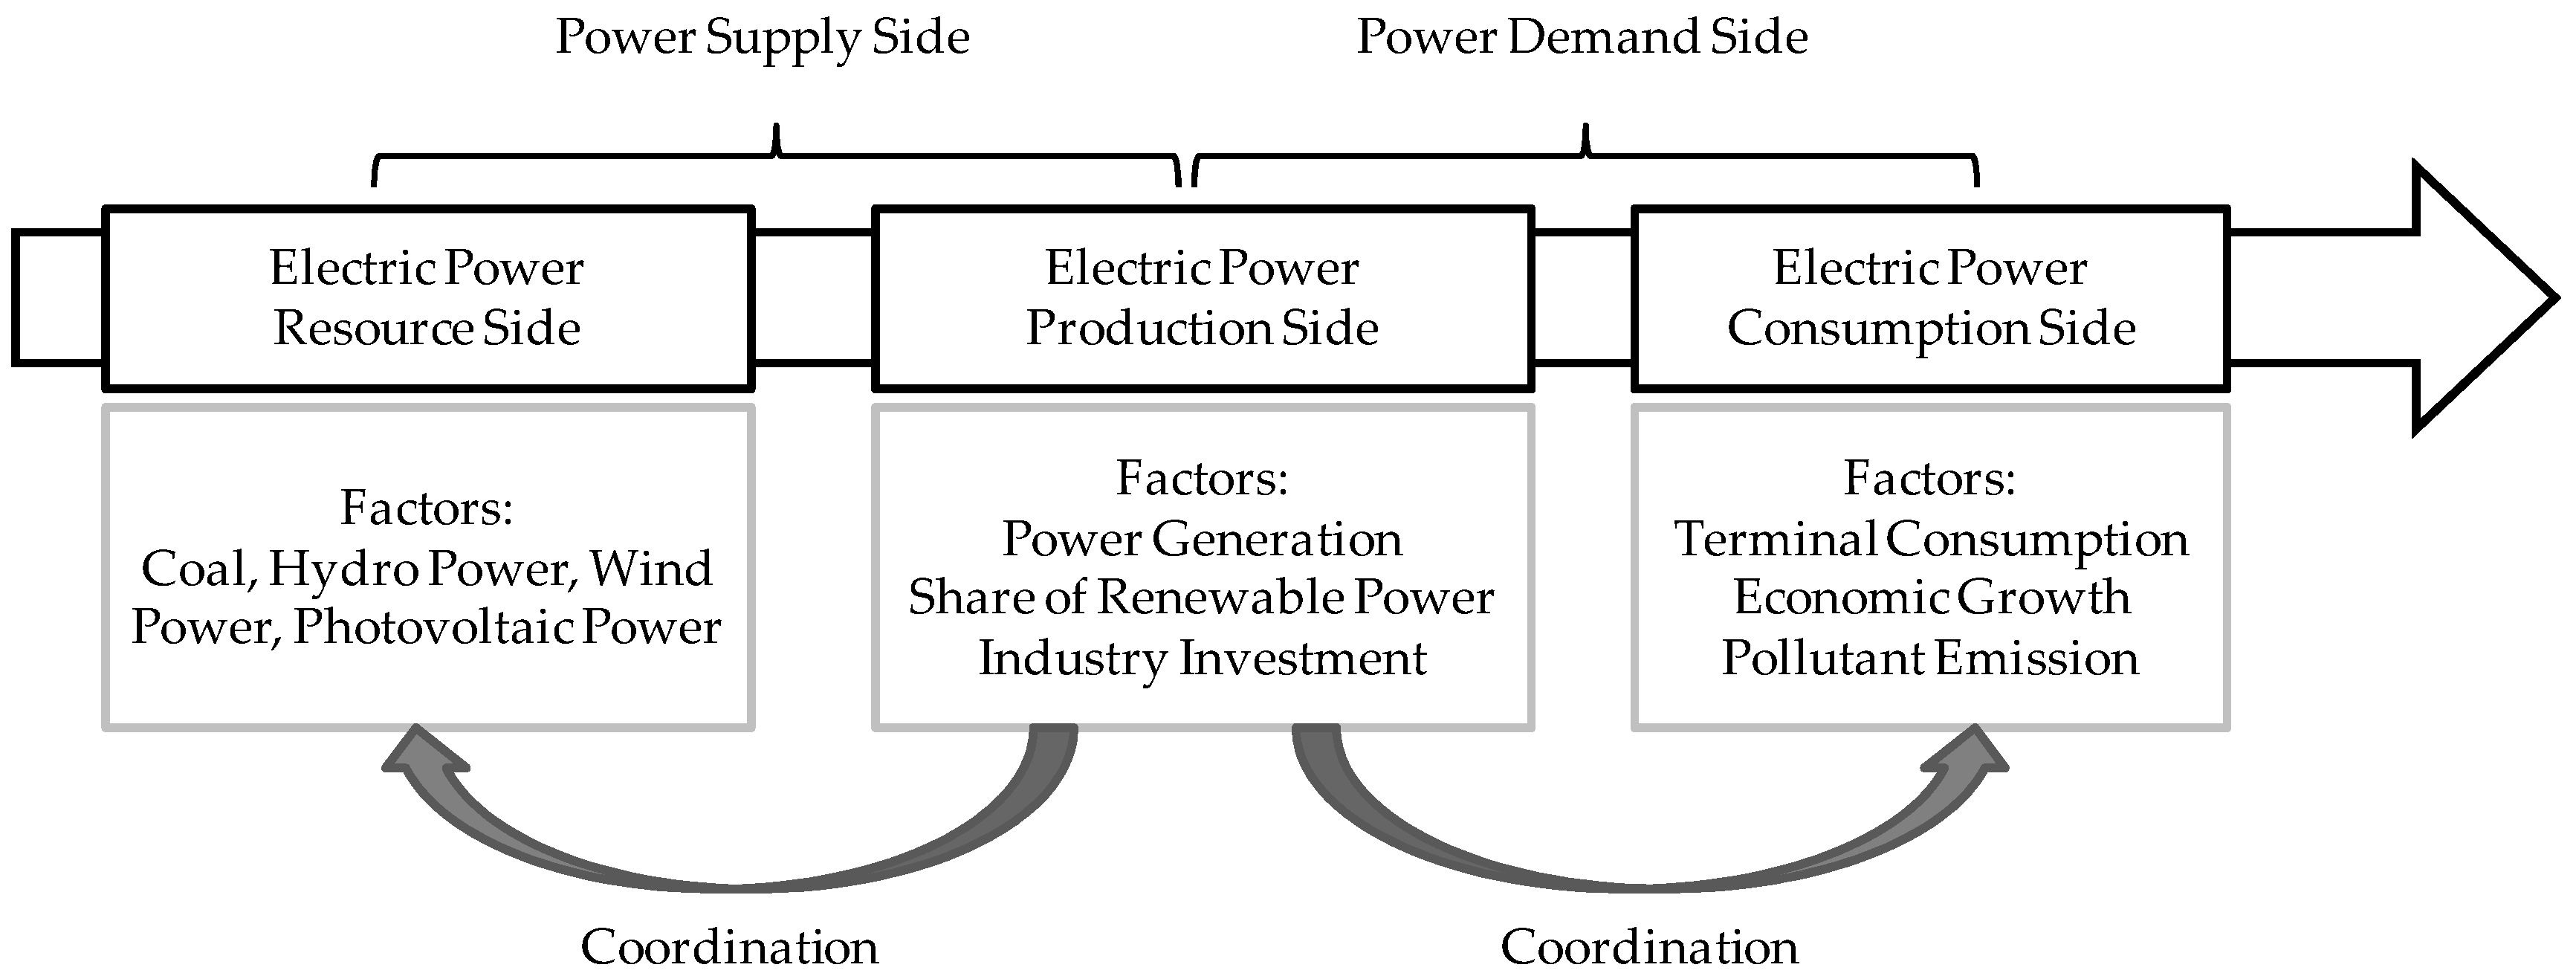
There are various factors impacting on energy development and electric power industry. In China, the factors affecting the electric power development are complicated. Taking the coal demand as an example from the power resource side, the factors, such as domestic demand, foreign trade and industrial upgrading, will comprehensively drive the coal demand change [31]. Therefore, to analyze the coordination degree of provincial electric power development in China, an industrial structure is first proposed and constructed. In this paper, Chinese electric power industry is divided into three parts according to the industrial production process: electric power resource side, electric power production side and electric power consumption side (see Figure 2). The electric power production side is the connection link between supply side and demand side in the electric power industry. Thus, in this study, the coordination between power resource and power production and the coordination between power production and power consumption are used to measure the electric power development level from supply side and demand side, respectively. Through factor selection and collection on each side, the provincial development level of electric power can be described comprehensively.

4.2. Influencing Factors Selection on Power Industrial Sides

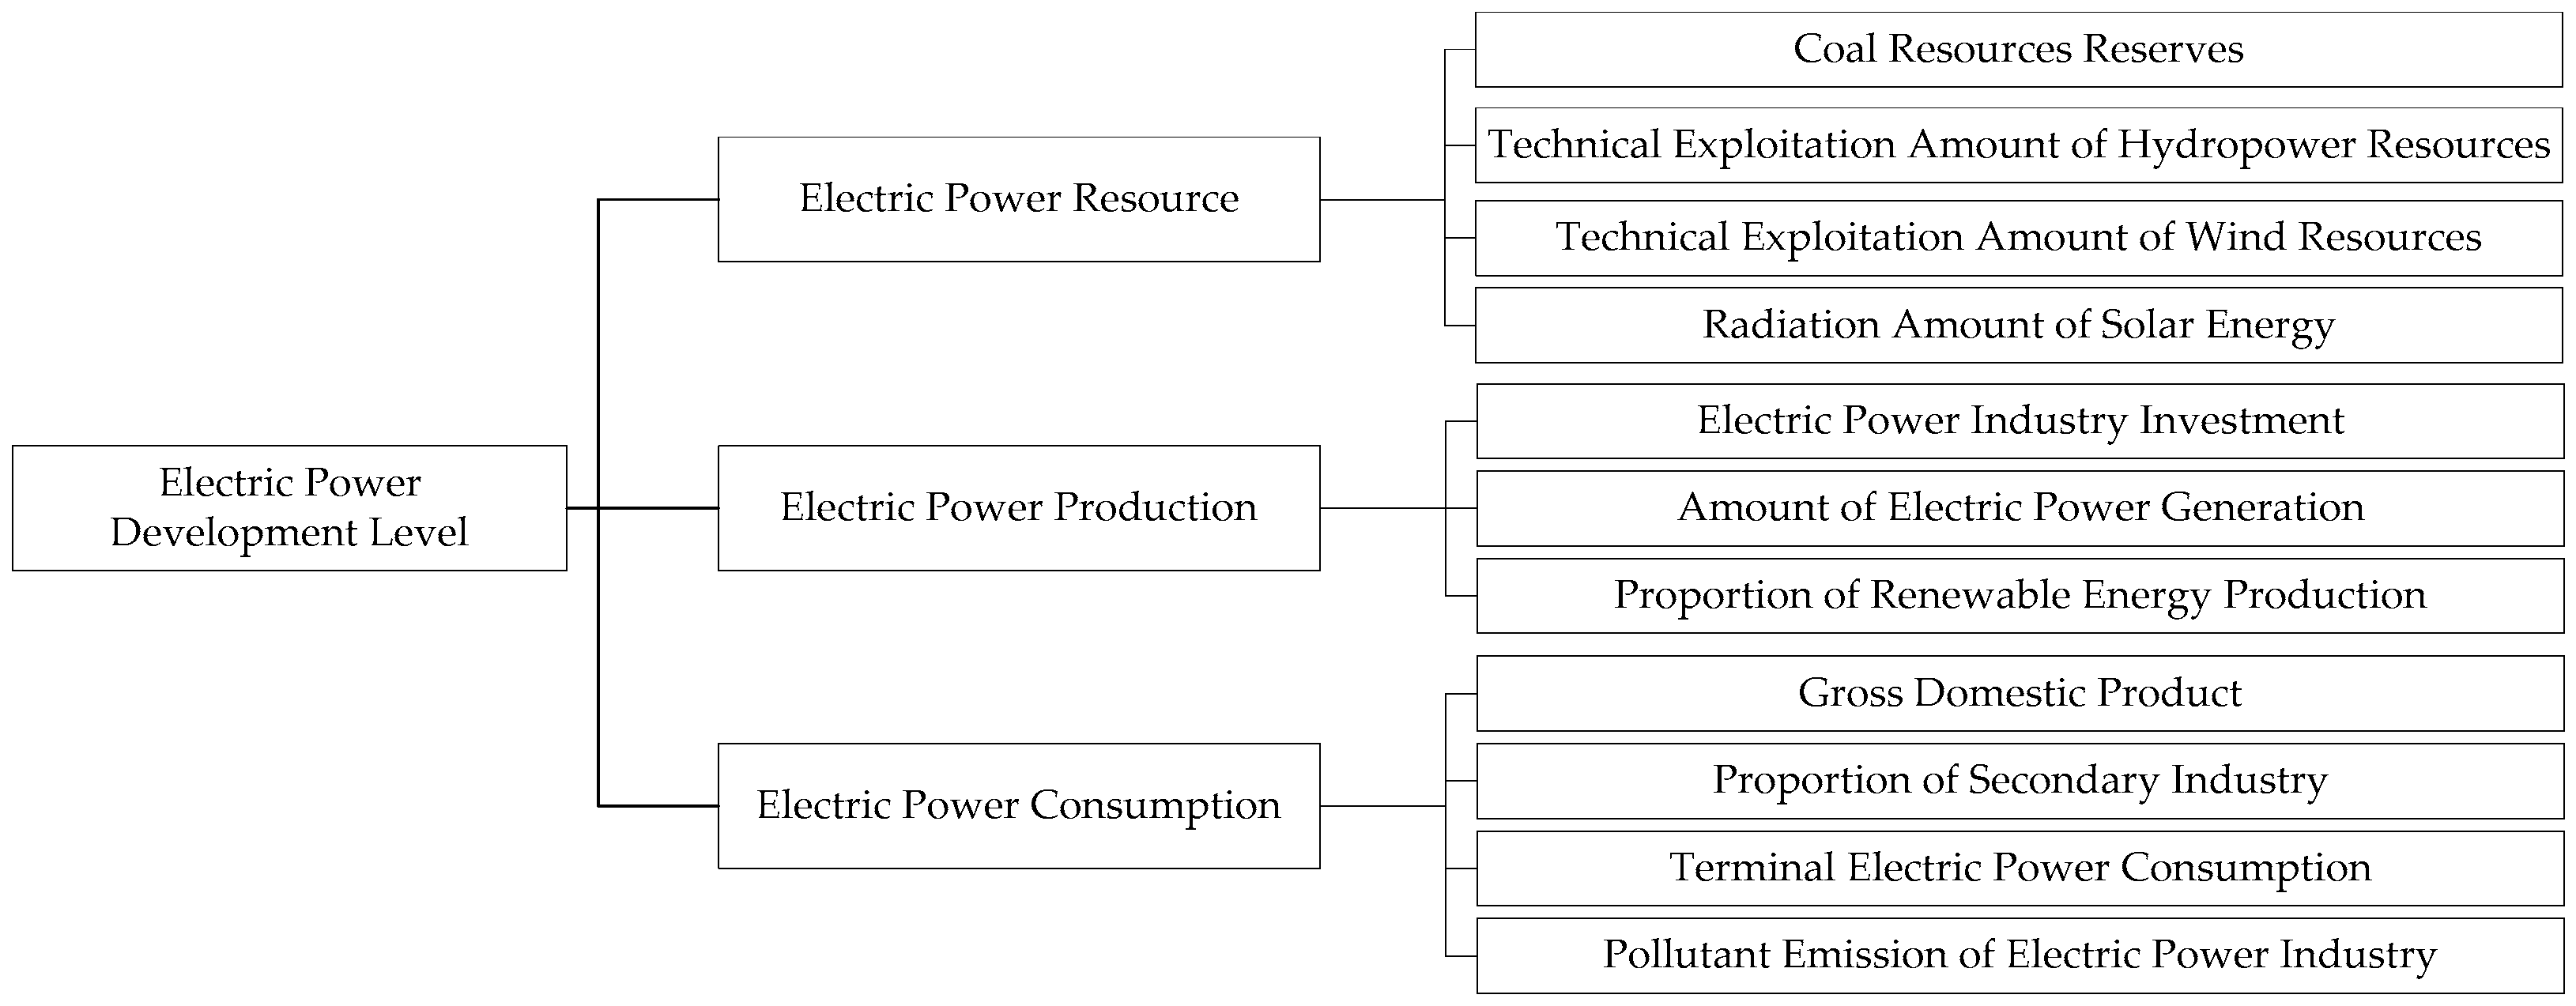
In this section, some factors are considered to describe the development levels of electric power resource, electric power production and electric power consumption based on Chinese electric power industry structure. The main factors that impact the electric power development level are collected, as shown in Figure 3.
(1) Electric power resources: In Chinese, coal energy is the main energy resource. In 2014, the total energy consumption was 4.26 billion tons of standard coal equivalents and coal consumption accounted for 66% [32]. The coal resource reserves in different provinces are still the main drivers to electric power development on resource side. Meanwhile, in line with the structure improvement, energy conversion and emission reduction, renewable energy resources will have important influences on the sustainable development of Chinese electric power industry. Thus, to evaluate the development level of provincial electric power resources, “coal resources reserves”, “technical exploitation amount of hydropower resources”, “technical exploitation amount of wind resources (height > 70 m)” and “radiation amount of solar energy” are selected to stand for the development level on resource side. The influencing factor caused by nuclear power will be considered on the production side.
(2) Electric power production: On the electric power production side, energy industry investment is an important indicator of local energy development and energy project construction. The conversion ability of electric power is another important evaluation index. The electric power production is determined by installed capacity and utilization time, which can comprehensively reflect the operation and production situations of generation projects, so the factors of electric power production are included in this evaluation system. Additionally, the proportion of renewable energy production reflects the improvement of power source structure, which contains thermal power, hydropower, wind power, photovoltaic power, nuclear power and biomass power. Thus, among the influencing factors on electric power production, “energy industry investment”, the “amount of electric power generation” and “proportion of renewable energy production” are chosen.
(3) Electric power consumption: In the aspect of electric power consumption, terminal energy consumption is firstly chosen. Meanwhile, the economic and environmental effects caused by electric power consumption are taken into account. The main economic indexes contain gross domestic product (GDP) and the proportion of secondary industry. The gross domestic product reflects the economic development level which is mainly supported by electric power development level. Because China is still a developing country, the industrial structure represented by proportion of secondary industry describes the health degree and sustainability of economic development. Additionally, the pollutant emission of electric power industry reflects the power consumption in the aspect of environmental impact. In this study, the NOx emission is chosen to replace and express the pollutant emission of electric power industry. Therefore, on the electric power consumption side, “gross domestic product”, “proportion of secondary industry”, “terminal electric power consumption” and “pollutant emission of electric power industry” are adopted.

5. The Utilization of Projection Pursuit Model and Coupling Coordination Model

To evaluate the coordination of Chinese provincial electric power development, the projection pursuit model is used to assess the development level of different electric power industry sides, i.e., electric power resource, electric power production and electric power consumption. Then, the coupling coordination model is chosen to explore the coordination of Chinese provincial electric power development. The basic theories of projection pursuit model and coupling coordination model and the variables setting are as follows.

5.1. Projection Pursuit Model

Projection pursuit model (PPM) was firstly proposed to project the multi-dimensional data of various factors on a single dimension in data analysis [33]. It was widely used in the fields of water quality assessment, urban ecosystem assessment, geochemical survey and so on [34,35,36]. The key advantage of PPM is using a single projection to represent the index features in a system. Thus, the significances of each index can be easily found through this projection. In this paper, there are various industrial factors that influence provincial electric power development. Thus, it can effectively reduce the effects of invalid or small effect factors and make the assessment results more objective. The analysis process of PPM is as follows.
(1) Definition of evaluation system
In Section 4, the evaluation index system of energy development level is presented. The index system of energy resources, energy projects and energy consumptions are defined as R, P and C, respectively. The variables of rij, pij and cij are used to describe the evaluation system (see Table 1) where i stands for the samples and j stands for the specific evaluation factors.
(2) Dimensionless data processing
In this section, the electric power resource system (R) will be taken as an example to state the analysis process of PPM model. To reduce the negative effect of index dimensions, the analysis data need dimensionless processing before function construction. The indexes rij can be classified into three types, i.e., maximum type, minimum type and moderate type. The specific methods are shown via Equations (1)–(3).
r i j = r i j min ( r i j ) max ( r i j ) min ( r i j )
r i j = max ( r i j ) r i j max ( r i j ) min ( r i j )
r i j = { 1 L 1 j r i j max ( L 1 j min ( r i j ) , max ( r i j ) L 2 j ) , min ( r i j ) r i j L 1 j 1 , L 1 j r i j L 2 j 1 r i j L 2 j max ( L 1 j min ( r i j ) , max ( r i j ) L 2 j ) , L 2 j r i j max ( r i j )
Equation (3) will be used to deal with the factor of moderate type which may have a moderate interval setting as [L1j, L2j] in this paper, such as the proportion of secondary industry. Especially, when L1j = L2j, the interval is a point value.
(3) Projection index building
Take liner vector as projection index, and consequently the data are projected from multiple dimensions to single dimension. Assuming that a = (a1, a2, ···, am) is a unit projection vector with m dimensions where m is the quantity of specific factors in the evaluation system, then projection index zi can be calculated via Equation (4).
z i = j = 1 m ( a j × r i j ) , ( i = 1 , ... , n )
where z = (z1, z2, ···, zn) is the eigen value vector, zij = aj × r i j is the projection component of the ith sample on the jth index and aj is its projection direction.
(4) Objective function building
In the building process of objective function, it needs to meet two conditions. The objective function should follow the rules. First, to find the data character of combined structure, the projection value zi can extract the variation information of rij as much as possible and make the convergence spacing of standard deviation Sz to distribute as wide as possible. Second, the local density Dz of projection value zi should reach the maximum value which means that the indexes are relatively concentrated in the same projection space. With the two conditions, the objective function Q(a) is built as shown in Equation (5).
Q ( a ) = S z × D z
The calculation method of Sz is shown in Equation (6) and Dz can be measured via Equations (7)–(10).
S z = ( z i E z ) 2 n 1
D z = ( H h i j ) u ( H h i j )
H = η × S z
h i j = | z i z j | ; i = 1 , .... , n ; j = 1 , .... , n
u = { 1 , H h i j 0 0 , H h i j 0
In Equation (6), Ez is the average value of zi. In Equation (7), the local density Dz can be calculated through H, hij and u. In Equation (8), H stands for the density window width which is determined by data characters. The density window width is usually controlled by the adjustment coefficient η (0.1, 0.01, or 0.001 can be chosen as η ). hij is the distance of eigen value between zi and zj in Equation (9). u is a unit step function in the calculation of Dz.
(5) Projection direction improvement
When the sample values are given, the change of projection index zi is only influenced by projection direction a. Different projection directions reflect different data characters of combined structure. The best projection direction a* can reflect the data character as much as possible which can be calculated via Equation (11).
{ max Q ( a ) = S z × D z a j = 1
All the projection directions aj are unit projection vectors. Through the maximum objective function, the best projection directions a(R)*, a(P)* and a(C)* can be determined in the evaluation systems of electric power resource, electric power production and electric power consumption.
(6) Best projection vector
With best projection directions, the best projection values zi* of each sample can be got via Equation (4). In evaluation system on each electric power side, best projection values form the best projection vector z*. In this paper, z(R)*, z(P)* and z(C)* are used to describe the development levels of Chinese provincial electric power resource, electric power production and electric power consumption.

5.2. Coupling Coordination Model

The concept of coupling coordination was firstly proposed in the field of physics, and is widely used recently [37]. It is used to describe the influencing relations between two systems. In this paper, the systems of energy resources, energy projects and energy consumptions have dynamic coupling correlative mechanism. According to the production process of energy industry, adjacent systems have complicated interactions, such as energy resources to energy projects, and energy projects to energy consumptions. Thus, the coupling coordination is adopted to explore the development levels of each system.
(1) Coupling degree model
Coupling degree model is used to describe the mutual influences between factors in different sides. Taking the coupling degree between electric power resource and electric power production as an example, the coupling degree model can de constructed via Equation (12).
C ( R , P ) = 2 z ( R ) × z ( P ) [ z ( R ) + z ( P ) ] × [ z ( R ) + z ( P ) ]
where C(R,P) stands for the coupling degree index between electric power resource and electric power production in each Chinese province, the range of coupling degree is from 0 to 1; 1 stands for that the two evaluation systems have the best and positive influences to each other, while 0 presents that there are no influences between these two systems. In the provincial power coupling degree evaluation, larger values of C(R,P) show better interactions between systems of electric power resource and electric power production, which means that the power resources are better exploited and the generation projects are well planned. Through the same method, the coupling degree C(P,C) between electric power production and electric power consumption can also be achieved.
(2) Coordination degree model
Coupling degree has a priority to reflect the matching degree between the development levels of each electric power industry side. It also can build a coordination index to assess the development coordination between each side. The coordination degree model is shown in Equation (13).
{ D ( R , P ) = C ( R , P ) × T ( R , P ) T ( R , P ) = σ z ( R ) × θ z ( P ) , σ + θ = 1
where D(R,P) is the coordination degree between electric power resource and electric power production, and T(R,P) is an adjustment coefficient which reflects each industry side’s influence on the coordination degree. In this paper, the values of σ and θ are both set as 0.5. By the same method, T(P,C) can also be calculated. The coordination degree is determined by coupling degree and its adjustment coefficient. Thus, the value of coordination degree will be changed by the annual development levels, which will be a relative value.
(3) Relative development degree
The coupling coordination degree model can represent the system’s interactions and coordination development level. To directly reflect the relations between electric power supply and demand, a relative development degree should be constructed between the systems of energy projects and energy consumptions.
E = z ( P ) / z ( C )
where z(P)* and z(C)* are used to respectively describe the development levels of Chinese provincial electric power production and electric power consumption, respectively, and E is the relative development degree. If E = 1, it means that the provincial electric power production has developed simultaneously with electric power consumption. E > 1 stands for the electric power production can meet the local demand of electric power consumption, and vice versa.

6. Empirical Analysis

6.1. Data Collection

According to the factors of Chinese provincial electric power development levels and their available statistics, the data of Chinese 31 provinces are set as the samples (excluding Hong Kong, Macao and Taiwan). Factors have been chosen to describe the different sides in Chinese provincial electric power development, i.e., “coal resources reserves”, “technical exploitation amount of hydropower resources”,” technical exploitation amount of wind resources (height > 70 m)” and “radiation amount of solar energy” on electric power resource side; “electric power industry investment”, “the amount of electric power generation” and “proportion of renewable energy production” on electric power production side; and “gross domestic product”, “proportion of secondary industry”, “terminal electric power consumption” and “pollutant emission of electric power industry” on electric power consumption side.
To trace the dynamic developments of Chinese provincial electric power industry, the data in 2011 and 2014 are collected as a contrast to analyze the electric power development, and relations between supply and demand in different provinces [38]. The data of electric power resources in 2011 and 2014 were taken from the statistics in 2014 to explore the development potentials of electric power resources. The analyzed data of Chinese provincial electric power development are shown in Table 2.

6.2. Projection Pursuit Analysis

According to Equations (1)–(3), the factors’ data were normalized. From Equations (4)–(11), the projection indexes and objective functions on each electric power industry side have been built. The projection value a* can be calculated as shown in Equation (15). Consequently, the best projection value z* of each province can be measured (see Table 3).
{ a ( R ) = ( 0.31 , 0.17 , 0.68 , 0.23 ) a ( P 2011 ) = ( 0.14 , 0.01 , 0.99 ) a ( C 2011 ) = ( 0.04 , 0.02 , 0.64 , 0.77 ) a ( P 2014 ) = ( 0.75 , 0.42 , 0.51 ) a ( C 2011 ) = ( 0.02 , 0.04 , 0.68 , 0.73 )

6.3. Coupling Coordination Analysis

With the best projection values, the provincial electric power development level can be analyzed by coupling degree, coordination degree and relative development degree. The coupling degree is an overall evaluation index which can represent the matching level between each electric power industry side. The coordination degree is more specific to describe the provincial coordination level between each electric power industry side based on the coupling degree. The relative development degree is set from the supply and demand perspective to evaluate whether the provincial electric power production can fit the local power demand. Specific analyses of these three degrees are as follows.

6.3.1. Coupling Degree

The electric power coupling degree between resource side and production side C(R,P) and the one between production side and consumption side C(P,C) can be calculated via Equation (12). The calculation results of coupling degrees are shown in Equation (16).
{ C ( R , P 2011 ) = 0.793 C ( R , P 2014 ) = 0.678 C ( P 2011 , C 2011 ) = 0.797 C ( P 2014 , C 2014 ) = 0.894
On the electric power resource side, the projection value of power resource a(R)* = (0.31, 0.17, 0.68, 0.23) is mainly represented by wind power resources (0.68). However, the situations on electric power production side from 2011 to 2014 have greatly changed. From the projection value of power production a(P)* in Equation (15), a(P-2011)* = (0.14, 0.01, 0.99) is determined by the proportion of renewable energy production (0.99). However, in 2014, a(P-2014)* = (0.75, 0.42, 0.51) is comprehensively influenced by energy industry investment (0.75), electric energy production and proportion of renewable energy production (0.51). Facing with the increase of renewable power projects construction, a single kind of energy exploitation cannot meet its demand. Consequently, C(R,P-2014) (0.678) has declined compared with C(R,P-2011) (0.793) in Equation (16). The generation resources restructuring leads a short-time decline of C(R,P).
On the contrary, the coupling degrees C(P,C) between electric power production and electric power consumption have increased stably. The electric power consumption and the pollutant emissions are still concerned on consumption side. This phenomenon indicates that the relations between electric power production and electric power consumption become closer and the coupling trend of these two sides has improved gradually. Considering multiple energy supply and generation efficiency promotion, it is worth noting that the generation projects should be planned reasonably in the future to avoid overcapacity.

6.3.2. Coordination Degree

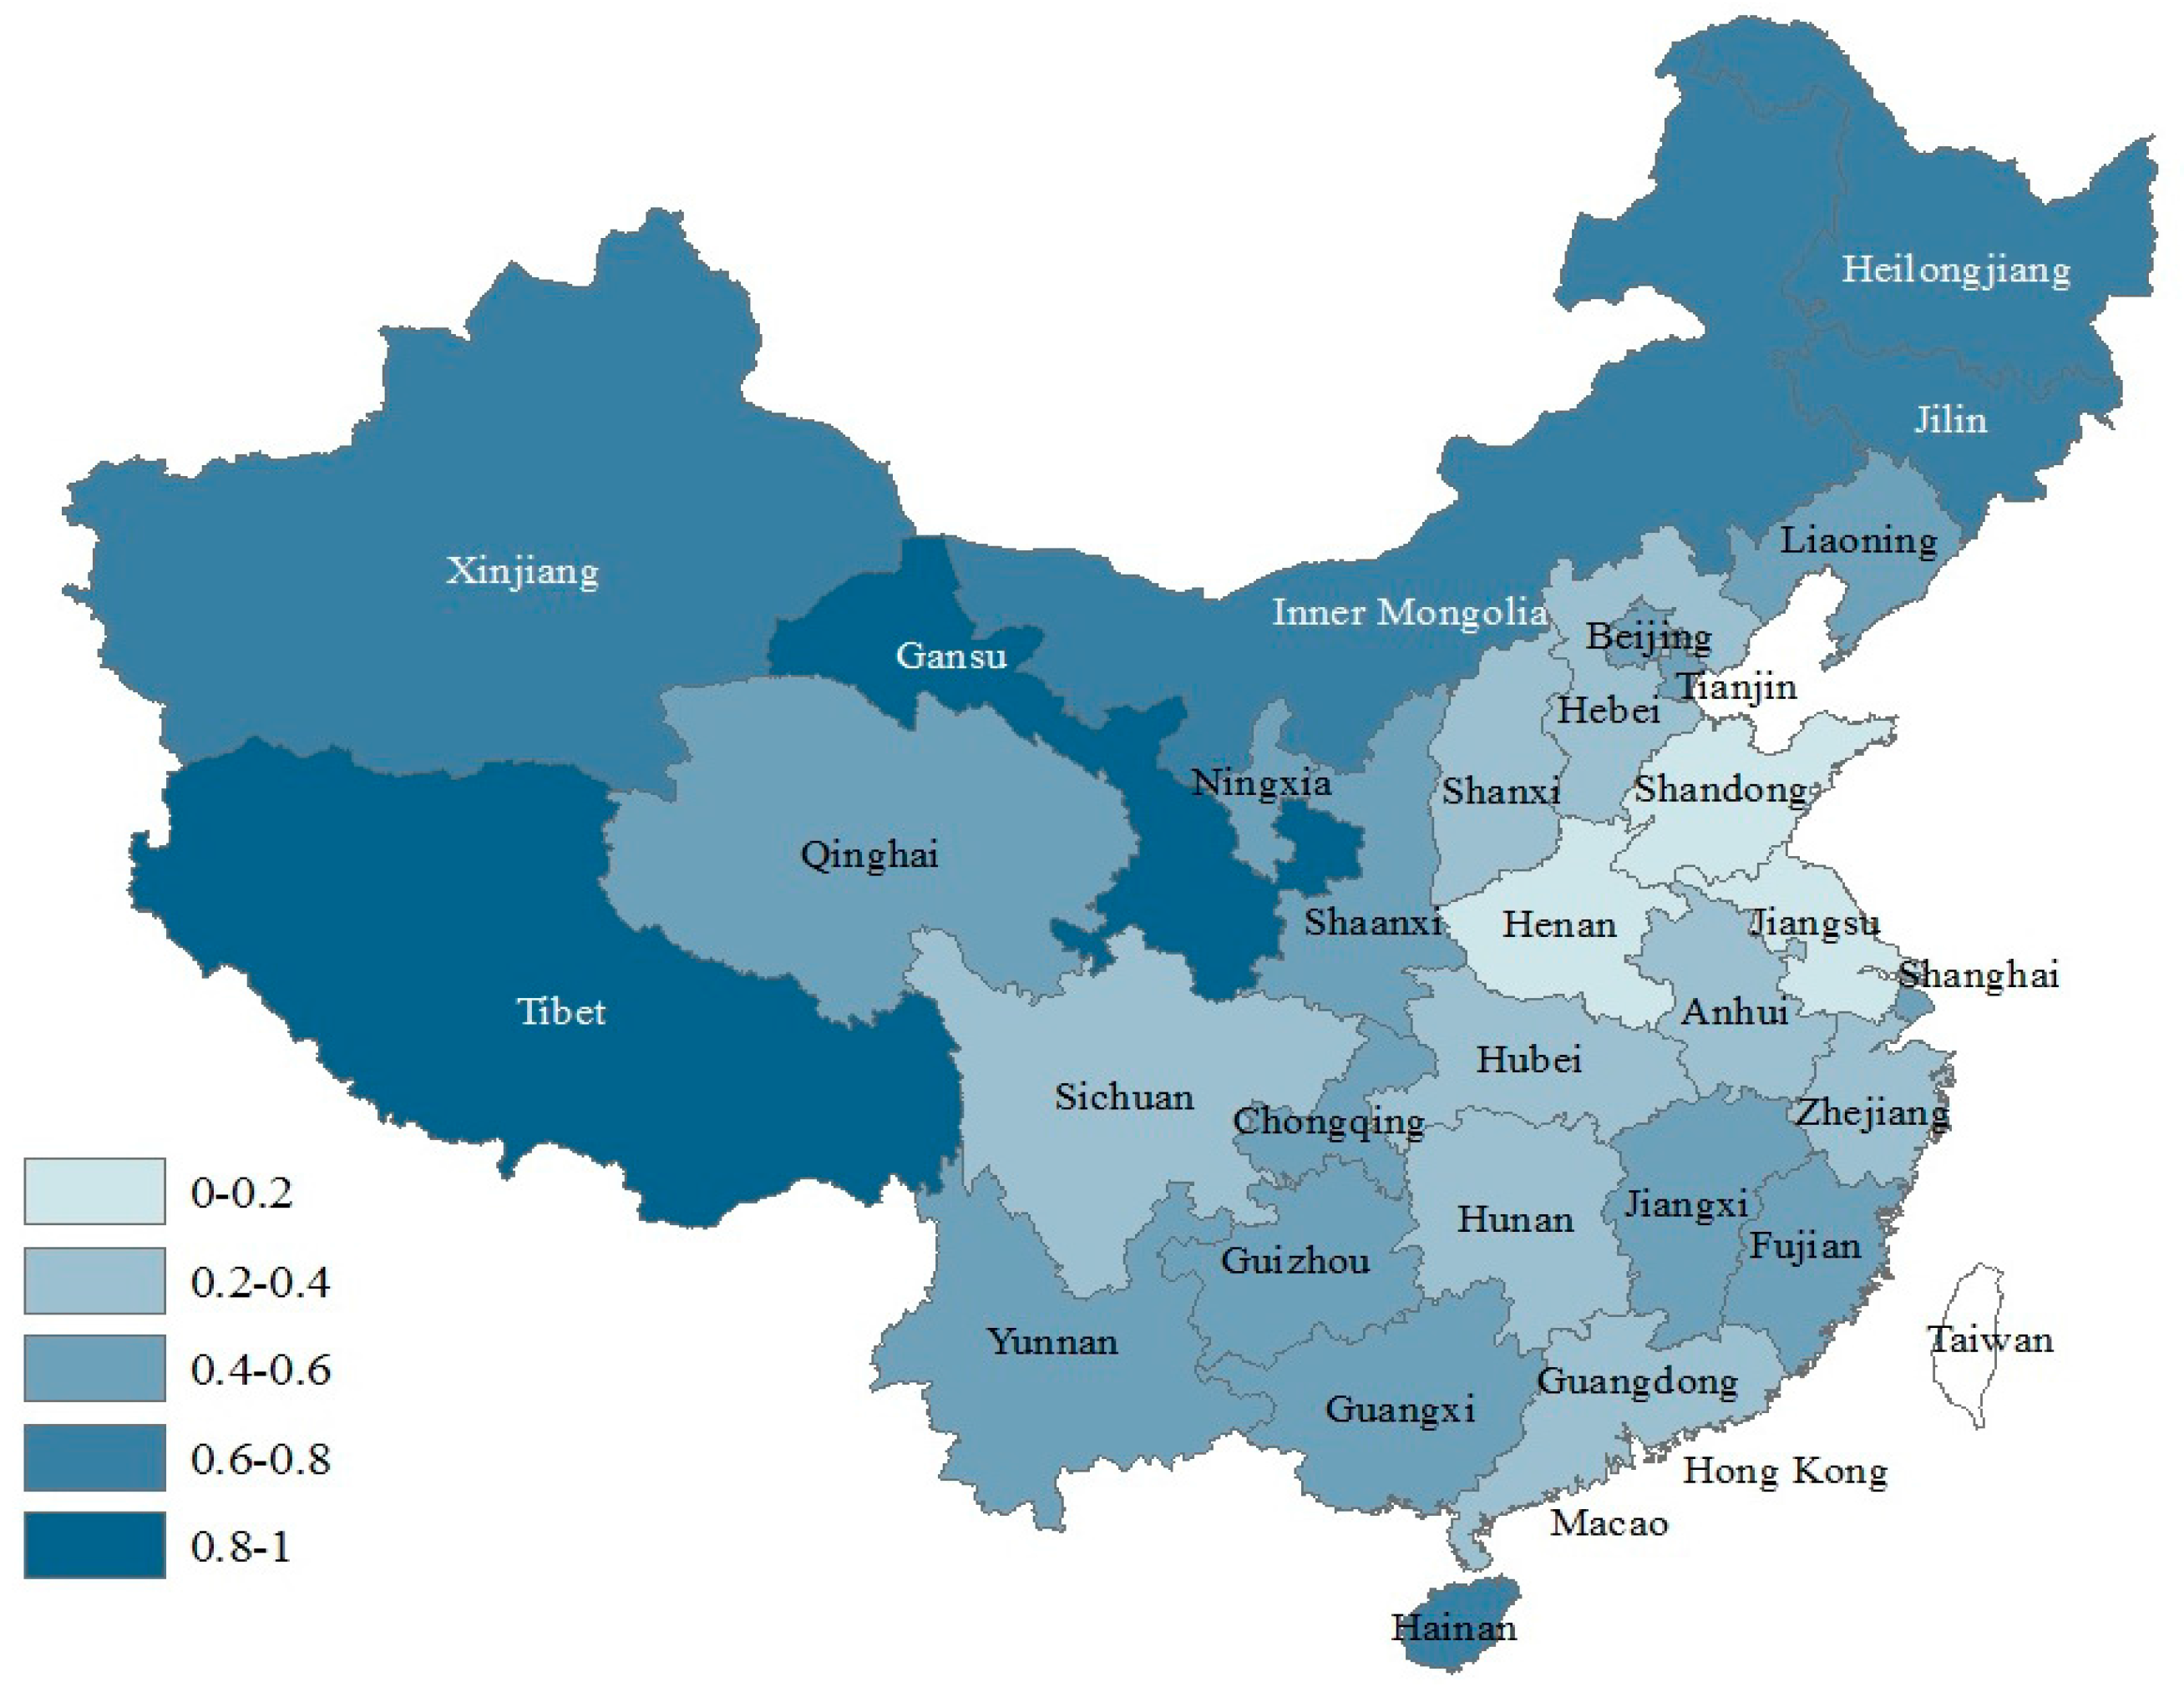
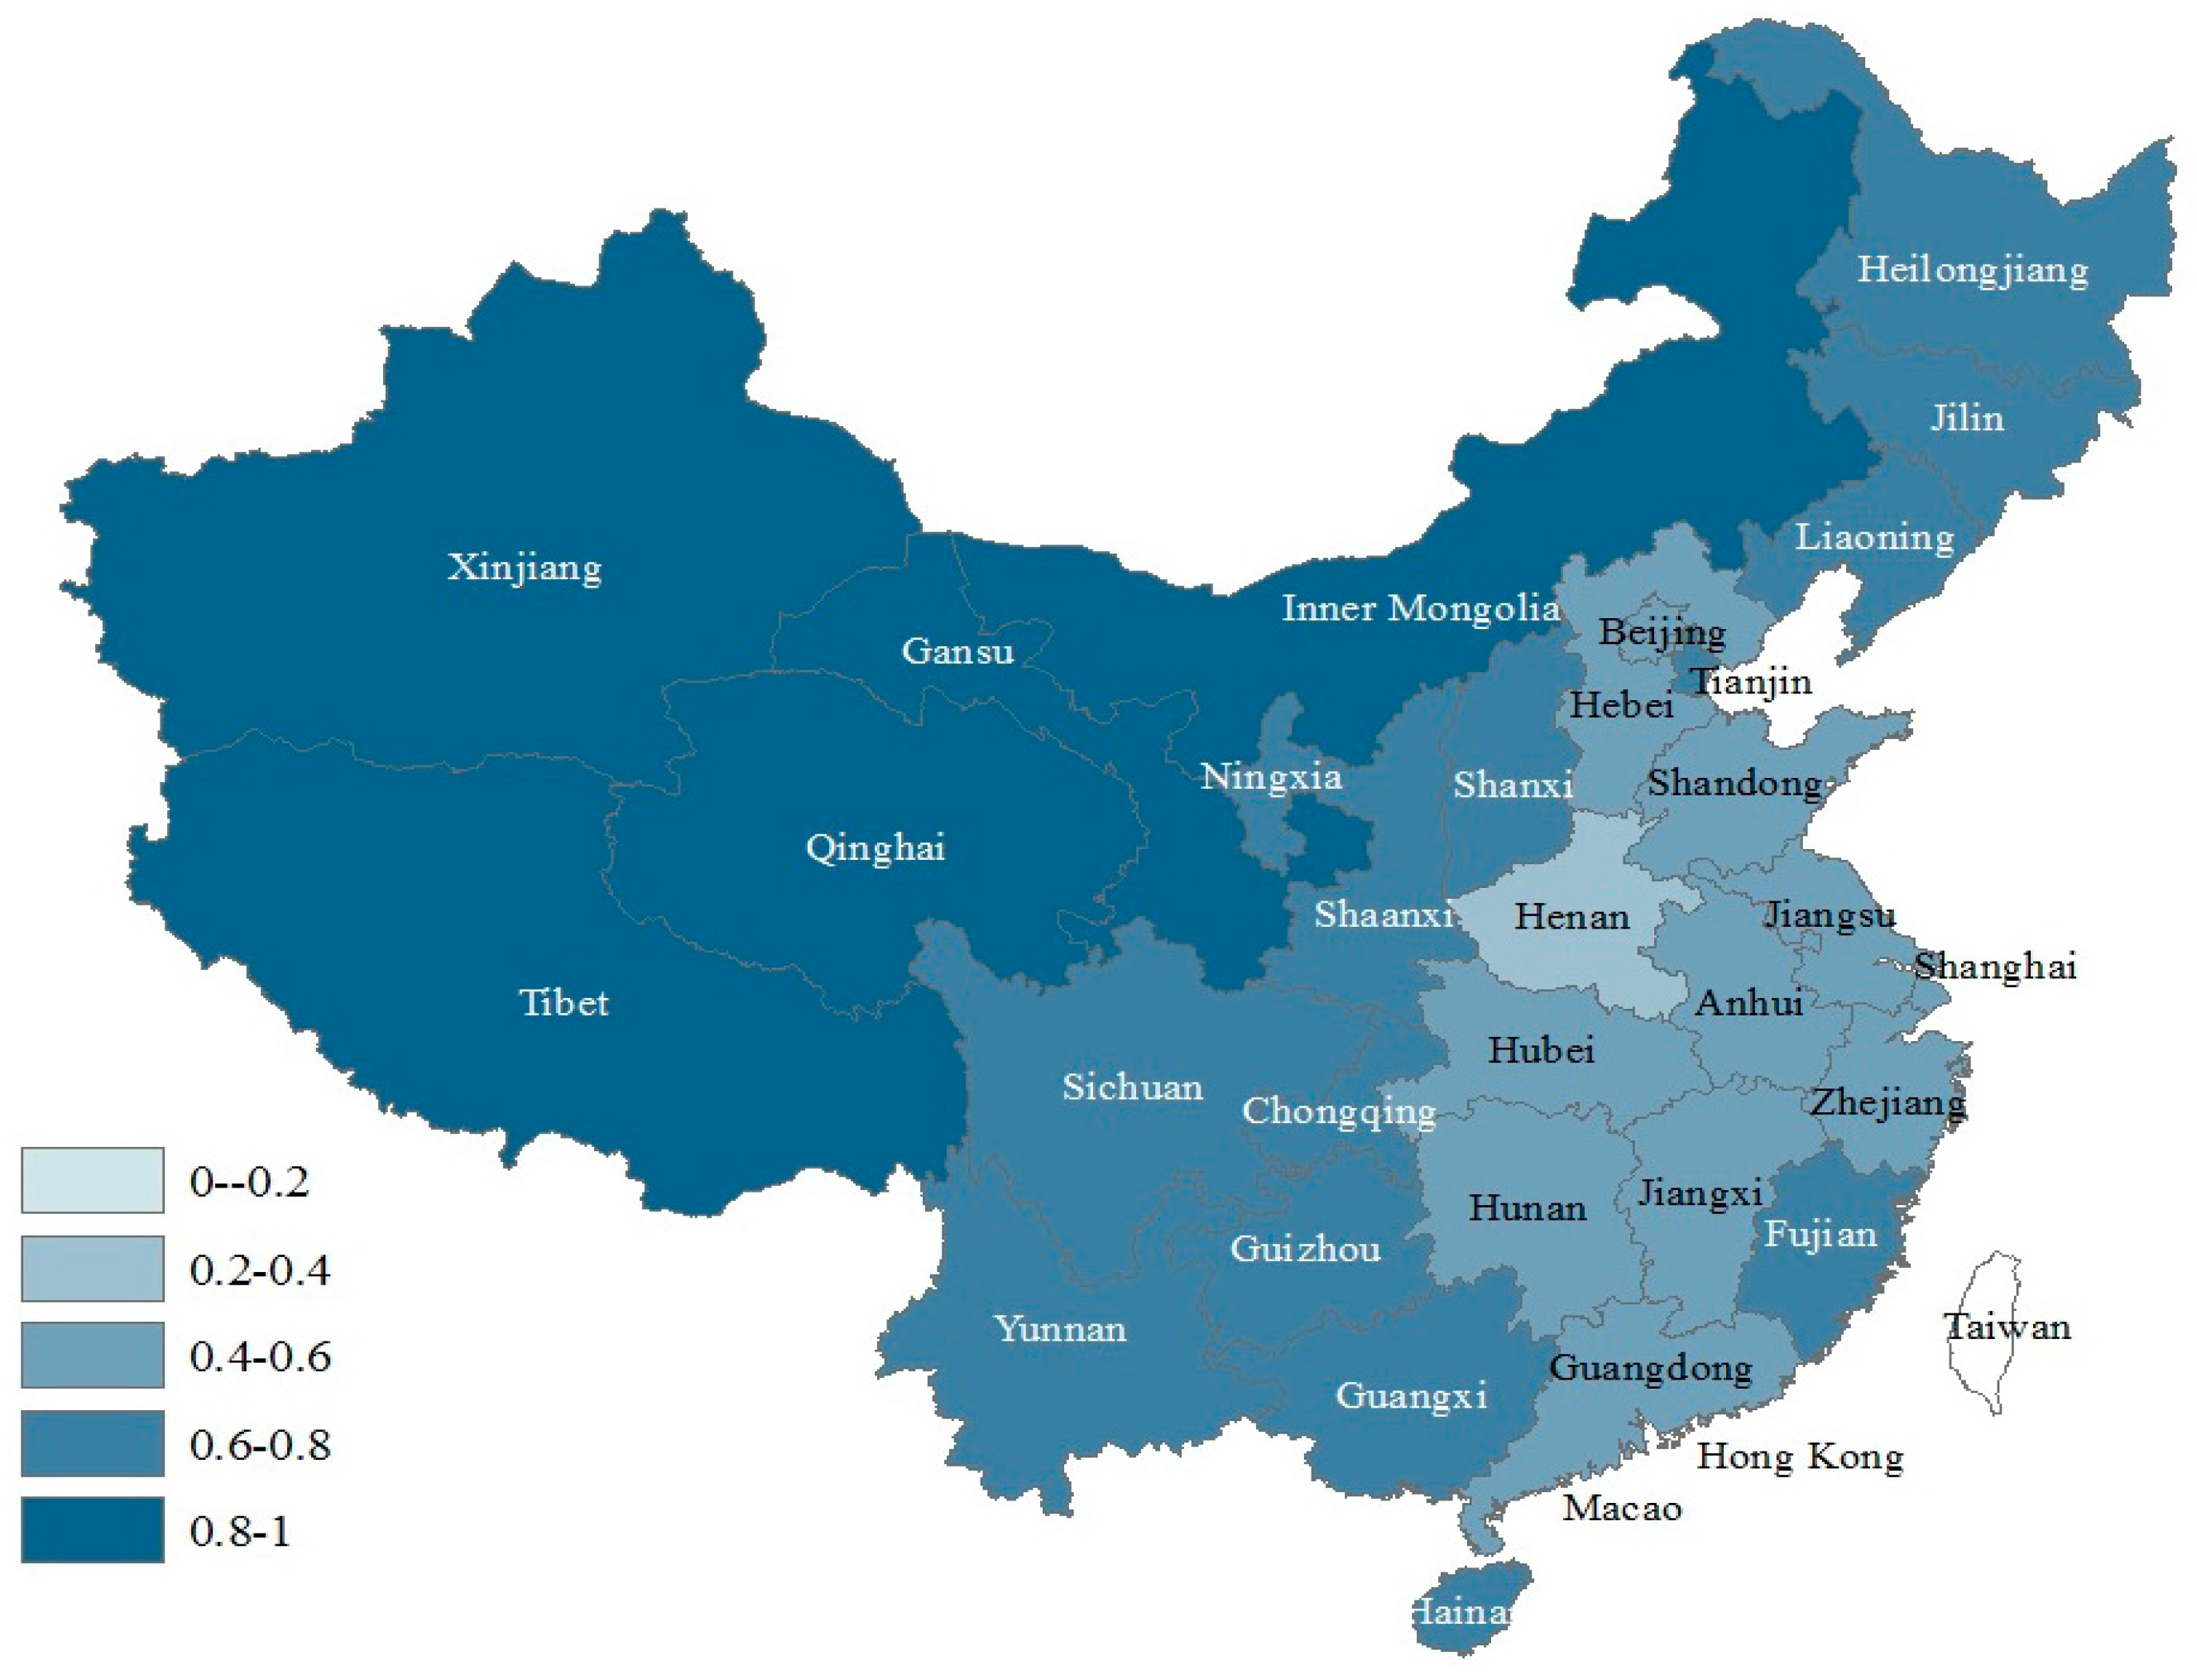
Based on the results of coupling degrees, the coordination degrees can also be measured. To observe the dynamics of Chinese province electric power development, the coordination degrees between power resource and power production and the one between power production and power consumption are described in Figure 4, Figure 5, Figure 6 and Figure 7 using ArcGIS.
From the coordination degree results, the coordination degrees D(R,P-2011) in Figure 4 and D(R,P-2014) in Figure 5 show the degree changes between provincial power resource and power production. Inner Mongolia has the best coordination (0.848 in 2011 and 0.868 in 2014) between power resource and power production due to its abundant coal and wind power resources. Meanwhile, the mature technology of extra-high voltage (EHV) provides a possibility for power transmission across regions that facilitate more generation projects constructing in Inner Mongolia. This is the reason why Inner Mongolia has the best coordination degree between power resource side and power production side. Meanwhile, the overall coordination degree between power resource and power production has improved in China, which is related to the multiple energy supply and development plans. Moreover, influenced by the increasing renewable energy projects, the coordination degrees between power resource and power production were increasing year by year in the coal-scarce provinces, such as Sichuan (0.040 in 2011 and 0.253 in 2014), Yunnan (0.066 in 2011 and 0.245 in 2014) and Guangdong (0.055 in 2011 and 0.256 in 2014).
On the aspect of coordination degree D(P,C), the areas with high coordination degrees (>0.6) have increased from seven in 2011 to 18 in 2014. Reviewing the construction process of power generation projects in recent years, different provinces exploited power energy nearby according to the local energy reserves. For example, in 2015, solar energy was fully developed in Xinjiang, and its newly installed capacity of photovoltaic plant reached 1.31 GW [39]. Considering the hydropower resource, the average increasing speed of installed hydropower capacity keeps at 15.6% in the 12th five year plan period. Additionally, the wind power projects have also been widely built in Northeast China, Northwest China and North China. The initial construction of multiple power energy supply structure is the prerequisite of coordination degree promotion between power production and power consumption. Meanwhile, it obviously shows that the provincial coordination degrees between power production and power consumption are still relatively low in southeast areas, such as Shandong (0.127 in 2011 and 0.456 in 2014), Jiangsu (0.195 in 2011 and 0.472 in 2014), and Guangdong (0.209 in 2011 and 0.505 in 2014). How to meet their energy demand is an important issue to be solved in the 13th five year plan (from 2016 to 2020).

6.3.3. Relative Development Degree

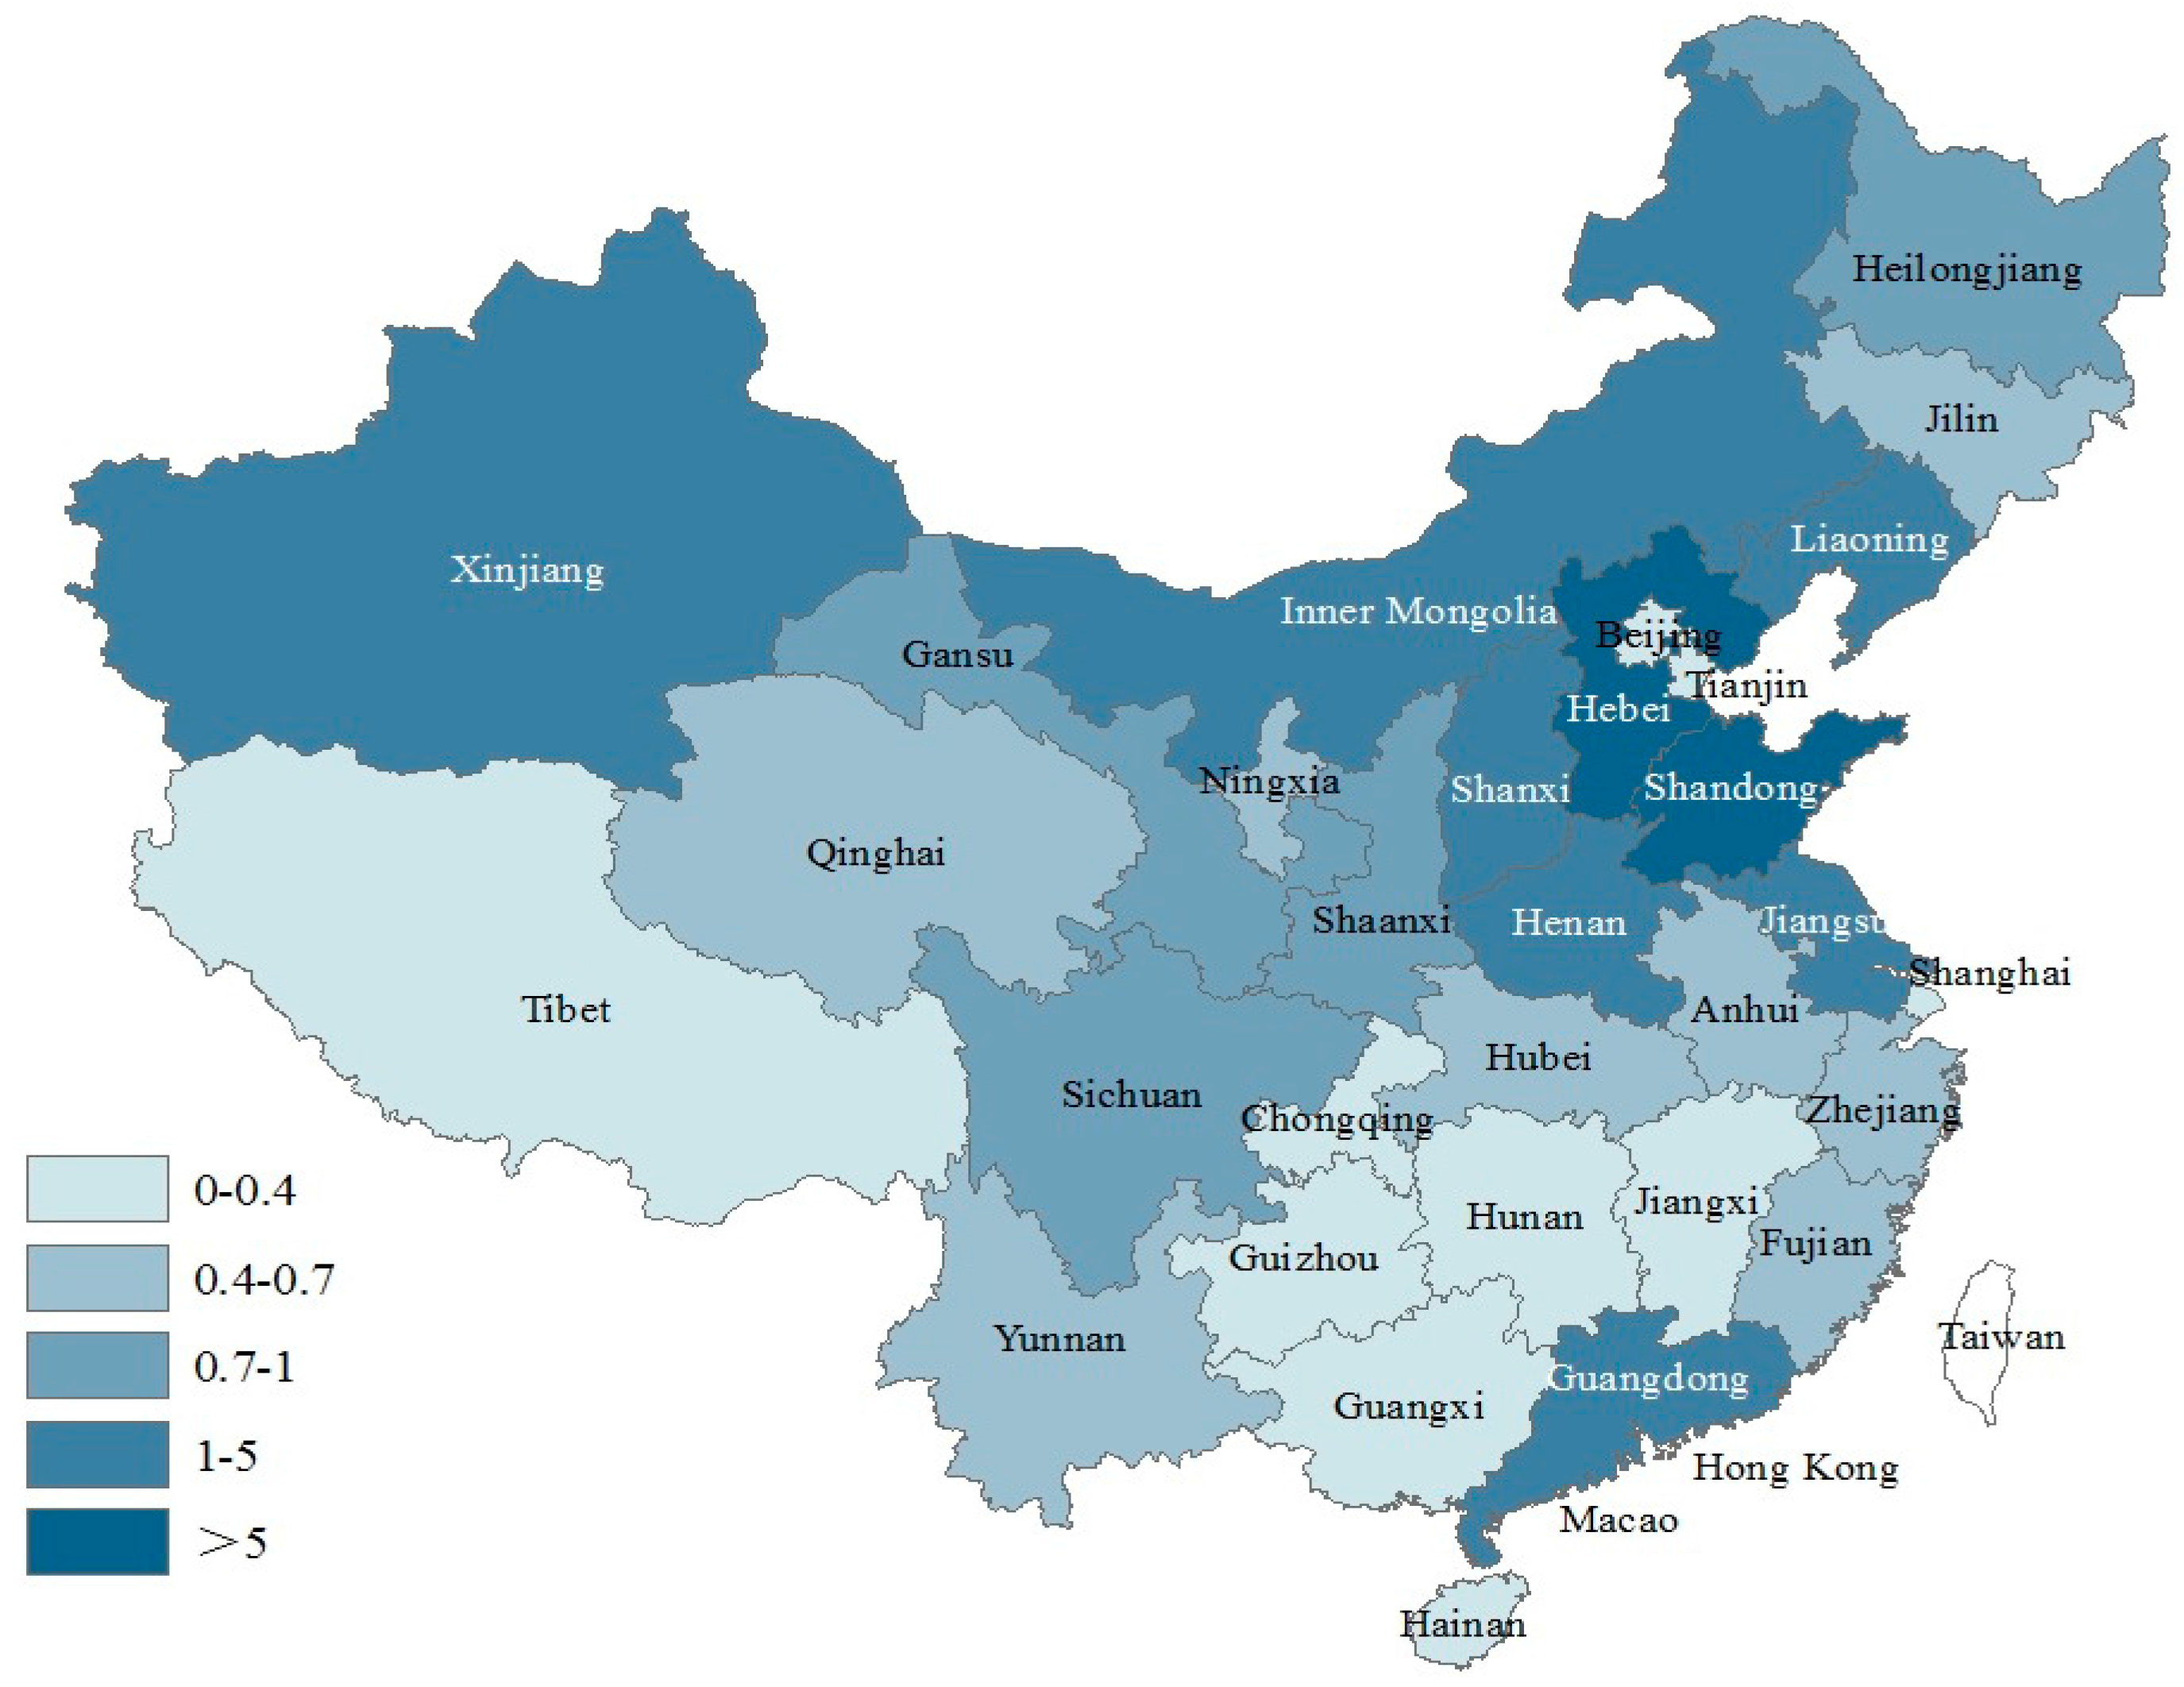
Based on the results of coordination degrees, it obviously shows that the Chinese provincial energy developments have improved gradually. However, to explore the relations between electric power supply and demand, the relative development degrees (RDD) must be built to test the provincial power generation and consumption (Figure 8 and Figure 9).
From the aspect of RDD in 2011, only four provinces can provide enough electric power for their local power consumption: Shandong (5.24), Hebei (3.39), Inner Mongolia (2.06), and Liaoning (1.14). With multiple power energy development and extra-high voltage (EHV) electric grid construction, electric power was transferred across regions in recent years, such as solar energy in Xinjiang, wind power in Inner Mongolia, and hydropower in Sichuan and Yunnan. Meanwhile, the provinces with large power consumption are positively promoting power generation projects development and construction. Much capital is invested into the provinces with abundant power resources. For example, Guangdong Menshine New Energy Technology Corp., LTD invested 5.62 billion Yuan to build storage stations, wind power plants, photovoltaic plants and photo-thermal plants in Shaanxi. These plans are undoubtedly a strong driving force for the implementation of multiple power resources exploitation and the optimization of power supply structure. Such power generation projects were not constructed in Guangdong, but its RDD has improved obviously via the electric power industry investment. As a result, Guangdong’s RDD between power supply and demand in 2014 has stood at 1.94. The RDDs in North China, Southwest China, and Southeast China have also made progressed during 2011 to 2014, which indicates that Chinese electric power industry development has entered a rapidly growing stage. During the 13th five year plan period, generation projects construction of multiple power resources and coordinated development on each electric power industry side will still play vital roles in Chinese provincial electric power industry development. The power generation efficiency needs further improvement considering the requirements of economic development and the constraints of environmental problems.

7. Discussions

Through the empirical study, the effectiveness of projection and coupling models were proven. It is useful for government and enterprises to judge whether power resources are exploited rationally through coordination degrees between resource side and production side, and whether the local power generation can suit the power consumption. According to the analysis results and the national power reform path, to realize coordinated development of electric power industry in China, new actions should be taken in each electric power industrial side to promote provincial power development and coordination levels.

7.1. Technical Support on Electric Power Resource Side

Facing the tight energy supply situation in China, popularizing power conserving technology and eliminating or altering high energy consumption equipment are common ways to reduce electric power consumption [40]. Considering sustainability, building a complex supply system with various power resources is a trend in electric power industry development on resource supply side. With the promotion of management, the accumulation of production experience and the progress of technology innovation, the generation and scheduling problems have been improved gradually in recent years, such as reducing the proportion of abandoned wind power and solar energy, electrochemical energy storage technology application and the efficient promotion of power energy conversion [41,42,43]. However, systematic technical standards must improved in China to provide technical support on power resource development. Ensuring reasonable and multiple power resource development by technical driving is the first step to realize the coordination development on power production side and power consumption side. From the proposed National Science and Technology Innovation Plan during the national 13th Five-Year Plan in 2016, more research and development will be focused on solar cells, solar-thermal power generation, solar heating and refrigeration, advanced large wind turbines, liquid fuels and so on [44]. China’s government has determined technology development path and research direction at the side of power resources.

7.2. Project Approval and Supervision on Electric Power Production Side

Through the coordination analysis results between the provincial electric power resource and electric power production, it can be found that the distribution of generation projects tend to be rational by the guidance of plans and policies in recent years, such as Energy Development Strategy Action Plan 2014–2020 [45]. However, influenced by the global economic crisis, the electric power demand remains low. The overcapacity of power generation projects should be avoided in advance, especially thermal power projects. Different to the positive financial policy in the previous development period, strengthening the approvals of to-be-built generation projects by central and provincial governments and promoting the generation efficiency by supervising the constructed projects can improve the development coordination of electric power industry [46]. Meanwhile, the exploitation and utilization of renewable power energy should be encouraged and its proportion in energy supply and consumption structure should be increased to reach middle- and long-term emission reduction target.

7.3. Demand Side Management (DSM) on Electric Power Consumption Side

At present, demand side management (DSM) is widely used in electric power market which is a mitigating tool for peak load management of smart grid [47]. The demand side management (DSM) mode should be fully implemented on electric power consumption side which can improve the stability of power supply and guide the optimal allocation of electric power resources by consumers’ on-time responses. The flexible feedback mechanism can also provide references for generation project construction and investment [48]. Through tariff variation and incentive measures, consumers can choose flexible pattern, which may increase the utilization efficiency of electric power. In turn, the generation project construction and investment strategies will be adjusted timely by load forecasting [49,50], which suits both traditional and renewable generation resource development. Another advantage of DSM is making structural rationalization in other industries. As an energy supply section, the electric power shall flow to the industries with higher energy efficiency level and the provinces with higher coordination degree between power supply side and demand side [51]. During the 13th Five-Year Plan period, Chinese provincial governments should continue to make more specific and suitable guidelines for DSM. Bilateral promotions from supply and demand sides will be realized by promoting the development levels and the coordination between each industrial side.

8. Conclusions

Understanding the development level and exploring the coordination between each side of the industrial chain are important to the sustainable development of electric power industry and energy efficiency promotion in China. This study took 31 Chinese provinces as samples to analyze the provincial electric power development coordination. Considering Chinese electric power industry structure, quantitative evaluation factors were collected from electric power resource side, electric power production side and electric power consumption side. Based on the influencing factors, projection pursuit model was used to describe the development levels of provincial electric power industries. Then, through the indexes of coupling degree, coordination degree and relative development degree, the coupling coordination model was employed to explore the coordination relations between electric power resource and electric power production, electric power production and electric power consumption. The calculation results showed that the coupling degree between electric power resource and electric power production in China was slightly decreased from 2011 (0.793) to 2014 (0.678) due to accessing more renewable power energy in recent years. However, the number of provinces with better coordination degree and relative development degree has increased from seven in 2011 to 18 in 2014. The coordinative areas have widened from the western regions to the eastern regions, which reflects the initial achievement of Chinese electric power industry reform. Combined with provincial analysis results, optimal measures were proposed from the aspects of technical support, project approval and supervision, and demand side management (DSM). The paper provides useful references for China to realize the reasonable distribution of power resources, the sustainable development of provincial power industry and the national improvement of generation efficiency. Formatting a dynamic evaluation mechanism and observing the changes of Chinese provincial electric power development will be further explored in the future.

Acknowledgments

This study is supported by the Canada-China Scholar Exchange Programme (CCSEP), China Scholarship Council (No. 201606735039) and the Fundamental Research Funds for the Central Universities (2015XS47).

Author Contributions

Jiang Zhu and Zhenyu Zhao conceived and designed the experiments; Jiang Zhu performed the experiments; Jiang Zhu and Zhenyu Zhao analyzed the data; Jiang Zhu contributed reagents/materials/analysis tools; Jiang Zhu and Zhenyu Zhao wrote the paper.

Conflicts of Interest

We have no conflicts of interest to declare.

References

  1. Department of Energy Statistics, National Bureau of Statistics of China. Generating Equipments’ Average Availability Hours of Different Energies (>6 MW) in 2015. Available online: http://www.gov.cn/xinwen/2016-01/29/content_5037241.htm (accessed on 29 January 2016).
  2. China Electricity Council. China’s Average Utilization Hours of Power Generation Equipments (>6 MW) Have Dropped to 3696. Available online: http://www.askci.com/news/chanye/2016/02/01/94221ojn5.shtml (accessed on 1 February 2016).
  3. China Renewable Energy Engineering Institute. Statistical Report of Chinese Wind Power Construction in 2015. Available online: http://news.bjx.com.cn/html/20160429/729523.shtml (accessed on 29 April 2016).
  4. China Photovoltaic Industry Association. China’s Photovoltaic Industry Development Analysis in 2015. Available online: http://mt.sohu.com/20160122/n435468897.shtml (accessed on 22 January 2016).
  5. BP Amoco. BP Statistical Review of World Energy 2015. Available online: http://www.bp.com/content/dam/bp/pdf/Energy-economics/statistical-review-2015/bp-statistical-review-of-world-energy-2015-full-report.pdf (accessed on 10 June 2015).
  6. Zhao, Z.; Zuo, J.; Feng, T.; Zillante, G. Impacts of renewable energy regulations on structure of power generation in China—A critical analysis. Renew. Energy 2016, 36, 24–30. [Google Scholar] [CrossRef]
  7. Zhao, X.; Li, S.; Zhang, S.; Yang, R.; Liu, S. The effectiveness of China’s wind power policy: An empirical analysis. Energy Policy 2016, 95, 269–279. [Google Scholar] [CrossRef]
  8. Wu, T.; Zhou, W.; Yan, X.; Ou, X. Optimal policy design for photovoltaic power industry with positive externality in China. Resources. Conserv. Recycl. 2016, 115, 22–30. [Google Scholar] [CrossRef]
  9. Zeng, M.; Yang, Y.; Wang, L.; Sun, J. The power industry reform in China 2015: Policies, evaluations and solutions. Renew. Sustain. Energy Rev. 2016, 57, 94–110. [Google Scholar] [CrossRef]
  10. Zhao, G.; Guerrero, J.M.; Pei, Y. Marginal generation technology in the Chinese power market towards 2030 based on consequential life cycle assessment. Energies 2016, 9, 788. [Google Scholar] [CrossRef]
  11. Guo, X.; Zhu, Q.; Lv, L.; Chu, J.; Wu, J. Efficiency evaluation of regional energy saving and emission reduction in China: A modified slacks-based measure approach. J. Clean. Prod. 2017, 140, 1313–1321. [Google Scholar] [CrossRef]
  12. Li, H.; Li, G.; Wu, Y.; Wang, Z.; Wang, J. Operation modeling of power systems integrated with large-scale new energy sources. Energies 2016, 9, 810. [Google Scholar] [CrossRef]
  13. Tao, X.; Wang, P.; Zhu, B. Measuring the interprovincial CO2 emissions considering electric power dispatching in China: From production and consumption perspectives. Sustainability 2016, 8, 506. [Google Scholar] [CrossRef]
  14. Sun, W.; Xu, Y. Research on China’s Energy Supply and Demand Using an Improved Grey-Markov Chain Model Based on Wavelet Transform. Available online: http://ac.els-cdn.com/S0360544216315663/1-s2.0-S0360544216315663-main.pdf?_tid=b24f6456-cf31-11e6-8884-00000aab0f02&acdnat=1483172483_7e1e609037949683123e83a131c57de5 (accessed on 11 November 2016).
  15. De Castro Camioto, F.; Moralles, H.F.; Mariano, E.B.; do Nascimento Rebelatto, D.A. Energy efficiency analysis of G7 and BRICS considering total-factor structure. J. Clean. Prod. 2016, 122, 67–77. [Google Scholar] [CrossRef]
  16. Yu, X.; Moreno-Cruz, J.; Crittenden, J.C. Regional energy rebound effect: The impact of economy-wide and sector level energy efficiency improvement in Georgia, USA. Energy Policy 2015, 87, 250–259. [Google Scholar] [CrossRef]
  17. Suzuki, S.; Nijkamp, P. An evaluation of energy-environment-economic efficiency for EU, APEC and ASEAN countries: Design of a Target-Oriented DFM model with fixed factors in Data Envelopment Analysis. Energy Policy 2016, 88, 100–112. [Google Scholar] [CrossRef]
  18. Huang, Y.; Bor, Y.J.; Peng, C.-Y. The long-term forecast of Taiwan’s energy supply and demand: LEAP model application. Energy Policy 2011, 39, 6790–6803. [Google Scholar] [CrossRef]
  19. Cosmi, C.; Dvarionienë, J.; Marques, I.; Di Leo, S.; Gecevičius, G.; Gurauskienė, I.; Mendes, G.; Selada, C. A holistic approach to sustainable energy development at regional level: The RENERGY self-assessment methodology. Renew. Sustain. Energy Rev. 2015, 49, 693–707. [Google Scholar] [CrossRef]
  20. Mauky, E.; Fabian Jacobi, H.; Liebetrau, J.; Nelles, M. Flexible biogas production for demand-driven energy supply—Feeding strategies and types of substrates. Bioresource Technol. 2015, 178, 262–269. [Google Scholar] [CrossRef] [PubMed]
  21. Wang, R.; Wang, P.; Xiao, G.; Gong, S. Power demand and supply management in microgrids with uncertainties of renewable energies. Int. J. Electr. Power Energy Syst. 2014, 63, 260–269. [Google Scholar] [CrossRef]
  22. Liu, F.; Lv, T.; Sajid, M.; Li, X. Optimization for China’s coal flow based on matching supply and demand sides. Resour. Conserv. Recycl. 2016, in press. [Google Scholar] [CrossRef]
  23. Spalding-Fecher, R.; Senatla, M.; Yamba, F.; Lukwesa, B.; Himunzowa, G.; Heaps, C.; Chapman, A.; Mahumane, G.; Tembo, B.; Nyambe, I. Electricity supply and demand scenarios for the Southern African power pool. Energy Policy 2016, in press. [Google Scholar] [CrossRef]
  24. Quiggin, D.; Buswell, R. The implications of heat electrification on national electrical supply-demand balance under published 2050 energy scenarios. Energy 2016, 98, 253–270. [Google Scholar] [CrossRef] [Green Version]
  25. Zha, Y.; Zhao, L.; Bian, Y. Measuring regional efficiency of energy and carbon dioxide emissions in China: A chance constrained DEA approach. Comput. Oper. Res. 2016, 66, 351–361. [Google Scholar] [CrossRef]
  26. Viholainena, J.; Luoranenb, M.; Väisänenb, S.; Nikkanen, A.; Horttanainen, M.; Soukka, R. Regional level approach for increasing energy efficiency. Appl. Energy 2016, 163, 295–303. [Google Scholar] [CrossRef]
  27. Peng, L.; Zhang, Y.; Wang, Y.; Zeng, X.; Peng, N.; Yu, A. Energy efficiency and influencing factor analysis in the overall Chinese textile industry. Energy 2015, 93, 1222–1229. [Google Scholar] [CrossRef]
  28. Özkara, Y.; Atak, M. Regional total-factor energy efficiency and electricity saving potential of manufacturing industry in Turkey. Energy 2015, 93, 495–510. [Google Scholar] [CrossRef]
  29. Akritas, M.G. Projection pursuit multi-index (PPMI) models. Stat. Probab. Lett. 2016, 114, 99–103. [Google Scholar] [CrossRef]
  30. Xia, C.; Li, Y.; Ye, Y.; Shi, Z. An integrated approach to explore the relationship among economic, construction land use, and ecology subsystems in Zhejiang Province, China. Sustainability 2016, 8, 498. [Google Scholar] [CrossRef]
  31. Wu, Y.; Zhang, W. The driving factors behind coal demand in China from 1997 to 2012: An empirical study of input-output structural decomposition analysis. Energy Policy 2016, 95, 126–134. [Google Scholar] [CrossRef]
  32. National Bureau of Statistic of the People’s Republic of China. The National Economic and Social Development Statistical Bulletin in 2014; China Statistics Press: Beijing, China, 2015.
  33. Friedman, J.H.; Stuetzle, W. Projection Pursuit Methods for Data Analysis; Academic Press: London, UK, 1982; pp. 123–147. [Google Scholar]
  34. Zhang, C.; Dong, S. A new water quality assessment model based on projection pursuit technique. J. Environ. Sci. 2009, 21, 154–157. [Google Scholar] [CrossRef]
  35. Shao, X.H.; Hou, M.M.; Chen, L.H.; Chang, T.T.; Wang, W.N. Evaluation of subsurface drainage design based on projection pursuit. Energy Procedia 2012, 16 Pt B, 747–752. [Google Scholar] [CrossRef]
  36. Xiao, F.; Chen, J. Fractal projection pursuit classification model applied to geochemical survey data. Comput. Geosci. 2012, 45, 75–81. [Google Scholar] [CrossRef]
  37. Tang, Z. An integrated approach to evaluating the coupling coordination between tourism and the environment. Tour. Manag. 2015, 46, 11–19. [Google Scholar] [CrossRef]
  38. National Bureau of Statistics of the People’s Republic of China. China Energy Statistical Yearbook 2014; China Statistics Press: Beijing, China, 2015.
  39. Chinese Academy of Social Sciences (CASS). World Energy China Outlook 2014–2015. Available online: http://sky.cssn.cn/gj/gj_qkzz/201505/t20150509_1763714.shtm (accessed on 26 March 2015).
  40. Cao, X.; Wen, Z.; Chen, J.; Li, H. Contributing to differentiated technology policy-making on the promotion of energy efficiency technologies in heavy industrial sector: A case study of China. J. Clean. Prod. 2016, 112, 1486–1497. [Google Scholar] [CrossRef]
  41. Li, C.B.; Chen, H.Y.; Zhu, J.; Zuo, J.; Zillante, G.; Zhao, Z.Y. Comprehensive assessment of flexibility of wind power industry chain. Renew. Energy 2015, 74, 18–26. [Google Scholar] [CrossRef]
  42. Vlad, C.; Barbu, M.; Vilanova, R. Intelligence control of a distributed generation system based on renewable sources. Sustainability 2016, 8, 748. [Google Scholar] [CrossRef]
  43. Zhao, Z.; Zhu, J.; Zuo, J. Flexibility of wind power industry chain for environmental turbulence: A matching model study. Renew. Energy 2015, 83, 375–397. [Google Scholar] [CrossRef]
  44. The State Council. National Science and Technology Innovation Plan during the 13th Five-Year Period. Available online: http://www.gov.cn/zhengce/content/2016-08/08/ content_5098072.htm (accessed on 8 August 2016).
  45. General Office of the State Council (GOSC). Energy Development Strategy Action Plan 2014–2020. Available online: http://www.gov.cn/zhengce/content/2014-11/19/content_9222.htm (accessed on 19 November 2014).
  46. National Energy Administration (NEA). Key Points of Market Supervision in 2016. Available online: http://www.nea.gov.cn/2016-04/08/c_135261215.htm (accessed on 8 April 2016).
  47. Thakur, J.; Chakraborty, B. Demand side management in developing nations: A mitigating tool for energy imbalance and peak load management. Energy 2016, 114, 895–912. [Google Scholar] [CrossRef]
  48. Zhao, Z.; Zhu, J.; Zuo, J. Sustainable development of the wind power industry in a complex environment: A flexibility study. Energy Policy 2014, 75, 392–397. [Google Scholar] [CrossRef]
  49. Hippert, H.S.; Pedreira, C.E.; Souza, R.C. Neural networks for short-term load forecasting: A review and evaluation. IEEE Trans. Power Syst. 2001, 16, 44–55. [Google Scholar] [CrossRef]
  50. Tepedino, C.; Guarnaccia, C.; Iliev, S.; Popova, S.B.; Quartieri, J. A forecasting model based on time series analysis applied to electrical energy consumption. Int. J. Math. Models Methods Appl. Sci. 2015, 9, 432–445. [Google Scholar]
  51. Liu, J.; Wang, L.; Qiu, M.; Zhu, J. Promotion potentiality and optimal strategies analysis of provincial energy efficiency in China. Sustainability 2016, 8, 741. [Google Scholar] [CrossRef]
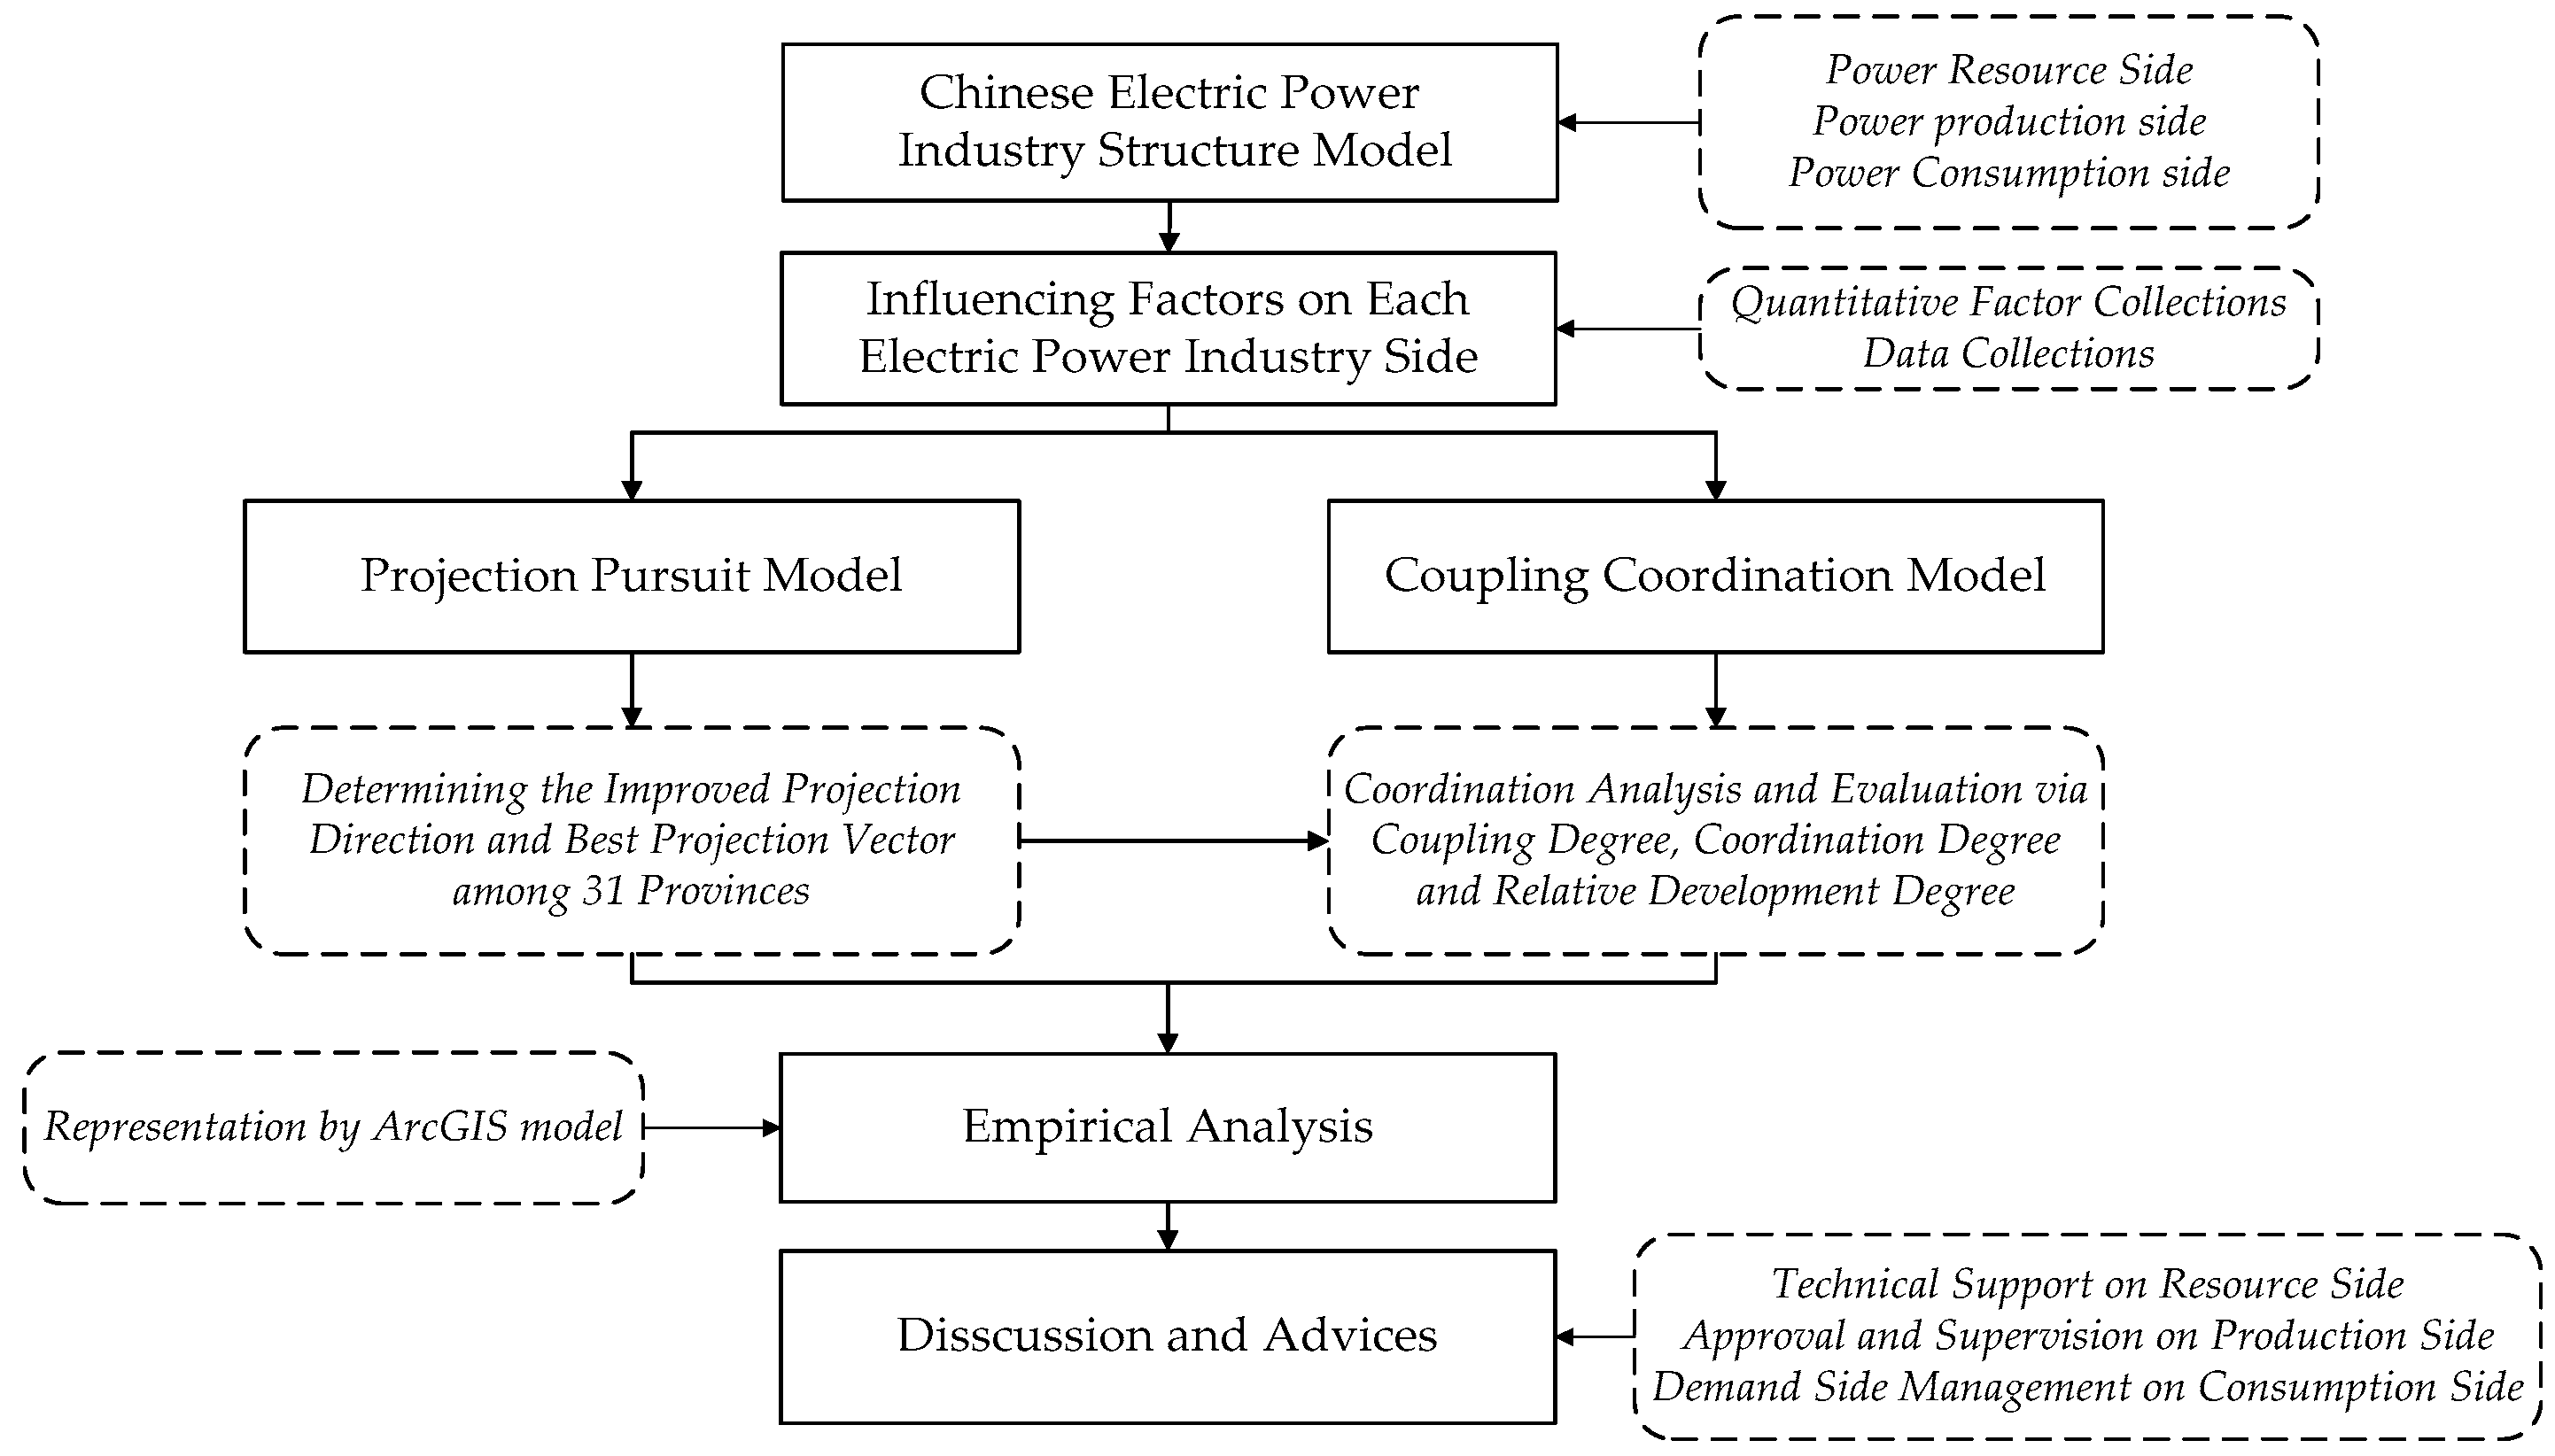
Figure 1. The research process of Chinese provincial electric power development coordination.
Sustainability 09 00209 g001
Figure 2. Chinese electric power industry structure based on the production process.
Sustainability 09 00209 g002
Figure 3. The main factors influencing each side of the Chinese electric power industry.
Sustainability 09 00209 g003
Figure 4. The coordination degrees between power resource and power production in 2011.
Sustainability 09 00209 g004
Figure 5. The coordination degrees between power resource and power production in 2014.
Sustainability 09 00209 g005
Figure 6. The coordination degrees between power production and power consumption in 2011.
Sustainability 09 00209 g006
Figure 7. The coordination degrees between power production and power consumption in 2014.
Sustainability 09 00209 g007
Figure 8. Relative development degree between power supply and power demand in 2011.
Sustainability 09 00209 g008
Figure 9. Relative development degree between power supply and power demand in 2014.
Sustainability 09 00209 g009
Table 1. Variables setting of evaluation system on development level.
SideVariableFactor
Electric power resourceRri1Coal resources reserves (million ton)
ri2Technical exploitation amount of hydropower resources (thousand kW)
ri3Technical exploitation amount of wind resources (thousand kW)
ri4Radiation amount of solar energy (kW/m2·a)
Electric power productionPpi1Electric power industry investment (million Yuan)
pi2Amount of electric power generation (million kWh)
pi3Proportion of renewable energy production (%)
Electric power consumptionCci1Gross domestic product (million Yuan)
ci2Proportion of secondary industry (%)
ci3Terminal electric power consumption (thousand tce)
ci4Pollutant emission of electric power industry (thousand ton)
Table 2. The data collection of Chinese provincial electric power development in 2011 and 2014.
Indexri1ri2ri3ri4pi1pi2pi3ci1ci2ci3ci4
Province 20112014201120142011201420112014201120142011201420112014
Beijing3761320500156014,10023,00026,60036,9001.320.811,625,1932,133,08323.121.369,54067,240198174
Tianjin2971530560160043,10059,10061,30061,2000.231.111,130,7281,572,69352.449.268,18078,820340288
Hebei3841183041,880155096,300120,200225,000238,3004.007.132,451,5762,942,11553.551.0275,310296,64017131475
Shanxi83,459352015,9801600191,900209,800234,400264,3000.552.991,123,7551,276,14959.049.3168,080197,61012411069
Inner Mongolia36,88910701,459,6701870190,300233,100313,500386,1007.2710.641,435,9881,777,01956.051.3168,200176,81013141238
Liaoning3097189059,810140096,000109,400142,300161,7004.646.432,222,6702,862,65854.750.2209,470217,2101020880
Jilin952433062,840130061,60066,30070,50075,8005.677.651,056,8831,380,31453.152.882,97086,450582542
Heilongjiang6175105096,510139398,30099,10083,40089,4005.288.051,258,2001,503,93850.336.9112,340118,530753730
Shanghai0450510129014,50014,300102,60080,8000.390.991,919,5692,356,77041.334.7112,010113,460443365
Jiangsu108117603700124059,80090,800393,300434,8000.711.614,911,0276,508,83251.347.4257,740292,05014721214
Zhejiang4410,3402090135052,90075,600279,000291,3000.220.553,231,8854,017,30351.247.7168,650186,400853699
Anhui79913420770131048,10060,600165,500202,8000.180.741,530,0652,084,87554.353.197,070116,960909820
Fujian42915,2509550130063,00087,700157,900187,0001.392.031,756,0182,405,57651.652.098,090111,900448409
Jiangxi42650703100120033,10035,00074,20087,6000.300.681,170,2821,571,46354.652.563,55075,830582542
Shandong7410427030,1801450113,300155,900317,200373,8001.322.824,536,1855,942,65952.948.4348,080353,38017401460
Henan974649503890140082,70086,800259,800267,5000.070.302,693,1033,493,82457.351.0214,380219,09015901356
Hubei32563,5001260123051,80051,100210,200239,5000.070.541,963,2262,737,92250.046.9151,380157,030631586
Hunan132923,3301130113060,10067,700120,400126,1000.040.631,966,9562,703,72247.646.2148,800149,190604550
Guangdong2322,95013,670125089,100114,700369,600380,5000.430.895,321,0286,780,98549.746.3269,080284,80013231099
Guangxi20219,4306920138042,10056,000105,200129,8000.010.231,172,0871,567,28948.446.779,19091,000451411
Hainan11912402060140010,10012,70018,90024,6002.802.44252,266350,07228.325.013,59017,2008098
Chongqing185779801380130034,30057,50053,40067,4000.190.301,001,1371,426,26055.445.878,56080,490382356
Sichuan518252,88034001230131,500142,900185,700313,0000.010.162,102,6682,853,66652.548.9178,920192,120620577
Guizhou587417,020456092870,40058,600141,600184,5000.070.98570,184926,63938.541.681,75092,990493445
Yunnan596738,47020,660120089,100118,400155,500255,0000.642.63889,3121,281,45942.541.286,740100,720520490
Tibet1253,5406502100640016,700230026005.9111.5460,58392,08334.536.6346043003838
Shaanxi10,759332011,1501500123,500178,600117,900132,6000.081.131,251,2301,768,99455.454.188,820106,100766690
Gansu23517600236,340190063,800109,400106,800124,1006.7412.41502,037683,68247.442.859,23072,870420407
Qinghai161211,15020,080220023,20039,70049,00059,6000.2010.40167,044230,33258.453.625,68037,680116134
Ningxia312867015,550170041,40043,90099,900116,7001.508.23210,221275,21050.248.736,81047,810418398
Xinjiang14,8363510435,5502050123,300210,10087,500209,3003.208.50661,005927,34648.842.682,900136,320588588
Table 3. Provincial best projection vectors of each electric power industry side.
Indexz(R)*z(P-2011)*z(C-2011)*z(P-2014)*z(C-2014)*
Province
Beijing0.00000.18451.22410.09561.2260
Tianjin0.00000.05901.17640.25451.1780
Hebei0.02840.61750.18220.88580.1503
Shanxi0.01060.22020.57971.04310.5478
Inner Mongolia1.00001.13680.55131.56010.5004
Liaoning0.04060.70210.61410.74530.6091
Jilin0.04270.81551.03870.56611.0273
Heilongjiang0.06580.78920.91080.70770.8667
Shanghai0.00000.06051.05100.11611.0614
Jiangsu0.00220.14600.34380.74630.3087
Zhejiang0.00110.07020.77550.51080.7689
Anhui0.00020.05910.86790.38170.8279
Fujian0.00620.23531.07750.51251.0498
Jiangxi0.00180.06111.07450.18041.0490
Shandong0.02030.26790.05120.95910.0607
Henan0.00230.07180.34970.51540.3636
Hubei0.00050.04800.89890.37690.8811
Hunan0.00040.04790.91530.32700.9158
Guangdong0.00900.12950.39420.74490.3840
Guangxi0.00440.02961.10810.27391.0957
Hainan0.00110.38411.37470.11651.3630
Chongqing0.00060.04661.13490.22111.1452
Sichuan0.00200.09930.85180.74470.8144
Guizhou0.00280.06021.07230.36701.0676
Yunnan0.01380.15271.05630.70791.0300
Tibet0.00010.80471.41570.48831.4369
Shaanxi0.00730.10160.94470.73140.9126
Gansu0.16160.96361.15330.95811.1274
Qinghai0.01340.04041.34430.57461.3253
Ningxia0.01030.23231.19420.55351.1793
Xinjiang0.29810.52531.03591.22070.9120