Article

Determinants of Pro-Environmental Consumption: Multicountry Comparison Based upon Big Data Search

1
Department of Business Administration, Korea Polytechnic University, 237 Sangidaehak-ro, Siheung-si, Gyeonggi-do 15073, Korea
2
Korea Environment Institute, 370, Sicheong-daero, Sejong 30147, Korea
3
Department of Industrial and Management Systems Engineering, Kyung Hee University, 1732 Deogyeong-daero, Giheung-gu, Yongin, Gyeonggi 17104, Korea
*
Author to whom correspondence should be addressed.
Sustainability 2017, 9(2), 183; https://doi.org/10.3390/su9020183
Submission received: 5 November 2016 / Accepted: 23 January 2017 / Published: 27 January 2017
(This article belongs to the Special Issue Big Data and Predictive Analytics for Sustainability)

Abstract

:
The Korean government has promoted a variety of environmental policies to revitalize pro-environmental consumption, and the government’s budget for this purpose has increased. However, there is a lack of quantitative data and analysis regarding the effects upon the pro-environmental consumption of education and changing public awareness of the environment. In addition, to improve pro-environmental consumption, the determinant and hindrance factors of pro-environmental consumption should be analyzed in advance. Accordingly, herein we suggest a pro-environmental consumption index that represents the condition of pro-environmental consumption based on big data queries and use the index to analyze determinants of and hindrances to pro-environmental consumption. To verify the reliability of the proposed indicator, we examine the correlation between the proposed indicator and Greendex, an existing survey-based indicator. In addition, we conduct an analysis of the determinants of pro-environmental consumption across 13 countries based upon the proposed indicator. The index is highest for Argentina and average for Korea. An analysis of the determinants shows that the levels of health expenditure, the ratio of the population aged over 65 years, and past orientation are significantly negatively related to the pro-environmental consumption index, but the level of preprimary education is significantly positively related with it. We also find that high-GDP countries have a significantly positive relationship between economy growth and pro-environmental consumption, but low-GDP countries do not have this relationship.

1. Introduction

Recently, environmental pollution has become a serious problem in our society. Many countries seek to prevent environmental pollution, since issues such as global warming and air and water pollution have become evident. The common feature of policies addressing these problems is that they seek to change individual behavior. The encouragement and activation of pro-environmental consumption is a good example. To encourage sustainable consumption, we have to identify the determinants of pro-environmental consumption and analyze factors that disrupt this consumption. Many countries develop policies related to encouraging pro-environmental consumption, but the effectiveness of these policies remains unclear. The following is an example of a Korean pro-environmental consumption policy; the Korean government has formulated and enforced various environmental policies intended to promote pro-environmental consumption in compliance with the 2011 Act on Encouragement of Purchase of Green Products. The total value of goods purchased by 883 government agencies and public organizations was 2.2 trillion Korean Won in 2014, and this purchase quantity has increased every year since then [1]. However, the performance of the revitalization of green product consumption was insufficient amongst other economic agents, excluding public organizations. For example, the Green Card Point Scheme (Since 2011, green card holders have received some points for purchasing certified green products and for leading a low-carbon environment-friendly life) that was adopted as part of the environmental policy for consumers to promote eco-friendly consumption was far from successful, with Green Card application rates of no greater than 10.7% to 24.4% [2].
According to the Third Green Product Purchase Promotion Plan, the government’s budget allocation to promote environmentally friendly consumption has increased [3]. This increased budget includes allocations for incentive policies, educational programs, and public relations activities to boost pro-environmental consumption. However, there is a paucity of quantitative data and analyses concerning the effectiveness of educational programs and the changing public awareness of pro-environmental consumption and environmental consciousness. A range of incentives, educational programs, and public relation campaigns intended to promote environment-friendly consumption are not well received by the general public in reality [4]. Research on consciousness regarding pro-environmental consumption has been conducted occasionally [5], but there are few environmental indexes that diagnose the status of pro-environmental consumption. Previous indexes relevant to environmental policy are included in the Green Competitiveness Index [6], but this index is insufficient for diagnosing the status of pro-environmental consumption in Korea. Looking more closely, this index focuses on green growth through a regional green strategy. It is classified into three categories; the basis of green growth, the promotion of green growth, and the performance of green growth. Among these, one of the four elements that evaluate promotion of green growth is the measuring of green living. However, this measurement is only evaluated through bicycle use, resource recycling, energy conservation, and traffic volume reduction. Thus, it is actually difficult to measure pro-environmental consumption through this indicator [7].
Meanwhile, the 9th OECD (Organisation for Economic Co-operation and Development) Working Party on Integrating Environmental and Economic Policies has discussed how to measure local residents’ interest in the environment by using search queries based upon big data, such as Google Trends, and how to apply these measurement results to the development of environmental policy. Portal users normally express the intention or purpose of their search through the search keywords used [8]. Based on the characteristics of big data queries, recent studies measured pro-environmental attitude and used it to analyze the impact of the introduction of pro-environmental policies [9]. This is noteworthy in that queries based on big data are used to measure pro-environmental consciousness and to estimate policy implications from the analysis results without using the questionnaire survey, which is a primary conventional method for measuring pro-environmental attitude.
Therefore, the purpose of this study was to investigate the determinants and inhibitory factors of pro-environmental consumption using the pro-environmental consumption index that was suggested in this study. In other words, this study identifies factors that impact the pro-environmental consumption index based upon the analysis of data from 13 developed countries and data from the World Bank. We chose 13 counties from the six continents; Asia, South America, North America, Europe, Australia and Africa. We considered Argentina, Brazil, Mexico, South Africa, the United States, Canada, Australia, the United Kingdom, Hungary, Spain, China, Japan, and Korea. The proposed pro-environmental consumption index based on big data queries reflects consumers’ collective consciousness and can be used to understand the present status of pro-environmental consumption. Since the analysis of both the determinants and the inhibitory factors of pro-environmental consumption should be preceded by establishing pro-environmental consumption policies [10], the results of this study could provide policy implications for how to improve pro-environmental consumption.
This paper has the following structure. Section 2 examines the definition, motivation, measurement, and determinants of pro-environmental consumption based upon a review of the literature. Section 3 explains the methodology of the proposed pro-environmental consumption indicator using big data queries. Section 4 analyzes the correlation between the proposed pro-environmental consumption index, derived from queries based on big data and indexes based upon conventional questionnaire surveys, to test the reliability of the proposed index and uses the index to comparatively analyze the trends and statuses of 13 countries over the past 12 years from 2004 to 2015. Moreover, the factors impacting pro-environmental consumption indices are determined with a regression analysis to analyze the determinants of pro-environmental consumption. Finally, we present our conclusions and discuss the policy implications and limitations of the present work.

2. Literature Review

Pro-environmental consumption behaviors refer to “consumers purchasing/using/disposing of products and services, considering their impacts on others, society, and the environment” [11,12,13]. Pro-environmental consumption, which previously used to imply environmental protection, is viewed as encompassing consumption geared towards sustainable development from a broader perspective [14].
Pro-environmental consumption is divided into the purchase, use, and disposal steps [12,15,16,17]. The purchase stage refers to “searching the environment-related information to assess the quality of products based on their impacts on the environment, as well as purchasing the pro-environmental products, e.g., energy- and resource-saving products and those causing less environmental pollution and waste” [16]. The ‘use’ stage refers to ‘saving energy or resources considering the impacts on others or the environment before one’s own convenience’. The ‘disposal’ stage refers to ‘pro-environmental consumption behavior oriented toward conservation, involving active engagement in recycling or reuse of resources’ [16].
To measure pro-environmental consumption, previous studies used questionnaire surveys. Particularly, pro-environmental behaviors were measured as the practical pro-environmental lifestyle encompassing the purchase, use, and disposal stages [11,12,13], the acceptance of pro-environmental products [18], and the willingness to pay the extra cost of pro-environmental products [19]. Specifically, to measure pro-environmental consumption, previous studies first developed questionnaire items concerning purchase, use, and disposal, and based indexes upon the results. The questionnaire items concerned experience purchasing pro-environmental products in the purchase stage, the extent of energy savings in the use stage, and recycling and reuse in the disposal stage.
Extensive research on diverse indexes for measuring pro-environmental consumption has been conducted around the world. Since 2011, the Green Life Index has been developed based on a biannual survey [20]. This survey is conducted among approximately 19,000 household members aged 20 and older in 9700 sample households across various countries [20]. The Green Life Index is composed of a green practice index and a green performance index. The practice index consists of green community, green family, and green traffic categories. Table 1 gives detailed information on the green living indicators.
In addition, the Korea Consumer Agency has conducted evaluation research on green consumer capability and developed an index of evaluation measuring a green consumer’s capability and level of green consumption, targeting the housewife consumer. Hwang and Lee [11] suggested an index that consisted of inner competence, external competence, and practical competence, and they calculated the respective weights of these categories as 32.3%, 29.3% and 38.4%, based on a survey [11].
Also, there exists the Greendex, an international indicator of pro-environmental consumption. Figure 1 visualized Greendex indicators. National Geographic and Globescan research developed this index to include 32 indicators representing the fields of housing, transportation, food, and consumer goods and have conducted a survey every two years since 2008 in 18 countries, including South Korea, in order to measure and monitor environmental consumption. Greendex conducted an online survey consisting of 64 response variables related to lifestyle and behavior, including energy use, transportation, and food consumption. They collected questionnaire responses from 1000 consumers in each country and transformed the results of the survey into scores of 0 to 99 [21].
There has also been a survey of American consumers. Mediamark Research & Intelligence [22] has synthetically analyzed various items about consumer shopping behavior and media user behavior by conducting a survey every year since 2003 in order to understand consumers and provide marketing solutions. They measured consumers’ green consumption status and attitude about the environment by researching which pro-environmental products were used within the last 6 months.
Although it is not a pro-environmental consumption indicator, the National Environmental Scorecard prepared by the League of Conservation Voters [23] compares the degree of policy drafts for pro-environmental purchasing. The twenty experts of the League of Conservation Voters have examined the degree of pro-environmental policy drafted in each American state since 1970 and have calculated annual scores from 0% to 100%, according to the ratio of drafted pro-environmental policies to all pro-environmental policies. The pro-environmental policy score is calculated based upon 12 items, including air, clean energy, climate change, and so on. The League of Conservation Voters’ indicators have been used as pro-environmental policy indicators for USA states in many papers [23]. Lyon and Yin (2010) used the League of Conservation Voters’ indicators to measure pro-environmental behavior [24].
Recently, some research works have included the use of big data queries to measure pro-environmental indicators. Lee, Kim and Lee [9] measured pro-environmental behavior using portal queries and analyzed how the environmental attitudes of local residents affect the introduction of pro-environmental policy. Similar to Lee, Kim and Lee [9], herein we measured pro-environmental attitudes and anti-environmental attitudes by using big data queries on the search terms ‘recyclables’ and ‘disposables’. Then, we verified the indicators through reliability testing and conducted regression analysis to find out the determinants for pro-environmental consumption. The presently proposed method of measuring pro-environmental consumption by means of search queries based on big data has a few strengths over the previous questionnaire survey method. First, the use of big data saves a great deal of cost in comparison to the use of questionnaire surveys. Second, the proposed method precludes the distorted social desirability or response biases that are characteristic of questionnaire surveys.

3. Model Specifications

The purpose of the present study was to develop a pro-environmental consumption indicator based upon portal queries. In addition, the status of pro-environmental consumption was analyzed using the proposed indices and determinants of the pro-environmental consumption by taking into account other variables.

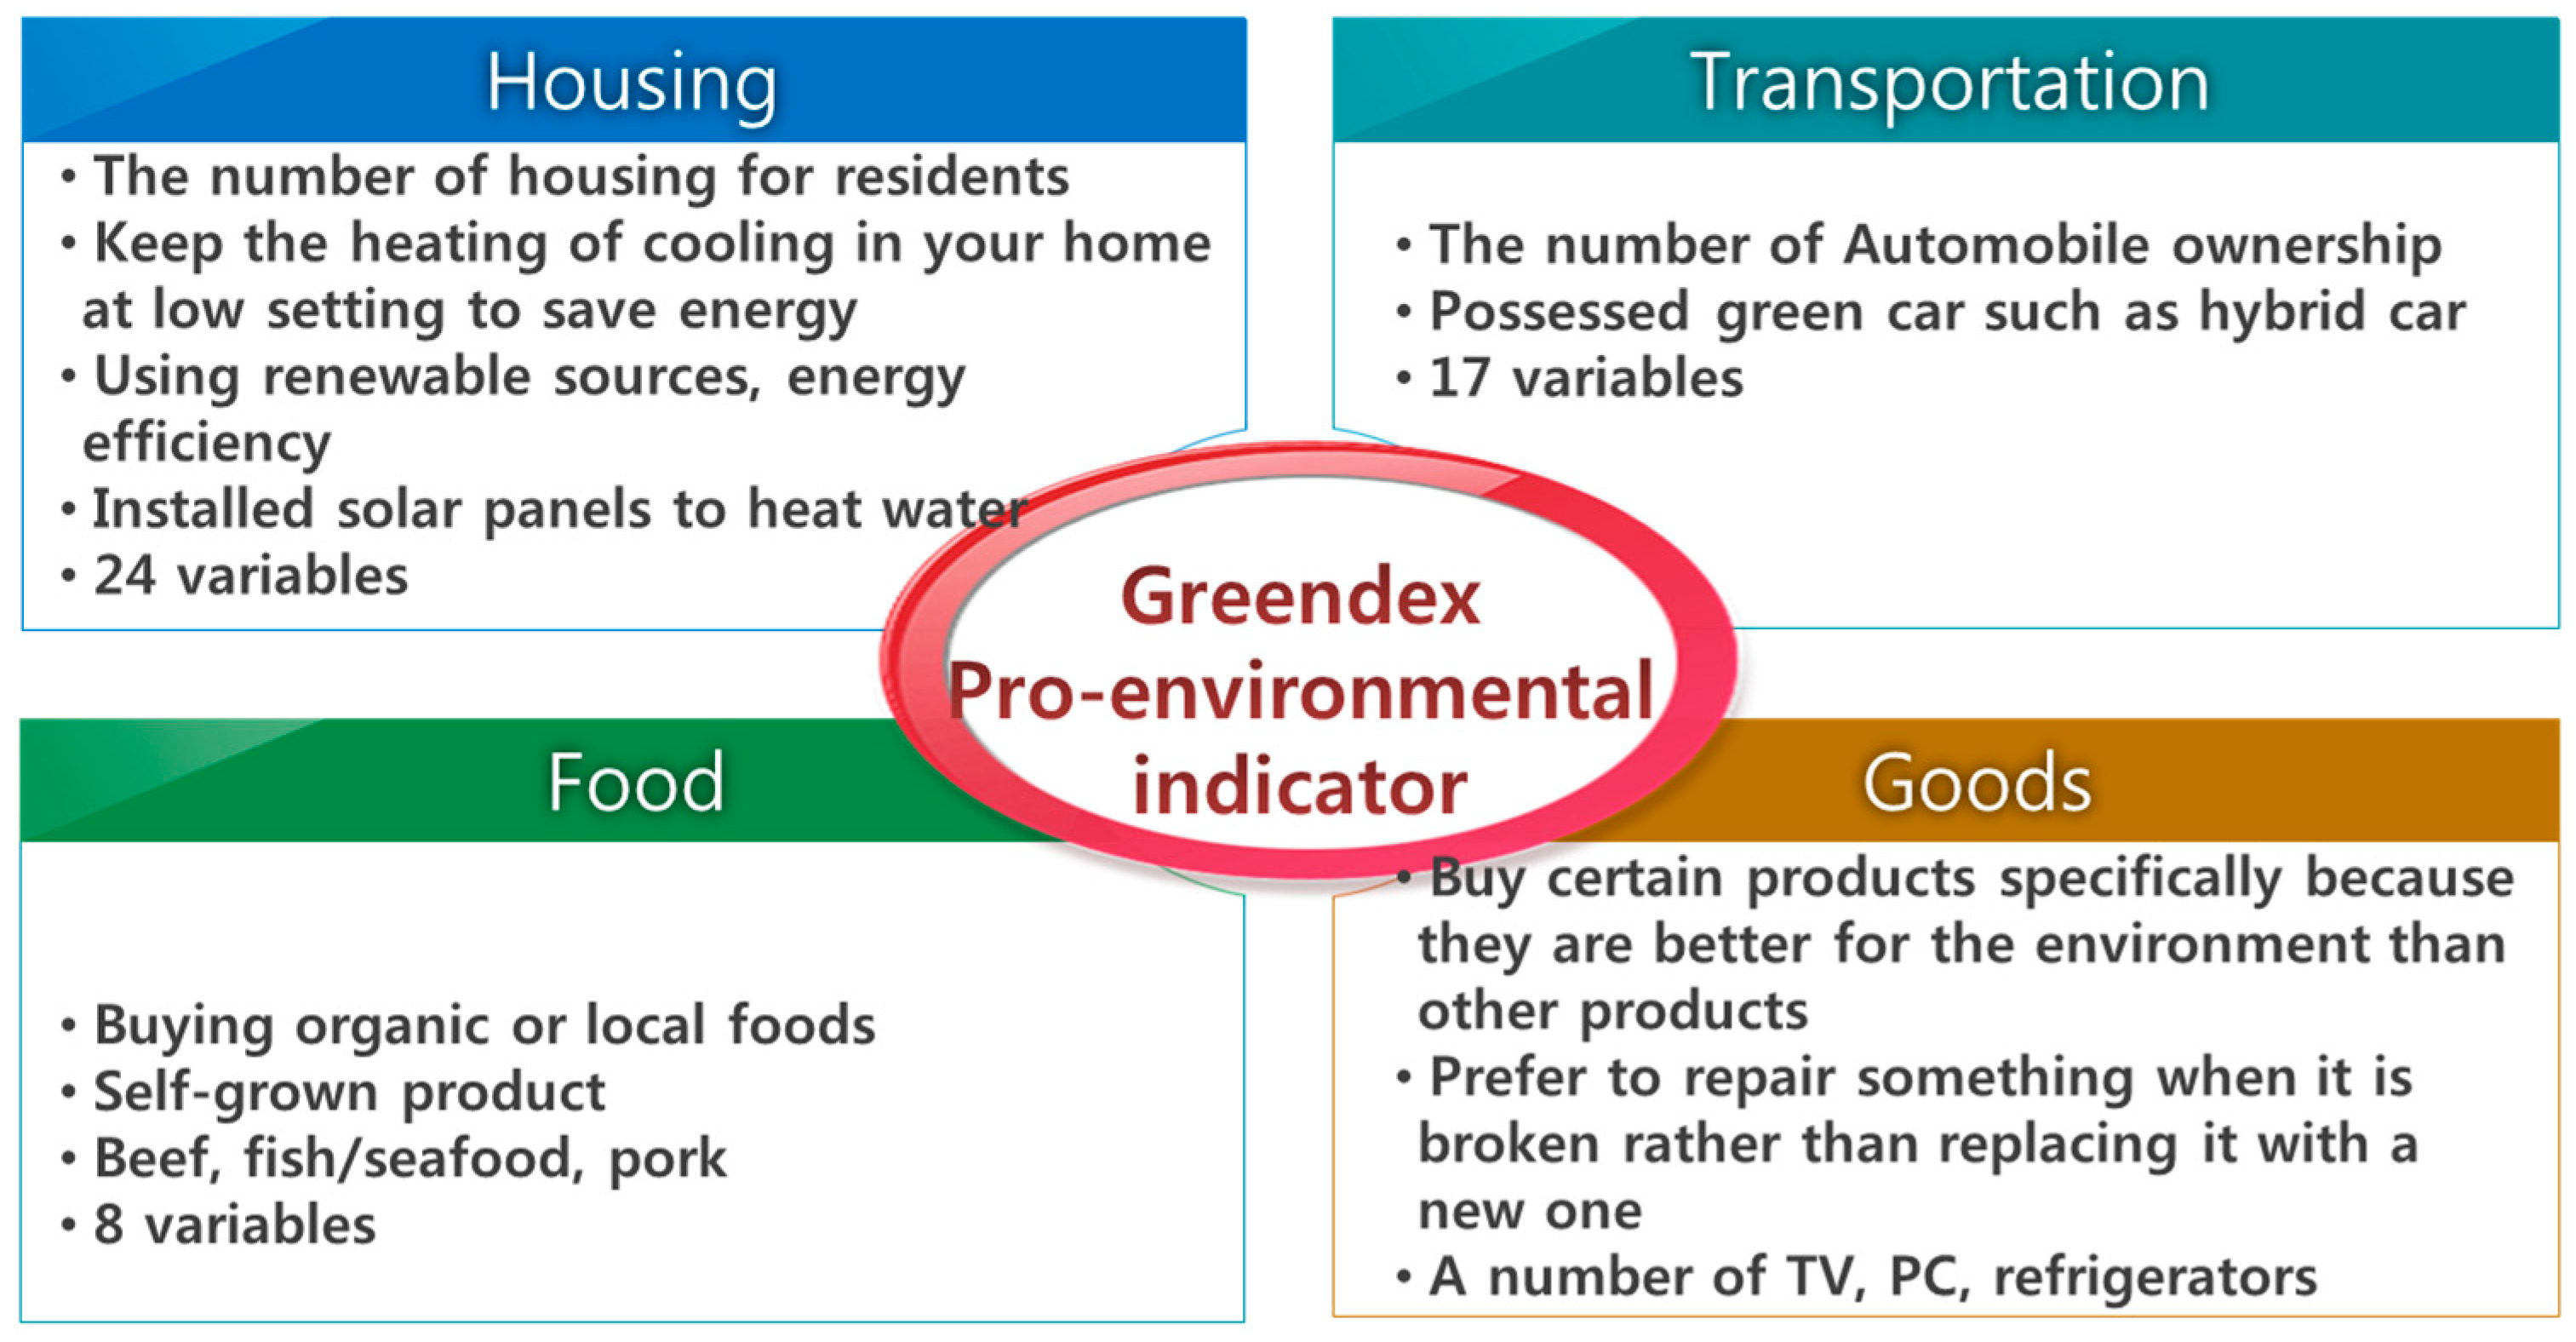
3.1. Pro-Environmental Consumption Index Using Query Based on Big Data

Lee, Kim and Lee [9] considered the search words ‘recycling’ and ‘disposable’ in Google search queries to analyze the pro-environmental attitudes or anti-environmental attitudes of local people. They sought to empirically examine whether it is appropriate to use search query provided Google trends to measure attitudes related to the environment and to analyze the association between the ‘recycling’ query as a pro-environmental attitude index and these attitudes using ordinary least squares (OLS) regression. If the association between the ‘recycling’ query and the environment-friendly attitude index had a positive correlation, these queries could serve as a pro-environmental attitude index. Likewise, they examined the relationship between ‘disposable’ and net municipal solid waste (MSW) by state. If this relationship was positive, the ‘disposable’ query could serve as an anti-environmental attitude index. They discovered that the relationship between the ‘recycling’ query and pro-environmental attitude index had a positive at the 5% level and that the recycling rate of the state increased by 0.23 on average, with a 1-point increase in the pro-environmental query index. In addition, the ‘disposable’ query had a positive relationship with the anti-environmental attitude index at the 1% level, and the net MSW by state increased by 91,000 U.S. tons per year, with a 1-point increase in the anti-environmental attitude query index. Thus, Lee, Kim and Lee [9] suggested that the ‘recycling’ query could be used as an index of pro-environmental attitude, while the ‘disposable’ query could be used as an index of anti-environmental attitude.
In this study we used the pro-environmental attitude index of Lee, Kim and Lee [9] and we defined a pro-environmental consumption index as the ratio of search queries for ‘recyclables’ to search queries for ‘disposables’. In our literature review, we found that it was common to divide pro-environmental consumption into three steps; purchase, use and disposal. We suggest the use of the search keywords ‘recyclables’ and ‘disposables’ because they fully reflect each step. Our selection of noun phrases as keywords, e.g., ‘recyclables’ instead of ‘recycling’ and ‘disposables’ instead of ‘disposal’, was based upon the intent to determine consumption rather than pro-environmental attitudes and to capture the frequency of searches related to purchasing actual products.
Pro - environmental   consumption   index =   (   Number   of   search   queries   for   Recyclables ) (   Number   of   search   queries   for   Disposables )
Equation (1) describes the pro-environmental consumption index as the ratio of searches for ‘recyclables’ to those for ‘disposables’, where greater numbers indicate larger search volumes for ‘recyclables’ versus ‘disposables’. When this indicator is 1, the search volumes for disposables and recyclables are equal. In addition, the index facilitates comparison of the statuses and trends of pro-environmental consumption between different countries by year. This paper analyzed the present condition of pro-environmental consumption by developing a pro-environmental consumption indicator using big data. Prior to analyzing the status of pro-environmental consumption, to verify the reliability of the proposed indicator, we conducted a correlation analysis between the proposed indicator and Greendex, which is the major indicator of pro-environmental consumption. First, we collected search frequency data from Google Trends on the keywords ‘recyclables’ and ‘disposables’ from 13 countries for the 12-year period from 2004 to 2015. The search keywords used were selected based on the dominant language of each country (see Table 2).
We measured pro-environmental indicators using the Equation (1) formula. Then, we first verified the reliability of the pro-environmental indicator using the pro-environmental consumption index and survey before analyzing the determinants of pro-environmental consumption. We also collected Greendex indicator data. The Greendex consumption index was measured in 2008 in 18 countries; the actual value observed was 59 because some countries, including South Africa, were measured after 2008. Table 3 shows statistics on the Greendex index and the pro-environmental consumption index suggested herein.

3.2. Analysis Determinant of Pro-Environmental Consumption

This study analyzes the factors affecting pro-environmental consumption. We analyzed which factors affect pro-environmental consumption among the following factors: health expenditures, population proportion aged 65 and above, preprimary education, low/high GDP countries’ GDP, and past orientation. These possible determinants were identified by means of a literature review. Since world bank data, which is used as independent variables, is provided until 2014, we used data from 2004 to 2014 in determinant analysis.

3.2.1. Dependent Variable: Pro-Environmental Consumption Index

This study proposes a pro-environmental consumption indicator based upon search frequency for ‘recyclables’ and ‘disposables’. As mentioned earlier, the reliability of the proposed indicator was verified by comparing it to the Greendex index. After this reliability verification, these indicators were used as dependent variables to figure out the determinants of pro-environmental consumption.

3.2.2. Independent Variables

Most studies have used individual level data to examine the determinants of environmental friendly consumption. Diamantopoulos et al. [25] reviewed research on the relationship between six socio-demographic variables (gender, age, status, number of children, education, and social class) and environmental consciousness. Then they established hypotheses regarding the association between socio-demographic variables and environmental consciousness. They found that in multivariate analysis, socio-demographics were weakly related to environmental consciousness.
Meanwhile, Franzen and Meyer [26] used both country level data and individual level data because there is still an unfinished dispute that a country’s wealth affects environmental issues with individual prosperity. In this perspective, it is necessary to investigate the determinants of pro-environmental consumption by considering the differences between countries. In addition, to the best of our knowledge, the determinants of pro-environmental consumption indices have never been analyzed by using global panels. Thus, to determine independent variables, the factors that could impact pro-environmental consumption were selected based upon a literature review from both the existing individual level studies on a micro level and country level studies on macro level. As a result, we selected variables including health, age, and education from individual level studies and GDP from country level studies. The reason we selected GDP variables and not income is that we sought to develop a pro-environmental consumption index for each country. Based on variable selection, we matched these variables to country level variables. In addition, past orientation was considered in this study as a differentiated variable.

Health Expenditure

Newsom et al. [27] argued that health-conscious consumers exert effort to maintain or improve their health, quality of life, and well being. Some studies have investigated attitudes toward organic products in relation to pro-environmental behaviors and reported that concerns about health motivate the use of organic products [28,29]. Magnusson et al. [28] suggested that the purchase of organic products serves as an index for pro-environmental behaviors [28]. In addition, Wandel and Bugge [29] and Tregear et al. [30] found that people’s health was closely related to concerns about the environment.
Most previous studies used health examinations, efforts to improve health, and health information as variables for measuring health concerns [31]. To measure the medical care level of patients, Greenfield et al. [32] created an ordinal scale about health concerns.
In our study, health expenditure was used as a variable to represent health concerns in relation to the pro-environmental index. We expect that a country with high health expenditure will also have a high pro-environmental consumption index. This variable was based on the per capita healthcare spending (USD) data published by the World Bank.

Age

To determine whether the proportions of the population’s age affect pro-environmental consumption, we investigated the relationship between age and the proposed index. According to Uyeki and Holland [33], various researchers studying the effects of pro-environmental consumption insist that young respondents are more pro-environmental than older respondents, but this finding was not statistically significant in their own study. Vining and Ebreo [34] argue that the relationship between recycling behavior and age has a weakly positive correlation. Bak and Huh [35] claimed that older adults engaged more actively in pro-environmental behaviors. However, this positive correlation between age and pro-environmental behaviors was not found in developed countries and could instead characterize fast-growing economies, as suggested by Li [36]. On the other hand, according to a regression analysis of pro-environmental attitudes by Whitmarsh and O’Neill [37], age showed a slightly negative correlation. Van Liere and Dunlap [38] argued that the younger a person was, the more he or she was likely to be concerned about the quality of the environment. Franzen and Meyer [26] also insisted that the correlation between age and environmental concern was negative. Diamantopoulos et al. [25] studied the relationship between green consumption and socio-demographics through a survey targeting 600 UK consumers and found a slight negative correlation between age and the environmental index and revealed that younger people tend to purchase more green products.
Given that studies are concerned with the relationship between age and pro-environmental behaviors and the purchase of relevant products, age seems likely to influence the purchase of pro-environmental products. In this study, we investigated whether the proportion of a country’s population aged 65 and older was associated with that country’s consumption of pro-environmental products. We anticipated a negative correlation between age and the green consumption index. This variable was analyzed using World Bank data for each country studied.

Pre-Primary Education

Pre-primary education refers to the initial step in regular education, which provides a school-like environment and a connection between the house and school for young children [39]. Many studies have analyzed the relationship between education level and pro-environmental behavior. Kollmuss and Agyeman [40] suggested several models to analyze differences between pro-environmental behavior and attitudes and examined barriers to pro-environmental behavior. Their results indicated that knowledge of environmental issues increases along with an individual’s educational level, but this was not enough to suggest that higher education leads to a willingness to engage in pro-environmental behaviors. However, many studies have shown a positive relationship between education and pro-environmental behaviors [26,41,42,43]. Many researchers have delved into the relationship between educational background and pro-environmental purchase behaviors, but the relationship between pre-primary education and pro-environmental behaviors has rarely been documented. Still, in a few studies, childhood experiences of the environment proved strongly associated with pro-environmental interests [44,45].
There is a positive correlation between education level and pro-environmental behavior. Also, childhood experiences of the environment are associated with pro-environmental behavior. We hypothesized that societies that invest in early education are likely to be more sustainable/environment-oriented. Therefore, we expected pre-primary education to have a positive correlation with the pro-environmental consumption index. This study investigated the influence of pre-primary education on pro-environmental consumption.

Low/High GDP Countries’ GDP

Franzen and Meyer [26] discussed the determinants of environmental attitude from a cross-national perspective and studied environmental concern focusing on wealth and income. They measured country wealth based on purchasing power adjusted for per capita GDP. They found that relatively wealthy individuals had greater environmental concern, in addition to wealthier countries having greater concern than poorer countries. A few studies explored the correlation between GDP and pro-environmental consumption.
We used GDP per capita because Fransen and Meyer [26] used GDP per capita to analyze the determinants of environmental attitude, and this variable was used most widely to identify the effect of the economy scale [46]. We hypothesized that the higher the GDP, the greater pro-environmental consumption there would be. In this study, we investigated the relationship between GDP and pro-environmental attitudes. The effects of GDP are examined by setting the countries with low GDP (up to USD 10 k) and those with high GDP (USD 30 k and higher) as dummy variables. We used GDP dummy variables because the effect of GDP on pro-environmental consumption was expected to vary within the overall range of GDP levels.

Past Orientation

We defined past orientation as the ratio of the number of Google search queries for past years to the number of queries for future years.
Preis et al. [47] analyzed the relationship between per capita gross domestic product (GDP) and the past/future orientation index. They introduced the past/future orientation index to calculate the search degree of internet users using the search volume of search terms in the past year and the future year. They found that internet searches were related to the attitude of the local residents. Although this study did not specifically examine pro-environmental attitudes, they studied the future orientation index using Google search queries. Similarly, we utilized Google search queries for the past/future orientation index.
The impact of time orientation on pro-environmental behavior has been investigated previously. Corral-Verdugo, Fraijo-Sing and Pinheiro [48] investigated the relationship between people’s perception of time and their use of resources, analyzing whether water conservation behavior was associated with pro-environmental behavior in terms of different time orientations, i.e. past, present, and future orientations. Those oriented towards the present were found to exhibit anti-environmental behaviors (structural coefficient = −0.20; p < 0.05), whereas those oriented towards the future were positive about pro-environmental behaviors (0.36; p < 0.05). Moreover, past orientation was not related to water conservation. In addition, Joireman, Van Lange and Van Vugt [4] insisted that the perceived environmental impact of cars had a positive correlation with the consideration of future consequences, i.e. an individual’s inclination toward considering whether his or her own behavior will affect the future. Milfont, Wilson, and Diniz [49] studied the relationship between time perspectives and sustainable behavior. They confirmed that pro-environmental behavior had a stronger relationship with time perspectives than pro-environmental attitudes, and the future time perspective had a stronger influence on pro-environmental behavior than the past-present time perspective.
Most researchers insisted that the relationship between future oriented and sustainable behavior was stronger than the past or present oriented. Therefore, we expected that the correlation between past orientation and the pro-environmental consumption index would be negative. This study uses the measurement method suggested by Lee, Lee and Choi [50] and search queries to quantify past and future orientations in view of the percentage search volume on past and future years.
Past orientation=100 to [ Number of Google search queries for past years ] [ Number of Google search queries for past years ] max [ Number  of Google search queries for future years ] [ Number of Google search queries for future years ] max
Table 4 describes the variables studied and Table 5 shows the statistics on each variable.

3.2.3. Analysis Model

To analyze the effects of the explanatory variables on pro-environmental consumption, we conducted a regression analysis that has been proven effective for the analysis of determinants. Among other regression models, the OLS regression analysis model was used. Control and independent variables were used to verify their homogeneity of variance in order to check the OLS assumptions prior to OLS regression analysis. The regression model is given as Equation (3); here, i represents the country, t represents the year, and ϵ represents an error term.
Pro-environmental consumption index it =  α t + β 1 ( Health expenditure it ) +  β 2 ( Age 65 and above it ) + β 3 ( Preprimary education it ) +  β 4 ( Low GDP country ×  GDP it ) +  β 5 ( High GDP country ×  GDP it ) +  β 6 ( Past orientation it ) +  ϵ i
We used four different models to investigate the effect of each independent variable upon pro-environmental consumption. Model 1 was a basic model consisting of three independent variables; health expenditure, number of people aged 65 and above, and preprimary education. Model 2 added the additional independent variables of low GDP countries’ GDP and high GDP countries’ GDP to the variables of Model 1. Model 3 added the independent variable of past orientation to the variables of Model 1, and Model 4 included all independent variables listed in Section 3.2.2.

4. Results and Discussion

4.1. Results of the Pro-Environmental Index

4.1.1. Reliability Verification of the Pro-Environmental Consumption Index Using Big Data

Greendex provides data every two years from 2008. Compared with Greendex, it is possible to expand the pro-environmental consumption index by collecting open data about search frequency for ‘recyclables’ and ‘disposables’. Prior to using the pro-environmental consumption index proposed by the amount of internet searches, we conducted a reliability verification between Greendex and the pro-environmental consumption index.
Reliability testing was conducted by using the collected data. At the 99.9% level of significance, the correlation between Greendex and the proposed index had a p-value of 0.0038 and a correlation coefficient of 0.3716. This verified the positive correlation between the two indexes. Figure 2 visualizes the relation.
Figure 2 indicates the similarity between the pro-environmental consumption index, based on big data, and the Greendex consumption index. In conclusion, we could verify that the pro-environmental indicator that we proposed is positively correlated with Greendex.

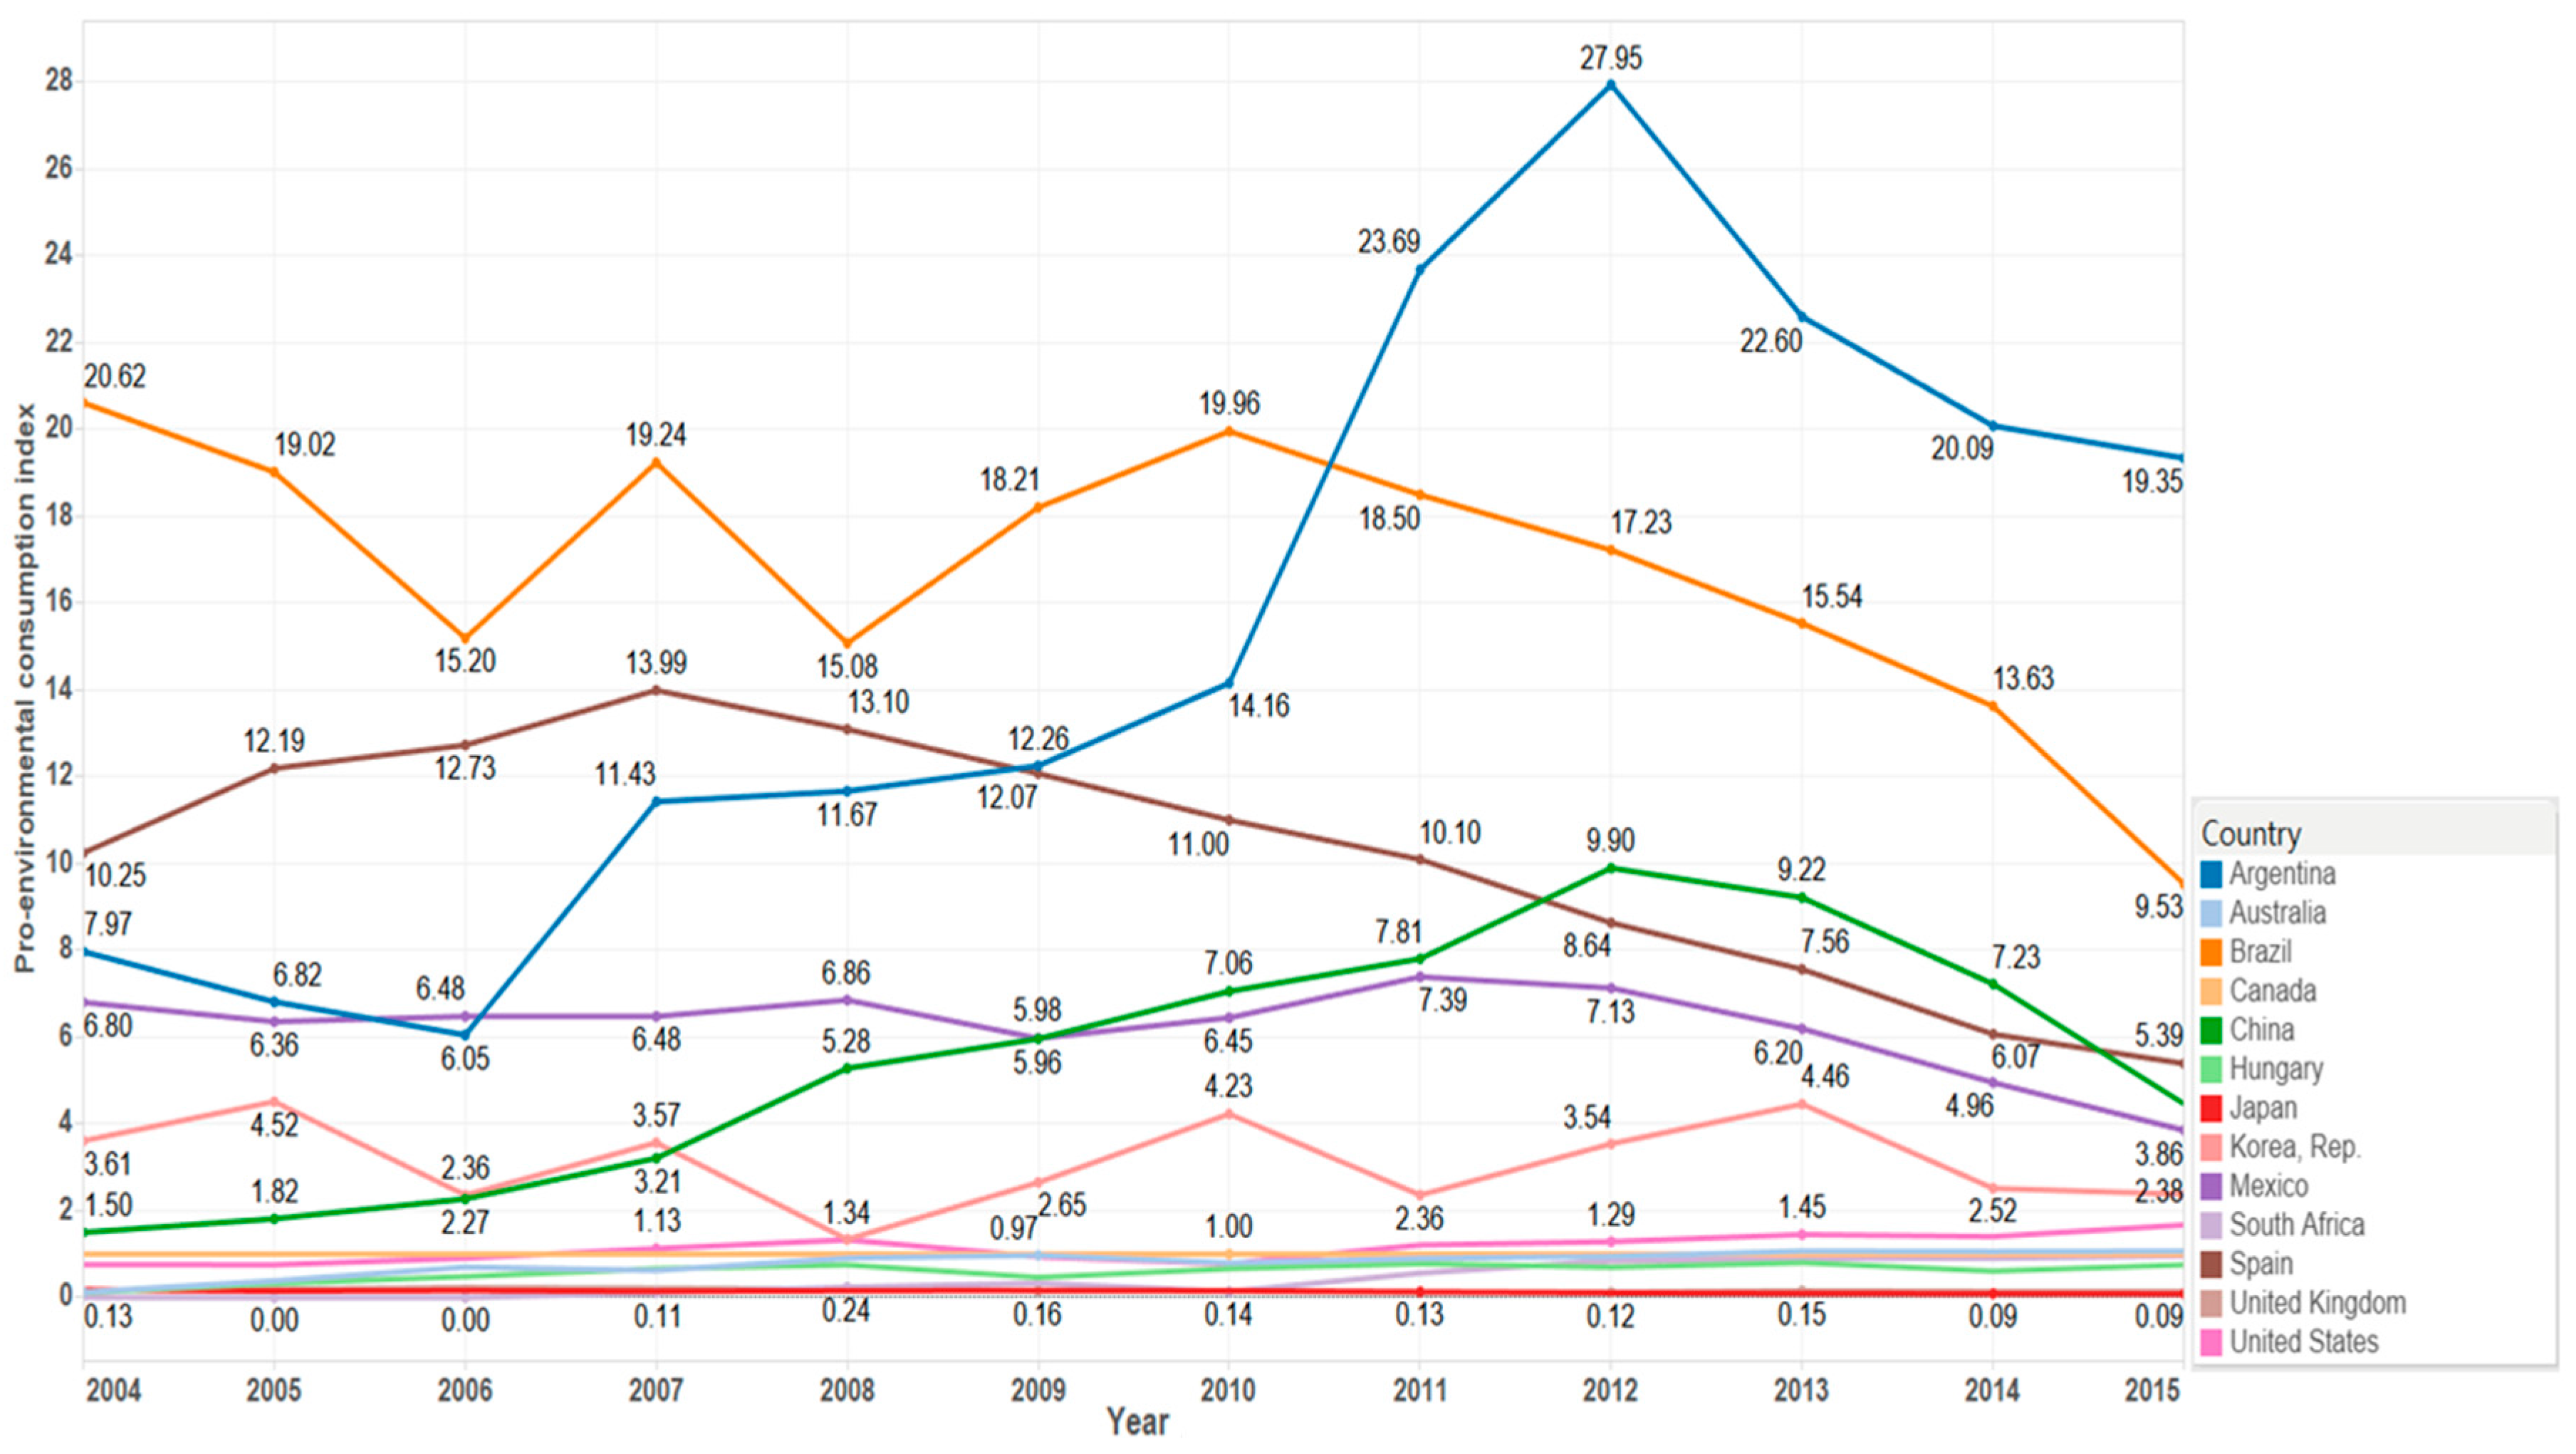
4.1.2. Analysis of Pro-Environmental Consumption Status Using the Proposed Index

To determine the status of pro-environmental consumption, the proposed index was used to comparatively analyze the trends of pro-environmental consumption by country, including Korea, and by period of time. We analyzed the present conditions of 13 countries for 12 years from 2004 to 2015. During the analysis period from 2004 to 2015, the average pro-environmental index was highest for Argentina and Brazil, both exceeding 15. This seems to be related to the pro-environmental boom of Argentina. South Korea’s score is just at the average level of about 3.13, compared to the 12 other countries. Figure 3 shows the changes of the pro-environmental indicator over the analysis period.
Pro-environmental consumption showed a steady increase from 2004 to 2012, but tended to decrease continuously thereafter.

4.2. Regression Analysis

To explore which determinants affect pro-environmental consumption level, we conducted regression analysis. This study used four models to examine the effect of the variables consistently. Model 1 is a base model based on control variables. Health expenditure, number of people aged 65 and above, and pre-primary education were used as control variables in Model 1, based on previous research. Models 2, 3, and 4 were constructed by adding and changing independent variables, such as low GDP countries’ GDP, high GDP countries’ GDP, and past orientation, based on Model 1. Assumptions for each variable were discussed in 3.2.2. Table 6 summarizes these results. The F-values were statistically significant for all models.
Surprisingly, the health expenditure variable was meaningfully negatively correlated with pro-environmental consumption for all models. Based on Model 4, when per capita health expenditure increases by USD 1000, the pro-environmental indicator decreases by 2.1 points. With increasing healthcare spending, the disposable budget for pro-environmental products, which are less affordable than ordinary products, is likely to decrease.
The number of people aged 65 and above variable was statistically significantly negatively correlated with the pro-environmental consumption index at a significance level of 0.1% for all models. In Model 4, a 1% growth in the population aged 65 and above corresponds to a decline in the pro-environmental consumption index of 0.847. Given that the maximum value of the pro-environmental consumption index is 100, the size of the population aged 65 and older seems to exert substantial effects on the pro-environmental consumption index. It cannot be ruled out that the older population may in general be less able to afford pro-environmental products, owing to their tighter budgets in comparison to other age groups.
The preprimary education variable was statistically significantly positively correlated with the pro-environmental consumption index at the 0.1% level of significance for all models. Based on Model 4, an increase of 1 year in preprimary education corresponds to an increase of 4.3 in the pro-environmental indicator. This variable is relevant to early formal educational programs, suggesting the importance of early education in pro-environmental consumption. This finding is consistent with many previous reports regarding the positive relationship between education and pro-environmental behaviors [41,42,43], a tendency that is found for elementary education as well.
The interaction variable low GDP countries’ GDP was analyzed in Models 2 and 4, and the results were statistically insignificant. In contrast, the high GDP countries’ GDP interaction variable had statistically significant positive effects on the pro-environmental consumption index at the significance level of 0.1%. This finding indicates that higher GDP levels have positive effects on pro-environmental consumption. For the advanced countries with a per capita GDP of USD 30,000 or more, an increase in GDP of USD 10,000 corresponded to an increase in the pro-environmental consumption index of 1.9.
Lastly, the past orientation level had statistically significant negative effects on the pro-environmental consumption index. In Model 4, the pro-environmental consumption index fell by 3.329 for an increase in the past orientation of 1. As mentioned by Joireman, Van Lange and Van Vugt [4], pro-environmental behavior parallels concern about future generations. A past orientation on a national level could have adverse effects on pro-environmental consumption. Lee, Lee and Choi [50] highlighted a statistically significant relationship between past orientation and suicide rates, suggesting that people’s perception or cognition regarding time points is an important factor impacting their behavior; such behaviors affected by this orientation could include pro-environmental consumption as well as suicide.
This study proposed a pro-environmental consumption indicator that could quantify the present condition of pro-environmental consumption based upon big data queries. The reliability of the proposed indicator was verified by analyzing the correlation between the proposed index and an existing pro-environmental consumption index drawn from survey data. We used the indicator to quantify the present condition of pro-environmental consumption in 13 countries during the 12 years from 2004 to 2015. Moreover, based on the proposed indicator, we identified determinants to suggest directions for plans to activate pro-environmental consumption.

5. Conclusions

The results of this study are as follows. First, the proposed pro-environmental consumption index based on big data seems to represent pro-environmental consumption well. At the 99.9% level of significance, the proposed index was positively correlated with the existing Greendex index, with a p-value of 0.0038 and a correlation coefficient of 0.3716. Second, we analyzed the present condition of pro-environmental consumption for 13 countries using the proposed index. The pro-environmental consumption indexes were highest for Argentina and Brazil, both exceeding 15, and the index for Korea was just average among the countries studied, at about 3.13. Third, regression analysis identified variables that affected the index meaningfully. Especially health expenditure, the proportion of population aged 65 and above, and past orientation were all negatively correlated with the pro-environmental consumption index, and pre-primary education and GDP in higher GDP countries were positively correlated with the pro-environmental consumption indicators in Models 3 and 4.
By suggesting a pro-environmental index based upon search query data that could represent consumers’ collective consciousness, we proposed a useful method to analyze the status of pro-environmental consumption compared with existing questionnaires. This paper has several limitations. First, the sample size is too small to take into account autocorrelation over time and the nesting of the index in each country. Therefore, we checked the basic assumptions of the OLS before analyzing determinants via OLS. We conducted a Durbin-Watson test to verify auto correlation. The test result shows that the error terms had independency because the error terms caused little auto correlation. Second, a weak correlation of 0.3716 was found for reliability verification between Greendex and the proposed index because we considered only the purchasing step of pro-environmental consumption and examined the determinants of this step. In future research, the factors of pro-environmental consumption related to the purchase, use, and disposal stages should be analyzed. Third, although researchers have difficulty collecting individual level data because of cost, compared to collecting country level data, Franzen and Meyer [27] insisted that differences between individuals are larger than countries. In addition, despite their strength in representing the consumers’ collective consciousness, queries based on big data cannot directly indicate the consciousness of individual consumers. In other words, although big data queries can provide information about overall orientation, they do not present clear evidence at the individual level regarding whether individual search keywords imply positive or negative attitudes. Hence, further study is needed to explore a methodology for representing pro-environmental indexes for different subgroups of consumers from a macroscopic perspective. Furthermore, more specific strategies conducive to promoting pro-environmental consumption are needed.

Acknowledgments

This research was funded by the Korea Environment Institute under Grant GP2016-16-03 and the Korea Ministry of Environment as Climate Change Correspondence R&D Program (2014001300001).

Author Contributions

Jungwoo Shin and Donghyun Lee conceived and designed the research; Donghyun Lee collected data and analyzed the data; Suna Kang and Jungwoo Shin contributed to progress of research idea and provided the strategies. Donghyun Lee, Suna Kang and Jungwoo Shin wrote the paper. All authors have read and approved the final manuscript.

Conflicts of Interest

The authors declare no conflict of interest.

References

  1. Ministry of Environment. Public Organiations Spend 2.2 Trillon Korean Won to Purchase Green Products in 2014; Ministry of Environment: Sejoung, Korea, 2015.
  2. Ministry of Environment. The Status of Green Card Usage; Ministry of Environment: Sejoung, Korea, 2015.
  3. Ministry of Environment. The 3rd Master Plan for Activating Green Consumption; Ministry of Environment: Sejoung, Korea, 2015.
  4. Joireman, J.A.; Van Lange, P.A.; Van Vugt, M. Who cares about the environmental impact of cars? Those with an eye toward the future. Environ. Behav. 2004, 36, 187–206. [Google Scholar]
  5. Kwak, S.Y.; Lee, C.H. Public Attitude towards the Environment—2015 Survey; Korea Environment Institute: Sejong, Korea, 2014. [Google Scholar]
  6. Korea Environmental Industry & Technology Institute (KEITI). The Research on Activation Plan for Green Consumption; KEITI: Seoul, Korea, 2012. [Google Scholar]
  7. Korea Research Institute for Local Administration. Development of Green Competitiveness Index of Local Government; Korea Research Institute for Local Administration: Wonju, Korea, 2009. [Google Scholar]
  8. Efthimiadis, E.N. Interactive query expansion: A user-based evaluation in a relevance feedback environment. J. Am. Soc. Inf. Sci. 2000, 51, 989–1003. [Google Scholar] [CrossRef]
  9. Lee, D.; Kim, M.; Lee, J. Adoption of green electricity policies: Investigating the role of environmental attitudes via big data-driven search-queries. Energy Policy 2016, 90, 187–201. [Google Scholar] [CrossRef]
  10. Welsch, H.; Kühling, J. Determinants of pro-environmental consumption: The role of reference groups and routine behavior. Ecol. Econ. 2009, 69, 166–176. [Google Scholar] [CrossRef]
  11. Hwang, E.; Lee, K. A Study on Green Consumption Capacity Assessment; Korea Consumer Agency: Enmseong, Korea, 2010. [Google Scholar]
  12. Sohn, S.H.; Kim, K.; Rha, J.Y.; Choi, S. Green Consumption Competency: A conceptual model of its framework and components. Consum. Policy Educ. Rev. 2010, 8, 95–119. [Google Scholar]
  13. You, D.R. A Study on eco-friendly conscious and consumer behavior According to Self-Esteem. Consum. Policy Educ. Rev. 2013, 9, 85–105. [Google Scholar]
  14. Jackson, T. Motivating sustainable consumption. Sustain. Dev. Res. Netw. 2005, 29, 30. [Google Scholar]
  15. Park, U.A.; Rhee, K.C. A study on environmentally conscious consumer behavior. J. Korean Home Econ. Assoc. 1995, 33, 199–212. [Google Scholar]
  16. Peattie, K. Green consumption: behavior and norms. Annu. Rev. Environ. Resour. 2010, 35, 195–228. [Google Scholar] [CrossRef]
  17. Steg, L.; Vlek, C. Encouraging Pro-environmental Behavior: An integrate review and research agenda. J. Environ. Psychol. 2009, 29, 309–317. [Google Scholar] [CrossRef]
  18. Yang, I.M.; Park, C. Factors influencing consumer’s attitude and buying behavior on the green products. Asia Pac. J. Bus. Ventur. 2012, 7, 55–64. [Google Scholar]
  19. Levin, G. Consumers turning green: JWT survey. Advert. Age 1990, 61, 3–7. [Google Scholar]
  20. Statistics Korea. Green Life Index: Based on Green Life Survey Results; Statistics Korea: Daejeon, Korea, 2011.
  21. Greendex. Consumer Choice and the Environment—A Worldwide Tracking Survey; Greendex: Washington, DC, USA, 2014. [Google Scholar]
  22. Mediamark Research & Intelligence. Survey of the American Consumer; Mediamark Research & Intelligence: New York, NY, USA, 2008; Available online: http://www.mediamark.com/ (accessed on 21 October 2016).
  23. League of Conservation Voters. National Environmental Scorecard; League of Conservation Voters: Washington, DC, USA, 2016. [Google Scholar]
  24. Lyon, T.P.; Yin, H. Why do states adopt renewable portfolio standards: An empirical investigation. Energy J. 2010, 31, 133–157. [Google Scholar] [CrossRef]
  25. Diamantopoulos, A.; Schlegelmilch, B.B.; Sinkovics, R.R.; Bohlen, G.M. Can socio-demographics still play a role in profiling green consumers? A review of the evidence and an empirical investigation. J. Bus. Res. 2003, 56, 465–480. [Google Scholar]
  26. Franzen, A.; Meyer, R. Environmental attitudes in cross-national perspective: A multilevel analysis of the ISSP 1993 and 2000. Eur. Sociol. Rev. 2010, 26, 219–234. [Google Scholar] [CrossRef]
  27. Newsom, J.T.; McFarland, B.H.; Kaplan, M.S.; Huguet, N.; Zani, B. The health consciousness myth: Implications of the near independence of major health behaviors in the North American population. Soc. Sci. Med. 2005, 60, 433–437. [Google Scholar] [CrossRef] [PubMed]
  28. Magnusson, M.K.; Arvola, A.; Hursti, U.K.K.; Åberg, L.; Sjödén, P.O. Choice of organic foods is related to perceived consequences for human health and to environmentally friendly behavior. Appetite 2003, 40, 109–117. [Google Scholar] [CrossRef]
  29. Wandel, M.; Bugge, A. Environmental concern in consumer evaluation of food quality. Food Qual. Preference 1997, 8, 19–26. [Google Scholar] [CrossRef]
  30. Tregear, A.; Dent, J.B.; McGregor, M.J. The demand for organically grown produce. Br. Food J. 1994, 96, 21–25. [Google Scholar] [CrossRef]
  31. Lee, S.Y.; Sohn, M.S.; Nam, C.M. Structural modeling of health concern, health practice and health status of Koreans. Korean J. Prev. Med. 1995, 28, 187–206. [Google Scholar]
  32. Greenfield, S.; Kaplan, S.H.; Ware, J.E., Jr.; Yano, E.M.; Frank, H.J. Patients’ participation in medical care. J. Gen. Intern. Med. 1988, 3, 448–457. [Google Scholar] [CrossRef] [PubMed]
  33. Uyeki, E.S.; Holland, L.J. Diffusion of pro-environment attitudes? Am. Behav. Sci. 2000, 43, 646–662. [Google Scholar] [CrossRef]
  34. Vining, J.; Ebreo, A. What makes a recycler? A comparison of recyclers and nonrecyclers. Environ. Behav. 1990, 22, 55–73. [Google Scholar]
  35. Bak, H.J.; Huh, J.Y. Structure and determinants of pro-environmental behavior—The effect of environmental consciousness and multi-dimensionality of pro-environmental behavior. J. Environ. Policy Adm. 2010, 18, 1–26. [Google Scholar]
  36. Li, S. Recycling behavior under China’s social and economic transition the case of metropolitan Wuhan. Environ. Behav. 2003, 35, 784–801. [Google Scholar] [CrossRef]
  37. Whitmarsh, L.; O’Neill, S. Green identity, green living? The role of pro-environmental self-identity in determining consistency across diverse pro-environmental behaviors. J. Environ. Psychol. 2010, 30, 305–314. [Google Scholar] [CrossRef]
  38. Van Liere, K.D.; Dunlap, R.E. The social bases of environmental concern: A review of hypotheses, explanations and empirical evidence. Public Opin. Q. 1980, 44, 181–197. [Google Scholar] [CrossRef]
  39. World Bank. Available online: http://www.worldbank.org (accessed on 6 September 2016).
  40. Kollmuss, A.; Agyeman, J. Mind the gap: Why do people act environmentally and what are the barriers to pro-environmental behavior? Environ. Educ. Res. 2002, 8, 239–260. [Google Scholar] [CrossRef]
  41. Buttel, F.H.; Flinn, W.L. Environmental politics: The structuring of partisan and ideological cleavages in mass environmental attitudes. Sociol. Q. 1976, 17, 477–490. [Google Scholar] [CrossRef]
  42. Roberts, J.A. Green consumers in the 1990s: Profile and implications for advertising. J. Bus. Res. 1996, 36, 217–231. [Google Scholar] [CrossRef]
  43. Tilikidou, I. Ecologically Conscious Consumer Behaviour: A Research Project Conducted in Thessalonik. Ph.D. Thesis, University of Sunderland, Sunderland, UK, 2001. [Google Scholar]
  44. Eagles, P.F.; Demare, R. Factors influencing children’s environmental attitude. J. Environ. Educ. 1999, 30, 33–37. [Google Scholar] [CrossRef]
  45. Palmer, J.A. Development of concern for the environment and formative experience of educator. J. Environ. Educ. 1993, 24, 26–30. [Google Scholar] [CrossRef]
  46. Organisation for Economic Co-operation and Development (OECD). Society at a Glance: Asia/Pacific 2014; OECD: Paris, France, 2014. [Google Scholar]
  47. Preis, T.; Moat, H.S.; Stanley, H.E.; Bishop, S.R. Quantifying the advantage of looking forward. Sci. Rep. 2012, 2. [Google Scholar] [CrossRef] [PubMed]
  48. Corral-Verdugo, V.; Fraijo-Sing, B.; Pinheiro, J.Q. Sustainable behavior and time perspective: Present, past, and future orientations and their relationship with water conservation behavior. Interam. J. Psychol. 2006, 40, 139–147. [Google Scholar]
  49. Milfont, T.L.; Wilson, J.; Diniz, P. Time perspective and environmental engagement: A meta-analysis. Int. J. Psychol. 2012, 47, 325–334. [Google Scholar] [CrossRef] [PubMed]
  50. Lee, D.; Lee, H.; Choi, M. Examining the relationship between past orientation and US suicide rates: An analysis using big data-driven Google search queries. J. Med. Internet Res. 2016, 18, e35. [Google Scholar] [CrossRef] [PubMed]
Figure 1. Description of Greendex pro-environmental index [21].
Sustainability 09 00183 g001
Figure 2. Pro-environmental consumption indexes for 13 countries.
Sustainability 09 00183 g002
Figure 3. Proposed index scores for 13 countries over the 2004–2015 study period.
Sustainability 09 00183 g003
Table 1. Green living indicators [20].
Purchase Related Practice IndexPurchase Related Performance Index
Green communityAwareness of environmental issues
-
Seriousness of climate change (85.3%)
-
Environmental damage by life habits (94.0%)
-
Slowing down economic development for the environment (85.1%)
Correct knowledge of green life scheme
-
Environment mark (40.4%)
-
Carbon labeling (28.0%)
Share in environmental protection
-
Spending intention (30.5%)
Green familyPurchase of pro-environmental goods
-
Buying goods of with environmental certification marks (32.2%)
-
Buying carbon labelling products (31.1%)
-
Buying energy-saving products (71.9%)
-
Buying environmentally friendly agricultural products (56.9%)
-
Buying local agricultural products (46.6%)
-
Buying after checking food additives (56.1%)
-
Buying refillable products (detergents) (82.3%)
Purchase infrastructure for pro-environmental goods
-
Product authentication with environmental marks (a growing trend)
-
Carbon labeling products (a growing trend)
-
Proportion of pro-environmental agricultural products (a growing trend)
Green traffic Pro-environmental transportation
-
Small car enrollment rate (8.7%, a growing trend)
-
Green car enrollment rate (0.2%, a growing trend)
Table 2. ‘Recyclables’ and ‘disposables’ queries used for each country studied.
CountryRecyclables QueryDisposables Query
Argentinareciclajedesechables
Brazilreciclagemdescartáveis
United Statesrecyclablesdisposables
Australiarecyclablesdisposables
United Kingdomrecyclablesdisposables
Canadarecyclablesdisposables
China回收耗材
Hungaryújrahasznosíthatóegyszerhasználatos
Japanリサイクル品使い捨て
Mexicoreciclajedesechables
South Africarecyclablesdisposables
Korea, Rep.재활용품일회용품
Spainreciclajedesechables
Table 3. Statistics on the Greendex consumption index and the proposed pro-environmental consumption index based upon big data.
VariableObs (Observation)MeanStd. Dev.MinMax
Greendex Goods5949.7324.44942.20057.800
Proposed index595.2576.4610.09327.950
Table 4. Descriptions of the independent variables.
VariableDescriptionUnitScaleSource
Pro-environmental consumption indexLag value of the pro-environmental consumption index0–100 (Index)/102Google Trends (http://www.google.com/trends/)
Health expenditureLag value of health expenditureUS$/103World Bank
Age 65 and aboveLag value of population aged 65 and above (% of total)%/102World Bank
Pre-primary educationLag value of pre-primary educationYears World Bank
Low GDP countries’ GDPInteraction term: (country with a GDP of USD 10,000 or less) × Lag value of GDP per capitaUS$/104World Bank
High GDP countries’ GDPInteraction term: (country with a GDP of USD 30,000 or more) × Lag value of GDP per capitaUS$/104World Bank
Past orientationPast orientation0–100 (Index)/102Google Trends
Table 5. Summary statistics on the independent variables.
VariableObs. aMeans.e. bMinMax
Pro-environmental consumption index1300.0490.0630.0000.280
Health expenditure1302.4502.2840.0718.988
Age 65 and above1300.1210.0500.0450.250
Preprimary education1302.3080.8791.0004.000
Low GDP countries’ GDP1300.2140.3580.0001.304
High GDP countries’ GDP1301.9342.1860.0006.765
Past orientation1300.0120.0040.0060.027
a Since we considered data in 2014 as the lag variable, the total observation is 130 Obs. (13 countries × 10 years (2005–2014)); b s.e. represents standard error.
Table 6. Regression analysis results c.
Model 1Model 2Model 3Model 4
Coef.s.e.p > tCoef.s.e.p > tCoef.s.e.p > tCoef.s.e.p > t
Health expenditure−0.006 **0.0020.015−0.022 ***0.0060.000−0.009 *** d0.0030.000−0.021 ***0.0060.000
Age 65 and above−0.529 ***0.1310.000−0.903 ***0.2190.000−0.554 ***0.1250.000−0.847 ***0.2140.000
Preprimary education0.027 ***0.0060.0000.045 ***0.0080.0000.030 ***0.0060.0000.043 ***0.0080.000
Low GDP country * GDP 0.0170.0190.381 0.0110.0180.570
High GDP country * GDP 0.024 ***0.0080.003 0.019 **0.0080.022
Past orientation −4.133 ***1.1510.000−3.329 ***1.1820.006
_cons0.065 ***0.0150.0000.059 ***0.0220.0070.118 ***0.0200.0000.104 ***0.0260.000
p > F0.000 0.000 0.000 0.000
R20.294 0.351 0.360 0.390
Adjusted R20.278 0.351 0.340 0.360
Number of observations130 130 130 130
c Notes: Coef.: coefficient, s.e.: standard error; d Significance level * p < 0.05, ** p < 0.01, *** p < 0.0015.

