
The Extent and Implications of the Microclimatic Conditions in the Urban Environment: A Vienna Case Study


Abstract
:1. Introduction
- High-resolution data streams across six key locations are obtained, structured, and analyzed. This facilitated the search for location-dependent manifestations of urban-level climatic circumstances across distinct low-density and high-density typologies in Vienna.
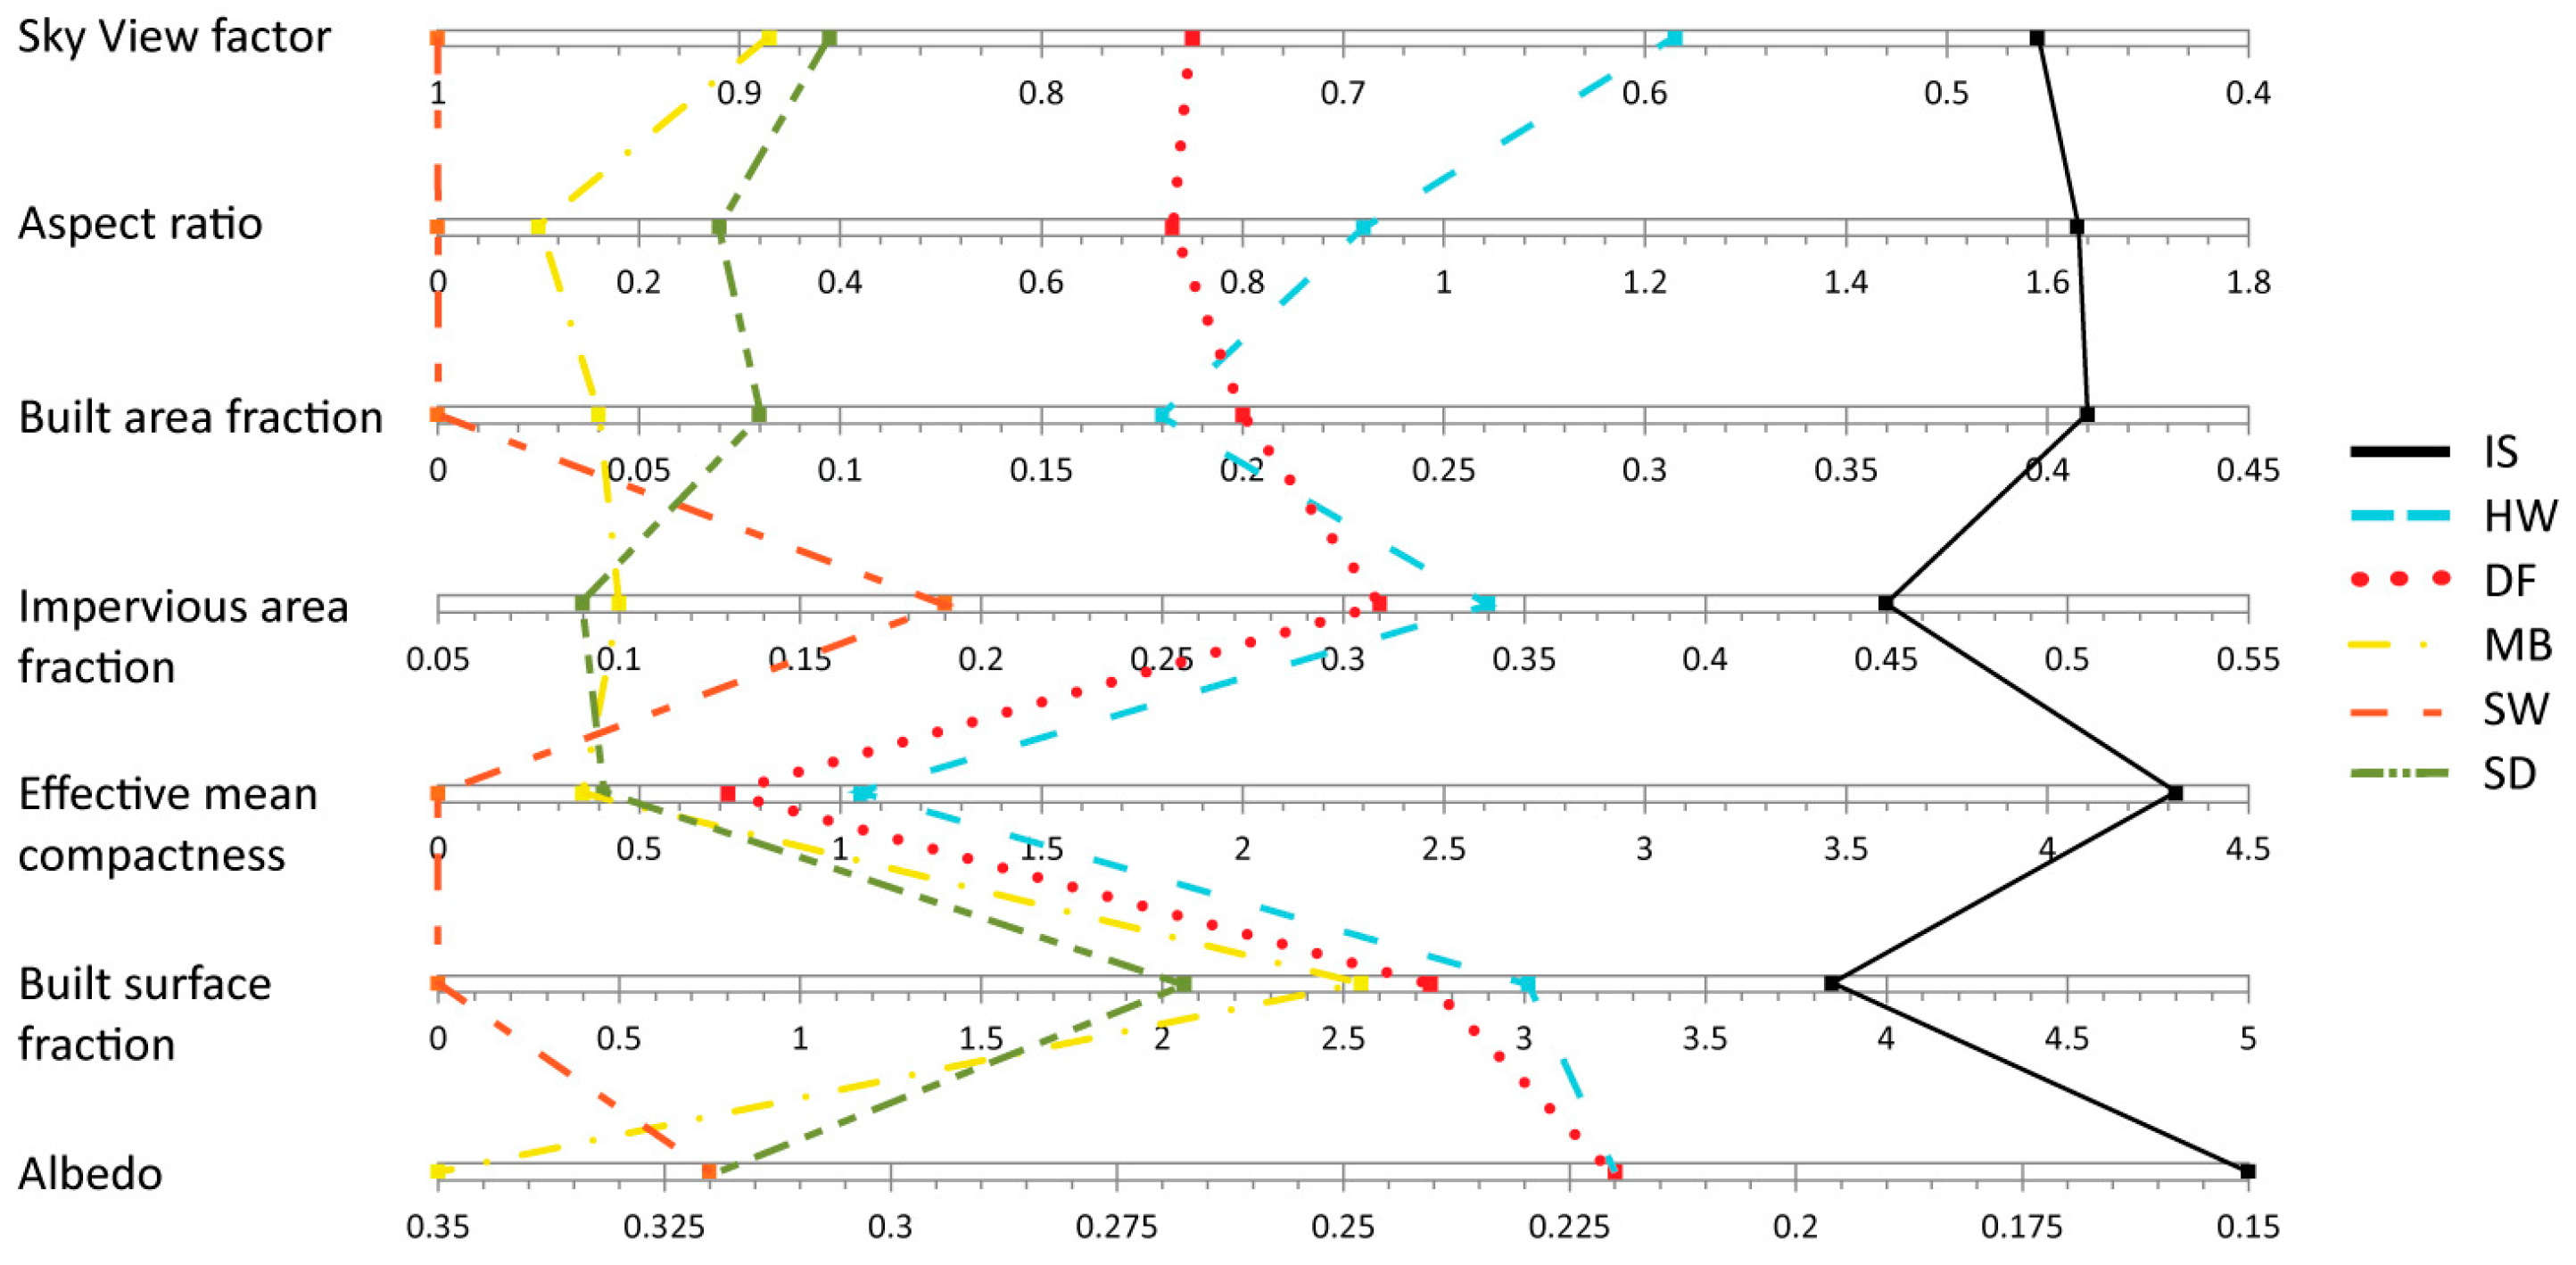
- Subsequently, a systematic framework was developed for the identification of the essential properties of the built environment that are hypothesized to influence the intra-urban microclimate variation. These properties pertain to both geometric (morphological) and semantic (material-related) urban features. Generally, there is a lack of practical assessment approaches focusing on microclimatic development while considering a relatively wide range of built environment attributes. Related assessments frequently focus on a few specific urban features instead of exploring the cumulative effect of the urban fabric on resulting urban heat.
- Once these features are derived, the existence and extent of the possible correlations between intra-urban microclimate variation and the urban features are explored. The resulting correlations can serve as the starting point toward developing empirically-based predictive models for prediction of local differences in the urban climate.
- Furthermore, the impact of this location-specific weather data streams on building performance simulation results is evaluated. For this purpose, systematic thermal performance simulations were carried out for a distinct sample of buildings using the obtained weather information as boundary conditions. The computed performance indicators were then analyzed across all locations.
2. Methodology
2.1. Urban Climate Diversity
2.2. The Essential Features of an Urban Unit of Observation
2.3. The Implications for the Buildings
3. Results and Discussion
3.1. Representation of Microclimatic Variance
3.2. Influence of Independent Variables
3.3. Implications for the Buildings
4. Conclusions
- Empirical observations revealed certain time-dependent (diurnal, nocturnal, and within-season) patterns implying larger temperature differences (up to 5 K) between locations during the night hours of a hot week in summer.
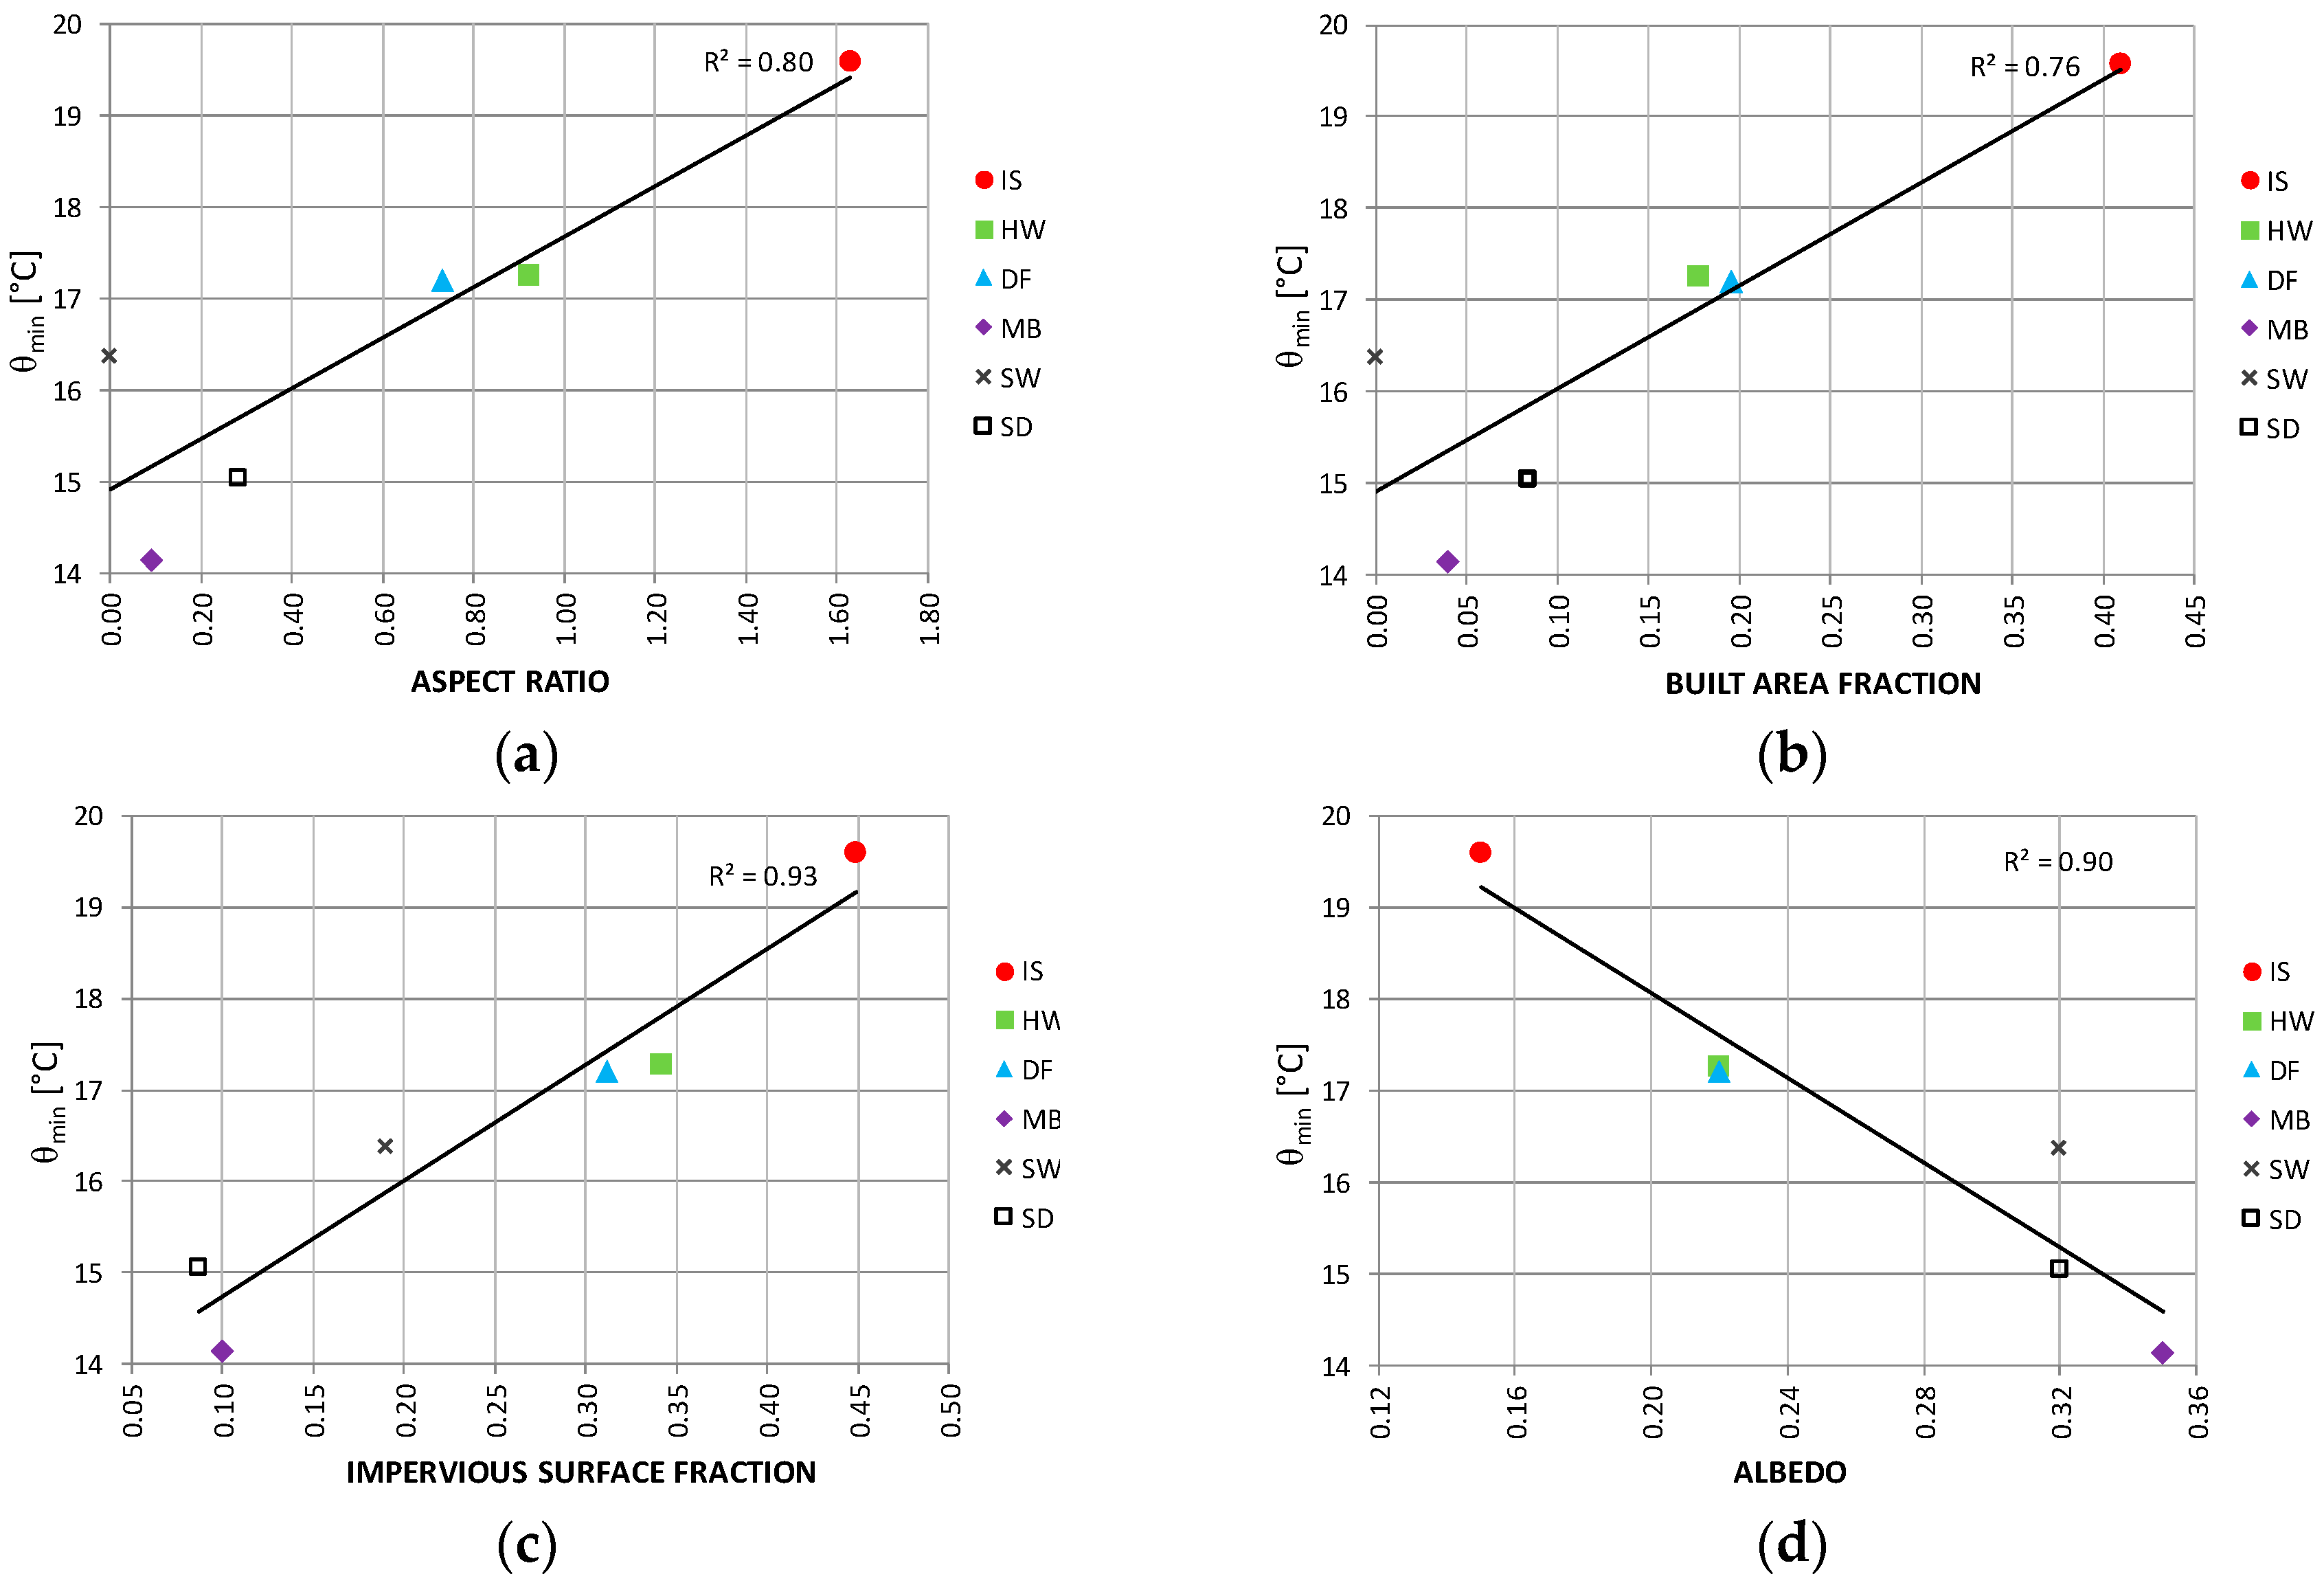
- The results further suggested that local climatic context can vary considerably depending on the site features such as the urban density and morphology, surface properties, extent of vegetation, etc. To further analyze this circumstance, we defined and computed the values of a number of morphological and physical features of urban settlements that influence the formation of urban microclimates. The obtained data further allowed for the exploration of plausible correlations between the night-time cooling potential and specific urban attributes. For example, it was noted that a higher impervious surface fraction noticeably correlated with higher night-time air temperature in the urban canyon (R2 = 0.93). Likewise, higher albedo may reduce the night-time air temperature in the urban canyon (R2 = 0.90). These findings offer a promising starting point for further explorations toward developing empirically-based predictive models that can improve the understanding and prediction of local differences in the urban climate.
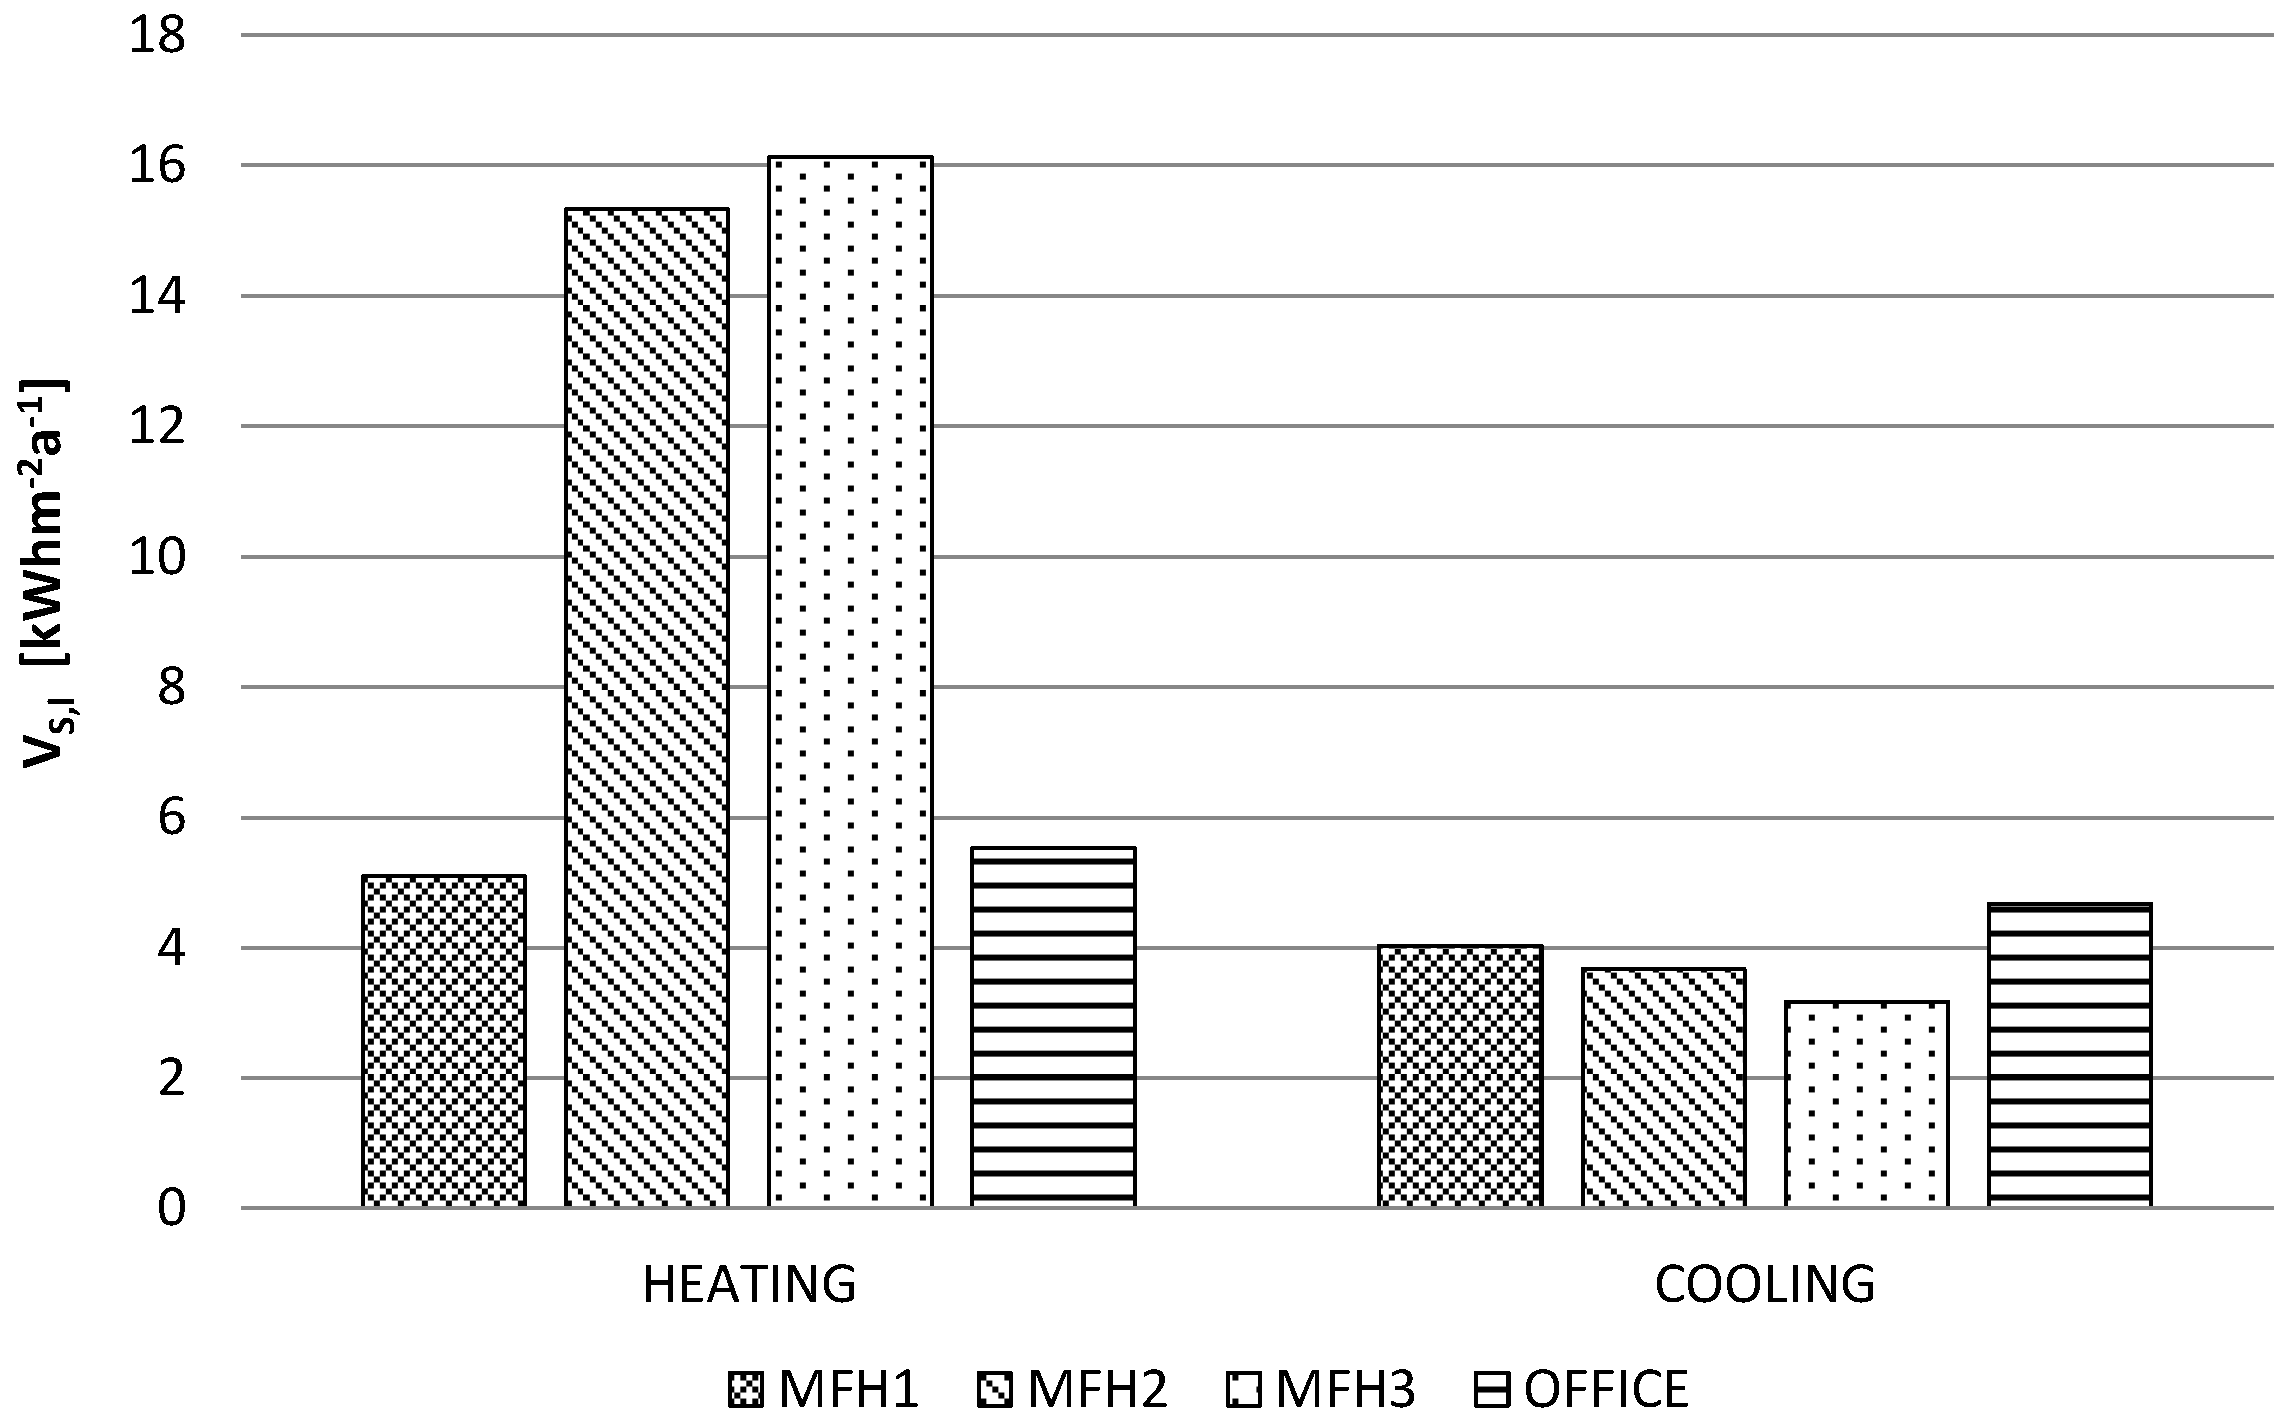
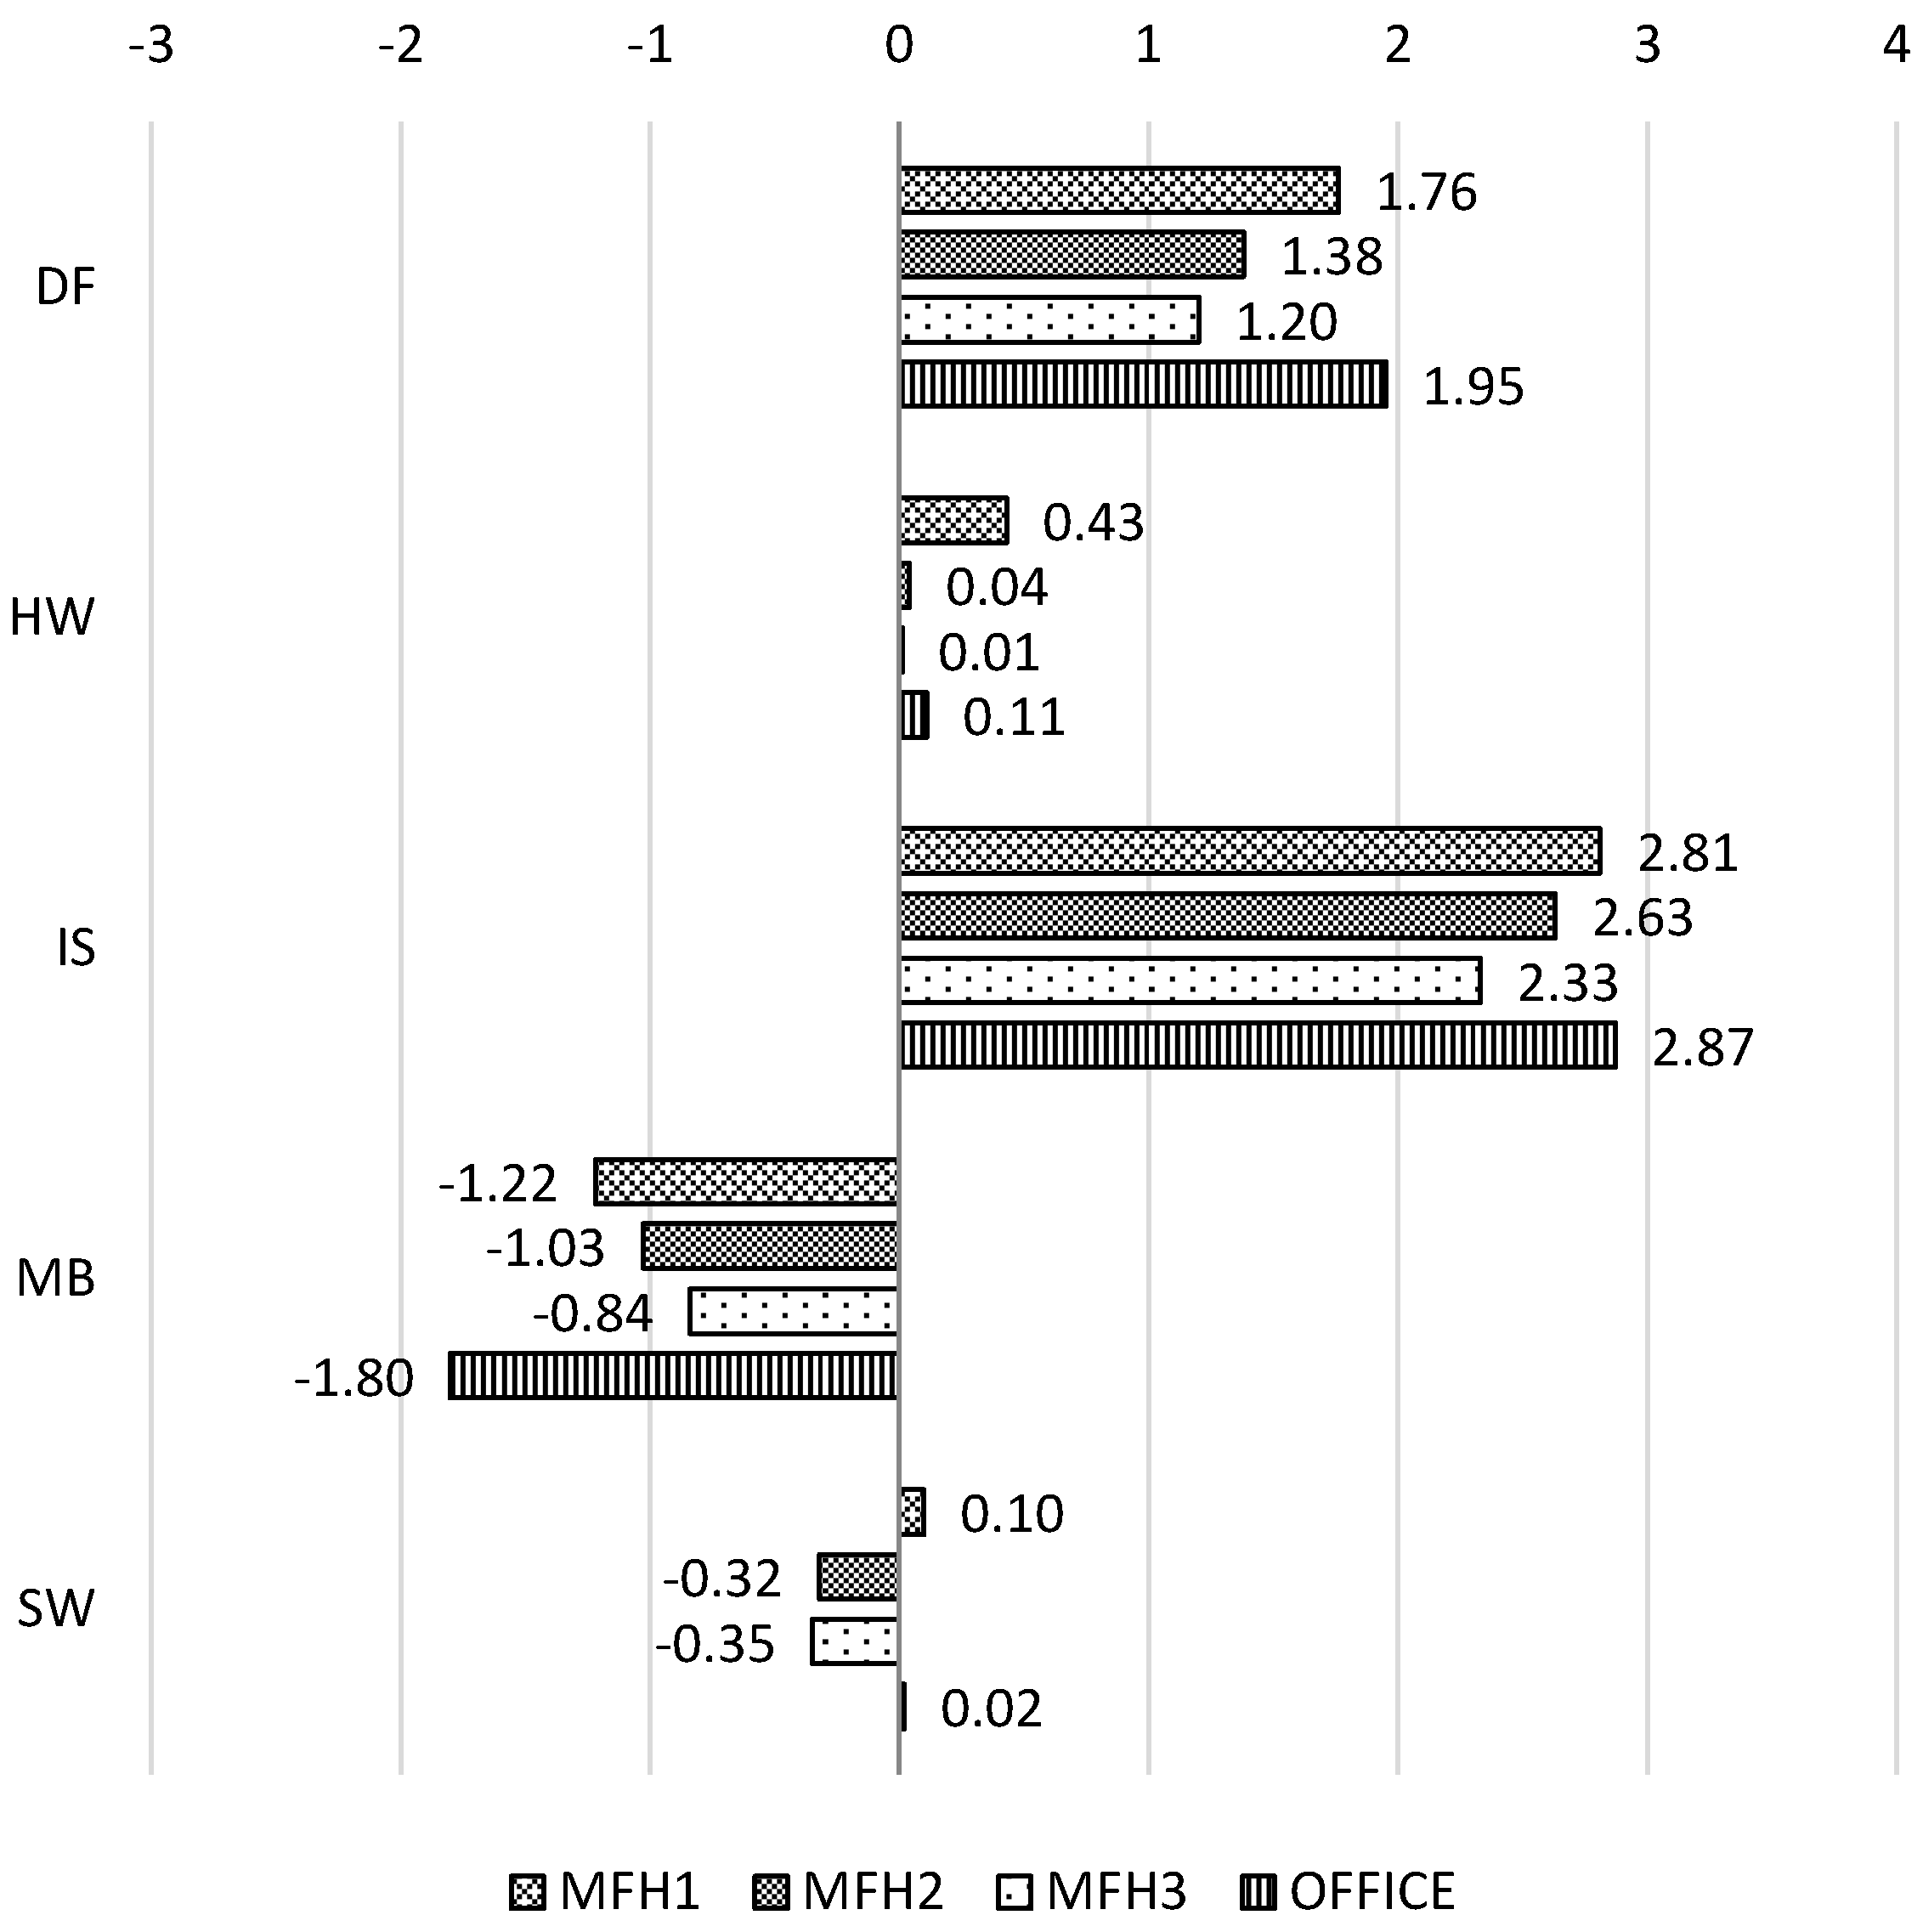
- Furthermore, we investigated the ramifications of observed microclimatic variation for the simulation-based assessment of buildings' thermal performance. Our findings point to the significant deviations in computed heating and cooling loads, as well as in overheating levels, with regard to both the location and input data (weather file). Thereby, the variation of mean annual heating load across locations may be as high as 16.1 kWhm−2·a−1 for residential building typology. This issue is especially critical given the potential for additional uncertainties when conducting simulations using standardized (location-independent) representations of the microclimatic boundary conditions.
Acknowledgments
Author Contributions
Conflicts of Interest
References
- Gulyás, A.; Unger, J.; Matzarakis, A. Assessment of the microclimatic and human comfort conditions in a complex urban environment: Modelling and measurements. Build. Environ. 2006, 41, 1713–1722. [Google Scholar] [CrossRef]
- Nikolopouloua, M.; Lykoudisb, S. Thermal comfort in outdoor urban spaces: Analysis across different European countries. Build. Environ. 2006, 41, 1455–1470. [Google Scholar] [CrossRef]
- Alcoforado, M.J.; Andrade, H. Global Warming and the Urban Heat Island. In Urban Ecology. An International Perspective on the Interaction between Humans and Nature; Marzluff, J.M., Shulenberger, E., Endlicher, W., Alberti, M., Bradley, G., Ryan, C., Simon, U., ZumBrunnen, C., Eds.; Springer: Berlin, Germany, 2008; pp. 249–262. [Google Scholar]
- Codrington, S. Planet Geography, 7th ed.; Solid Star Press: Sydney, Australia, 2013. [Google Scholar]
- Nuruzzaman, Md. Urban Heat Island: Causes, Effects and Mitigation Measures—A Review. Int. J. Environ. Monit. Anal. 2015, 3, 67–73. [Google Scholar] [CrossRef]
- Yow, D.M. Urban Heat Islands: Observations, Impacts, and Adaptation. Geogr. Compass 2007, 1, 1227–1251. [Google Scholar] [CrossRef]
- Hatuka, T.; Saaroni, H. Resilience of outdoor spaces in an era of climate change: The problem of developing countries. Sustainability 2013, 5, 90–99. [Google Scholar] [CrossRef]
- Grimmond, C.S.B.; Oke, T.R. Heat Storage in Urban Areas: Local-Scale Observations and Evaluation of a Simple Model. J. Appl. Meteorol. 1999, 38, 922–940. [Google Scholar] [CrossRef]
- Golden, J.S. The Built Environment Induced Urban Heat Island Effect in Rapidly Urbanizing Arid—A Sustainable Urban Engineering Complexity. Environ. Sci. 2004, 1, 321–349. [Google Scholar] [CrossRef]
- Grimmond, C.S.B. Urbanization and global environmental change: Local effects of urban warming. Cities Glob. Environ. Chang. 2007, 173, 83–88. [Google Scholar] [CrossRef]
- Gartland, L. Heat Islands: Understanding and Mitigating Heat in Urban Areas, 1st ed.; Earthscan: London, UK, 2008. [Google Scholar]
- Brown, R. Design with Microclimate—The Secret to Comfortable Outdoor Space, 1st ed.; Island Press: Washington, DC, USA, 2010. [Google Scholar]
- Erell, E.; Pearlmutter, D.; Williamson, T.J. Urban Microclimate: Designing the Spaces between Buildings, 1st ed.; Earthscan: London, UK, 2011. [Google Scholar]
- Krpo, A.; Salamanca, F.; Martilli, A.; Clappier, A. On the Impact of Anthropogenic Heat Fluxes on the Urban Boundary Layer: A Two-Dimensional Numerical Study. Bound.-Layer Meteorol. 2010, 136, 105–127. [Google Scholar] [CrossRef]
- Silva, H.R.; Phelan, P.E.; Golden, J.S. Modeling effects of urban heat island mitigation strategies on heat-related morbidity: A case study for Phoenix, Arizona, USA. Int. J. Biometeorol. 2010, 54, 13–22. [Google Scholar] [CrossRef] [PubMed]
- Ellis, K.N.; Hathaway, J.M.; Mason, L.R.; Howe, D.A.; Epps, T.H.; Brown, V.M. Summer temperature variability across four urban neighborhoods in Knoxville, Tnnessee, USA. Theor. Appl. Climatol. 2015. [Google Scholar] [CrossRef]
- Jeganathan, A.; Andimuthu, R.; Prasannavenkatesh, R.; Kumar, D.S. Spatial variation of temperature and indicative of the urban heat island in Chennai Metropolitan Area, India. Theor. Appl. Climatol. 2016, 123, 83–95. [Google Scholar] [CrossRef]
- Chatzidimitriou, A.; Yannas, S. Microclimate development in open urban spaces: The influence ofform and materials. Energy Build. 2015, 108, 156–174. [Google Scholar] [CrossRef]
- Berardi, U.; Wang, Y. The effect of a denser city over the urban microclimate: The case of Toronto. Sustainability 2016, 8, 822. [Google Scholar] [CrossRef]
- Ambrosini, D.; Galli, G.; Mancini, B.; Nardi, I.; Sfarra, S. Evaluating mitigation effects of urban heat islands in a historical small center with the ENVI-Met® climate model. Sustainability 2014, 6, 7013–7029. [Google Scholar] [CrossRef]
- Liu, H.-L.; Shen, Y.-S. The impact of green space changes on air pollution and microclimates: A case study of the taipei metropolitan area. Sustainability 2014, 6, 8827–8855. [Google Scholar] [CrossRef]
- Jamei, E.; Rajagopalan, P.; Seyedmahmoudian, M.; Jamei, Y. Review on the impact of urban geometry and pedestrian level greening on outdoor thermal comfort. Renew. Sustain. Energy Rev. 2016, 54, 1002–1017. [Google Scholar] [CrossRef]
- Edussuriya, P.; Chan, A.; Ye, A. Urban morphology and air quality in dense residential environments in Hong Kong. Part I: District-level analysis. Atmos. Environ. 2011, 45, 4789–4803. [Google Scholar] [CrossRef]
- Greene, S.; Kalkstein, L.S.; Mills, D.M.; Samenow, J. An Examination of Climate Change on Extreme Heat Events and Climate—Mortality Relationships in Large U.S. Cities Weather Clim. Soc. 2011, 3, 281–292. [Google Scholar] [CrossRef]
- Wong, N.H.; Jusuf, S.K.; Syafii, N.I.; Chen, Y.; Hajadi, N.; Sathyanarayanan, H.; Manickavasagam, Y.V. Evaluation of the impact of the surrounding urban morphology on building energy consumption. Sol. Energy 2011, 85, 57–71. [Google Scholar] [CrossRef]
- Moonen, P.; Defraeye, T.; Dorer, V.; Blocken, B.; Carmeliet, J. Urban Physics: Effect of the micro-climate on comfort, health and energy demand. Front. Archit. Res. 2012, 1, 197–228. [Google Scholar] [CrossRef]
- Rode, P.; Keim, C.; Robazza, G.; Viejo, P.; Schofield, J. Cities and energy: Urban morphology and residential heat-energy demand. Environ. Plan. B 2014, 41, 138–162. [Google Scholar] [CrossRef]
- Pisello, A.L.; Pignatta, G.; Castaldo, V.L.; Cotana, F. The impact of local microclimate boundary conditions on building energy performance. Sustainability 2015, 7, 9207–9230. [Google Scholar] [CrossRef]
- Salamanca, F.; Georgescu, M.; Mahalov, A.; Moustaoui, M.; Wang, M. Anthropogenic heating of the urban environment due to air conditioning. J. Geophys. Res. Atmos. 2014, 119, 1–17. [Google Scholar] [CrossRef]
- Colombert, M.; Diab, Y.; Salagnac, J.-L.; Morand, D. Sensitivity study of the energy balance to urban characteristics. Sustain. Cities Soc. 2011, 1, 125–134. [Google Scholar] [CrossRef]
- Oke, T.R. City size and the urban heat island. Atmos. Environ. 1973, 7, 769–779. [Google Scholar] [CrossRef]
- Arnfield, A.J. Two decades of urban climate research: A review of turbulence, exchanges of energy and water, and the urban heat island. Int. J. Climatol. 2003, 23, 1–26. [Google Scholar] [CrossRef]
- Blazejczyk, K.; Bakowska, M.; Wieclaw, M. Urban heat island in large and small cities. In Proceedings of the 6th International Conference on Urban Climate, Göteborg, Sweden, 12–16 June 2006; pp. 794–797.
- Gaffin, S.R.; Rosenzweig, C.; Khanbilvardi, R.; Parshall, L.; Mahani, S.; Glickman, H.; Goldberg, R.; Blake, R.; Slosberg, R.B.; Hillel, D. Variations in New York City’s urban heat island strength over time and space. Theor. Appl. Climatol. 2008, 94, 1–11. [Google Scholar] [CrossRef]
- Giridharan, R.; Kolokotroni, M. Urban heat island characteristics in London during winter. Sol. Energy 2009, 83, 1668–1682. [Google Scholar] [CrossRef]
- Solecki, W.D.; Rosenzweig, C.; Parshall, L.; Pope, G.; Clark, M.; Cox, J.; Wiencke, M. Mitigation of the heat island effect in urban New Jersey. Environ. Hazards 2005, 6, 39–49. [Google Scholar] [CrossRef]
- O'Malley, C.; Piroozfarb, P.A.E.; Farr, E.R.P.; Gates, J. An investigation into minimizing urban heat island (UHI) effects: A UK perspective. Energy Procedia 2014, 62, 72–80. [Google Scholar] [CrossRef]
- Santamouris, M. Analyzing the heat island magnitude and characteristics in one hundred Asian and Australian cities and regions. Sci. Total Environ. 2015, 512–513, 582–598. [Google Scholar] [CrossRef] [PubMed]
- Santamouris, M. Heat Island Research in Europe: The State of the Art. Adv. Build. Energy Res. 2007, 1, 123–150. [Google Scholar] [CrossRef]
- Voogt, J.A. Urban Heat Island. In Encyclopedia of Global Environmental Change; Munn, T., Ed.; Wiley: Chichester, UK, 2003; Volume 3, pp. 660–666. [Google Scholar]
- Lowry, W.P. Empirical Estimation of Urban Effects on Climate: A Problem Analysis. J. Appl. Meteorol. 1977, 16, 129–135. [Google Scholar] [CrossRef]
- Stewart, I.D. A systematic review and scientific critique of methodology in modern urban heat island literature. Int. J. Climatol. 2011, 31, 200–217. [Google Scholar] [CrossRef]
- Stewart, I.D.; Oke, T.R. Local Climate Zones for Urban Temperature Studies. Bull. Am. Meteorol. Soc. 2012, 93, 1879–1900. [Google Scholar] [CrossRef]
- Mahdavi, A.; Kiesel, K.; Vuckovic, M. A framework for the evaluation of urban heat island mitigation measures. In Proceedings of the SB13 Munich Conference, Munich, Germany, 24–26 April 2013.
- Mahdavi, A.; Kiesel, K.; Vuckovic, M. Empirical and computational assessment of the urban heat island phenomenon and related mitigation measures. Geogr. Polonica 2014, 87, 505–516. [Google Scholar] [CrossRef]
- Mahdavi, A.; Kiesel, K.; Vuckovic, M. Empirical and computational assessment of the urban heat island phenomenon and related mitigation measures. In Proceedings of the 10th Nordic Symposium on Building Physics, Lund, Sweden, 15–19 June 2014.
- Vuckovic, M.; Kiesel, K.; Mahdavi, A. Toward advanced representations of the urban microclimate in building performance simulation. Sustain. Cities Soc. 2016, 27, 356–366. [Google Scholar] [CrossRef]
- World Meteorological Organization. Guide to Meteorological Instruments and Methods of Observation, WMO-No. 8, 7th ed.; World Meteorological Organization: Geneva, Switzerland, 2008. [Google Scholar]
- Oke, T.R. Towards better scientific communication in urban climate. Theor. Appl. Climatol. 2006, 84, 179–190. [Google Scholar] [CrossRef]
- ZAMG. Zentralanstalt für Meteorologie und Geodynamik. Available online: http://www.zamg.ac.at (accessed on 1 September 2016).
- Svensson, P.; Björnsson, H.; Samuli, A.; Andresen, L.; Bergholt, L.; Tveito, O.E.; Agersten, S.; Pettersson, O.; Vejen, F. Quality Control of Meteorological Observations, Description of Potential HQC Systems; Norwegian Meteorological Institute: Oslo, Norway, 2004. [Google Scholar]
- Mahdavi, A.; Kiesel, K.; Vuckovic, M. Methodologies for UHI Analysis. In Counteracting Urban Heat Island Effects in a Global Climate Change Scenario; Musco, F., Ed.; Springer: Berlin, Germany, 2016; pp. 71–91. [Google Scholar] [CrossRef]
- QGIS 2.10. Available online: www.qgis.org/ (accessed on 1 September 2016).
- Glawischnig, S.; Kiesel, K.; Mahdavi, A. Feasibility analysis of open-government data for the automated calculation of the micro-climatic attributes of Urban Units of Observation in the city of Vienna. In Proceedings of the 2nd ICAUD International Conference in Architecture and Urban Design, Tirana, Albania, 8–10 May 2014.
- Glawischnig, S.; Hammerberg, K.; Vuckovic, M.; Kiesel, K.; Mahdavi, A. A case study of geometry-based automated calculation of microclimatic attributes. In Proceedings of the 10th European Conference on Product and Process Modelling, Vienna, Austria, 17–19 September 2014.
- Hammerberg, K.; Mahdavi, A. GIS-based simulation of solar radiation in urban environments. In Proceedings of the ECPPM 2014, eWork and eBusiness in Architecture, Engineering and Construction, Vienna, Austria, 17–19 September 2014.
- Mirzaei, P.A.; Haghighat, F. Approaches to study Urban Heat Island—Abilities and limitations. Build. Environ. 2010, 45, 2192–2201. [Google Scholar] [CrossRef]
- Thermal Analysis Simulation Software—EDSL TAS. Available online: www.edsl.net/ (accessed on 1 September 2016).
- Zoras, S.; Dimoudi, A. Modelling and Bioclimatic Interventions in Outdoor Spaces. In Energy Performance of Buildings, Energy Efficiency and Built Environment in Temperate Climates; Boemi, S.-N., Irulegi, O., Santamouris, M., Eds.; Springer: Berlin, Germany, 2016; pp. 523–540. [Google Scholar]
- Abdullah, A.H.; Wang, F. Modelling Thermal Stratification in Atrium Using TAS Program and Verification of Prediction Results. Int. J. Integrated Eng. (Issue Civ. Environ. Eng.) 2009, 1, 79–93. [Google Scholar]
- Mahdavi, A.; Orehounig, K.; Mikats, N.; Lambeva, L.; El-Habashi, A. Analyzing Traditional Buildings via Empirically Calibrated Building Performance Models. In Proceedings of the 10th International Building Performance Simulation Association Conference and Exhibition, Beijing, China, 3–6 September 2007.
- Kiesel, K.; Orehounig, K.; Mahdavi, A. Model assumptions and their influence on the predicted heating load of an office building. Bauphysik 2010, 32, 359–364. [Google Scholar] [CrossRef]
- Statistics Austria. Available online: https://www.statistik.at/ (accessed on 5 January 2017).
- ASI (Austrian Standards Institute). ÖNORM B8110-5: Thermal Insulation in Building Construction—Part 5: Model of Climate and User Profiles; Austrian Standards Institute: Vienna, Austria, 2011. [Google Scholar]
- ASI (Austrian Standards Institute). ÖNORM B8110-3: Thermal Protection in Building Construction—Part 3: Prevention of Overheating; Austrian Standards Institute: Vienna, Austria, 2012. [Google Scholar]
- ASI (Austrian Standards Institute). ÖNORM B8110-6: Thermal Insulation in Building Construction—Part 6: Principles and Verification Methods—Heating Demand and Cooling Demand—National Application, National Specifications and National Supplements to ÖNORM EN ISO 13790; Austrian Standards Institute: Vienna, Austria, 2014. [Google Scholar]
- IPCC (Intergovernmental Panel on Climate Change). Climate Change 2013: The Physical Science Basis; Contribution of Working Group I to the Fifth Assessment Report of the Intergovernmental Panel on Climate Change; Stocker, T.F., Qin, D., Plattner, G.-K., Tignor, M., Allen, S.K., Boschung, J., Nauels, A., Xia, Y., Bex, V., Midgley, P.M., Eds.; Cambridge University Press: Cambridge, UK; New York, NY, USA, 2013. [Google Scholar]


| Name | LCZ Classification | Coordinates | Station Elevation (above Ground) (m) | Site Elevation (m) | |
|---|---|---|---|---|---|
| IS | Innere Stadt | LCZ 2 | Lat 48°11′54.00′′ | 9.3 | 177 |
| Long 16°22′1.00′′ | |||||
| HW | Hohe Warte | LCZ 6 | Lat 48°14′55.00′′ | 1.9 | 198 |
| Long 16°21′23.00′′ | |||||
| DF | Donaufeld | LCZ 6 | Lat 48°15′27.00′′ | 2 | 161 |
| Long 16°26′0.00′′ | |||||
| MB | Mariabrunn | LCZ 9 | Lat 48°12′0.00′′ | 2.1 | 225 |
| Long 16°13′59.88′′ | |||||
| SW | Schwechat | LCZ DE | Lat 48°06′39.0′′ | 2.2 | 184 |
| Long 16°34′15.0′′ | |||||
| SD | Seibersdorf | LCZ 8D | Lat 47°58′35.00′′ | 2.1 | 185 |
| Long 16°30′18.00′′ | |||||
| Hot Week 7–13 June 2014 | Cold Week 20–26 August 2014 | |||||||||||
|---|---|---|---|---|---|---|---|---|---|---|---|---|
| IS | HW | DF | MB | SW 1 | SD | IS | HW | DF | MB | SW 1 | SD | |
| Max temperature (°C) | 34.7 | 33 | 34.4 | 33.1 | 26.9 | 34.6 | 23.5 | 22.3 | 22.6 | 22.4 | 23.9 | 22.4 |
| Min temperature (°C) | 16 | 13.2 | 12.9 | 9.7 | 9.9 | 11 | 12.2 | 10 | 9.8 | 8 | 9.7 | 8 |
| Total precipitation (mm) | 0 | 0 | 0 | 1 | - | 2 | 49 | 58 | 44 | 26 | - | 22 |
| Mean wind speed (m/s) | 2 | 2 | 1 | 1 | 4 | 2 | 3 | 3 | 2 | 2 | 4 | 2 |
| Type | MFH 1 | MFH 2 | MFH 3 | OFFICE |
|---|---|---|---|---|
| Residental, Multi-Family | Office Building | |||
| Year of construction | 2014 | 1960s | 1900s | 2010 |
| Height (m) | 18 | 24.3 | 23.3 | 26.5 |
| Heated floor area (m2) | 1407 | 1434 | 1949 | 15,472 |
| Gross volume (m3) | 4062 | 4307 | 7357 | 58,412 |
| Mean floor height (m) | 2.89 | 3.00 | 3.78 | 3.78 |
| Gross floor area/Gross building volume | 0.29 | 0.36 | 0.23 | 0.17 |
| Internal Gains (Wm−2) | Ach (h−1) | ||||
|---|---|---|---|---|---|
| Eg | Lg | Os | Ol | ||
| 24 h | 1.5 | 1.5 | 0.6 | 0.15 | 0.4 |
| Thermostat settings | |||||
| Upper limit | 27 °C | 24 h | |||
| Lower limit | 20 °C | 24 h | |||
| Internal Gains (Wm−2) | Ach (h−1) | ||||
|---|---|---|---|---|---|
| Eg | Lg | Os | Ol | ||
| Occupied | 5.0 | 2.5 | 0.6 | 1.5 | 0.7 |
| Unoccupied | 1.0 | 0.5 | 0 | 0 | 0.4 |
| Thermostat settings | |||||
| Occupied | Unoccupied | ||||
| Upper limit | 26 °C | 29 °C | |||
| Lower limit | 20 °C | 17 °C | |||
| Internal Gains (Wm−2) | Ach (h−1) | ||||
|---|---|---|---|---|---|
| Eg | Lg | Os | Ol | ||
| Occupied | 0 | 3.0 | 0.6 | 0.15 | 0.4 |
| Unoccupied | 0 | 1.0 | 0 | 0 | 0.4 |
| Thermostat settings | |||||
| Occupied | Unoccupied | ||||
| Upper limit | 29 °C | 29 °C | |||
| Lower limit | 17 °C | 17 °C | |||
© 2017 by the authors. Licensee MDPI, Basel, Switzerland. This article is an open access article distributed under the terms and conditions of the Creative Commons Attribution (CC BY) license ( http://creativecommons.org/licenses/by/4.0/).
Share and Cite
Vuckovic, M.; Kiesel, K.; Mahdavi, A. The Extent and Implications of the Microclimatic Conditions in the Urban Environment: A Vienna Case Study. Sustainability 2017, 9, 177. https://doi.org/10.3390/su9020177
Vuckovic M, Kiesel K, Mahdavi A. The Extent and Implications of the Microclimatic Conditions in the Urban Environment: A Vienna Case Study. Sustainability. 2017; 9(2):177. https://doi.org/10.3390/su9020177
Chicago/Turabian StyleVuckovic, Milena, Kristina Kiesel, and Ardeshir Mahdavi. 2017. "The Extent and Implications of the Microclimatic Conditions in the Urban Environment: A Vienna Case Study" Sustainability 9, no. 2: 177. https://doi.org/10.3390/su9020177
APA StyleVuckovic, M., Kiesel, K., & Mahdavi, A. (2017). The Extent and Implications of the Microclimatic Conditions in the Urban Environment: A Vienna Case Study. Sustainability, 9(2), 177. https://doi.org/10.3390/su9020177