Article

Mapping and Monitoring the Akagera Wetland in Rwanda

1
State Key Laboratory of Desert and Oasis Ecology, Xinjiang Institute of Ecology and Geography, Chinese Academy of Sciences, Urumqi 830011, China
2
University of Chinese Academy of Sciences, Beijing 100049, China
3
Faculty of Environmental Sciences, University of Lay Adventists of Kigali (UNILAK), P.O. 6392, Kigali, Rwanda
*
Author to whom correspondence should be addressed.
Sustainability 2017, 9(2), 174; https://doi.org/10.3390/su9020174
Submission received: 13 September 2016 / Revised: 16 January 2017 / Accepted: 19 January 2017 / Published: 25 January 2017
(This article belongs to the Special Issue Physical Geography and Environmental Sustainability)

Abstract

:
Wetland maps are a prerequisite for wetland development planning, protection, and restoration. The present study aimed at mapping and monitoring Rwanda’s Akagera Complex Wetland by means of remote sensing and geographic information systems (GIS). Landsat data, spanning from 1987 to 2015, were acquired from different sensor instruments, considering a 5-year interval during the dry season and the shuttle radar topographic mission (SRTM) digital elevation model (30-m resolution) was used to delineate the wetland. The mapping and delineation results showed that the wetland narrowly extends along the Rwanda-Tanzania border from north to south, following the course of Akagera River and the total area can be estimated at 100,229.76 ha. After waterbodies that occupy 30% of the wetland’s surface area, hippo grass and Cyperus papyrus are also predominant, representing 29.8% and 29%, respectively. Floodplain and swamp forest have also been inventoried in smaller proportions. While the wetland extent has apparently remained stable, the inhabiting waterbodies have been subject to enormous instability due to invasive species. Lakes, such as Mihindi, Ihema, Hago and Kivumba have been shrinking in extent, while Lake Rwanyakizinga has experienced a certain degree of expansion. This study represents a consistent decision support tool for Akagera wetland management in Rwanda.

1. Introduction

Since the signing of the Ramsar convention in 1971, great importance has been accorded to wetlands’ ecosystem services, and studies on wetlands have gained momentum worldwide. Wetlands comprise areas of marsh, fen, peatland, or water, whether natural or artificial, permanent or temporary, with water that is static or flowing, fresh, brackish or salty, including areas of marine water; the depth of which at low tide does not exceed 6 m [1]. Wetlands have the potential to regionally increase food security by sustainably increasing food production and supporting the uncoupling of food supply from global market price fluctuations. They provide important ecosystem services to numerous stakeholders and need to be protected from either exhaustion or extinction.
Rwanda’s wetlands are particularly important. They act as a buffer in flood or overflow plains, reducing maximal flow rates during the rainy season and maintaining relatively high flow rates during the dry season [2]. Despite these important benefits, wetlands have been drained extensively worldwide to increase acreage for the cultivation of crops and accommodate the expansion of human settlements [3]. Wetlands are extremely vulnerable to changes in land use and management, but the accelerated rates of climate change have added to the complexity of maintaining the functioning of wetlands [4]. Adding to that are invasive aquatic weeds that, in many regions of the world, interfere with river transportation, threatening the balance and the functioning of aquatic life [5,6,7].
To prevent further loss of wetlands and conserve existing wetlands’ ecosystem goods and services, it is paramount to accurately monitor wetlands and their adjacent highlands [8,9]. It has been shown that satellite remote sensing has the potential to effectively assist in monitoring and inventorying wetlands due to repeated coverages, allowing both seasonal and annual assessments [8,10,11]. Optical remote sensing works effectively in the detection of wetlands [12] and has been used to map large wetland ecosystems, including marshes and swamps on Sango Bay in Uganda [13]. Satellite remote sensing has the capability to identify areas where changes are occurring and where more detailed information must be gathered. Multi-temporal imagery allows for the highest accuracy in wetland identification and discrimination from other land cover types [8].
Although some studies have focused on mapping the wetlands of East Africa in general, specific location wetland maps and inventories are quasi-nonexistent and studies applying remote sensing to monitor small-scale wetlands are still relatively scarce. The Akagera wetland, the subject of the investigation in this study, has been recently proposed to the Ramsar secretariat for recognition as a wetland of international importance, but little is known regarding the extent and characteristics of this wetland. Thus, specific, appropriate mapping and monitoring studies on this wetland are more imperative than ever.
The present study, therefore, seeks to: (1) generate a clear Akagera wetland delineation map; (2) monitor the wetland through analysis of remote sensing longitudinal imagery; and (3) identify and provide the estimates of different wetland cover classes and, where possible, detect changes over time. In the following sections, the authors elaborate on the methods and materials used (Section 2); the results obtained (Section 3); the discussion and analysis of results (Section 4); and, finally, the conclusion (Section 5).

2. Materials and Methods
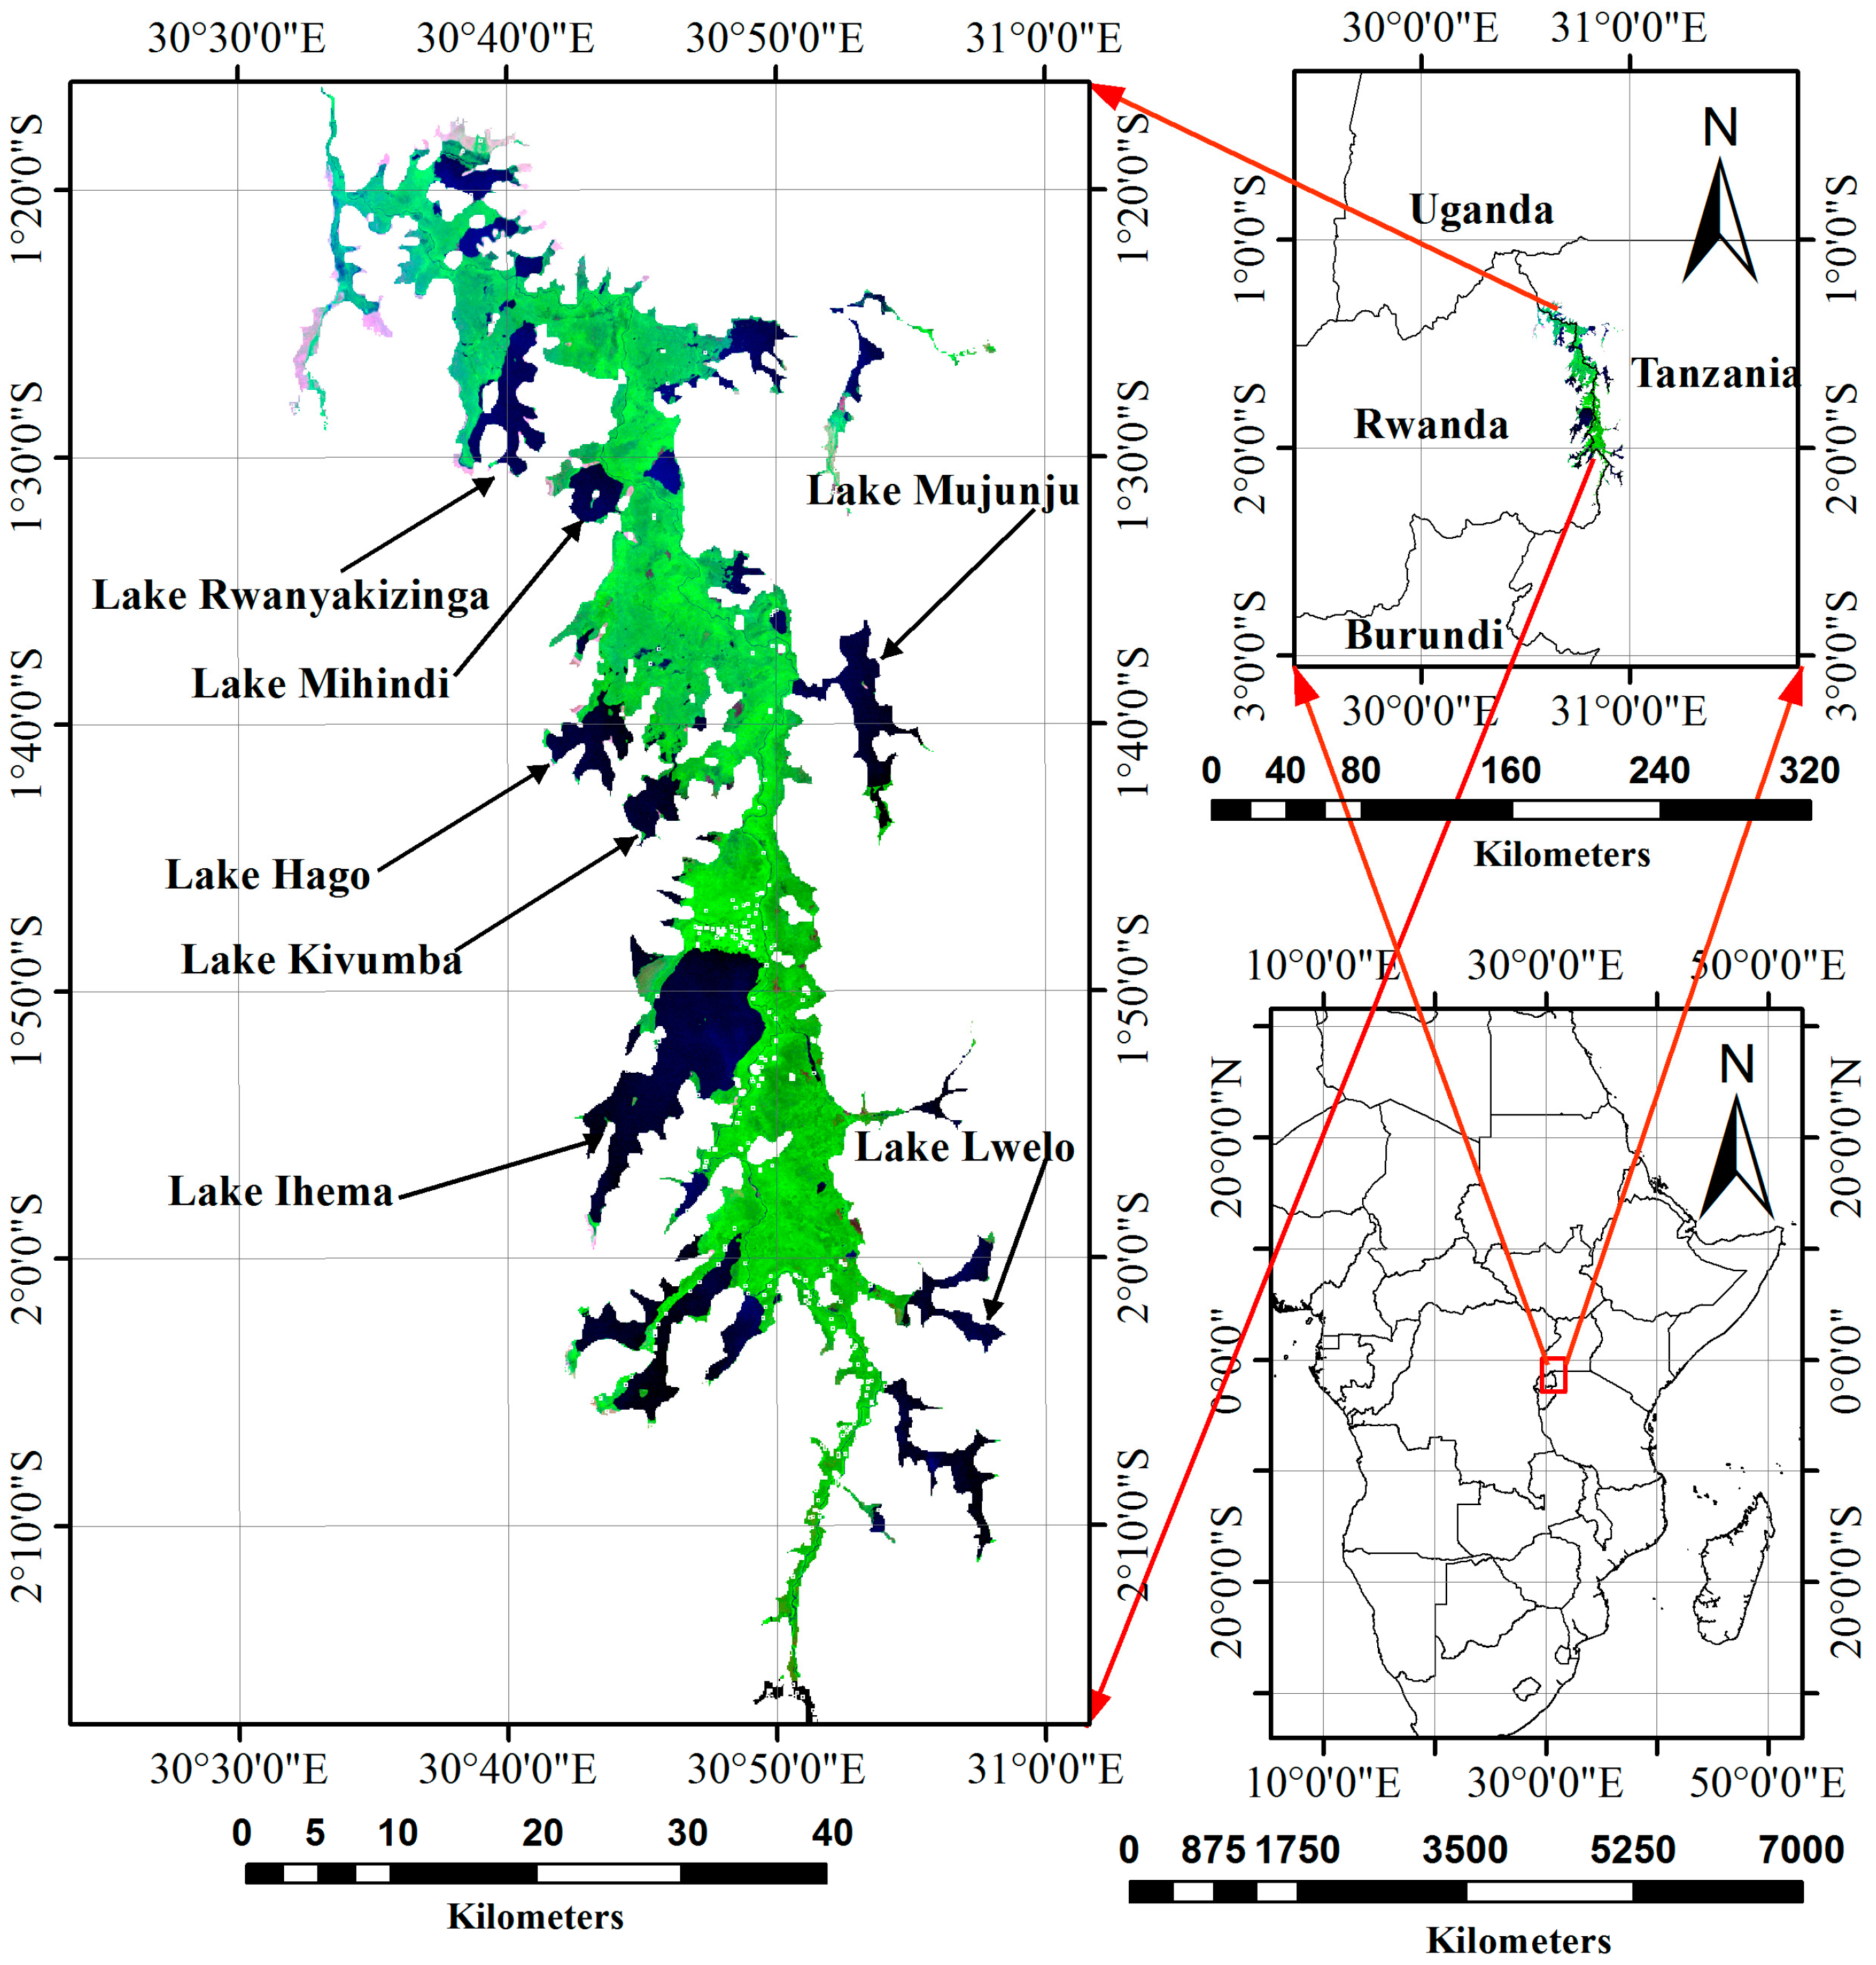
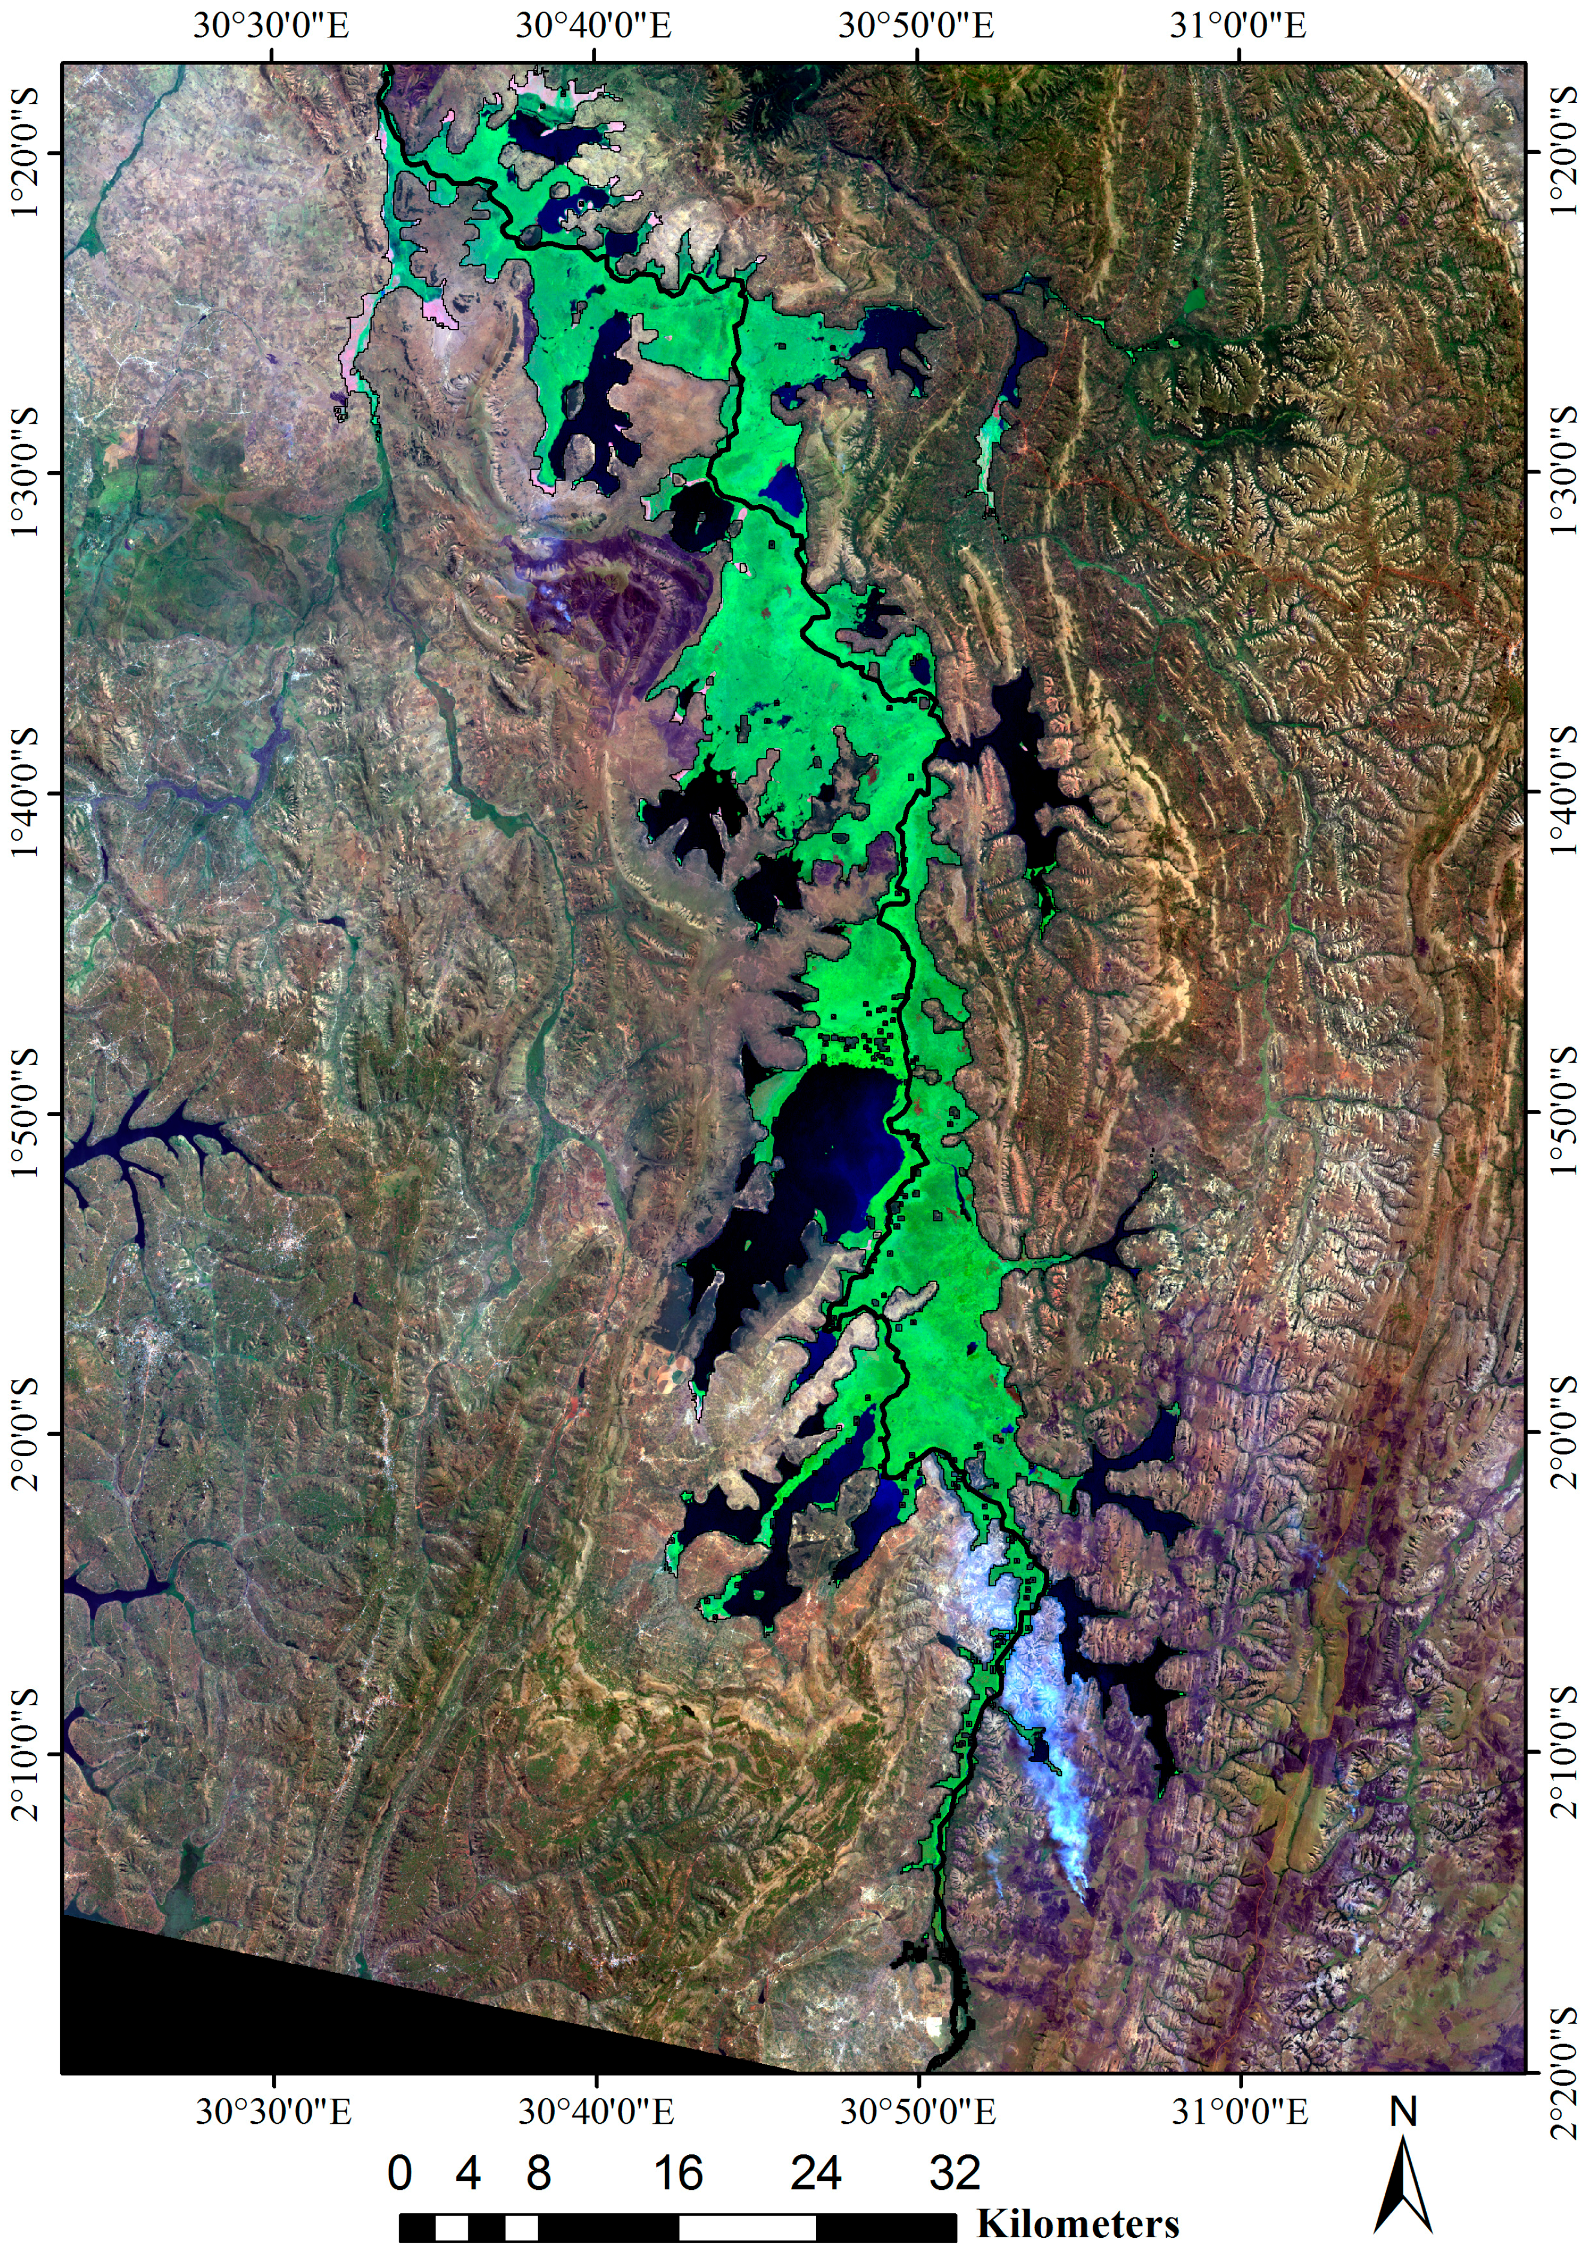
2.1. Study Area

The Akagera Complex Wetland comprises a transboundary network of wetlands lying between 1°18′–02°11′S and 30°33′–31°01′E, where it forms the borderland between Rwanda and Tanzania in East Africa. The wetland is traversed by the Akagera River that flows northwards into Lake Victoria, thus, the name of Akagera. The wetland marks the periphery of the Akagera National Park and is home to various wild animals, especially hippos, buffaloes, giraffes, impalas, and sitatunga and constitutes an important hydrological reservoir for watering animals in the park. Small-to medium-sized lakes are located within the wetland on both sides of the frontier, as displayed in Figure 1 and Figure 2. Those include Lake Rwanyakizinga, Lake Mihindi, Lake Hago, Lake Kivumbu, Lake Ihema, Lake Nasho, Lake Cyambwe, and Lake Mpanga on the Rwandan side; Lake Mujunju, Lake Lwelo, and Lake Bisongu on the Tanzanian side, enumerated from north to south. The geological base consists mainly of Precambrian granitic and quarzitic rocks [14]. The swamp is covered by Papyrus reed classified as Cypero papyri-Dryopteridetum gongylodis, which forms a species-poor plant community with dominating Cyperus papyrus. The region experiences four climatic seasons in which long rainy (March–late May) and short rainy seasons (end September–early December) alternate with long dry (June–September) and short dry (mid-December–February) seasons [15]. Under the shield of the natural reserve protection laws in Rwanda, human activities are limited in this area. A coordinated fishing framework in some lakes has been put in place by park managers. However, there are still some anthropogenic activities that continue to exacerbate pressure on these swamps, notably agriculture, cattle grazing, production of loam bricks, and the cutting of plants for animal feeding and construction purposes, especially at swamp edges [14].

2.2. Datasets

Landsat TM, Landsat Enhanced Thematic Mapper+, and the Landsat 8 Operational Land Imager, calibrated at 30 m resolution, and the shuttle radar topographic mission (SRTM) were the primary data sources used in this study. The advantage is that they all have global coverage, are well-calibrated and processed, and are freely available from reliable sources [16]. One hundred percent cloud-free Landsat scenes covering the study area and the SRTM digital elevation model were acquired from Earth Explorer, USGS; the study period spans from 1987 to 2015, with a 5-year interval between the successive images. For effective comparison and analysis, images captured during the dry season (July–early September) were targeted, except for the year 1987, where no cloud-free image could be obtained in this season, thus, prompting the use of an alternative image captured in the short dry season. In general, dry seasons promise greater chances of obtaining less cloud-impeded data. Table 1 shows the IDs, paths, and rows of Landsat images utilized in this study.

2.3. Methodology

2.3.1. Wetland Delineation

To delineate the wetland, a SRTM digital elevation model was processed using the standard pit-filling algorithms to allow unique determination of downslope flow paths [17], and the resultant raster was utilized to derive the flow direction map that was later used to compute the local slope in degrees, using the slope function in ArcGIS 10.2 (provided by ESRI, California, USA) [18]. Different threshold values were tested for the delineation of the wetland and its fringe areas. Given that the area is relatively flat, only slope values equal to 0° were chosen to represent the wetland. Nyandwi et al. [19], in their recent study about climate sensitivity of wetland environments in Rwanda, maintain that, in the eastern region of Rwanda, the wetland occurrence is only and strongly associated with the topographic slope. This approach was also used by Li et al. [20], when they were mapping Canada’s wetlands in 2005. Furthermore, the Tesseled-cap Wetness index (TWI) has been calculated following Kulawardhana et al. [16] in their approach used to map the Limpopo River basin in Southern Africa. TWI = B1 × 0.1509 + B2 × 0.1973 + B3 × 0.3279 + B4 × 0.3406 + B5 × (−0.7112) + B7 × (−0.4572), where B1–B7 are the DN values of the respective bands of Landsat ETM+ data. TWI is dimensionless and ranges from 0 to 100. According to the abovementioned study, wetland areas often have a TWI ranging from 0 to 30. Therefore, in the present study, areas agreeing to both conditions (slope = 0 and TWI < 30) were assumed to represent the wetland.

2.3.2. Landsat Image Pre-Processing

Pre-processing steps involved radiometric normalization to correct for changes in atmospheric conditions, illumination angles, and seasonal variations across the image [21], filling the gaps (de-striping) for Landsat 7 ETM+ SLC off data and Quick Atmospheric Correction. Top of Atmosphere Reflectance values were obtained following Li et al. [22].

2.3.3. Image Processing and Analysis

Both automated and semi-automated techniques were used to map the wetland [12], where Landsat TM bands 3, 4, and 5 were used for image enhancement [8]. Using July 2015 image data, unsupervised image clustering was conducted using the iterative self-organizing data analysis (ISODATA) algorithm [23]; after which, a number of natural clusters were generated following 100 iterations in a self-organizing way [18]. Since the target wetland subset images were used, only 5 clusters were produced. The ISODATA method allows for natural spectral clusters to be identified with a high degree of objectivity. In this case, it has been employed to determine the spectral class composition of the image and to see how well the intended land cover classes can be defined from the image. Based on information from the field, 5 classes were targeted; namely, open waters, swamp forest, Papyrus swamp, Hippo grass, and floodplain. Using the unsupervised classification result raster, representative training samples for each of the 5 classes were selected using “polygon” in ArcGIS 10.2 (996 pixels for waterbodies, 402 pixels for swamp forest, 626 pixels for papyrus, 517 pixels for hippo grass, and 374 pixels for floodplain). Afterward, a standard maximum likelihood supervised classification method was applied. For accuracy assessment and validation, 50 points for each class were collected in the field by means of global position systems (GPS), except for waterbodies that were easily identifiable on high-resolution Google Earth Pro (Google Inc., Mountain View, CA, USA) images [24]. Fifty of the points collected in the field were used to aid in the training sample selection process. Where applicable, GPS points were accompanied by digital photographs taken by a handheld digital camera to facilitate visual image interpretation. The points were haphazardly spread over the entire study area and the general feature classification method [22,25] was used to map waterbodies, whereby the classified raster was converted to polygons and dissolved before extracting the waterbodies as unique features.

3. Results

3.1. Delineation of the Wetland

Following the topographic slope gradient and the wetness index, it has been found that the wetland complex narrowly extends along the border from north to south following the course of the Akagera River. The total area of the wetland can be estimated at 100,229.76 ha. Figure 2 highlights the extent of the Akagera wetland and the distribution of several lakes that lie in it.

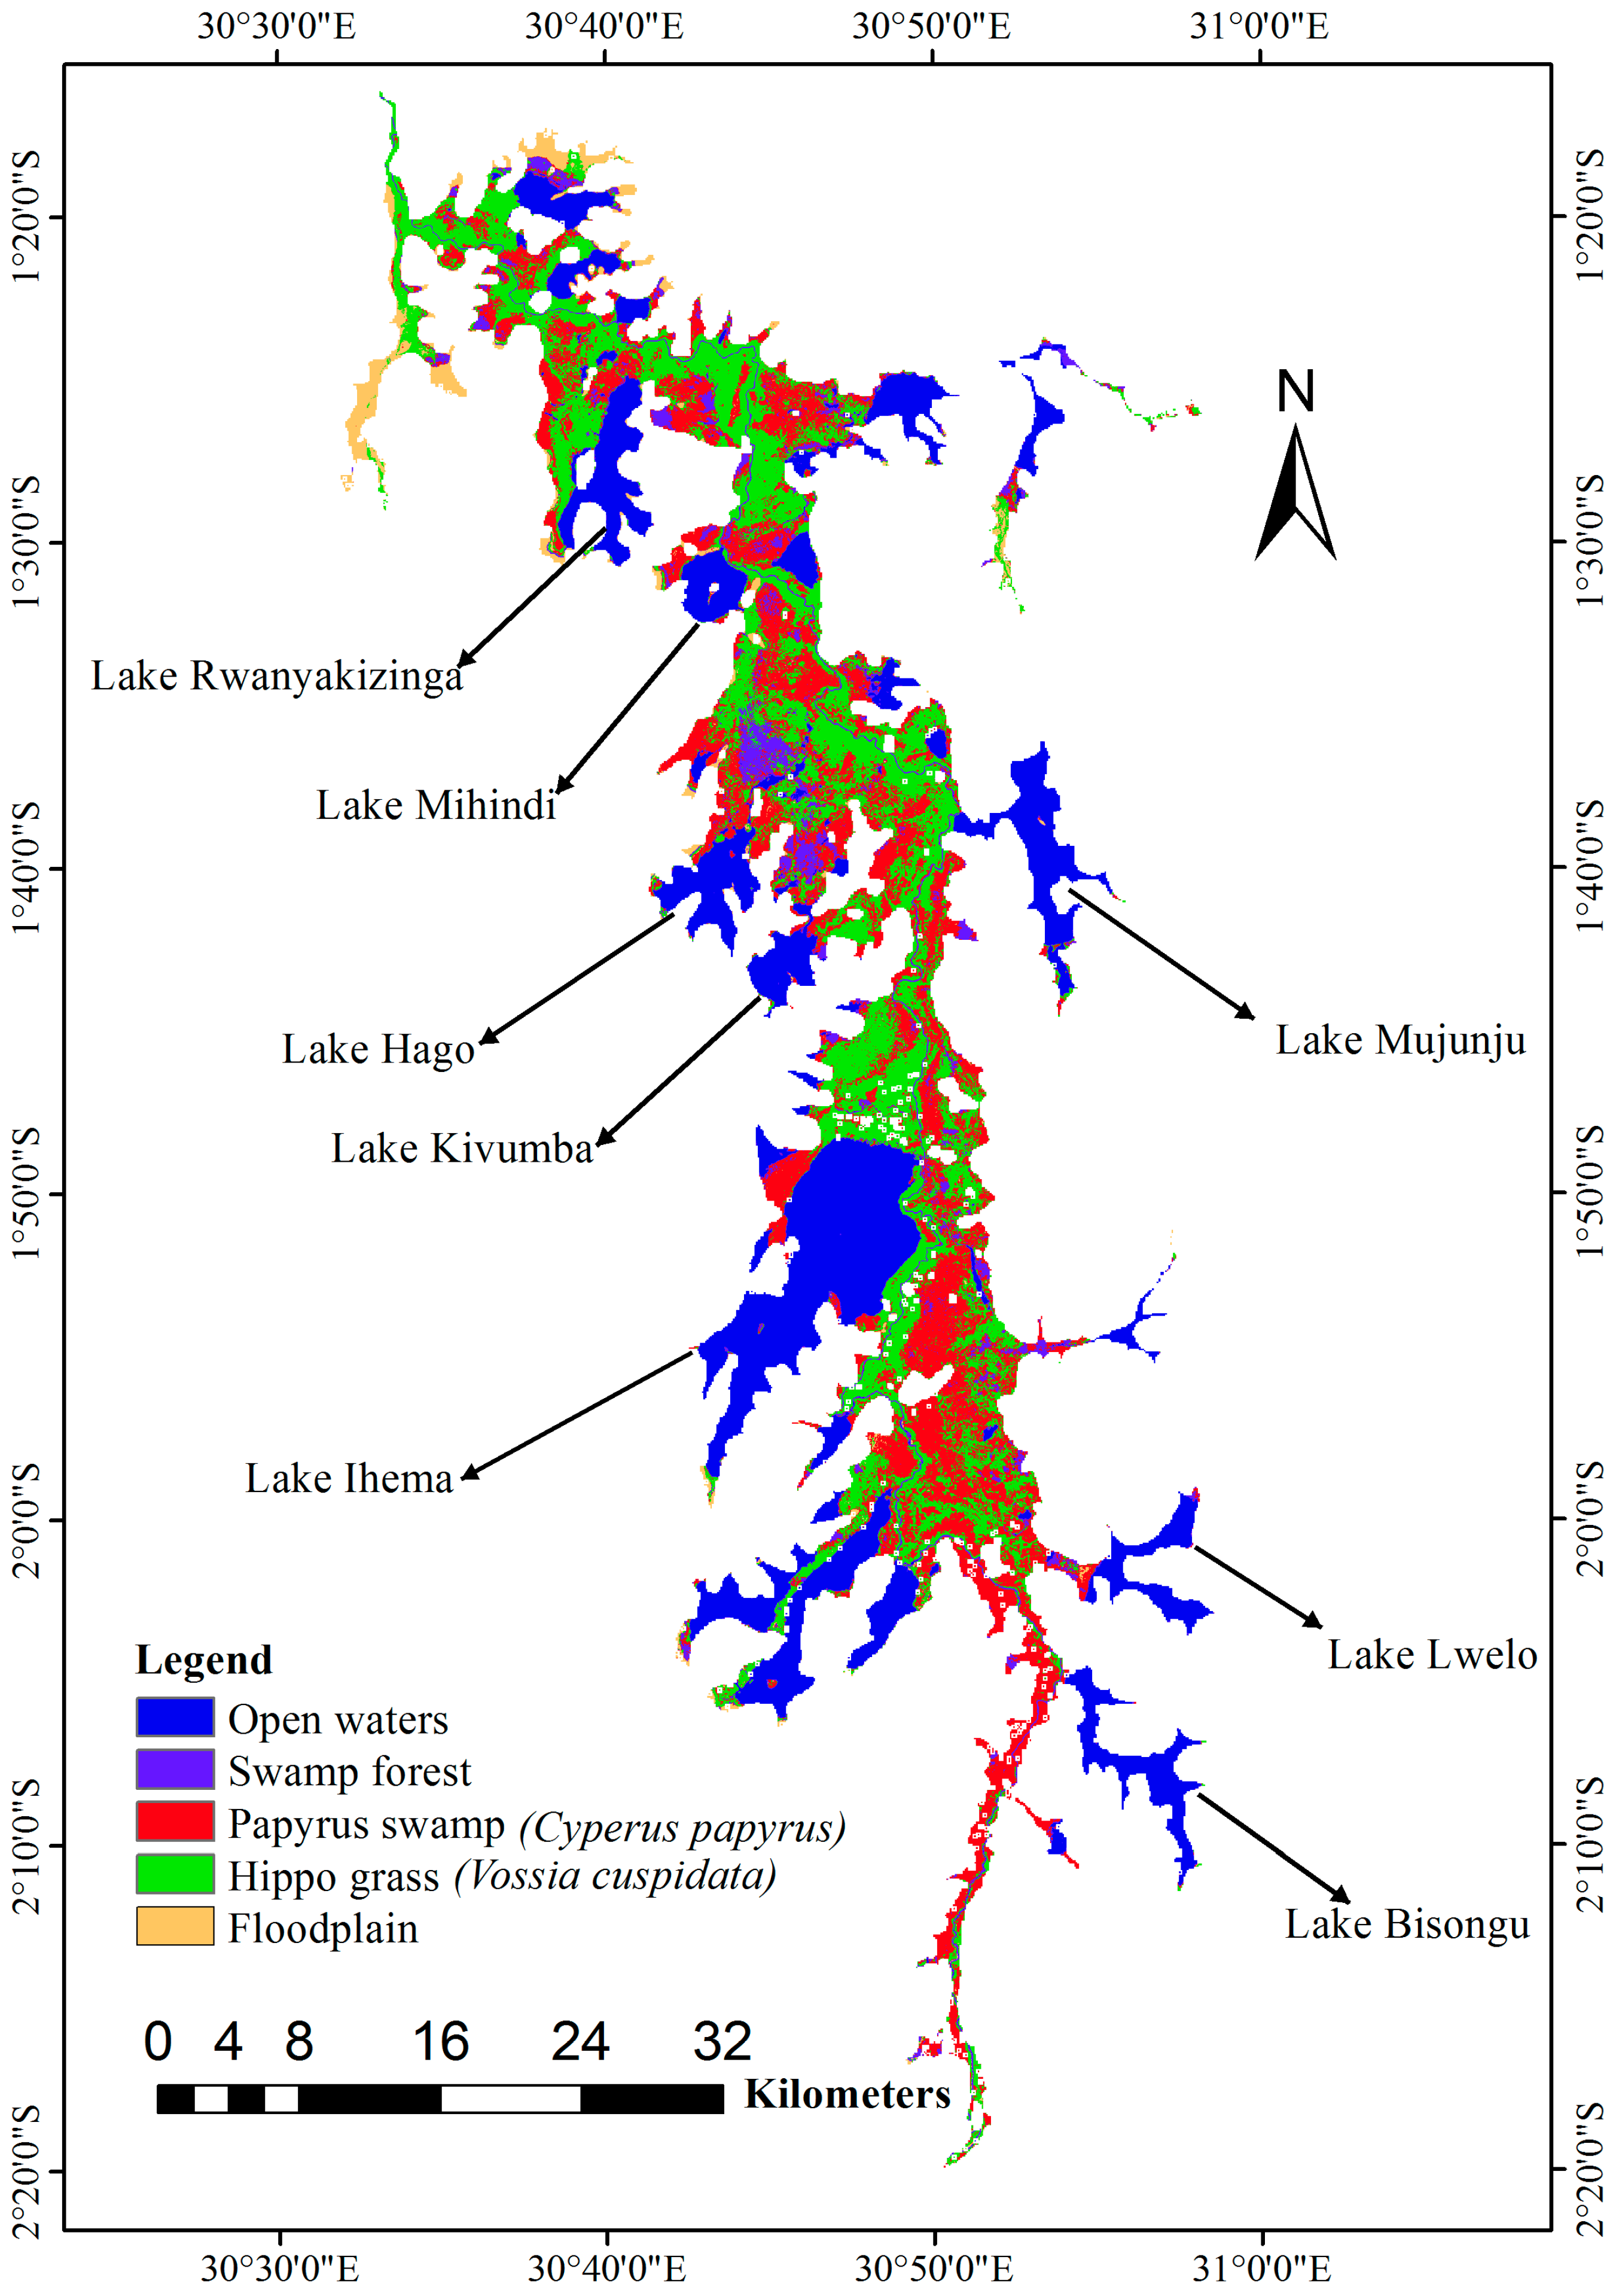
3.2. Wetland Classification

The supervised classification results consisted of 5 classes that, according to on-ground information, stand for open water, Cyperus papyrus swamps, swamp forest, hippo grass (Vossia cuspidata), and floodplains. Figure 3 highlights the distribution and extent of the wetland constituents.
Statistically, it is obvious that water occupies a preponderant place within the wetland and represents more than 30% of the wetland’s area, followed by hippo grass and Cyperus papyrus, occupying 29.8% and 29%, respectively. The swamp forest and floodplains occupy 6.8% and 3%, respectively. Cyperus papyrus and hippo grass are largely distributed throughout the wetland, although hippo grass tends to be mainly distributed along the shores of lakes. Floodplains are mainly located in the northern portions of the wetland. In the middle parts, within the environs of Lakes Mihindi, Rwanyakizinga, Hago, and Kivumba, are found the concentrated patches of swamp forest.
To test for accuracy, classified raster values were extracted to points and the subsequent frequency table was utilized to generate an error matrix table, producing an overall accuracy of approximately 81.9%. Waterbodies were most accurately predicted with a 100% level of accuracy, while bushland was the least predicted (with a 63.8% level of user’s accuracy). Papyrus swamp, hippo grass, and the floodplain were accurately predicted (at 81.6%, 80%, and 83.3%, respectively). Table 2 highlights user and producer’s accuracy results for each class of the 2015 image supervised classification.

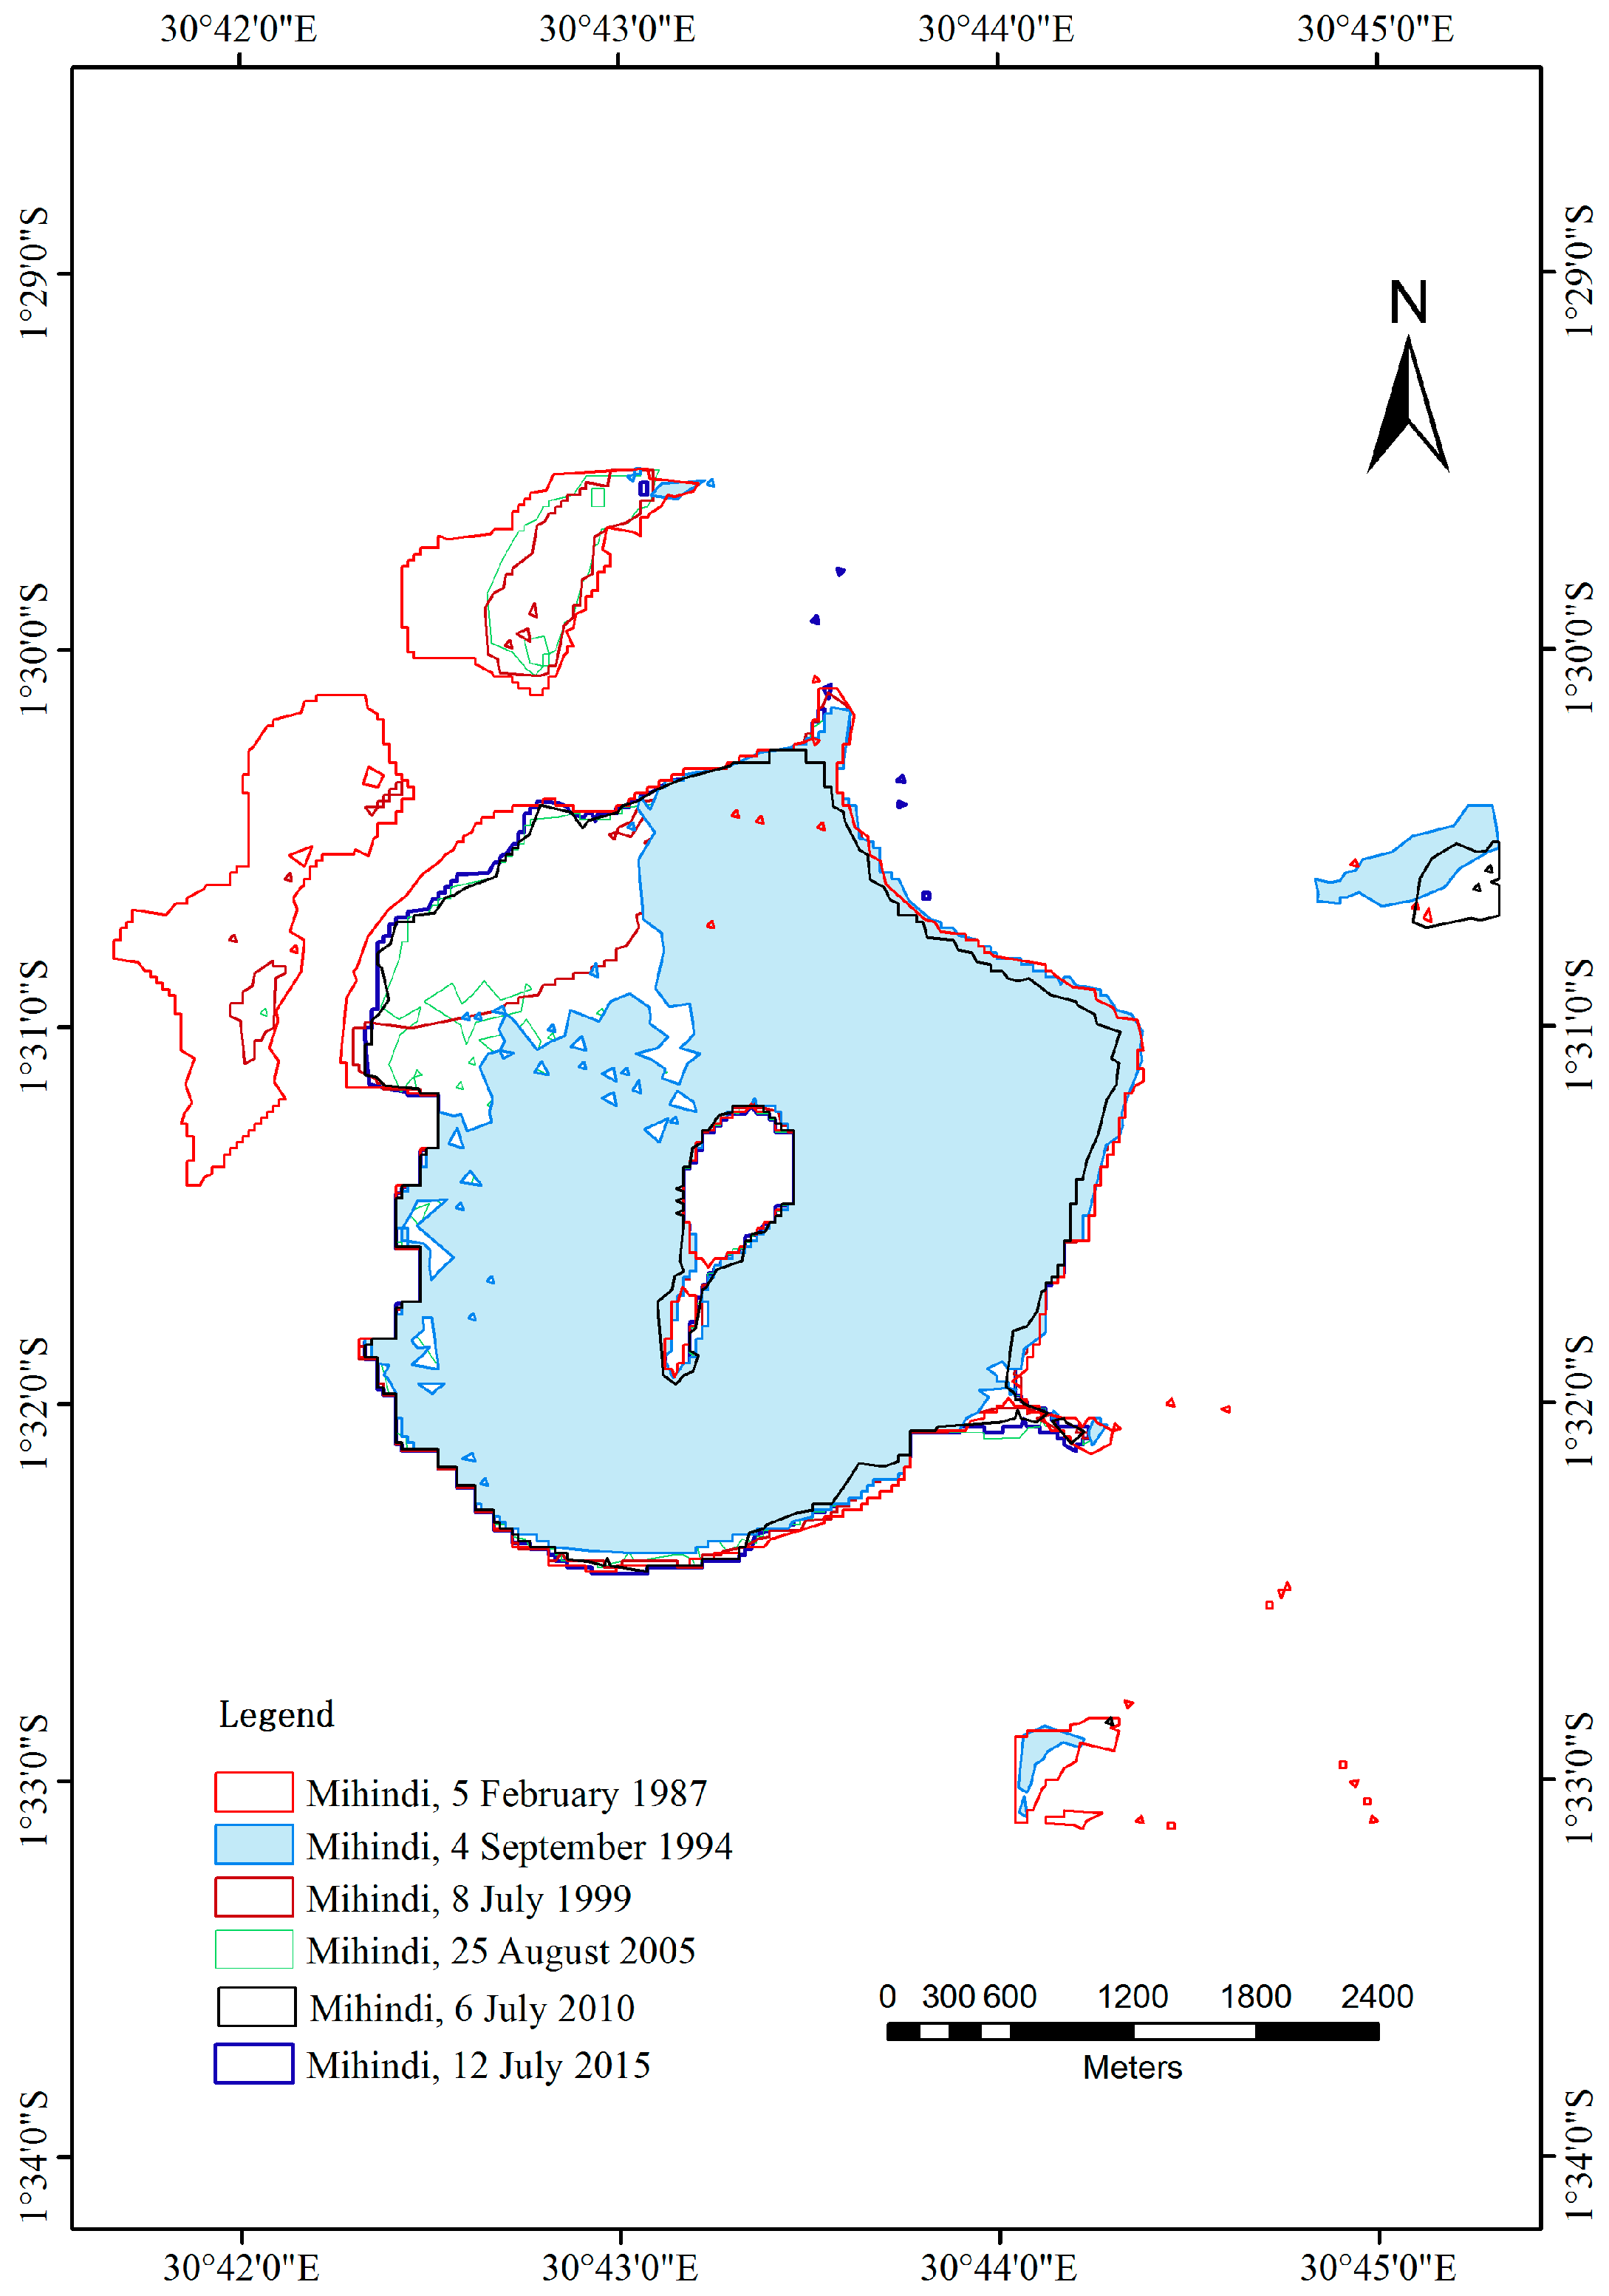
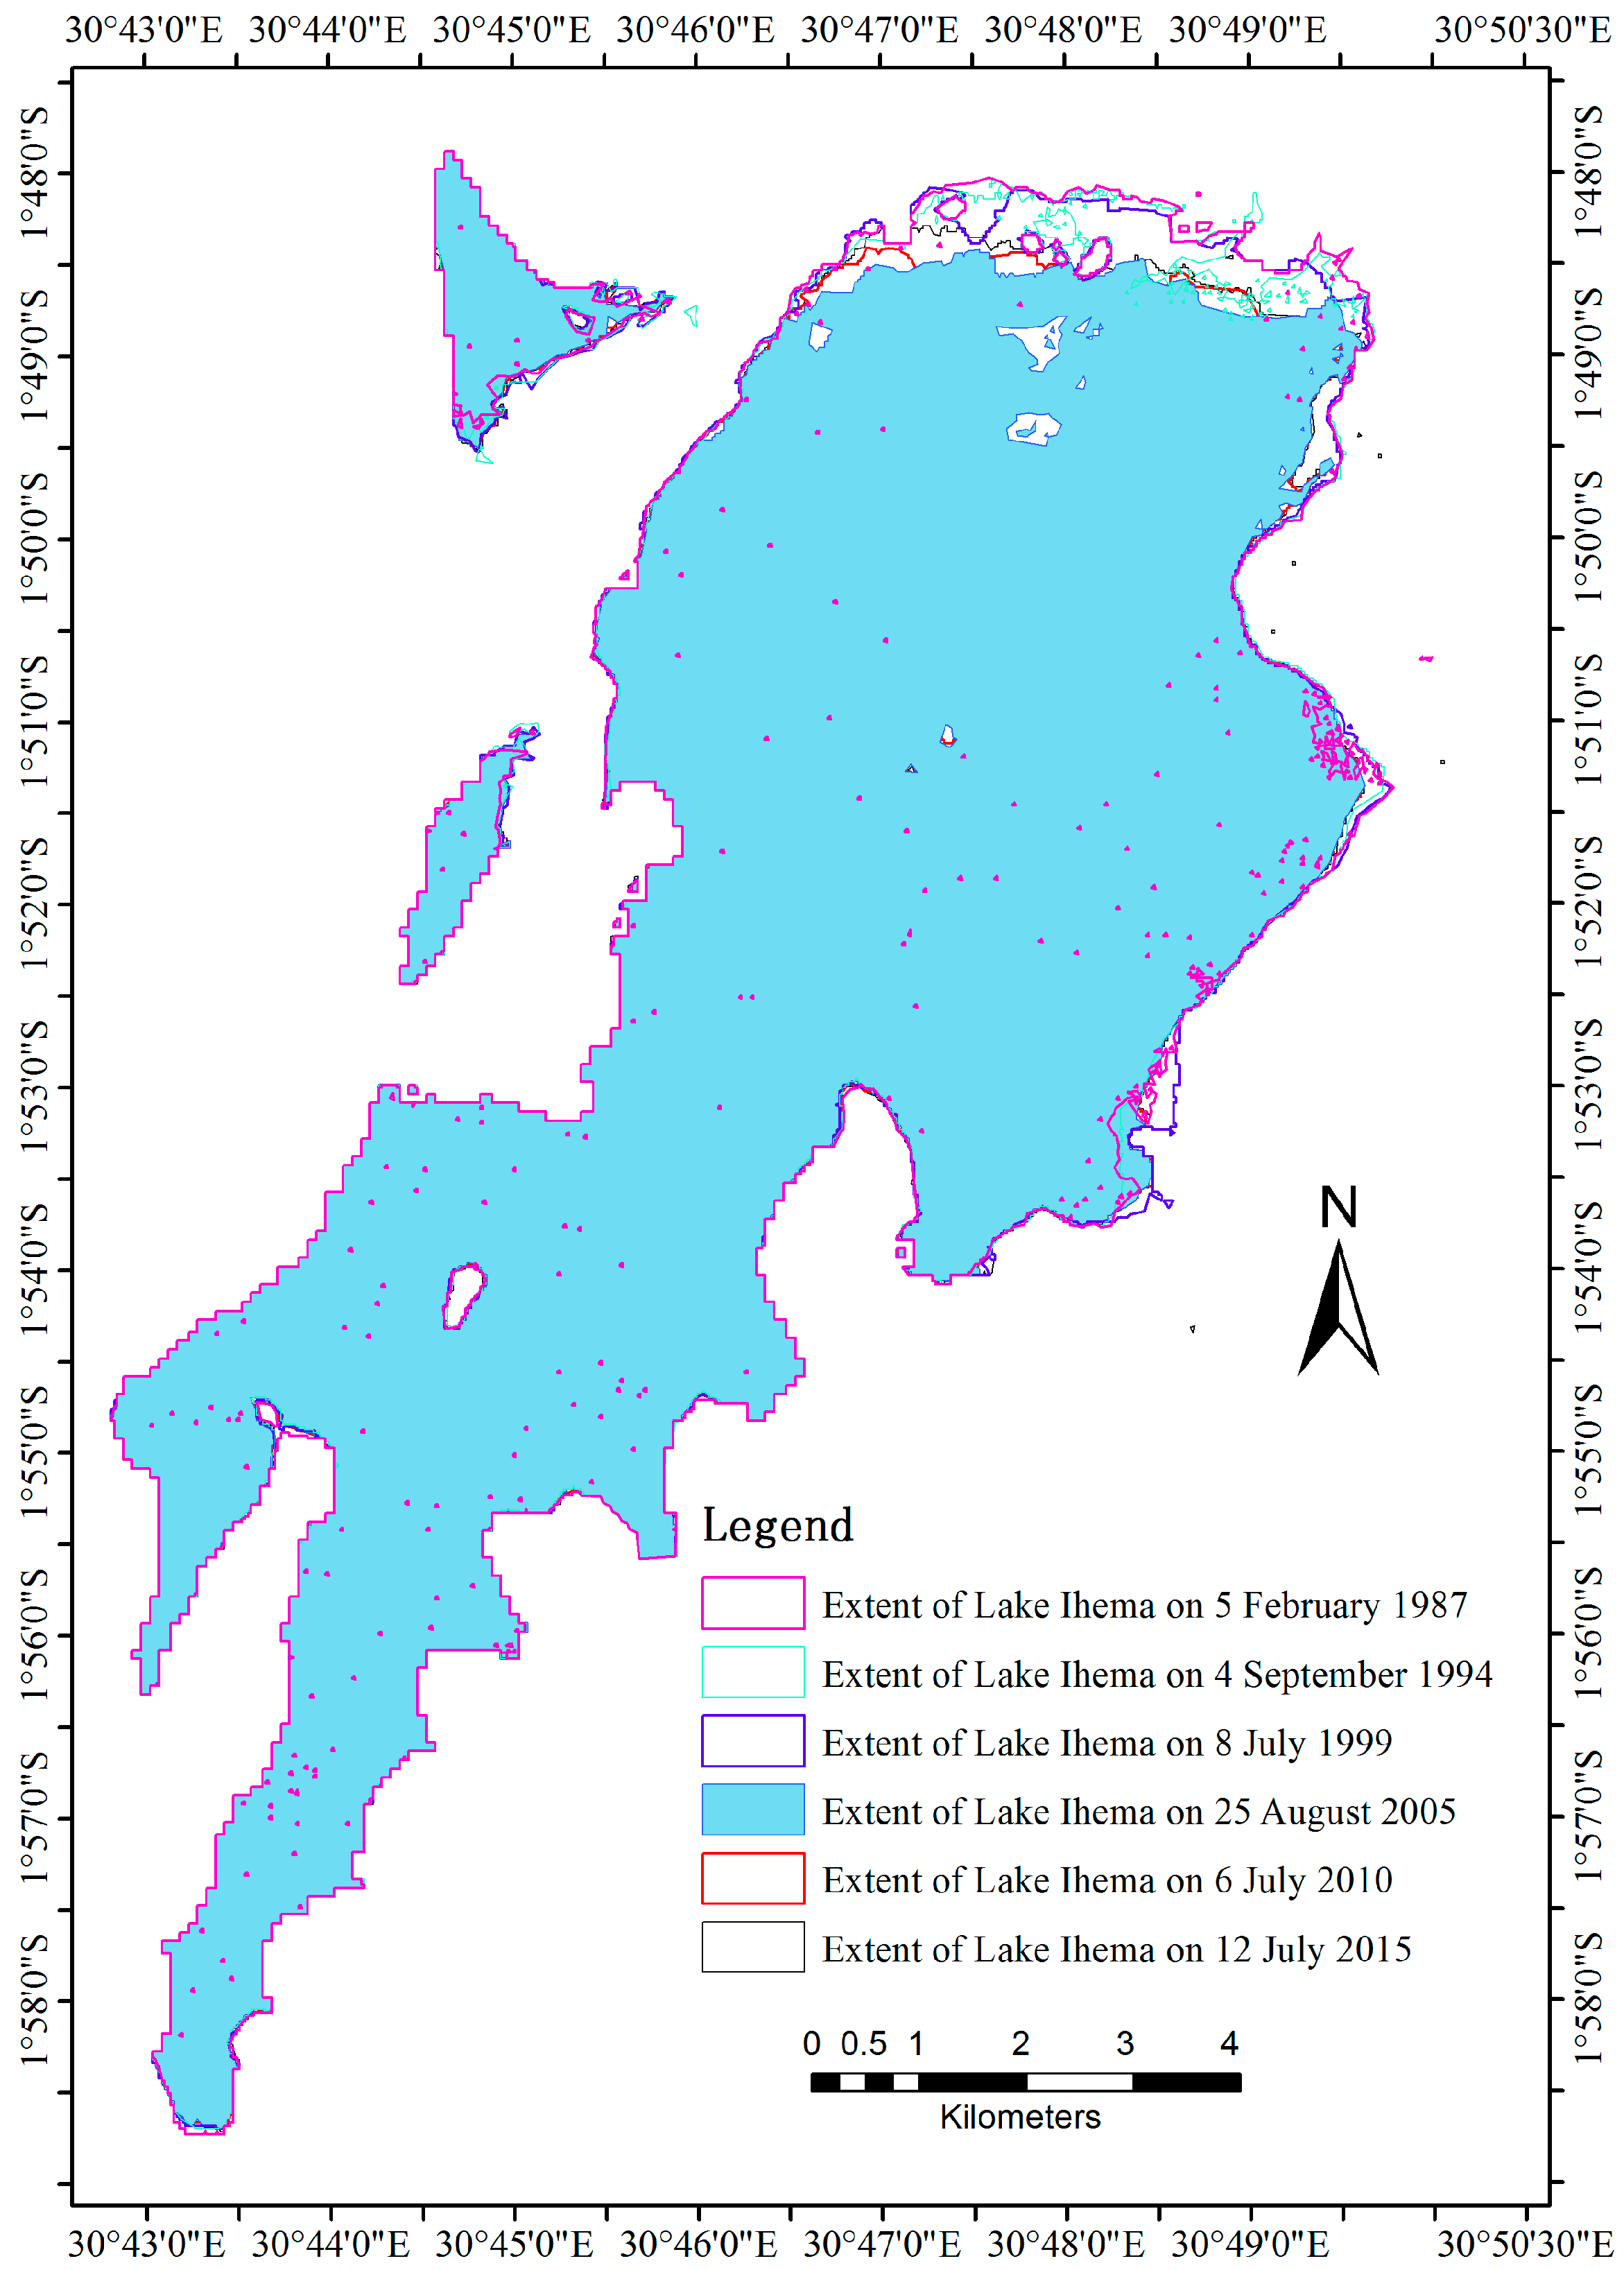
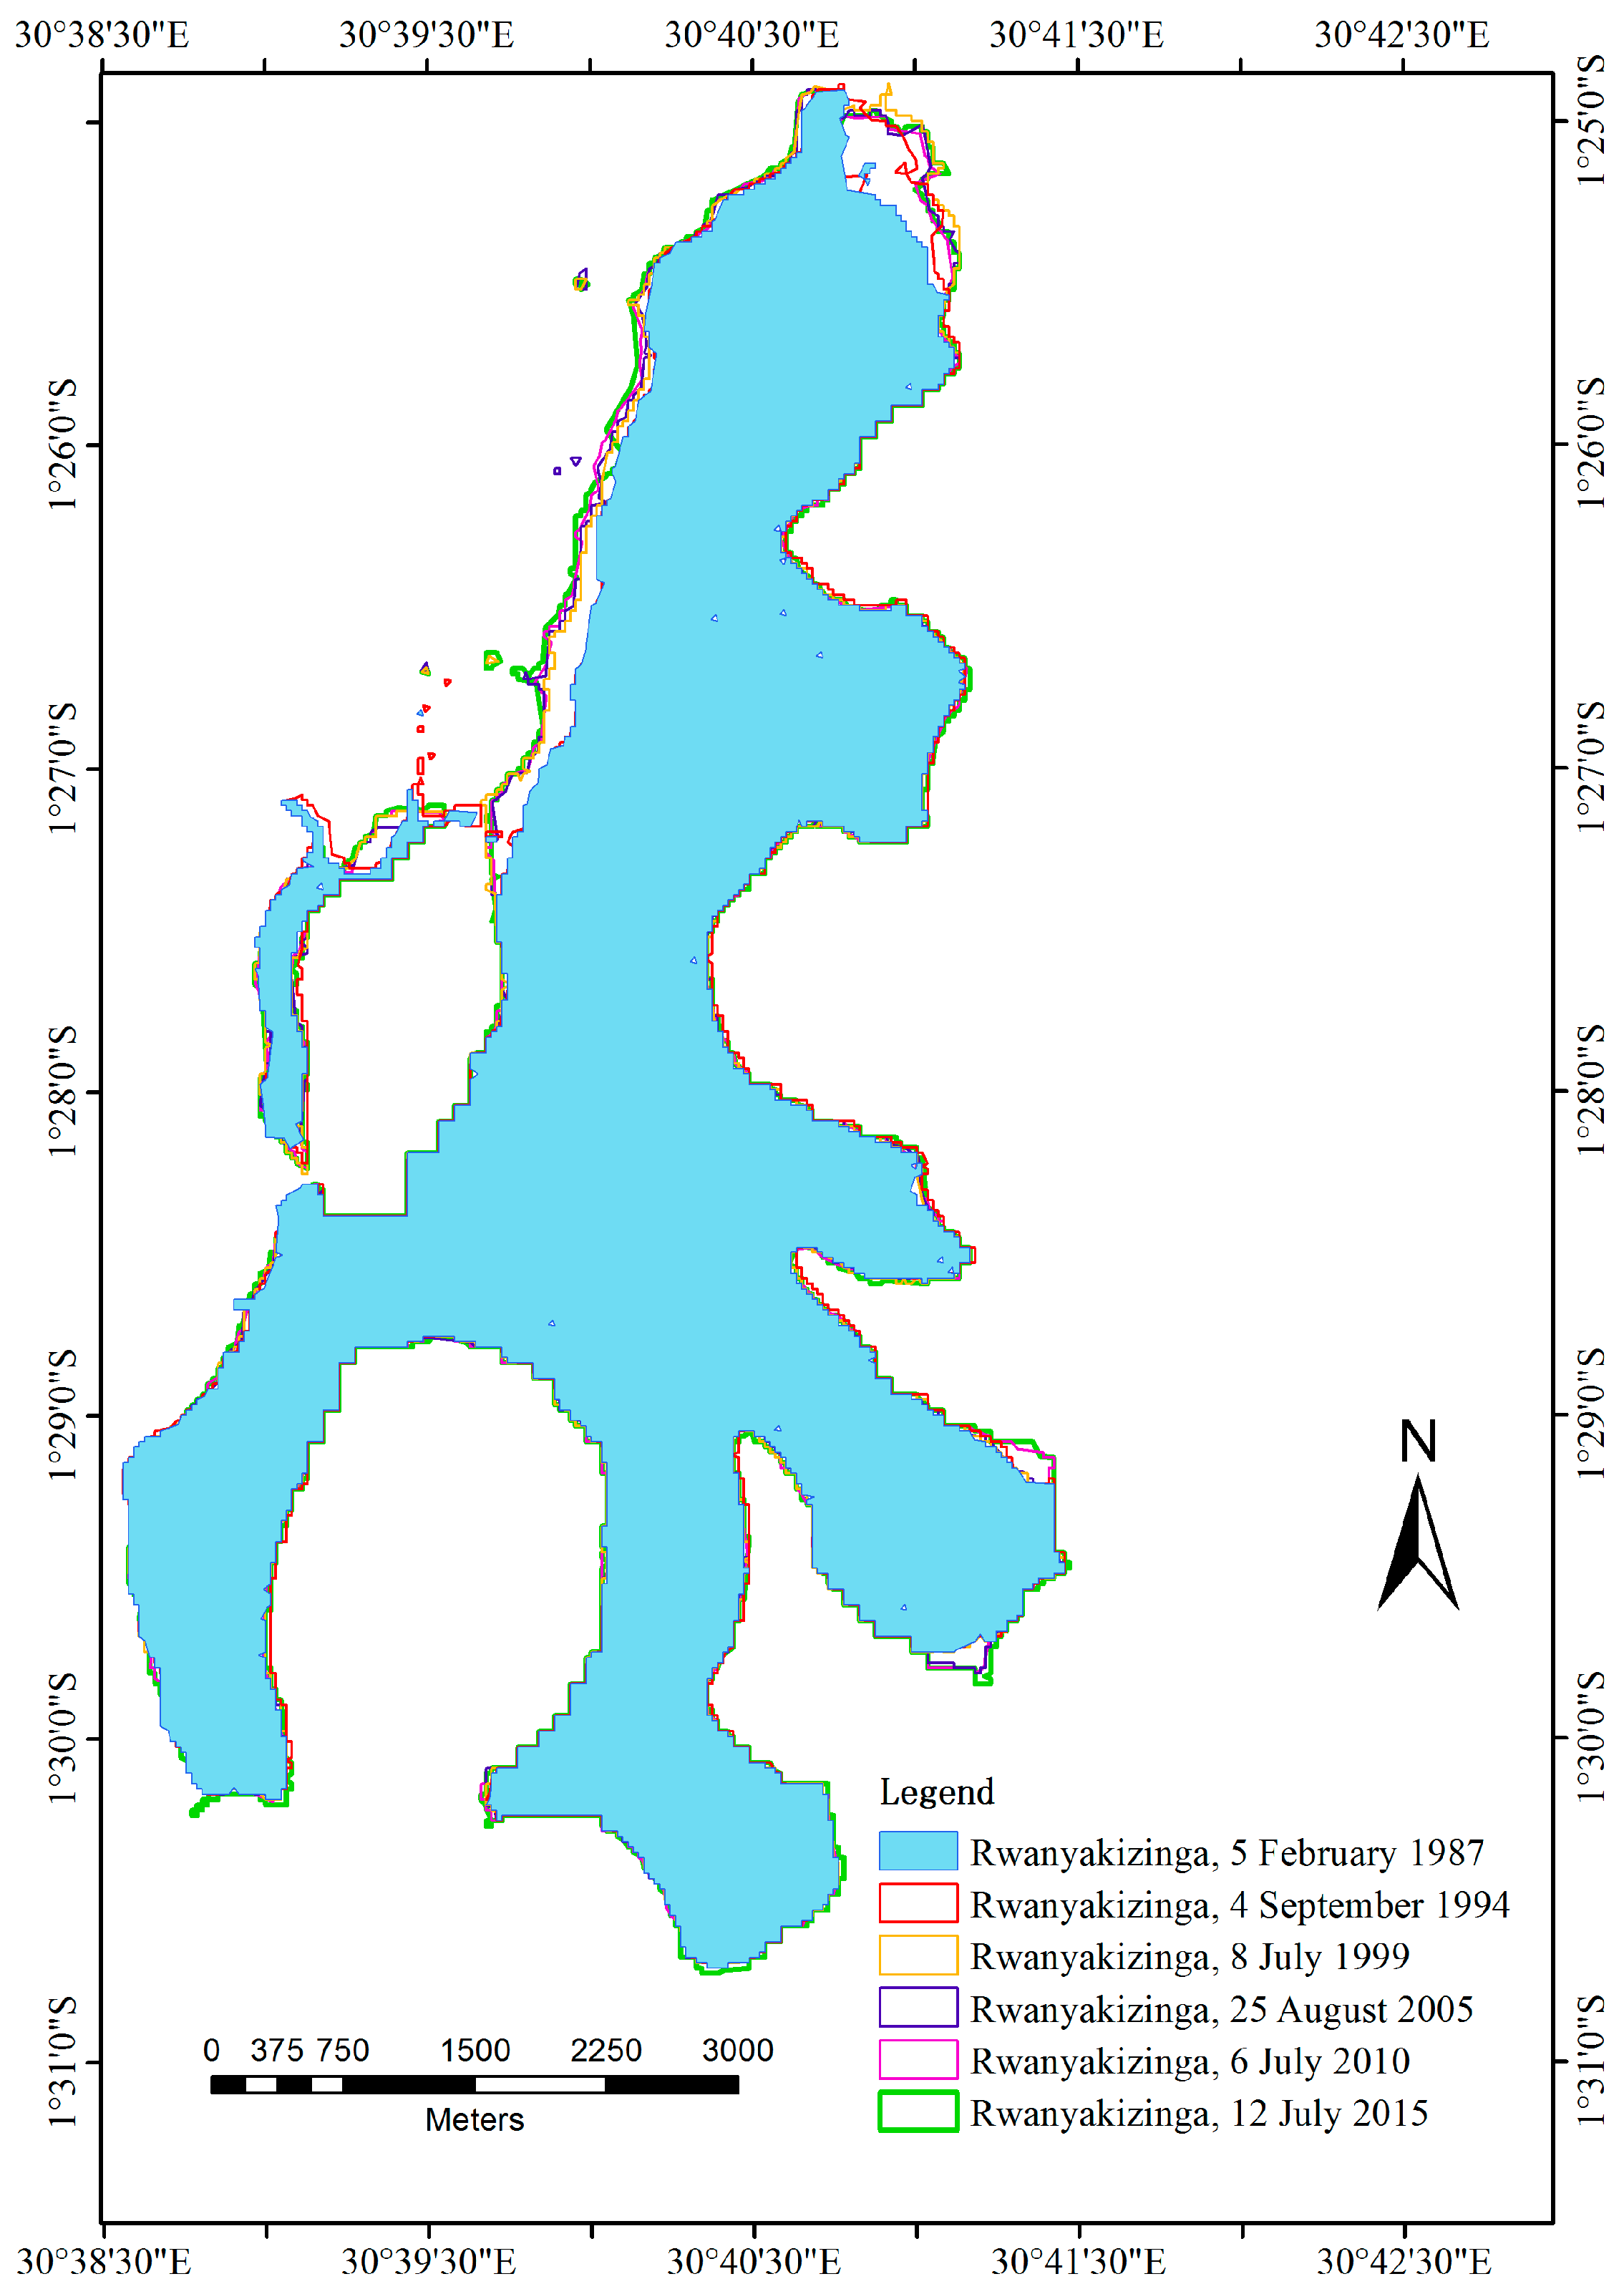
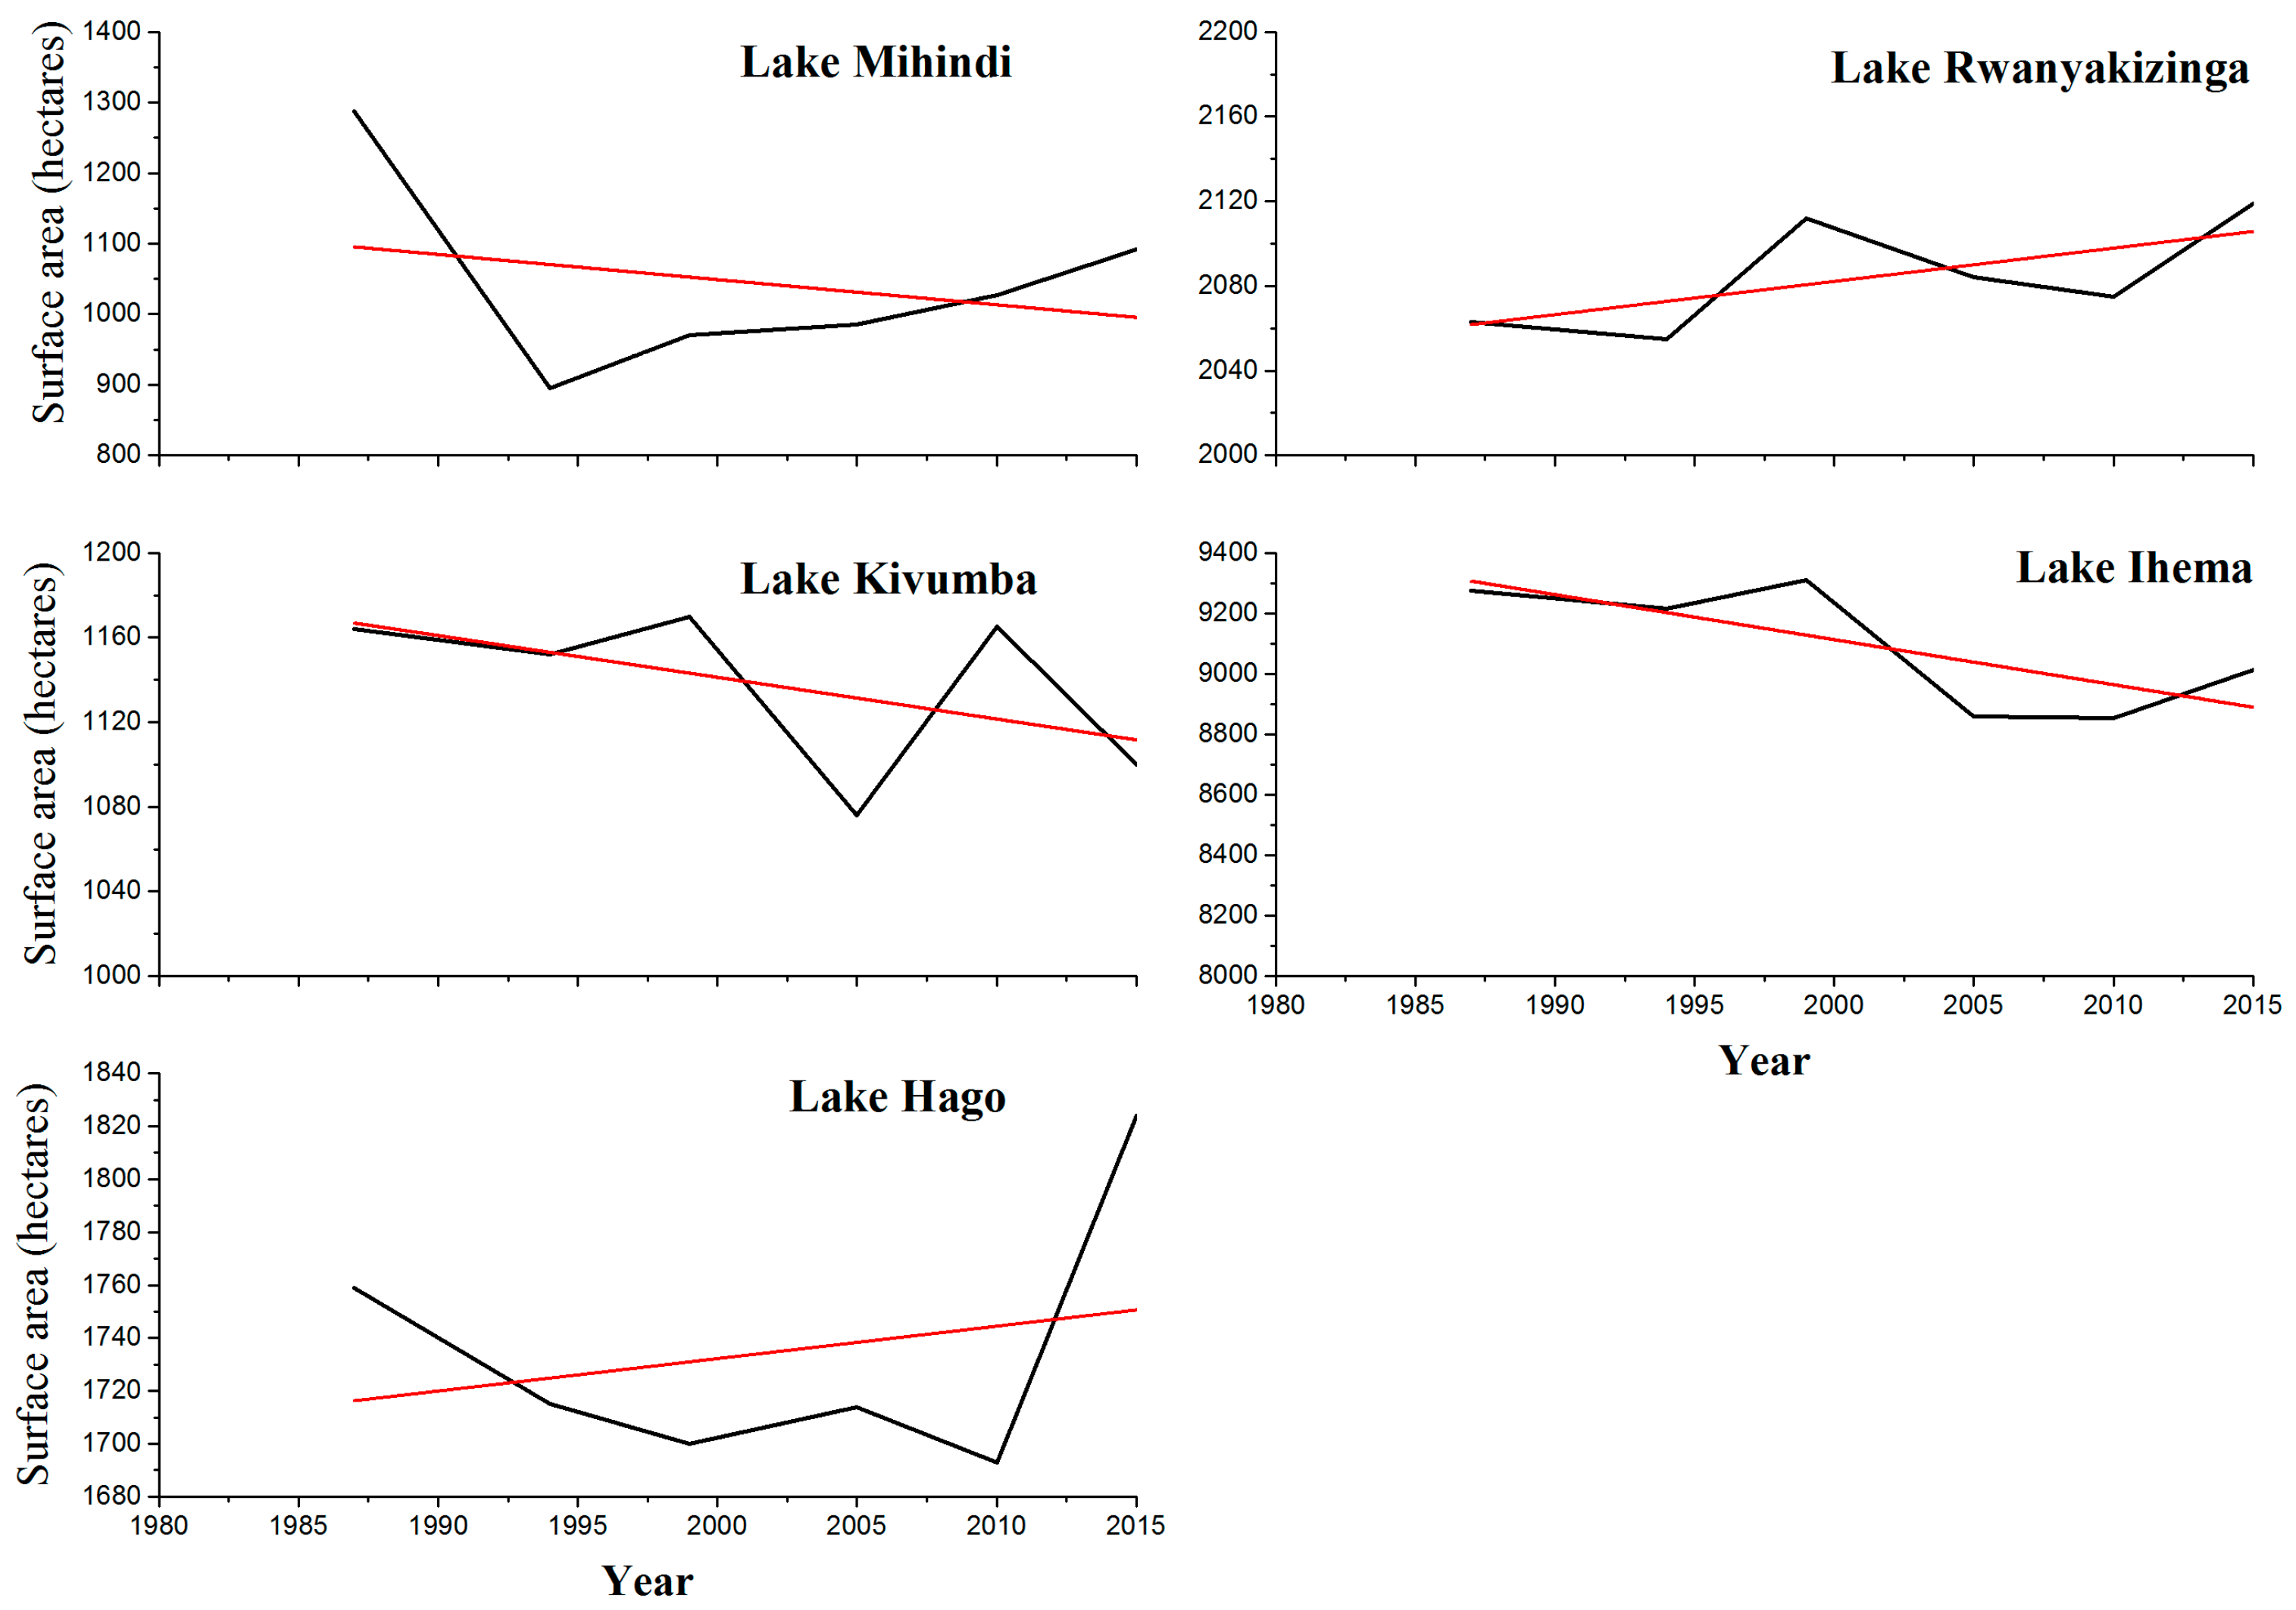
3.3. Selected Lakes’ Surface Water Extent Dynamics

Water resources are one of the irreplaceable strategic resources for human survival [22]. Land surface water mapping, using remote sensing techniques plays an important role in wetland monitoring, flood monitoring, flood disaster assessment, surface water area estimation [26], and water resources management [27]. In Figure 4, Figure 5 and Figure 6 different surface water levels of the 3 main lakes are selected on the Rwandan side of the wetland. The selection has been based on the magnitude of observed changes.
From Figure 4, it can be observed that Lake Mihindi has incurred severe changes since 1987, the year marking the commencement of the study period, until 2015. The most notable changes started appearing in the early 1990s. This coincides with the invasion of Eichhornia crassipes, as reported by numerous studies on the infestation of water hyacinth in the region [7,28]. Water hyacinth is an aquatic plant native to the Amazon basin, which has become highly problematic and a critical challenge to freshwater resource preservation in the East African region in general [7]. The statistical analysis of the magnitude of changes has been presented in Figure 7.
Similar to Lake Mihindi, Lake Ihema has suffered from invasions of water hyacinth, resulting in the shrinking of the lake, especially in the northern portions close to the Akagera River. This is congruent with the findings of Albright et al. [7], who reiterated that severe water hyacinth infestation was observed in regions lying in the closest vicinity of the river and that the farther the lake was from the river, the greater was its immunity against intrusions. From Figure 5, it can be observed that the lake’s open water extent shrinks from the head, with the northeastern portions retreating over time. The statistical comparison of changes over time has been established in Figure 7.
Contrary to observations made on the two previously reported lakes, Lake Rwanyakizinga’s surface water extent has remained relatively stable, with a slight tendency of increase from 1999 to 2015. As discussed earlier, this lake is more distant from the Akagera River. This geographical position may have contributed to its immunity against external intrusions. It has been reported that, in the case of exotic invasions, the river’s contaminating power diminishes rapidly with distance and that lakes far from the river are relatively resistant, while those tangent to the river are completely controlled by it [7,29].
The analysis of changes in water extent per lake has revealed that lakes in this area have undergone serious instability, as can be interpreted from Figure 7. Lake Ihema’s surface area considerably increased between 1994 and 1999, before shrinking to its lowest level (8855 ha) in 2010. Lake Mihindi dramatically shrank from the 1987 extent to its lowest level in 1994, while Lake Kivumba slightly declined between 1999 and 2005, losing about 100 ha. Table 3 statistically summarizes the estimated changes in the sizes of the selected lakes in the area.
Unlike the other lakes, Lake Rwanyakizinga has rather expanded, with an augmentation of 84 ha during the study period. There were no significant changes in Lake Hago between 1987 and 2010, except for the period of 5 years between 2010 and 2015, when the area of the lake considerably increased by nearly 150 ha.

4. Discussion

4.1. Wetland Demarcation and Classification

Being the first of its kind, an attempt to consistently delineate the Akagera Complex Wetland has brought forth an estimation of the wetland’s total area of about 100,229.76 ha. Despite the fact that the wetland demarcates the boundary between two countries following the course of the Akagera River, it has been found that the larger portions of the wetland lie within the Rwandan territory and benefit from the strict protection mechanisms, as applied to the entire Akagera National Park in general. This estimation is congruent with the previous estimates by Soussa et al. [30], who, while reporting on wetlands in Tanzania, allocated 35,000 ha of Akagera swamps on the Tanzanian side. That being said, approximately 65,229.76 ha of the Akagera Wetland Complex (roughly double) may be situated on the Rwandan territory. Cyperus papyrus and the hippo grass (Vossia cuspidata) are the dominant plant species in the area.

4.2. Lakes’ Surface Water Extent Dynamics

From the findings, the highly volatile nature of water reservoirs in this area can be inferred. Some levels of decline (shrinkage) of lakes, such as Ihema, Mihindi and Kivumba, have been noted, while some levels of increase (expansion) have been reported on Lake Rwanyakizinga. The decline in waterbodies’ extents may be triggered by a number of reasons, including, but not limited to, an increase in sedimentation, as well as retreating water levels due to high evaporation as a result of the increase in temperature, as was the case for Lake Chad, Lake Alemaya in Ethiopia, and Lake Poopó in Bolivia [31,32,33], and invasive species. However, given that previous studies on the evolution of climatic conditions in this area have indicated their benign effect to water reservoirs and that no sedimentation increases have been reported, the former two assumptions may be discarded. Therefore, particular attention may be paid to invasive species that have been widely reported in the upper stream of the Akagera River, especially Eichhornia crassipes, which is commonly known as water hyacinth. Water hyacinth has been described as the world’s worst aquatic weed [7]. It was officially recognized in Rwanda’s Akagera River in 1991, as reported by Tylor [6] in his report on floating weeds of East Africa. In this study, Lake Mihindi has been found to have undergone significant disturbances in the years between 1990 and 2000, corroborating the early findings of Albright et al. [7], stated that Lake Mihindi had had a large amount of water hyacinth associated with it for many years before experiencing the periods of recovery, especially since 1997. Conversely, Lake Rwanyakizinga has rather expanded from its initial level (1987 level) of 2063 ha to the current level of 2147 ha, which is in line with the previous investigations suggesting that no invasions were reported on lakes far from the Akagera River, such as Lake Rwanyakizinga.
Aquatic systems, and their biota, are some of the most threatened ecosystems in the world, since they are affected by changes in climate, exotic invasions, and anthropogenic factors [34]. These factors not only increase direct stress on surface water habitat, but also affect dispersal opportunities for water-dependent organisms as neighboring waterbodies degenerate [34]. Proper monitoring of these water resources is critical, especially due to their important ecological and biodiversity functions. The Akagera wetland, in particular, is home to many vertebrates and amphibians that solely rely on the freshwater of the lakes for their survival, and its abundant water reservoirs are the largest suppliers of drinking water for all of the animals in the park. Continuous assessments and analysis of the status of the waterbodies’ areal changes in the area are highly encouraged in order to ensure that appropriate mechanisms and policies are adopted in a timely manner for sustainable aquatic and wildlife conservation.

4.3. Uncertainties, Outlooks, and Prospects

Consistent, thorough, and timely wetland monitoring and assessment programs are critical tools for governments and societies to better manage and protect their wetland resources. These programs allow different stakeholders to establish a baseline in wetlands’ extent, condition, and function as well as detect change, and characterize trends over time [35]. Satellite remote sensing techniques, data management based on GIS and improved international communication systems for data exchange and dissemination continue to make incredible advances [30]. However, the most recent studies still suggest that the complexity of wetlands means that satellite data alone are usually not adequate for detecting changes in wetlands and that extensive ground-truth data or mapping from aerial photography is required [30]. In an attempt to cope with these shortcomings, information derived from satellite imagery has been supplemented by the on-site gathered information during the process of ground reference data collection in order to maximize accuracy. Furthermore, efficient monitoring and comprehensive assessments in tropical regions by means of optical remote sensing are severely hampered by predominant clouds that limit the use of imagery. In this study, given the volatile nature of wetland ecosystems and their extreme sensitivity to climate and weather patterns, the aim was to evaluate inter-annual and seasonal variations of the wetland, but the paucity of quality imagery has neutralized the effort. These challenges could be overcome by developing better cloud screening techniques and/or mounting instruments capable of higher cloud penetration. In the meantime, despite their exorbitant costs, aerial photographs and/or unmanned imaging systems, such as drones, would be a better alternative in these regions to ensure proper annual monitoring of wetland ecosystems for early warning and interventions as far as preventing wetland resource degradation is concerned.

5. Conclusions

Knowledge of the location, distribution, and character of wetlands, their values and uses, and the threats to them, are the essential bases for developing and implementing management for their wise use [36]. In this study, remote sensing data have been used to map and monitor the Akagera Complex Wetland, straddling Rwanda and Tanzania in East Africa. Landsat images from 1987 to 2015 have been acquired in conjunction with a digital elevation model in order to delineate the wetland and assess its dynamics over time. While the extent of the wetland has apparently remained stable, the extent of inhabiting waterbodies has been subject to considerable fluctuations over the years. Hence, the findings single out the great necessity of frequent and improved monitoring initiatives to provide timely information and enhance protection mechanisms’ efficiencies. Additionally, in a region where similar studies have been relatively scarce, future studies extending from seasonal to annual and inter-annual scales are paramount in order to facilitate the decision-making process. Finally, it could be of great interest for future researchers to leverage on available remote sensing technologies to investigate the water hyacinths in the region and report on their trends and current status in order to inform the public and local managers.

Acknowledgments

The authors would like to thank Steven Burora for his willingness to assist in the field data collection. Our gratitude also goes to the 3 anonymous reviewers and editors whose comments and suggestions greatly improved the manuscript. We are equally grateful to Cathy Reynolds and Mary Thornbush for their support in proofreading the manuscript for language editing. This research has been supported by the China–Africa Joint Research Centre Project of the Chinese Academy of Sciences (SAJC201610). The authors would also like to acknowledge the support from the International Cooperation Ministry of Science within the framework of the China–Arab League Desertification Control Technology Cooperation (2010DFB34020).

Author Contributions

Anming Bao designed the research, Hao Guo and Felix Ndayisaba processed the data, analyzed the results, and wrote the manuscript; Alphonse Kayiranga, Lamek Nahayo, Enan M. Nyesheja, and Fidele Karamage provided the analysis tools and technical assistance. All authors contributed to the final version of the manuscript equally by proofreading and refining.

Conflicts of Interest

The authors declare no conflict of interest.

References

  1. Amler, E.; Schmidt, M.; Menz, G. Definitions and mapping of east African wetlands: A review. Remote Sens. 2015, 7, 5256–5282. [Google Scholar] [CrossRef]
  2. Odada, E.O.; Olago, D.O.; Kulindwa, K.; Ntiba, M.; Wandiga, S. Mitigation of environmental problems in Lake Victoria, east Africa: Causal chain and policy options analyses. Ambio J. Hum. Environ. 2004, 33, 13–23. [Google Scholar] [CrossRef]
  3. Baldassarre, G.A.; Bolen, E.G.; Sayre, T.R. Waterfowl Ecology and Management; Krieger: Malabar, FL, USA, 2006. [Google Scholar]
  4. Gallant, A.L. The challenges of remote monitoring of wetlands. Remote Sens. 2015, 7, 10938–10950. [Google Scholar] [CrossRef]
  5. Akinyemiju, O.A. Invasion of Nigerian waters by water hyacinth. J. Aquat. Plant Manag. 1987, 25, 24–26. [Google Scholar]
  6. Taylor, A.R.D. Floating Water-Weeds in East Africa, in Control of Africa’s Floating Water Weed; Commonwealth Science Council: Harare, Zimbabwe, 1991; pp. 111–124.
  7. Albright, T.P.; Moorhouse, T.G.; Mcnabb, T.J. The rise and fall of water hyacinth in Lake Victoria and the Kagera river basin, 1989–2001. J. Aquat. Plant Manag. 2004, 42, 73–84. [Google Scholar]
  8. Ozesmi, S.L.; Bauer, M.E. Satellite remote sensing of wetlands. Wetl. Ecol. Manag. 2002, 10, 381–402. [Google Scholar] [CrossRef]
  9. Nyandwi, E.; Veldkamp, A.; Amer, S. Delineating Rwandan wetlands using topographic and climatic parameters. In Proceedings of the International Conference on Geospatial Technologies for Sustainable Urban and Rural Development (GeoTechRwanda 2015), Kigali, Rwanda, 18–20 November 2015.
  10. Dahl, T.E. Remote sensing as a tool for monitoring wetland habitat change. In Proceedings of the Monitoring Science and Technology Symposium: Unifying Knowledge for Sustainability in the Western Hemisphere, Denver, CO, USA, 20–24 September 2006.
  11. Davidson, N.C.; Finlayson, C.M. Earth observation for wetland inventory, assessment and monitoring. Aquat. Conserv. Mar. Freshw. Ecosyst. 2007, 17, 219–228. [Google Scholar] [CrossRef]
  12. Mwita, E.; Menz, G.; Misana, S.; Nienkemper, P. Detection of small wetlands with multi sensor data in east Africa. Adv. Remote Sens. 2012, 1, 26107. [Google Scholar] [CrossRef]
  13. Fuller, R.; Groom, G.; Mugisha, S.; Ipulet, P.; Pomeroy, D.; Katende, A.; Bailey, R.; Ogutu-Ohwayo, R. The integration of field survey and remote sensing for biodiversity assessment: A case study in the tropical forests and wetlands of Sango bay, Uganda. Biol. Conserv. 1998, 86, 379–391. [Google Scholar] [CrossRef]
  14. Fischer, E.; Dumbo, B. Biodiversity Inventory for Key Wetlands in Rwanda; Rwanda Environment Management Authority: Kigali, Rwanda, 2011.
  15. Ndayisaba, F. Understanding the spatial temporal vegetation dynamics in Rwanda. Remote Sens. 2016, 8, 129. [Google Scholar] [CrossRef]
  16. Kulawardhana, R.; Thenkabail, P.; Vithanage, J.; Biradar, C.; Islam, M.A.; Gunasinghe, S.; Alankara, R. Evaluation of the wetland mapping methods using Landsat ETM+ and SRTM data. J. Spat. Hydrol. 2007, 7, 62–96. [Google Scholar]
  17. Montgomery, D.R. Slope distributions, threshold hillslopes, and steady-state topography. Am. J. Sci. 2001, 301, 432–454. [Google Scholar] [CrossRef]
  18. Mwita, E.; Menz, G.; Misana, S.; Becker, M.; Kisanga, D.; Boehme, B. Mapping small wetlands of Kenya and Tanzania using remote sensing techniques. Int. J. Appl. Earth Obs. Geoinf. 2013, 21, 173–183. [Google Scholar] [CrossRef]
  19. Nyandwi, E.; Veldkamp, T.; Amer, S. Regional climate sensitivity of wetland environments in Rwanda: The need for a location-specific approach. Reg. Environ. Chang. 2016, 16, 1635–1647. [Google Scholar] [CrossRef]
  20. Li, W.C.J. A rule-based method for mapping Canada’s wetlands using optical, radar and DEM data. Int. J. Remote Sens. 2005, 26, 5051–5069. [Google Scholar] [CrossRef]
  21. Song, C.; Woodcock, C.E.; Seto, K.C.; Lenney, M.P.; Macomber, S.A. Classification and change detection using landsat TM data: When and how to correct atmospheric effects. Remote Sens. Environ. 2001, 75, 230–244. [Google Scholar] [CrossRef]
  22. Li, W.; Du, Z.; Ling, F.; Zhou, D.; Wang, H.; Gui, Y.; Sun, B.; Zhang, X. A comparison of land surface water mapping using the Normalized Difference Water Index from TM, ETM+ and ALI. Remote Sens. 2013, 5, 5530–5549. [Google Scholar] [CrossRef]
  23. Houhoull, P.F. Detecting wetland change: A rule-based approach using NWI and SPOT-XS data. Photogramm. Eng. Remote Sens. 2000, 66, 205–211. [Google Scholar]
  24. Kayiranga, A.; Kurban, A.; Ndayisaba, F.; Nahayo, L.; Karamage, F.; Ablekim, A.; Ilniyaz, O. Monitoring forest cover change and fragmentation using remote sensing and landscape metrics in Nyungwe-Kibira park. J. Geosci. Environ. Prot. 2016, 4, 13. [Google Scholar] [CrossRef]
  25. Davranche, A.L.G.; Poulin, B. Wetland monitoring using classification trees and SPOT-5 seasonal time series. Remote Sens. Environ 2010, 114, 552–562. [Google Scholar] [CrossRef] [Green Version]
  26. Du, Z.; Linghu, B.; Ling, F.; Li, W.; Tian, W.; Wang, H.; Gui, Y.; Sun, B.; Zhang, X. Estimating surface water area changes using time-series Landsat data in the Qingjiang river basin, China. J. Appl. Remote Sens. 2012, 6, 063609. [Google Scholar] [CrossRef]
  27. Giardino, C.; Bresciani, M.; Villa, P.; Martinelli, A. Application of remote sensing in water resource management: The case study of Lake Trasimeno, Italy. Water Resour. Manag. 2010, 24, 3885–3899. [Google Scholar] [CrossRef]
  28. Moorhouse, T.M.; Agaba, P.; Mcnabb, T.J. Recent efforts in biological control of water hyacinth in the Kagera river headwaters of Rwanda. In Proceedings of the ACIAR, Nile International Conference, Lae, Papua New Guinea, 26–30 June 2000.
  29. Almendinger, J.E. Ground water control of closed-basin Lake levels under steady-state conditions. J. Hydrol. 1990, 112, 293–318. [Google Scholar] [CrossRef]
  30. Soussa, H.; Azab, A.; Kashaigili, J.J.; Oyo, R. Analyitical Tools for Wetlands Management in the Nile Basin; Nile Basin Capacity Building Network: Cairo, Egypt, 2010. [Google Scholar]
  31. Lemm, B. Ecological changes in two Ethiopian Lakes caused by contrasting human intervention. Limnologica 2003, 33, 44–53. [Google Scholar] [CrossRef]
  32. Arsen, A.; Abarca-del-Rio, R.; Crétaux, J.-F. Remote sensing-derived bathymetry of Lake Poopó. Remote Sens. 2013, 407–420. [Google Scholar] [CrossRef]
  33. Birkett, C.M. Synergistic remote sensing of Lake Chad: Variability of basin inundation. Remote Sens. Environ. 2000, 72, 218–236. [Google Scholar] [CrossRef]
  34. Tulbure, M.G.; Kininmonth, S.; Broich, M. Spatiotemporal dynamics of surface water networks across a global biodiversity hotspot—Implications for conservation. Environ. Res. Lett. 2014, 9, 114012. [Google Scholar] [CrossRef]
  35. United States Environmental Protection Agency (UNEP). Wetlands Monitoring and Assessment. Available online: https://www.epa.gov/wetlands/what-are-wetland-functions (accessed on 8 April 2016).
  36. Spiers, C.F.A. Global Review of Wetland Resources and Priorities for Wetland Inventory; Wetlands International: Canberra, Australia, 1999. [Google Scholar]
Figure 1. Location of the Akagera Complex Wetland in East Africa.
Sustainability 09 00174 g001
Figure 2. Landsat false color composite image of the Akagera wetland as of 12 July 2015 displayed in RGB bands 5, 4, and 3. The transversal line highlights the course of the Akagera River, which is also the physical administrative boundary between Rwanda and Tanzania, while the contour line highlights the extent of the wetland.
Sustainability 09 00174 g002
Figure 3. Classified image of the Akagera Complex Wetland as of 12 July 2015.
Sustainability 09 00174 g003
Figure 4. Surface water dynamics on Lake Mihindi.
Sustainability 09 00174 g004
Figure 5. Surface water variations on Lake Ihema.
Sustainability 09 00174 g005
Figure 6. Surface water dynamics on Lake Rwanyakizinga.
Sustainability 09 00174 g006
Figure 7. Water surface area changes on different lakes of the wetland, 1987–2015.
Sustainability 09 00174 g007
Table 1. Landsat images used in this study.
SensorScene IDPath & RowAcquisition Date
Landsat 5 TMLT51720611987036Path 172, row 615 February 1987
Landsat 5TMLT51720611994247Path 172, row 614 September 1994
Landsat 7 ETM+ SLC onLE71720611999189Path 172, row 618 July 1999
Landsat 7 ETM+ SLC offLE71720612005237Path 172, row 6125 August 2005
Landsat 7 ETM+ SLC offLE71720612010187Path 172, row 616 July 2010
Landsat 8 OLILC81720612015193Path 172, row 6112 July 2015
Table 2. Accuracy results for the 2015 image classification.
Class NameUser’s AccuracyProducer’s AccuracyOverall Accuracy
Water100%96.1%81.9%
Swamp Forest63.8%96.7%
Papyrus Swamp81.6%64.5%
Hippo grass80%75.4%
Floodplain83.3%87.5%
Table 3. Changes in area of the selected lakes (figures in ha).
198719941999200520102015
Hago175917151700171416931824
Ihema927592159310885888559012
Kivumba116411521170107611651100
Mihindi128789597098510271092
Rwanyakizinga206320552112208420752147

