Article

Measuring Crowdedness between Adjacent Stations in an Urban Metro System: a Chinese Case Study

1
School of Economics and Management, Chongqing Jiaotong University, Chongqing 400074, China
2
School of Construction Management and Real Estate, Chongqing University, Chongqing 400044, China
3
Department of Building & Real Estate, The Hong Kong Polytechnic University, Hong Kong 999077, China
4
School of Construction Management and Real Estate, Henan University of Economics and Law, Zhengzhou, 450000, China
*
Author to whom correspondence should be addressed.
Sustainability 2017, 9(12), 2325; https://doi.org/10.3390/su9122325
Submission received: 21 October 2017 / Revised: 6 December 2017 / Accepted: 8 December 2017 / Published: 13 December 2017

Abstract

:
The urban metro system has been widely appreciated as the most important component in urban infrastructures. It plays a critical role in promoting urban social and economic development, and particularly in reducing the urban traffic congestion. However, there are various inherent problems with operating metro systems, which typically involve the crowdedness both at stations and inside vehicles. Both policymakers and academic researchers in China have paid little attention to the crowdedness between metro stations. In order to solve the problem of crowdedness, it is necessary to develop a method to evaluate the level of crowdedness. This work establishes a model to measure the crowdedness between adjacent stations in a metro system based on the load factor principle, passenger standing density, and other factors such as the metro operation schedule and estimations of passenger flows. The Chongqing Metro Line 3 in China is used as a case study to demonstrate the application of the evaluation model. The case study reveals that the model introduced in this study can assist with assessing the crowdedness level between adjacent stations in a metro line. The model is an effective tool for helping the metro management and administration understand the level of crowdedness, apply proper methods to mitigate the crowdedness, and thus improve the quality of the service for those utilizing the metro system.

1. Introduction

The urban metro system has been widely appreciated as the most important component in urban infrastructures [1,2,3,4]. It plays an essential role in promoting economic and social development in urban areas [5,6,7]. Many countries have developed metro systems since the first metro line was built in 1863 in United Kingdom. According to the statistics, 195 cities across the world have developed metro systems between 1863 and 2014 [8]. The number of passengers using the metro systems has been increasing dramatically. For example, the total length of the Beijing metro system reached 604 km by the end of 2014, including 18 lines; and had achieved a daily ridership of 9.53 million [9]. In contrast, there were only two metro lines in Beijing in 2000 with a total length of 54 km, and the daily ridership was about 1.2 million. The metro system in Beijing is one of the busiest metro systems in the world.
As the number of passengers choosing metro systems for daily transportation increases, crowdedness becomes common in many metro lines, which affects the quality of service. Crowdedness happens when the daily ridership exceeds the number of people for which it was designed. There are many cities worldwide with a total metro length greater than 300 km, such as Beijing, Shanghai, London, Moscow, Tokyo, New York, and others. These cities have developed very mature metro systems, but at the same time, they encounter the problem of serious crowdedness in their operating metro systems. In the Chinese cities, reports indicate that ridership per metro line where the metro systems are well developed is higher than those where it is underdeveloped. People often have to wait for the arrival of metro vehicles by joining a long queue, with very crowded passengers both on the platform and inside metro vehicles. This crowdedness situation also becomes more serious during peak hours.
When crowdedness becomes serious, it can lead to many problems, such as those of safety and security, fire accidents, etc. Shen et al. [10] pointed out that “crowdedness” in operating metro systems should be given more attention than utility efficiency when a city is in a more developed stage. Jiang et al. [11] pointed out that the crowded metro system will reduce the comfort of passengers and increase the risks of safety and fire. The study by Tirachini et al. [12] shows that passengers in crowded public transport systems such as metro systems will suffer from travelling. Cox et al. [13] found that crowdedness in a metro system presents a threat both to the development of the rail industry and the health of passengers. Kim et al. [14] suggested that the crowdedness of a metro train is an important measure of passenger satisfaction, which provides a criterion for determining service frequency and the number of cars needed for a metro line. Therefore, it is important to measure the crowdedness of an operating metro system. A proper measurement of a metro system’s crowdedness can help management properly understand problems [15], identify the reasons contributing to crowdedness, and formulate a proper management method to solve the problems.
Other research studies have investigated the crowdedness problem in metro systems [16,17,18]. For example, Kim et al. [17] investigated how the problem of crowdedness affects the passengers’ choice for transportation, and found that the problem reduces the overall satisfaction of metro passengers. Some other researchers focus on the crowdedness problem from the perspective of other forms of public transportation, such as rail systems [19,20,21,22,23]. For example, the research findings by Currie [20] demonstrated that the Australia Rail Company successfully managed to solve the problem of rail crowdedness during peak times through adopting a system of different ticket prices for application during different time periods. Wardman and Whelan [21] suggested using the number of standing passengers per square meter as a measurement of the discomfort of passengers in a rail system.
Previous scholars have introduced other indicators to measure the crowdedness of a whole metro system or other public transportation systems. For example, Wu and Ma [24] proposed four key indicators to quantify the crowdedness of a platform in a metro system, including per capita space, per capita longitudinal distance, boarding coefficient, and evacuation coefficient. Chow appreciated [25] that for public access places such as shopping malls and transport interchanges, the waiting time is observed to be the one important component for evacuation under crowded conditions. Tirachini et al. [26] used four main variables—in-vehicle time, the occupancy level of passengers, the number of passengers sitting, and the number of passengers standing—to assess the crowding discomfort in public transport vehicles. Through a comprehensive literature study, it is found that among the various indicators, two quantitative indicators—namely, load factor and passenger standing density (pass/m2)—have been widely adopted to measure the crowding levels of public transportation [12,21,27,28,29] .
For other aspects, metro stations are the key nodes of the metro network system [30]. Different types of metro stations have different functions, as reflected in their regional characteristics, traffic function, and land use [31]. Zhao et al. [32] also pointed out that the ridership of different metro stations in a metro line is different, and identified five key factors affecting the ridership, including employment, road length, feeder bus lines, bicycle park-and-ride (P&R) spaces, and the transfer dummy variable. Furthermore, the influence of a metro transit network on the urban spatial structure depends primarily on the location of the metro stations [33]. So, whether the distribution of metro stations in a metro line is reasonable or not directly relates to the efficiency and social and economic benefits of metro systems [34]. Therefore, as mentioned above, it is imperative to consider the crowdedness between the stations in a metro system from the perspective of the reasonable distribution of the metro stations.
However, both policymakers and academic researchers in China have paid little attention to the crowdedness between metro stations. This papers attempts to fill this gap. The aim of this paper is twofold. First, based on the load factor principle, passenger standing density, and other factors, such as the metro operation schedule and measurements of passenger flow, we present a model to measure the crowdedness between adjacent stations in a metro system (Section 2). Second, the crowdedness of adjacent metro stations of Chongqing Metro Line 3 in China is examined, and relevant management methods and policies for reducing the crowdedness are also discussed (Section 3).

2. Model Development

The research starts with understanding the existing methods for evaluating the performance of metro systems. A literature review also helps identify the key variables for assessing the level of crowdedness in an operating metro system. Following the literature review, a quantitative measurement model of crowdedness is developed. The development of this model used relevant design and operation standards for metro system as references.

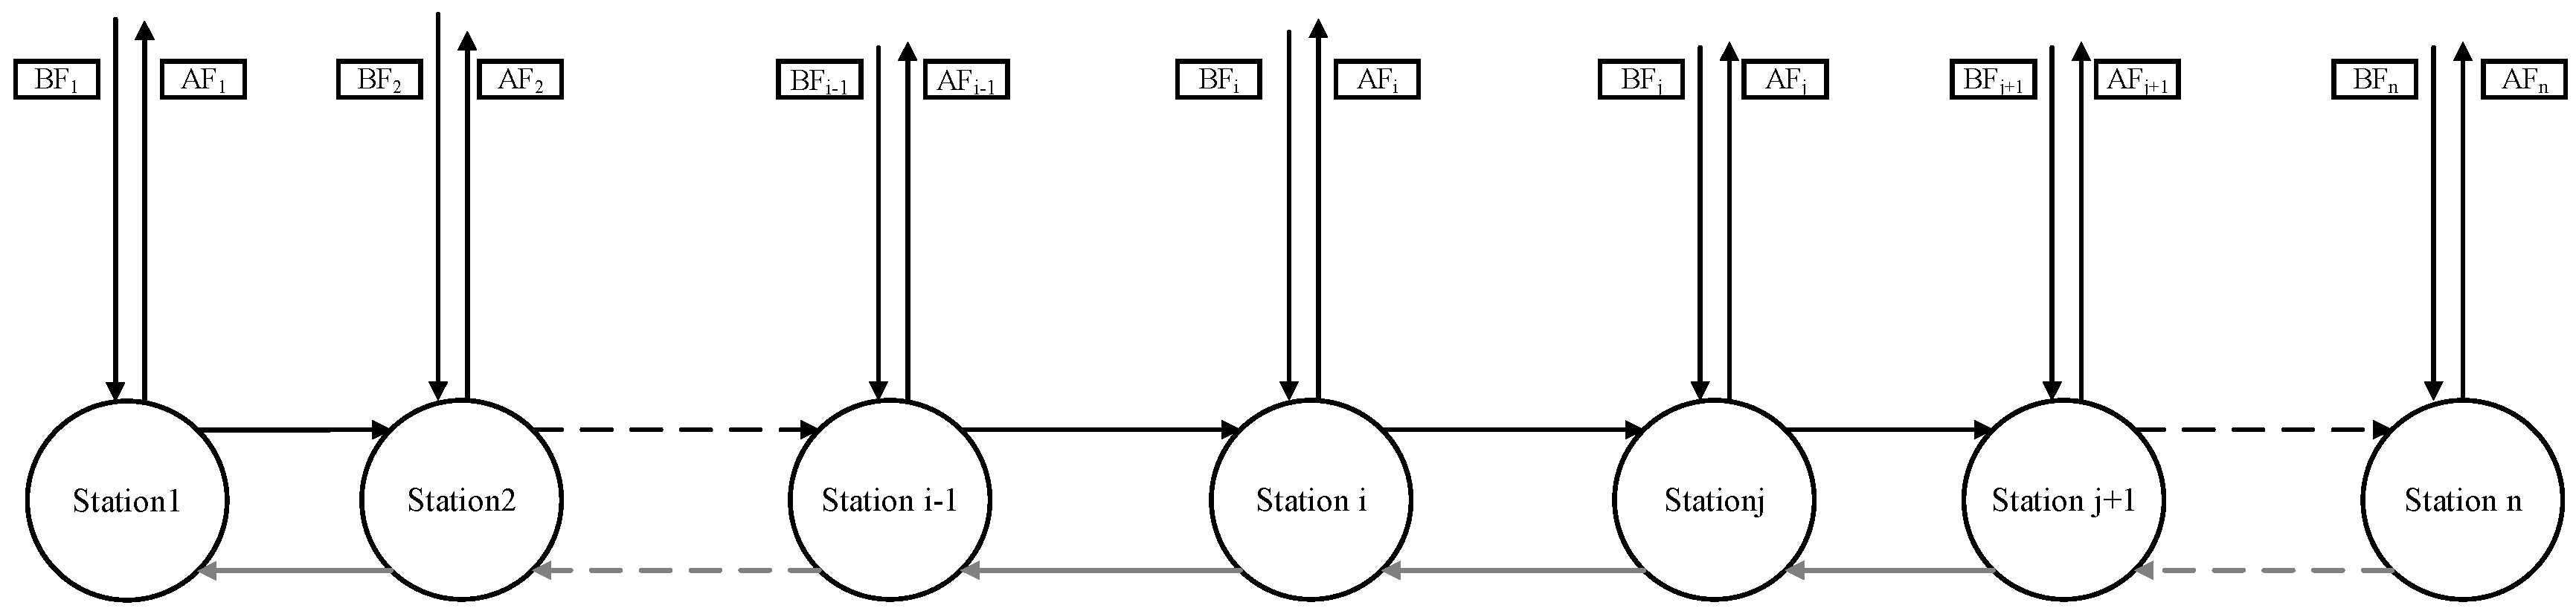
2.1. Development of Measurement Model of Crowdedness

A crowd is commonly defined as a large group of people that are gathered or considered together [35]. Crowd counting is a technique used to count or estimate the number of people in a crowd [36]. The excessive number of passengers using a metro system will generate the crowdedness phenomenon. The study by Jiao et al. [37] suggested measuring the crowdedness of a metro system by considering the difference between the estimated number of daily riders and the actual number, demonstrated as follows:
θ = R p R d
where θ is the level of crowdedness in an operating a metro system; Rd is the designed value of daily ridership per kilometer for the metro system, and Rp is the actual daily ridership per kilometer of the system.
However, the level of crowdedness at different stations in a metro line is different. A metro line consists of a number of stations. One metro station and its nearest station are considered as two adjacent stations. In order to measure the crowdedness between adjacent stations, model (1) is considered the basis in this study.
In fact, the crowdedness between different adjacent stations is different, as passengers’ arrival and departure behavior is different in different stations. Therefore, the measurement model (1) should be modified to measure the level of crowdedness between adjacent stations, which is proposed as follows:
θ s s = R p ( s s ) R d ( s s )
where θ s s denotes the level of crowdedness between adjacent stations in a metro line; Rd(s−s) is the designed value of daily ridership per kilometer per metro line; and Rp(s−s) is the actual daily ridership per kilometer between stations.
The value of Rd(s−s)
In model (2), the value of the parameter Rd(s−s) is determined at the design stage of a metro system. It is appreciated that the value of Rd(s−s) will be different when different design standards are adopted. Rd(s−s) in this study is considered from two main aspects: the designed carrying capacity (or the transportation volume) of the metro vehicle, and the metro operation schedule. According to Li and Hensher [38], many United States (US) transit authorities adopted the load factor (passengers/seat) to evaluate the in-vehicle crowdedness of the rail system. In line with this, this study chooses the load factor to represent the designed carrying capacity of a metro vehicle. Furthermore, the designed carrying capacity includes the designed number of seats and the designed stand numbers for a carriage.
Another issue for considering Rd(s−s) is the metro operation schedule. The level of crowdedness between adjacent stations will be different during the opening hours of the metro system when different schedules of operation are adopted. In this study, the daily metro operation schedule is used for analysis. Accordingly, the parameter Rd(s−s) is defined from the following, model (3):
R d ( s s ) = ( x + y ) z m L ( s s )
where L(s−s) denotes the length between two adjacent stations; x and y stand for the designed seat numbers and the designed stand numbers in a metro carriage, respectively; z is the number of the carriages in a metro line; and m is the number of travels of the metro line according to the daily schedule.
The value of Rp(s−s)
The value of Rp(s−s) is obtained as follows:
R p ( s s ) = r P ( s s ) L ( s s )
where rp(s−s) stands for the total number of passengers flowing between two adjacent stations per day, and L(s−s) denotes the length between the two adjacent stations.
The values of variables L(s−s), x, y, z, and m in model (3) and (4) can be obtained from the relevant design documents. However, the value of the variable rp(s−s) is the actual passenger flows between two adjacent stations. Passengers’ arrival and departure behavior will directly affect the value of rp(s−s). It is considered that the alighting and boarding flow can reflect the passengers’ arrival and departure behavior. Figure 1 presents an analytical framework for the passengers’ flows of alighting and boarding between stations.
In Figure 1, it is assumed that there are n stations in a metro line. Each individual station has two passenger flows: alighting flow (AF) and boarding flow (BF). BFi is the value of boarding flow for Station i, and AFi is the value of alighting flow for Station i.
In referring to Figure 1, the boarding passengers, denoted as BFi, can go to other (n-1) stations in the metro line. Accordingly, (n-1) boarding flows will be generated, including BFi-1, BFi-2, …, BFi-(j-1), BFi-j, BFi-(j+1), …, BFi-n, as shown in Figure 2, where BFi-j is the number of the passengers flowing from Station i to Station j. Similarly, the boarding flow for other stations can be established. As a result, the boarding flows for all of the individual stations can be established, as presented in Figure 2.
As shown in Figure 1, there are two directions for a metro line: one direction starts at station 1 and terminates at station n; and another direction starts at station n and terminates at station 1. For measuring the crowdedness inside the vehicle between adjacent stations, only the flows in one direction need to be examined. Therefore, in referring to Figure 2, the total number of the passenger flows between the two stations i and j, rp(i-j), is composed as:
r p ( i j ) = BF 1 j + BF 1 ( j + 1 ) + + BF i n + BF 2 j + BF 2 ( j + 1 ) + BF 2 n   + BF ( i 1 ) j   + BF ( i 1 ) ( j + 1 ) + + BF ( i 1 ) n + BF i j + BF i ( j + 1 ) + BF i n
By applying models (3), (4), and (5) to model (2), the final measurement, model (2), can be summarized as:
θ i j = R p ( i j ) R d ( i j ) = BF 1 j + BF 1 ( j + 1 ) + + BF i n + BF 2 j + BF 2 ( j + 1 ) + BF 2 n   + BF ( i 1 ) j + BF ( i 1 ) ( j + 1 ) + + BF ( i 1 ) n + BF i j + BF i ( j + 1 ) + BF i n ( x + y ) z m

2.2. Development of the Thresholds of Crowdedness Level

When the data for all of the concerned parameters in model (6) are available, the crowdedness measurement θ s s can be produced. However, when the produced value of θ s s is interpreted to the level of crowdedness, there is a need to establish a threshold of crowdedness level. The study by Li and Hensher [38] provides a typical reference for establishing the thresholds. In their study, six levels of crowdedness for the rail line are identified, as shown in Table 1.
In Table 1, the ratio (or load factor) of passengers to seats is used to establish thresholds of crowdedness. By referring to this, the ratio (or the load factor) of passengers to the total designed number for both stand number and seat number is used to establish the thresholds of crowdedness in this study. Accordingly, four thresholds of θ s s are established as follows:
0   < θ s s     x ( x + y ) .
Under this situation, all of the passengers can have a seat in the metro vehicle, and no passengers need to stand; as a result, all of the passengers can receive a high-quality service from the metro system. In other words, if the value of θ s s belongs to this interval, the two adjacent stations are considered not crowded.
x ( x + y )   <   θ s s     1
Under this circumstance, all of the seats inside vehicle are occupied, and some passengers need to stand up. The crowdedness phenomenon appears. However, the number of passengers in this case does not exceed the designed transport volume (the sum of seat number and stand number). Therefore, the two adjacent stations are considered as having a low level of crowdedness if the value of θ s s belongs to this interval.
1   <   θ s s   x + 1.5 y ( x + y ) .
Under this situation, the number of passengers exceeds the designed transport volume. Disturbance between passengers becomes obvious. This situation is considered as having a medium level of crowdedness.
x + 1.5 y ( x + y )   < θ s s .
In this circumstance, the number of passengers reaches the crush load of the metro vehicle. Disturbance between passengers becomes very serious. This situation refers to a high level of crowdedness between two adjacent stations.

3. Case Study

Chongqing Metro Line 3, which started operation on 29 September 2011, is selected to illustrate the application of the θ s s model. As shown in Figure 3, Line 3 in the Chongqing metro system, in blue, includes 39 stations across two big rivers (Yangtze River and Jialing River) and five districts of Chongqing. The total length of the line is 55.5 km, which makes it the longest in the world, according to Wikipedia [39]. The line is also the busiest metro line in the whole Chongqing metro system [39]. The research team received support and assistance from staff members in the Chongqing Metro Corporation, and thus had the ability to collect relevant data about the operation of this line. As a result, the data are effective and sufficient for supporting analysis.

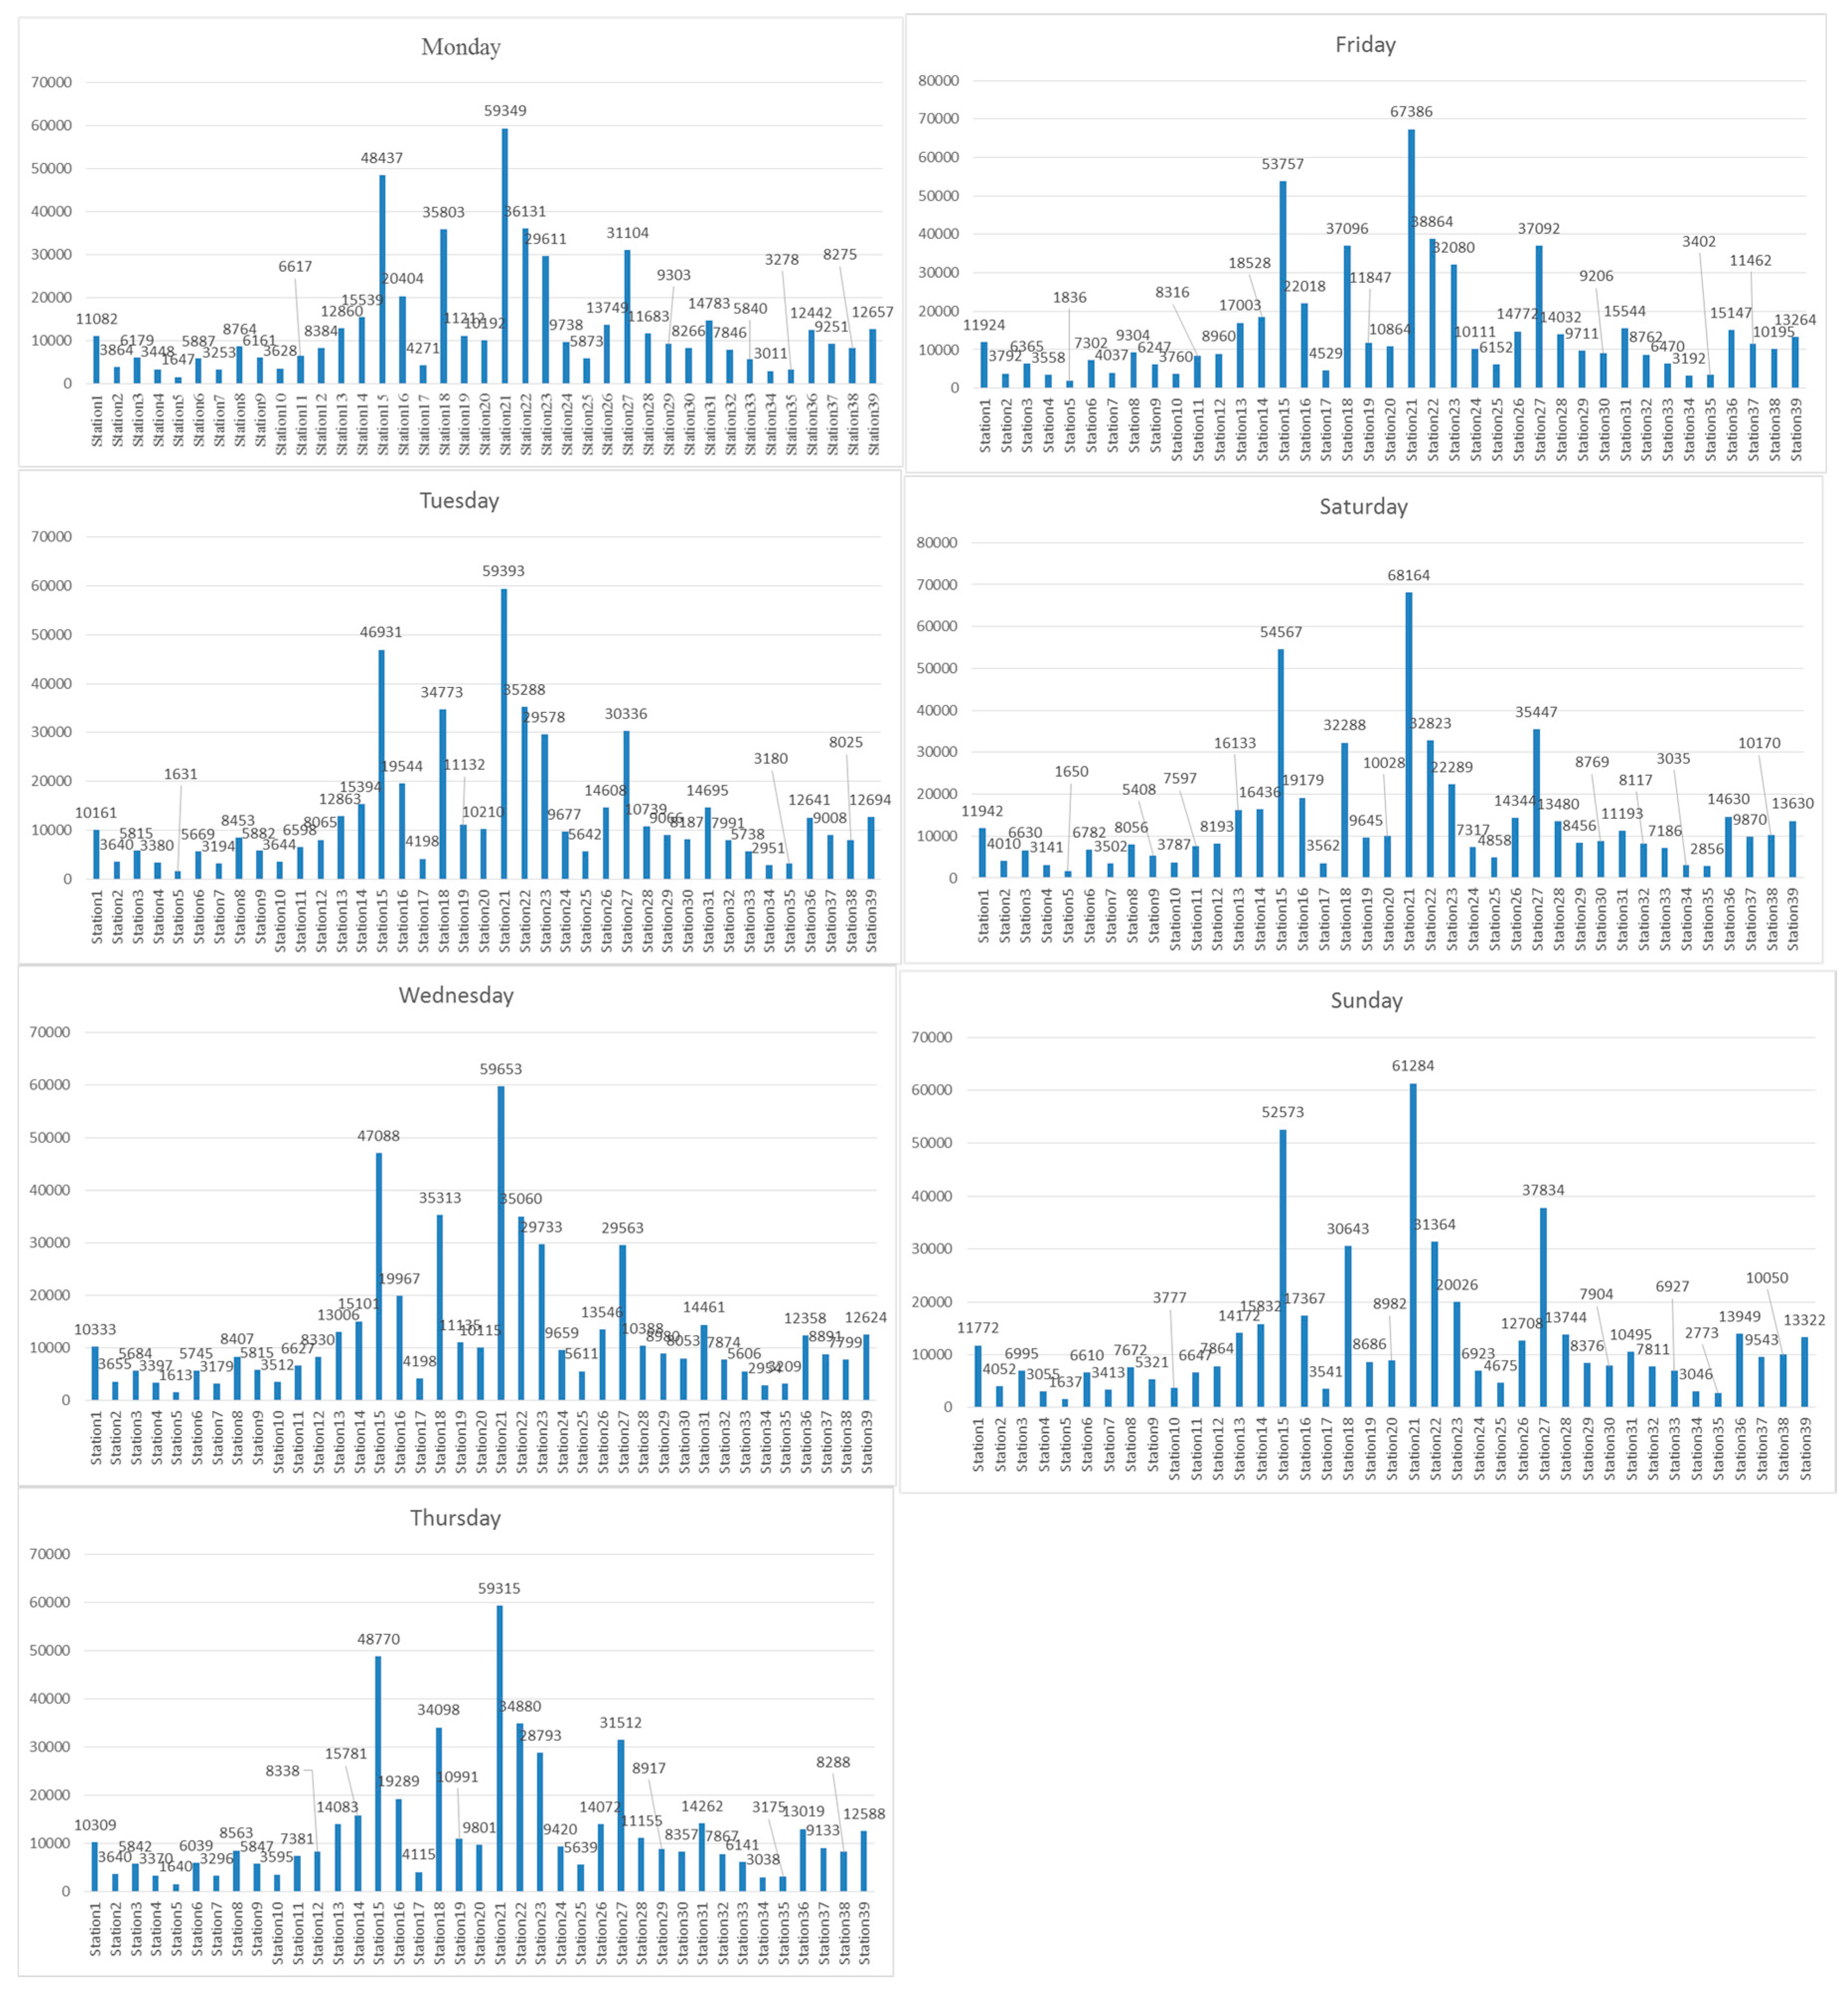
3.1. Data Collection

Table 2 presents the details of the 39 stations in Chongqing Metro Line 3. The flow direction from station 1 to station 39 is considered for analysis.
The boarding flows (BF) for all 39 metro stations are collected for the period from 1 January 2015 to 13 June 2015. The average values of BF for all 39 stations from Monday to Sunday during the surveyed period are shown in Figure 4.
The compositions of BFi for each of the 39 stations are also obtained in this study. Taking BF1 as an example, Table 3 shows the compositions of BF1 for station 1. The data of BFi for other stations are not included in the contexts of the paper due to the limitation of the paper length.

3.2. Calculation Results

By applying the data of BFi-j for all 39 stations to model (5), the results of the passenger flows between two adjacent stations represented by i and j, namely rpi-j, are calculated. The data for the other variables in model (6), including x, y, m, and z, were provided by the Chongqing Metro Corporation, with the following details:
x = 48; y = 100; m = 180; z = 6
By applying these variable values and the value of rp(i-j) to model (6), the values of parameter θi-j are produced, as shown in Table 4. Based on the calculation results for the variable θi-j, it can be found that the crowdedness between two adjacent stations along Chongqing Metro Line 3 varies significantly. For further discussion on the crowdedness level between different pairs of adjacent stations on this metro line, the thresholds for each crowdedness level need to be established. By referring to the four threshold scenarios discussed in the previous section, the following four thresholds of crowdedness level are established for the case concerned in this study:
(a)
when 0 < θi-j ≤ 0.32, it indicates a situation of no crowdedness.
(b)
when 0.32 < θi-j ≤ 1, it indicates a low level of crowdedness.
(c)
when 1 < θi-j ≤ 1.1, it indicates a medium level of crowdedness.
(d)
when 1.1 < θi-j, it indicates a high level of crowdedness.
By referring the four above-mentioned thresholds to the value of θi-j in Table 4, the crowdedness levels among 38 pairs of adjacent stations on Chongqing Metro Line 3 are also identified and summarized in Table 4.

3.3. Discussion

The calculated results in Table 4 suggest that those stations at the ends of the metro line are usually not crowded, typically from station 1 to station 9, and from station 36 to station 39. The produced value of the crowdedness variable θi-j between these stations are all lower than 0.32. This indicates that passengers can normally have seats when traveling to these stations, and will not feel crowded. When passengers travel from station 9 to station 16, and from station 27 to station 36, they may not have seats, and need to stand in the metro carriage, but will not feel crowded, as the value of θi-j for these stations are more than 0.32 and lower than 1. In other words, the crowdedness level in each of these stations is low. Furthermore, the information in Table 4 suggests that the adjacent stations 16–17, 17–18, and 26–27 are at a medium level of crowdedness, where the value of θi-j in these stations is close to 1.1. Nevertheless, it appears that the adjacent stations from station 18 to station 26 are at a high level of crowdedness, as the value of θi-j for them is always above 1.1.
Furthermore, it has been found that the stations with a high level of crowdedness, namely, from station 18 to station 26, are located in the central area of Metro Line 3. The most crowded traveling occurs between stations 21 and 22, with the values of θ21-22 from Monday to Sunday equivalent to 1.26, 1.27, 1.16, 1.22, 1.30, 1.21, and 1.18, respectively. These crowdedness in adjacent stations occurs in two circumstances. In the first case, they are close to the central business district (CBD), or they are designed as a traffic hub, where many people will use the metro line [32]. For example, station 21 (Guanyingqiao) is the closest to the CBD, and station 27 (Chongqingbei) is close to the railway station. This can be echoed by the data in Figure 3, where it can be found that the average boarding flows on Sunday in these two stations are ranked in the top three among all 39 stations, with passenger numbers of 61,284 and 37,834, respectively. The high ridership density induces the high level of crowdedness between these adjacent stations, and this high level of crowdedness remains consistent throughout the week, as shown in Table 2.
In another circumstance, it can be noted that these transfer stations are all metro stations with a high level of crowdedness. For example, as shown in Table 4, stations 18 and 19 both have a high level of crowdedness, where station 18 (Lianglukou) is the transfer station between Line 3 and Line 1, and station 19 (Niujiaotuo) is the transfer station between Line 3 and Line 2.
The above analysis results were presented to a group of staff of the Chongqing Metro Corporation who work on Metro Line 3. The discussion suggested that the calculation results are consistent with what the work staff had been experiencing in practice. The work staff pointed out that the crowdedness is severe in the stations located in the middle areas. One of the main reasons suggested for the crowdedness problem is the insufficient carrying capacity of the metro line, particularly during peak hours. The crowdedness inside the carriages results in long waiting times on the platforms of the stations, which causes severe crowdedness at the metro stations.
Considering that the urban metro system is public transportation, the government and relevant administrative departments of the metro system should play a leading role in developing appropriate policy measures and planning decisions to mitigate the crowdedness problem, especially for the stations with a high level of crowdedness. In this study, two categories of policy measures have been discussed for reducing crowdedness among metro stations and providing some reference for governmental administration. One is increasing the vehicle frequency among crowded metro stations. The Chongqing Metro Corporation adopted a sectional operation approach to increase the frequency of the metro vehicles. Through this approach, the operation for the 39 stations on Metro Line 3 is divided into three sections during peak hours: section one, starting with station 1 and ending in station 24; section two, starting with station 8 and ending in station 24; and section three, starting with station 14 and ending in station 39. Section two, which covers more central areas, is scheduled with more vehicle frequency during peak hours, and can improve the carrying capacity among the crowded stations. It was reported during the discussion with the work staff that this sectional operation method does relieve the crowdedness both inside carriages and on the platforms.
The other policy measure would involve implementing a variable ticket price. According to previous research results, the ticket price is one of the main factors that determines whether or not passengers will choose the metro system as a means of transport [40,41,42]. Therefore, through application of dynamic ticket pricing, authorities can consider this as a potential policy that would decrease the number of metro passengers during peak hours, and thus reduce crowdedness. For example, the Australia Rail Company implemented a category of rail ticket i.e., early bird ticket, which offered passengers free rail travel if their trips were completed before 7 am in Melbourne. This ticket has reduced demand during peak time between 1.2% and 1.5% from previous levels [19]. The New York metro system in the US also implemented two categories tickets, namely, peak ticket and off-peak ticket, in a day. Passengers need to purchase peak tickets between 5–10 a.m. and 4–8 p.m. It is important to note that the fare of the two ticket categories are totally different, and the off-peak fare is only a quarter of the peak fare [43]. At present, dynamic ticket pricing is not used by the Chongqing Metro Corporation. Therefore, in the future, according to the experience of cities such as Melbourne, New York, and others, the Chongqing Metro Corporation may put forward the policy for different metro ticket pricing in Chongqing to reduce the crowdedness problem.

4. Conclusions

Crowdedness in operating metro systems has presented a major problem in many cities, and therefore, methods are needed to mitigate the problem. In order to adopt effective methods, there is a need for an effective tool for measuring the level of crowdedness. Through introducing a measurement model, this study suggested that the level of crowdedness between adjacent stations in a metro line can be effectively measured. The results from the analysis can inform where the most crowded stations are in a metro system, and then adequate management strategies and methods can be identified to reduce the problem. The effectiveness of the proposed model is demonstrated from the case study of Chongqing Metro Line 3. From the case study, it has been found that the most crowded linkages between the metro stations are either in the central area of the metro line or the stations for transferring between different lines. More attention should be given to these stations in order to reduce the risks of accidents. The development of the model in this paper adds value to the development of methodology for further studies on the utility performance of metro systems.
The limitation of this paper is that the numbers for boarding flow and alighting flow may not be uniform if passengers are boarding from other lines through the transfer stations. The lack of this consideration may affect the adequacy of evaluation results if the evaluation is requested from a holistic point of view. It is appreciated that the case study used the daily total passenger flow data of each station. However, the distribution of the passenger flow throughout a day is also an important and interesting factor to be considered, especially for peak hours and off-peak hours. As a result, this issue is on the future research agenda for our research team.

Supplementary Files

Supplementary File 1

Acknowledgments

This research is funded by the Chongqing Federation of Social Science (Project No: 2017QNGL52).

Author Contributions

Liudan Jiao designed the research and drafted the manuscript. Liyin Shen and Chenyang Shuai analyzed data and provided extensive revisions on the manuscript. Yongtao Tan and Bei He analyzed data and drafted the manuscript.

Conflicts of Interest

The authors declare no conflict of interest.

References

  1. Loo, B.P.; Cheng, A.H. Are there useful yardsticks of population size and income level for building metro systems? Some worldwide evidence. Cities 2010, 27, 299–306. [Google Scholar] [CrossRef]
  2. Andrade, C.E.S.; D’Agosto, M.A. The Role of Rail Transit Systems in Reducing Energy and Carbon Dioxide Emissions: The Case of the City of Rio de Janeiro. Sustainability 2016, 8, 150. [Google Scholar] [CrossRef]
  3. Sun, D.J.; Zhao, Y.; Lu, Q.C. Vulnerability analysis of urban rail transit networks: A case study of Shanghai, China. Sustainability 2015, 7, 6919–6936. [Google Scholar] [CrossRef]
  4. Shen, L.Y.; Jiao, L.D.; Zhou, J.Y.; Ren, W.J. Evaluation indicators for the efficiency of metro systems from a socio-economic-technical perspective. In Proceedings of the 18th International Symposium on Advancement of Construction Management and Real Estate, Xi’an, China, 22 May 2014. [Google Scholar]
  5. Chen, F.; Shen, X.; Wang, Z.; Yang, Y. An Evaluation of the Low-Carbon Effects of Urban Rail Based on Mode Shifts. Sustainability 2017, 9, 401. [Google Scholar] [CrossRef]
  6. Zhang, X.; Liu, X.; Hang, J.; Yao, D.; Shi, G. Do Urban Rail Transit Facilities Affect Housing Prices? Evidence from China. Sustainability 2016, 8, 380. [Google Scholar] [CrossRef]
  7. Litman, T. Evaluating rail transit benefits: A comment. Transp. Policy 2007, 14, 94–97. [Google Scholar] [CrossRef]
  8. Metrobits. Available online: http://mic-ro.com/metro/ (accessed on 22 May 2015).
  9. Observer. Available online: http://www.guancha.cn/Project/2013_03_14_131915.shtml (accessed on 14 March 2013).
  10. Shen, L.Y.; Jiao, L.D.; He, B.; Li, L.C. Evaluation on the utility efficiency of metro infrastructure projects in China from sustainable development perspective. Int. J. Proj. Manag. 2015, 33, 528–536. [Google Scholar] [CrossRef]
  11. Jiang, S.; Sun, Y.; Du, Y. Influence of in-vehicle congestion degree on choice of public transit mode. J. Tongji Univ. Nat. Sci. 2012, 40, 1831–1835. [Google Scholar]
  12. Tirachini, A.; Hensher, D.A.; Rose, J.M. Crowding in public transport systems: Effects on users, operation and implications for the estimation of demand. Transp. Res. Part A Policy Pract. 2013, 53, 36–52. [Google Scholar] [CrossRef]
  13. Cox, T.; Houdmont, J.; Griffiths, A. Rail passenger crowding, stress, health and safety in Britain. Transp. Res. Part A Policy Pract. 2006, 40, 244–258. [Google Scholar] [CrossRef]
  14. Kim, H.; Kwon, S.; Wu, S.K.; Sohn, K. Why do passengers choose a specific car of a metro train during the morning peak hours? Transp. Res. Part A Policy Pract. 2014, 61, 249–258. [Google Scholar] [CrossRef]
  15. Li, Z.; Hensher, D.A. Crowding and public transport: A review of willingness to pay evidence and its relevance in project appraisal. Transp. Policy 2011, 18, 880–887. [Google Scholar] [CrossRef]
  16. Raveau, S.; Guo, Z.; Muñoz, J.C.; Wilson, N.H. A behavioural comparison of route choice on metro networks: Time, transfers, crowding, topology and socio-demographics. Transp. Res. Part A Policy Pract. 2014, 66, 185–195. [Google Scholar] [CrossRef]
  17. Kim, K.M.; Hong, S.P.; Ko, S.J.; Kim, D. Does crowding affect the path choice of metro passengers? Transp. Res. Part A Policy Pract. 2015, 77, 292–304. [Google Scholar] [CrossRef]
  18. Kuby, M.; Barranda, A.; Upchurch, C. Factors influencing light-rail station boardings in the United States. Transp. Res. Part A Policy Pract. 2004, 38, 223–247. [Google Scholar] [CrossRef]
  19. Currie, G. Quick and effective solution to rail overcrowding: Free early bird ticket experience in Melbourne, Australia. Transp. Res. Rec. J. Transp. Res. Board 2010, 2146, 35–42. [Google Scholar] [CrossRef]
  20. Wardman, M.; Whelan, G. Twenty years of rail crowding valuation studies: Evidence and lessons from British experience. Transp. Rev. 2011, 31, 379–398. [Google Scholar] [CrossRef]
  21. Evans, G.W.; Wener, R.E. Crowding and personal space invasion on the train: Please don’t make me sit in the middle. J. Environ. Psychol. 2007, 27, 90–94. [Google Scholar] [CrossRef]
  22. Yook, D.; Heaslip, K. The effect of crowding on public transit user travel behavior in a large-scale public transportation system through modeling daily variations. Transp. Plan. Technol. 2015, 38, 935–953. [Google Scholar] [CrossRef]
  23. Mahudin, N.D.M.; Cox, T.; Griffiths, A. Measuring rail passenger crowding: Scale development and psychometric properties. Transp. Res. Part F Traffic Psychol. Behav. 2012, 15, 38–51. [Google Scholar] [CrossRef]
  24. Wu, J.; Ma, S. Crowdedness classification method for island platform in metro station. J. Transp. Eng. 2012, 139, 612–662. [Google Scholar] [CrossRef]
  25. Chow, W.K. ‘Waiting time’ for evacuation in crowded areas. Build. Environ. 2007, 42, 3757–3761. [Google Scholar] [CrossRef]
  26. Tirachini, A.; Sun, L.; Erath, A.; Chakirov, A. Valuation of sitting and standing in metro trains using revealed preferences. Transp. Policy 2016, 47, 94–104. [Google Scholar] [CrossRef]
  27. Qin, F. Investigating the in-vehicle crowding cost functions for public transit modes. Math. Prob. Eng. 2014, 2014, 502708. [Google Scholar] [CrossRef]
  28. Whelan, G.; Crockett, J. An investigation of the willingness to pay to reduce rail overcrowding. In Proceedings of the First International Conference on Choice Modelling, Harrogate, UK, 24 March 2009. [Google Scholar]
  29. Li, M.; Wang, Y.H.; Jia, L.M. Passenger flow modes and control strategies in urban rail transit station. J. Southeast Univ. 2015, 1203–1208. [Google Scholar] [CrossRef]
  30. Zhang, L.Y.; Meng, L.; Yin, Q. Classification of Urban Rail Transit Stations based on SAX. J. GEO-Inf. Sci. 2016, 18, 1597–1607. [Google Scholar]
  31. Yin, Q.; Zhang, L.Y.; Meng, L. Classification of subway stations in Beijing based on passenger flow characteristics. Prog. Geogr. 2016, 35, 126–134. [Google Scholar]
  32. Zhao, J.; Deng, W.; Song, Y.; Zhu, Y. What influences Metro station ridership in China? Insights from Nanjing. Cities 2013, 35, 114–124. [Google Scholar] [CrossRef]
  33. Li, L.; Ren, H.; Zhao, S.; Duan, Z.; Zhang, Y.; Zhang, A. Two dimensional accessibility analysis of metro stations in Xi’an, China. Transp. Res. Part A Policy Pract. 2017, 106, 414–426. [Google Scholar] [CrossRef]
  34. Wei, J.L.; Liang, P.; Yan, Y.; Jiao, Y. A Study of Optimization of Station Distribution in Urban Rail Transit. J. Qingdao Technol. Univ. 2008, 29, 88–93. [Google Scholar]
  35. Wikipedia. 2015a. Available online: https://en.wikipedia.org/wiki/Crowd (accessed on 26 June 2015).
  36. Wikipedia. 2015b. Available online: https://en.wikipedia.org/wiki/Crowd_counting (accessed on 26 June 2015).
  37. Jiao, L.D.; Shuai, C.Y.; Shen, L.Y.; Luo, X.C. The level of crowdedness in operating metro systems in the selected cities in China. In Proceedings of the 20th International Symposium on Advancement of Construction Management and Real Estate, Hangzhou, China, 23–25 October 2016. [Google Scholar]
  38. Li, Z.; Hensher, D.A. Crowding in public transport: A review of objective and subjective measures. J. Public Transp. 2013, 16, 107–134. [Google Scholar] [CrossRef]
  39. Wikipedia. 2015c. Available online: https://en.wikipedia.org/wiki/Line_3,_Chongqing_Rail_Transit (accessed on 26 June 2015).
  40. Zhou, X.; Zhang, X.; Yang, X.; Lao, Y. Travel mode choice-based prediction of public transit demand. J.-Tongji Univ. 2007, 35, 1627–1631. [Google Scholar]
  41. Zhu, Y.; Wang, Y.; Ding, C. Investigating the influential factors in the metro choice behavior: Evidences from Beijing, China. KSCE J. Civ. Eng. 2016, 20, 2947–2954. [Google Scholar] [CrossRef]
  42. Cheng, Y.H.; Tseng, W.C. Exploring the effects of perceived values, free bus transfer, and penalties on intermodal metro–bus transfer users’ intention. Transp. Policy 2016, 47, 127–138. [Google Scholar] [CrossRef]
  43. Qiao, Y.F. Research on Differential Pricing Issue of China’s Metro Tickets. Prices Mon. 2015, 2, 42–45. [Google Scholar]
Figure 1. Passenger flows between stations.
Sustainability 09 02325 g001
Figure 2. Composition of passenger boarding flow in individual stations. AF: alighting flow; BF: boarding flow.
Sustainability 09 02325 g002
Figure 3. Chongqing metro system.
Sustainability 09 02325 g003
Figure 4. The value of BF for 39 metro stations.
Sustainability 09 02325 g004
Table 1. Thresholds for measuring the level of crowdedness in a metro line.
Load Factor (Passengers/Seat)Situation of Crowding
A0–0.5No passenger needs to sit next to another
B0.51–0.75Passengers can choose where to sit
C0.76–1All passengers can sit
D1.01–1.25Comfortable standee load for design
E1.26–1.5Maximum schedule load
F>1.5Crush load
Table 2. Details of the stations in Chongqing Metro Line 3.
Station NumberStation NameStation NumberStation NameStation NumberStation Name
1Yudong14Sigongli27Chongqingbei Railway Station
2Jinzhu15Nanping28Longtousi
3Yuhulu16Gongmao29Tongjiayuanzi
4Xuetangwan17Tongyuanju30Jinyu
5Dashancun18Lianglukou31Jintonglu
6Huaxi19Niujiaotuo32Yuanyang
7Chalukou20Huaxinjie33The EXPO Garden
8Jiugongli21Guanyinqiao34Cuiyun
9Qilong22Hongqihegou35Changfulu
10Bagongli23Jiazhoulu36huixing
11Ertang24Zhengjiayuanzi37Shuanglong
12Liugongli25Tangjiayuanzi38Bijin
13Wugongli26Shiziping39Jiangbei Airport
Table 3. Composition of passenger boarding flow for station 1. Unit: passenger.
MondayTuesdayWednesdayThursdayFridaySaturdaySunday
BF1–282757876889388
BF1–3136123130133158175159
BF1–474686968757270
BF1–526242424272827
BF1–6115101105107126134141
BF1–770656666768390
BF1–810899101102120138139
BF1–9144130134131149142143
BF1–1080767474808588
BF1–11120112115123138155154
BF1–12149136147143160167164
BF1–13256236245256316342335
BF1–14280251253261304314328
BF1–15108799710221049125613591262
BF1–16475429447423508468426
BF1–1773707170807877
BF1–18939875887859964825811
BF1–19267249251244265209200
BF1–20183171174167191196182
BF1–211469135913931355160317791656
BF1–22777704719715831732721
BF1–23505467474457504391379
BF1–24185171176169188154147
BF1–251101011031001129694
BF1–26286288270274305314279
BF1–27677595596640761788854
BF1–28295242247270355353387
BF1–29184171173170190187196
BF1–30183167167167187192184
BF1–31306284283276304248245
BF1–32185175178177198207210
BF1–331059695102111144146
BF1–3460575757626264
BF1–3585737369766566
BF1–36299283286294341382399
BF1–37202181184184211219254
BF1–38191169168170199227258
BF1–39318289299287308342350
Table 4. The value of θi-j and level of crowdedness between adjacent stations on Chongqing Metro Line 3.
MondayTuesdayWednesdayThursdayFridaySaturdaySunday
θi-jCrowdedness Resultsθi-jCrowdedness Resultsθi-jCrowdedness Resultsθi-jCrowdedness Resultsθi-jCrowdedness Resultsθi-jCrowdedness Resultsθi-jCrowdedness Results
station1–20.08Not0.08Not0.08Not0.08Not0.09Not0.09Not0.09Not
station2–30.11Not0.1Not0.1Not0.1Not0.12Not0.12Not0.12Not
station3–40.15Not0.14Not0.14Not0.14Not0.16Not0.16Not0.17Not
station4–50.18Not0.17Not0.17Not0.17Not0.18Not0.19Not0.19Not
station5–60.19Not0.18Not0.18Not0.18Not0.2Not0.2Not0.2Not
station6–70.23Not0.22Not0.22Not0.22Not0.25Not0.24Not0.24Not
station7–80.25Not0.24Not0.24Not0.24Not0.27Not0.26Not0.27Not
station8–90.31Not0.29Not0.29Not0.3Not0.34Low0.32Not0.32Not
station9–100.35Low0.33Low0.33Low0.33Low0.37Low0.35Low0.35Low
station10–110.37Low0.35Low0.35Low0.36Low0.4Low0.37Low0.38Low
station11–120.41Low0.39Low0.39Low0.4Low0.45Low0.42Low0.41Low
station12–130.46Low0.44Low0.44Low0.45Low0.5Low0.47Low0.46Low
station13–140.55Low0.51Low0.51Low0.53Low0.6Low0.56Low0.55Low
station14–150.71Low0.67Low0.67Low0.69Low0.77Low0.72Low0.71Low
station15–160.98Low0.96Low0.98Low0.99Low1Low0.96Low0.94Low
station16–171.04Medium1.02Medium1.04Medium1.03Medium1.07Medium1.01Medium1.03Medium
station17–181.06Medium1.04Medium1.05Medium1.04Medium1.08Medium1.02Medium1.05Medium
station18–191.17High1.15High1.12High1.15High1.19High1.13High1.08Medium
station19–201.2High1.18High1.13High1.16High1.21High1.14High1.11High
station20–211.22High1.2High1.14High1.18High1.22High1.16High1.14High
station21–221.26High1.27High1.16High1.22High1.3High1.21High1.18High
station22–231.23High1.24High1.15High1.21High1.31High1.21High1.14High
station23–241.15High1.16High1.11High1.17High1.25High1.18High1.17High
station24–251.13High1.13High1.12High1.15High1.23High1.16High1.18High
station25–261.11High1.12High1.1High1.14High1.21High1.15High1.17High
station26–271.04Medium1.08Medium1.05Medium1.03Medium1.09Medium1.1High1.14High
station27–280.82Low0.81Low0.75Low0.73Low0.79Low0.79Low0.83Low
station28–290.73Low0.69Low0.69Low0.66Low0.7Low0.72Low0.73Low
station29–300.68Low0.65Low0.65Low0.62Low0.66Low0.67Low0.69Low
station30–310.63Low0.61Low0.61Low0.58Low0.61Low0.63Low0.65Low
station31–320.54Low0.53Low0.53Low0.5Low0.51Low0.53Low0.55Low
station32–330.48Low0.47Low0.47Low0.45Low0.45Low0.48Low0.48Low
station33–340.45Low0.45Low0.45Low0.41Low0.42Low0.44Low0.44Low
station34–350.44Low0.43Low0.43Low0.4Low0.4Low0.42Low0.42Low
station35–360.41Low0.4Low0.4Low0.37Low0.38Low0.4Low0.39Low
station36–370.24Not0.23Not0.23Not0.23Not0.25Not0.28Not0.28Not
station37–380.18Not0.17Not0.17Not0.17Not0.18Not0.19Not0.19Not
station38–390.11Not0.11Not0.11Not0.11Not0.11Not0.11Not0.11Not

