Article

The Impact of Subsidies on the Prevalence of Climate-Sensitive Residential Buildings in Malaysia

1
International Institute for Global Health, United Nations University, Kuala Lumpur 56000, Malaysia
2
Sustainable Places Research Institute, Cardiff University, Cardiff, Wales CF10 3BA, UK
*
Author to whom correspondence should be addressed.
Sustainability 2017, 9(12), 2300; https://doi.org/10.3390/su9122300
Submission received: 26 September 2017 / Revised: 30 November 2017 / Accepted: 10 December 2017 / Published: 18 December 2017

Abstract

:
Dependence on air-conditioning (AC) for residential cooling and ventilation is a health and sustainability challenge. In hot temperatures, climate-sensitive buildings (CSB) can complement and/or substitute for AC usage in achieving thermal comfort. Many countries facing such conditions—particularly in tropical climates—are developing quickly, with rising populations and income creating demand for new housing and AC. This presents a window for adoption of CSB but could also result in long term lock-in of AC-dependent buildings. Here, a simple system dynamics model is used to explore the potential and limitations of subsidies to affect futures of housing stock and night-time AC usage in Malaysia. The effectiveness of subsidies in achieving high uptake of CSB and resulting health benefits is highly dependent on homebuyer willingness to pay (WTP). A detailed understanding of WTP in the Malaysian context and factors that can shift WTP is necessary to determine if CSB subsidies can be a good policy mechanism for achieving CSB uptake.

1. Introduction

Increasing affluence in developing countries located in hot climates is rapidly increasing demand for air-conditioning (AC) and residential AC usage is a major contributor to this trend [1,2]. This is an obstacle to combating climate change, with AC and associated hydrofluorocarbon emissions poised to become primary drivers of energy demand and climate change respectively [1,3]. It also creates local challenges in these countries. Indeed, AC usage (1) is changing electricity usage patterns [4,5,6], thereby increasing the risk of major power outages, especially during heatwaves [5,7,8,9]; (2) contributes to night-time urban heat island (UHI) intensity, [10,11,12,13,14,15,16], impacting sleep quality and increasing health risks, especially for AC non-users [17,18,19]; and (3) increases the frequency of respiratory illness [20,21,22,23]. These local and global impacts point toward a need for alternative cooling solutions.
Adoption of climate sensitive building (CSB) design, that is designed for local climates, can improve indoor thermal comfort and limit the demand for AC usage. In Malaysia, residential AC usage is heavily weighted toward the evening [24], making night-time thermal comfort an important element of CSB design in this context. Indeed, indoor temperatures in Malaysian residences are much warmer at night than ambient temperatures [25], making residential CSB design may be a potential leverage point for altering AC usage. Various strategies might be employed for this, including reducing heat absorption during the day, design that encourages and enables effective natural ventilation and supplemental, non-AC mechanical ventilation available where necessary.
Despite the benefits of CSB design, building design in tropical developing countries largely continues to ignore local climate needs. Instead, there is a rapidly growing reliance on AC in building design in tropical developing countries and worldwide, not only for cooling but also for basic ventilation [26,27]. Voluntary adoption of CSB alone is unlikely to achieve substantial results [28]. Rapid urbanization and an increasing number of households generate high demand for new housing in many developing countries. This represents a window of opportunity for increasing the proportion of CSB in residential housing but could also result in long term lock-in of conventional and AC-dependent buildings.
Cost premiums (i.e., the additional cost above that of a conventional building) are the most frequently cited obstacle to green building adoption, both in Malaysia and elsewhere [29,30,31,32,33]. Similar cost issues, real or perceived, will need to be addressed to achieve widespread CSB adoption. Subsidies may be a solution to the cost issue but homebuyer WTP is a critical factor that must be considered in evaluation and design of a CSB subsidy policy. This paper describes a system dynamics model that explores how consumer WTP and housing demand may affect the potential and limitations of subsidies to increase CSB housing stock and the consequent impacts on night-time AC usage in Malaysia.

2. Materials and Methods

2.1. Model Components, Simulation and Green Building Proxy

Key sections of the systems dynamics model are developed and presented in sequence: (1) the cost premium reinforcing loop and residential building stocks; (2) factors driving housing demand in Malaysia; (3) factors driving willingness to pay for AC ownership; and (4) factors driving AC usage. These subsections are integrated into a conceptual model (presented below) and a simulation model (Figure S1 in Supplementary Materials) and three scenarios pertaining to CSB uptake or AC usage were simulated for the Malaysian context between 2015 and 2065. All simulations were carried out in Vensim PLE 6.4 using 1 year time-steps. A complete table of simulation variables, equations, sources and notes (Table S1), are presented in Supporting Information.
Data on the uptake of CSB, both in Malaysia and worldwide, is sparse. The green building concept emphasizes indoor air quality and energy efficiency and potentially shares many common features with CSB design. Indeed, minimization or elimination of AC usage in residential buildings is an important consideration in the leading Malaysian green building certification, the Green Building Index (GBI). As such, data on green buildings, that is buildings that have received a basic green certification standard or higher by any widely recognized certifier, is used as a proxy for understanding cost and WTP issues around CSB.

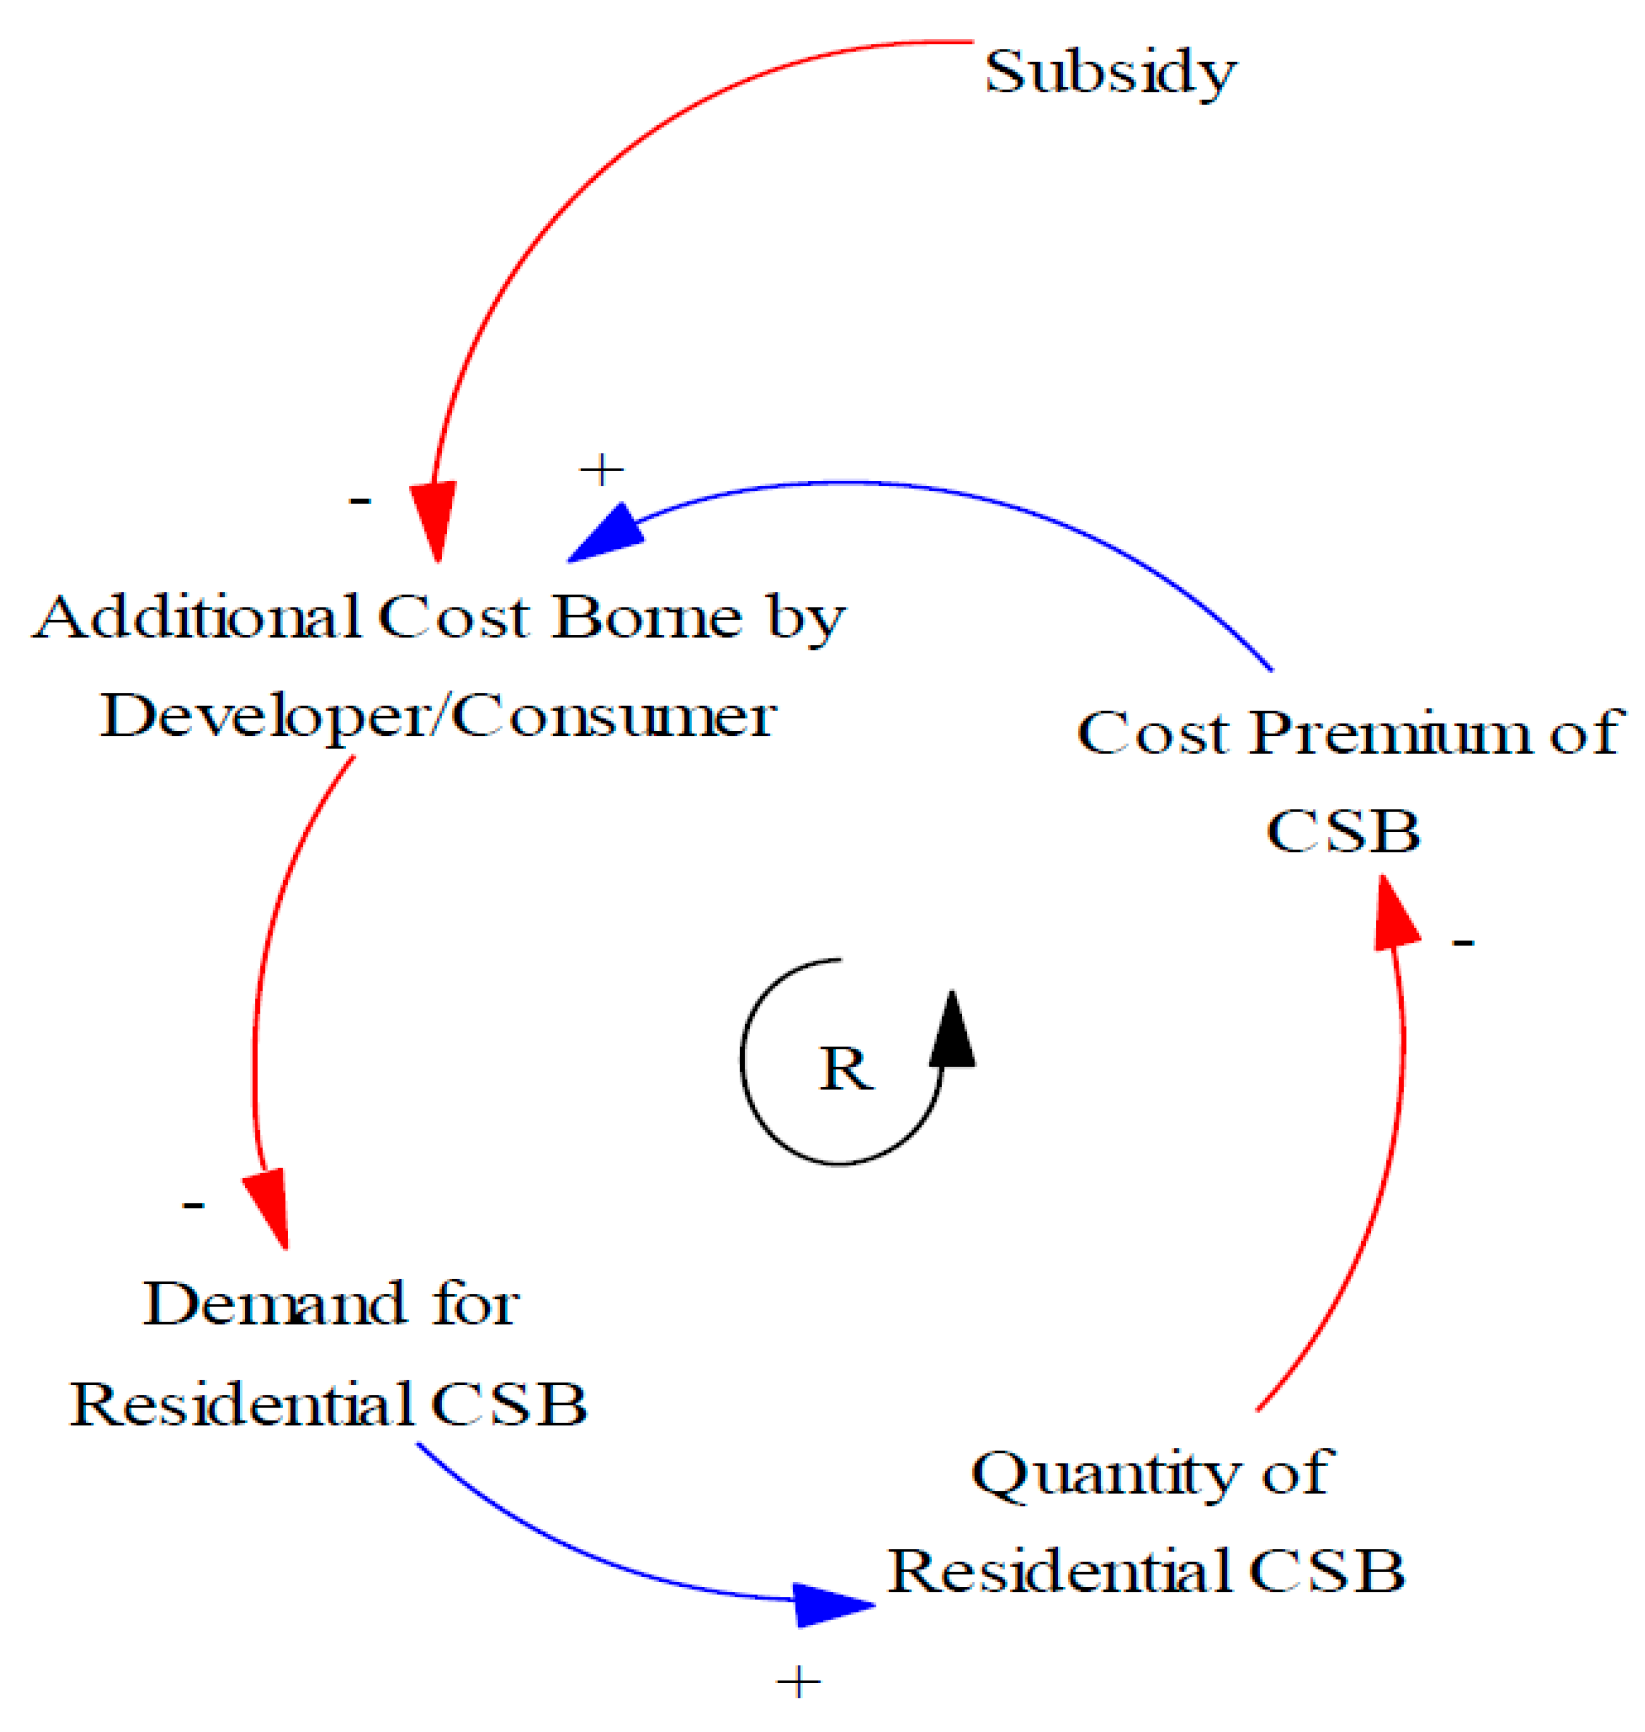
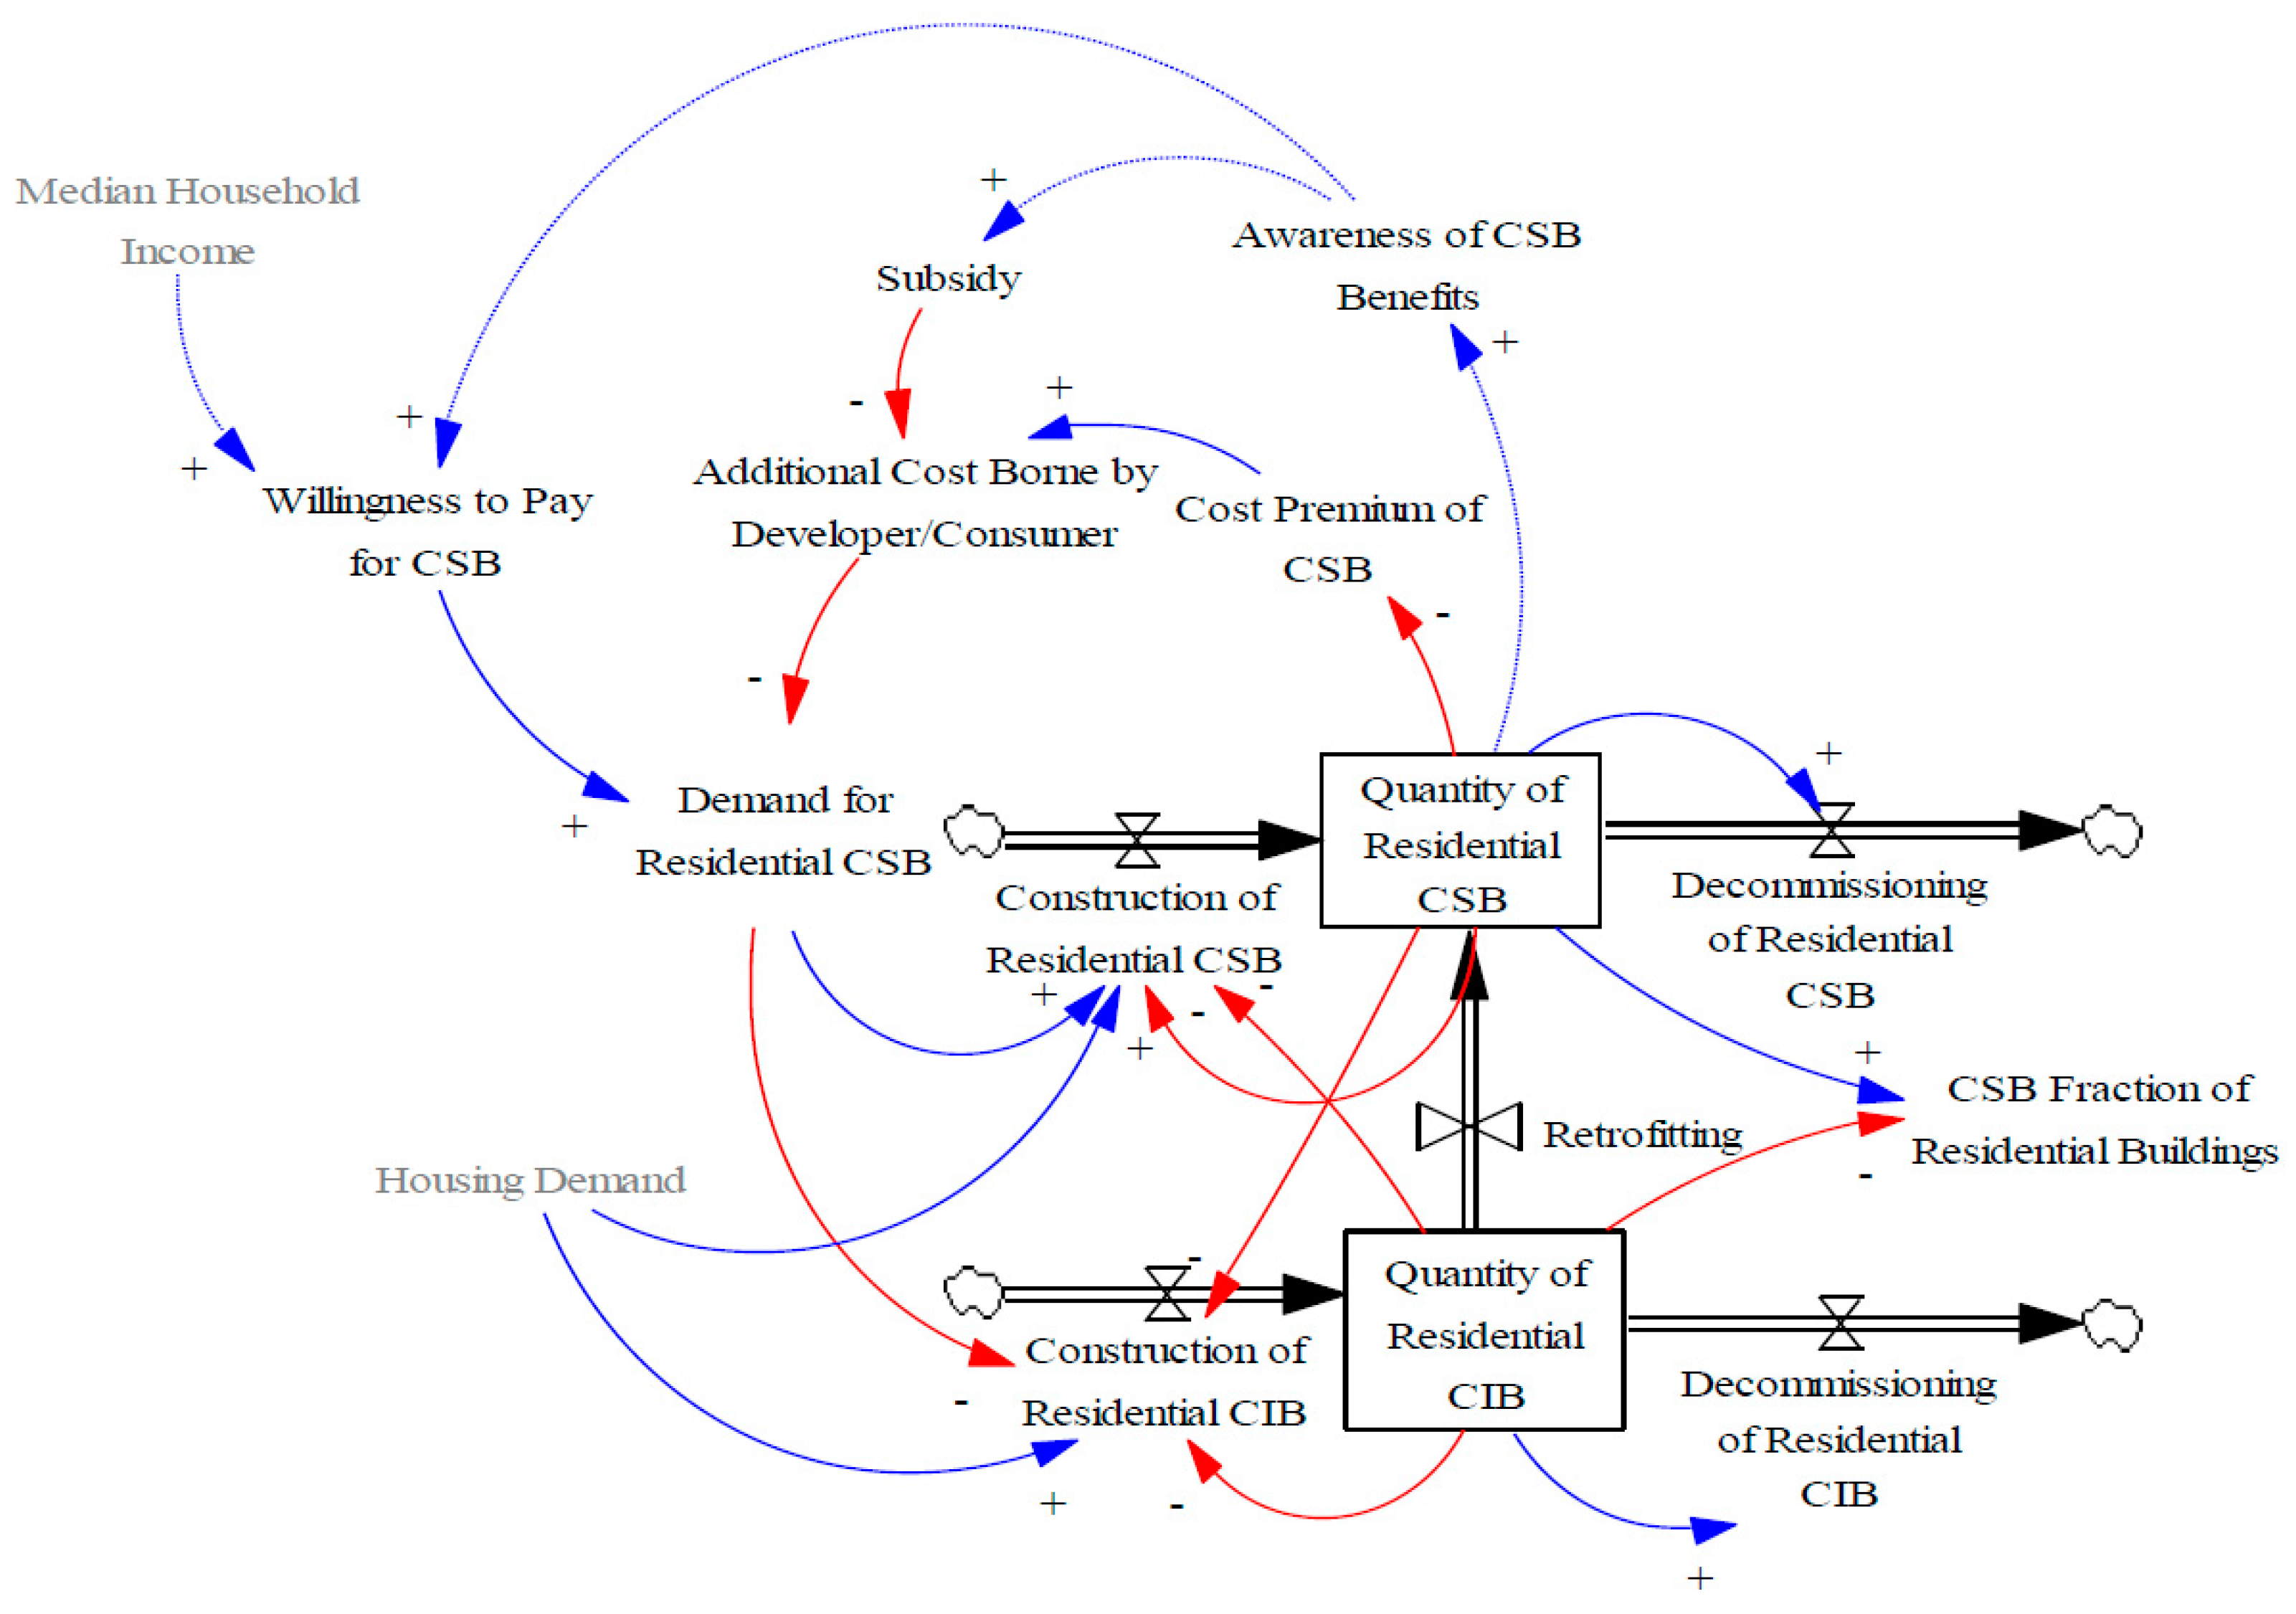
2.2. Cost-Premium Reinforcing Loop and Residential Building Stocks

The cost premium of green buildings decreases as the green building market matures [34] due to learning effects, economies of scale and development of supporting infrastructure and supply chains. This is known as the experience curve and can be described as a reinforcing loop. As residential CSB are constructed, industry experience, logistical chains and economies of scale reduce the “Cost Premium of CSB” relative to conventional residential buildings, in turn reducing the “Additional Cost Borne by Developers and/or Consumers.” This increases the “Demand for Residential CSB”, leading to further construction, increasing the “Quantity of CSB” (Figure 1). A “Subsidy” to reduce the costs experienced by developers and consumers could accelerate this feedback loop.

2.2.1. Residential Green Buildings and Subsidies in Malaysia

Green buildings are relatively new in the Malaysian context, placing the industry in the early stages of the “CSB Cost Premium Reinforcing Loop.” The leading certification program, the Green Building Index (GBI), was launched in 2009 by the Malaysian Institute of Architects. No GBI residential retrofitting certification tool is available to date, due to the lack of demand for such projects. As of May 2017, GBI has certified 398 projects; among these are final certification of 30 residential projects and provisional design certification of a further 138, representing 9.4 million square meters of planned and completed green residential space [35]. An additional, 51 Leadership in Energy and Environment Design (LEED) and 12 Greenmark (alternative green building certification programs) projects have been certified in Malaysia, mostly for commercial and industrial buildings [36]. By contrast, there were 4.9 million residential units throughout Malaysia in 2015 [37]. While GBI efforts are a welcome start in the Malaysian context, adoption remains very slow and additional measures are clearly needed to support growth in this sector.
In Malaysia, green building subsidies were introduced via a tax deduction for additional capital expenditure required to obtain green certification against statutory income derived from the building. This applied to green buildings certified between October 2009 and December 2014 [38]. The maximum subsidy is the tax rate, currently 24% for corporations. This tax exemption was subsequently broadened to include services, covering soft costs in addition to capital costs, in a program that runs until the end of 2020 [39]. However, because building sales are not considered building-derived income, very few residential buildings qualify for this scheme. Some minor incentives exist for green residential buildings, such as stamp duty exemptions and various minor programs by local and state governments but a general lack of policy incentives has been identified as a missing enabler for green buildings [40]. In this study, no-subsidy, expansion of the statutory income tax-exemption to include first sale of residential buildings (24% subsidy) and higher subsidy (75% and 90%) scenarios are considered.

2.2.2. Cost Premiums and the Experience Curve

Reported cost premiums for green buildings vary widely [41]. Methodology is critical as soft costs (consultation, certification and design) and project risks (longer project durations, increased front-loading of costs, supply chain and qualified expertise issues and increased uncertainty) are important but difficult-to-quantify cost drivers in implementation of green buildings [29,42,43,44,45]. The two major approaches to estimating cost premiums yield very different results: (1) comparison of whole budgets of conventional vs. green projects yields green premiums of 1 to 2% for Silver LEED certification, while (2) summing the costs of individual features yields ranges of 2 to 6% [46,47]. Both methods rely on data for existing green buildings, which have been generally targeted toward up-market segments, already built to higher standards; the green cost premium may be greater for lower market segments, which may explain why homebuilders with green building experience perceive the cost premium as higher still [48]. In Malaysia, the CBRE Group Inc. used global comparisons to suggest a green cost premium range of 3% to 15% but noted that the low baseline energy benchmarks used in the Malaysian construction industry could make green cost premiums higher still [49]. Contrasting estimates have been provided by the Malaysian GBI, which reports additional costs of just 1.2% to achieve basic certification for new green residential buildings [50]. For modelling purposes, an initial CSB cost premium of 5% in 2015 was assumed. The model was further tested for sensitivity to this variable using initial values of 2% and 10%.
The progress ratio is used to describe the rate of cost reductions obtained through the experience curve. It is defined as the ratio of the new cost to the reference cost after a doubling in production (e.g., a progress ratio of 0.8 means that the 10th unit is produced at 80% of the cost of the 5th unit). In studying energy-efficient buildings in Switzerland, Jakob and Madlener found progress ratios for facades and windows of 0.8 to 0.85 and 0.83 to 0.88, respectively [51]. These values are consistent with observations from the construction industry, which uses a progress ratio of 0.8 as a general guideline [52]. The lowest estimates of green building cost-premiums are in the range of 0–2%, so an irreducible CSB cost premium of 1% was assumed. Model scenarios utilize a progress ratio of 0.8 in approaching this minimum threshold and values of 0.75 and 0.9 were used for sensitivity analysis.

2.2.3. Willingness to Pay for CSB

Taking advantage of the experience curve requires sufficient demand for CSB. This in turn requires homebuyers with “Willingness to Pay for CSB” that matches existing cost premiums. WTP for green buildings is influenced by several factors including income [53] and exposure to green buildings (“Awareness of CSB Benefits”) [54]; the latter forms a potentially important feedback loop. Unfortunately, there is a lack of Malaysian data on WTP and motivating factors for residential green buildings. In lieu of attempting to construct WTP for CSB from household income and exposure to green buildings, WTP curves from other countries were used, with widely differing curves selected to explore a broad range of possible outcomes.
WTP can be measured either via stated preference surveys or revealed preference (i.e., hedonic pricing) methods. Revealed preference methods measure actual purchasing choices. This quantifies the premium paid on existing green buildings but does not provide a guide on how consumer demand might respond as cost premiums change. Stated preference surveys generate a response curve but may not match actual choices, in part due to the tendency of respondents to provide socially acceptable answers. To model response to changing cost premiums, we relied on stated preference data.
Several stated preference surveys exist for residential green buildings. Two were used as the basis for WTP curves (Figure 2) in the model. Details on WTP curve construction are described in Appendix A. The rational for the choice of the surveys and survey findings are described here briefly.
A Dodge Data and Analytics survey of US homebuilders’ perception of homebuyers WTP was chosen because (1) homebuilder perceptions affect willingness to undertake green building construction; (2) homebuilders have a strong incentive to accurately estimate customer WTP; and (3) posing the question to homebuilders instead of homebuyers minimizes the social desirability bias. The Dodge survey showed that homebuilders believed 27% of homebuyers would not pay any premium, while 91% would not pay a cost premium over 5% [48].
The second study used was conducted in the Tai Kok Tsui district in Hong Kong [53], chosen for its closer socio-economic match to the Malaysian context and the low WTP observed, providing a conservative estimate of consumer demand. In this study, 88% of respondents were unwilling to pay any premium at all for bronze Building Environmental Assessment Method (BEAM) certified housing. Among those willing to pay a cost premium, mean WTP was 0.6% with a standard deviation of 1.3% [53].

2.2.4. Stock and Flow Model

The CSB Cost Premium Loop (Figure 1) was developed into a stock-and-flow system dynamics model, shown in Figure 3, to examine residential CSB uptake (“CSB Fraction of Residential Buildings”) over time. The model does not attempt to simulate housing market cycles. Instead, construction activity was calculated based on projected housing demand (detailed in the following Section 2.3) and existing housing stock. It was assumed that all demand for residential CSB is met through “Construction of Residential CSB,” and that “Construction of Climate Insensitive Buildings” (CIB) accounts for the remaining construction activity. Residential buildings were assumed to have a uniform lifespan of 50 years (“Decommissioning of Residential CSB/CIB”), with an increased lifespan of 100 years used in sensitivity analysis. “Retrofitting” is shown in Figure 3 for completeness but there is no evidence of significant green residential building retrofitting activity in the Malaysian context, probably because it is cost-prohibitive. Indeed, it is far more cost effective to integrate key features into the original design than it is to retrofit, or even than to add green features to conventional designs prior to construction [55,56].

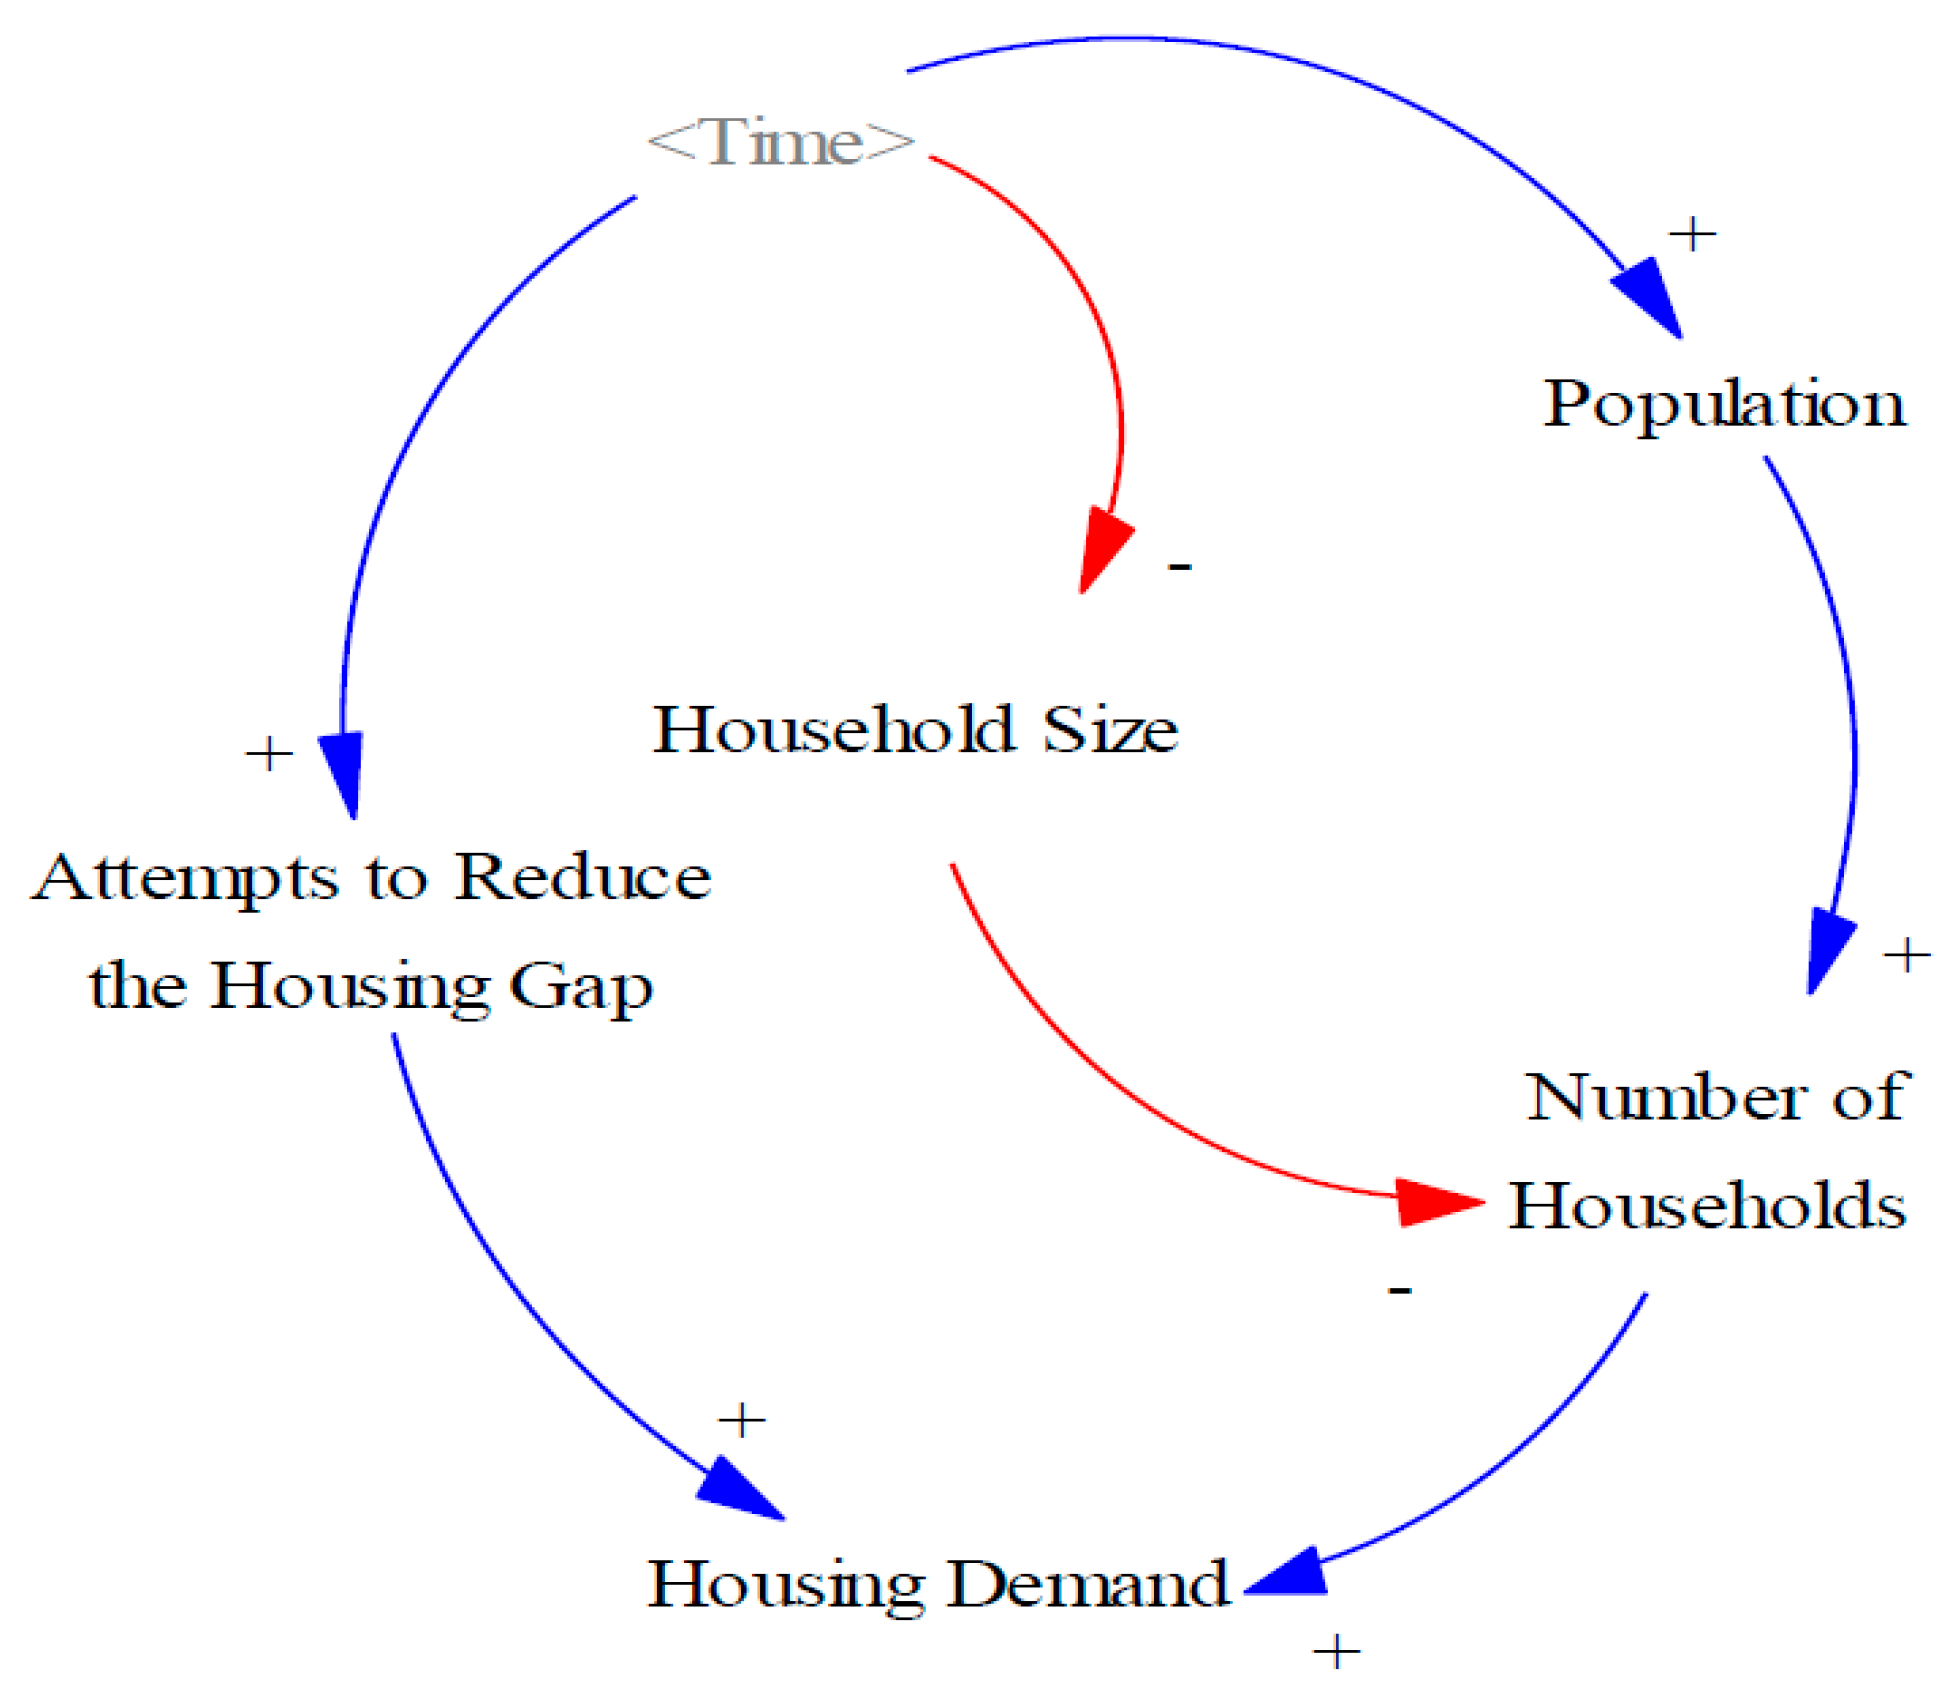
2.3. Factors Driving Housing Demand in Malaysia

“Housing Demand” is a key input in Figure 3. Future growth in the number of households and efforts to reduce the existing housing gap in Malaysia are expected to drive this (Figure 4). The Malaysian population (“Population”) is projected to grow from 31.2 million in 2015 to 41.5 million in 2040 (Figure S2) [57]. Growth in demand for housing will exceed population growth, however, due to shrinking “Household Sizes” [58]. Indeed, the projected 50% increase in population between 2015 and 2065 will yield more than 100% increase in the “Number of Households” if household size trends persist. Additionally, as of 2015, the number of households (7.4 million in 2015) exceeded housing stock (4.9 million in 2015), resulting in a supply gap of 2.5 million [37,59]. “Attempts to Reduce the Housing Gap”—which the Malaysian government is attempting—will create still more demand for new residential buildings.
Population growth and household size trends were modelled using projected growth by the Malaysian Department of Statistics (projections available until 2040, extrapolated beyond this time-horizon) and extrapolations of past trends respectively [57,58,59]. The number of households was calculated from this data. Three scenarios were considered, reflecting possible attempts to reduce the housing gap: (1) a baseline scenario, assuming the current housing gap is persistent (Fixed); (2) a scenario, in which the housing gap is halved by 2030 by government interventions without compromising CSB uptake and continues to shrink according to a logistic decay function (Reduced); and (3) a scenario in which the housing gap shrinks as in (2) but where the additional housing units are cheaper, conventional buildings (CIB Int).

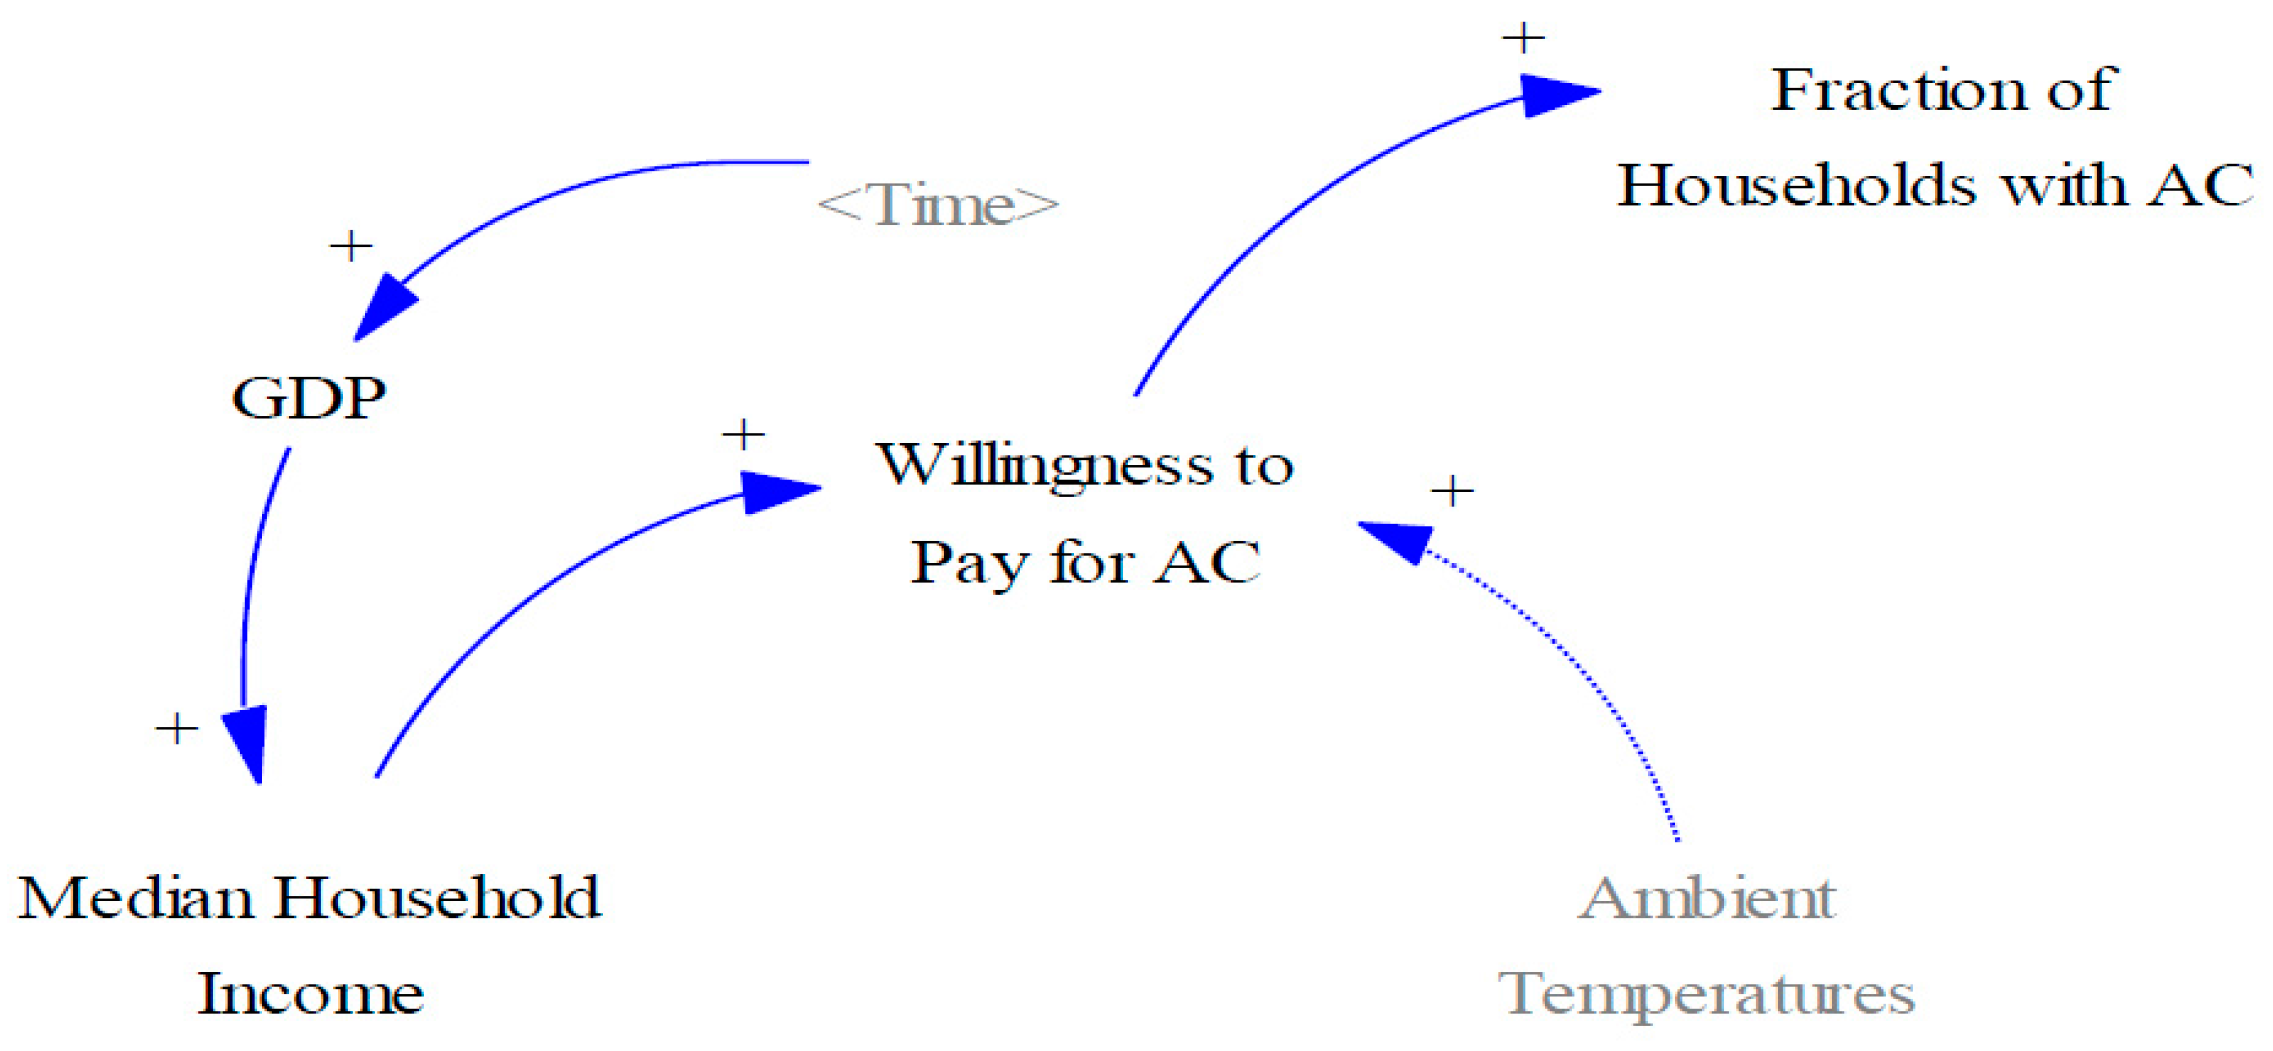
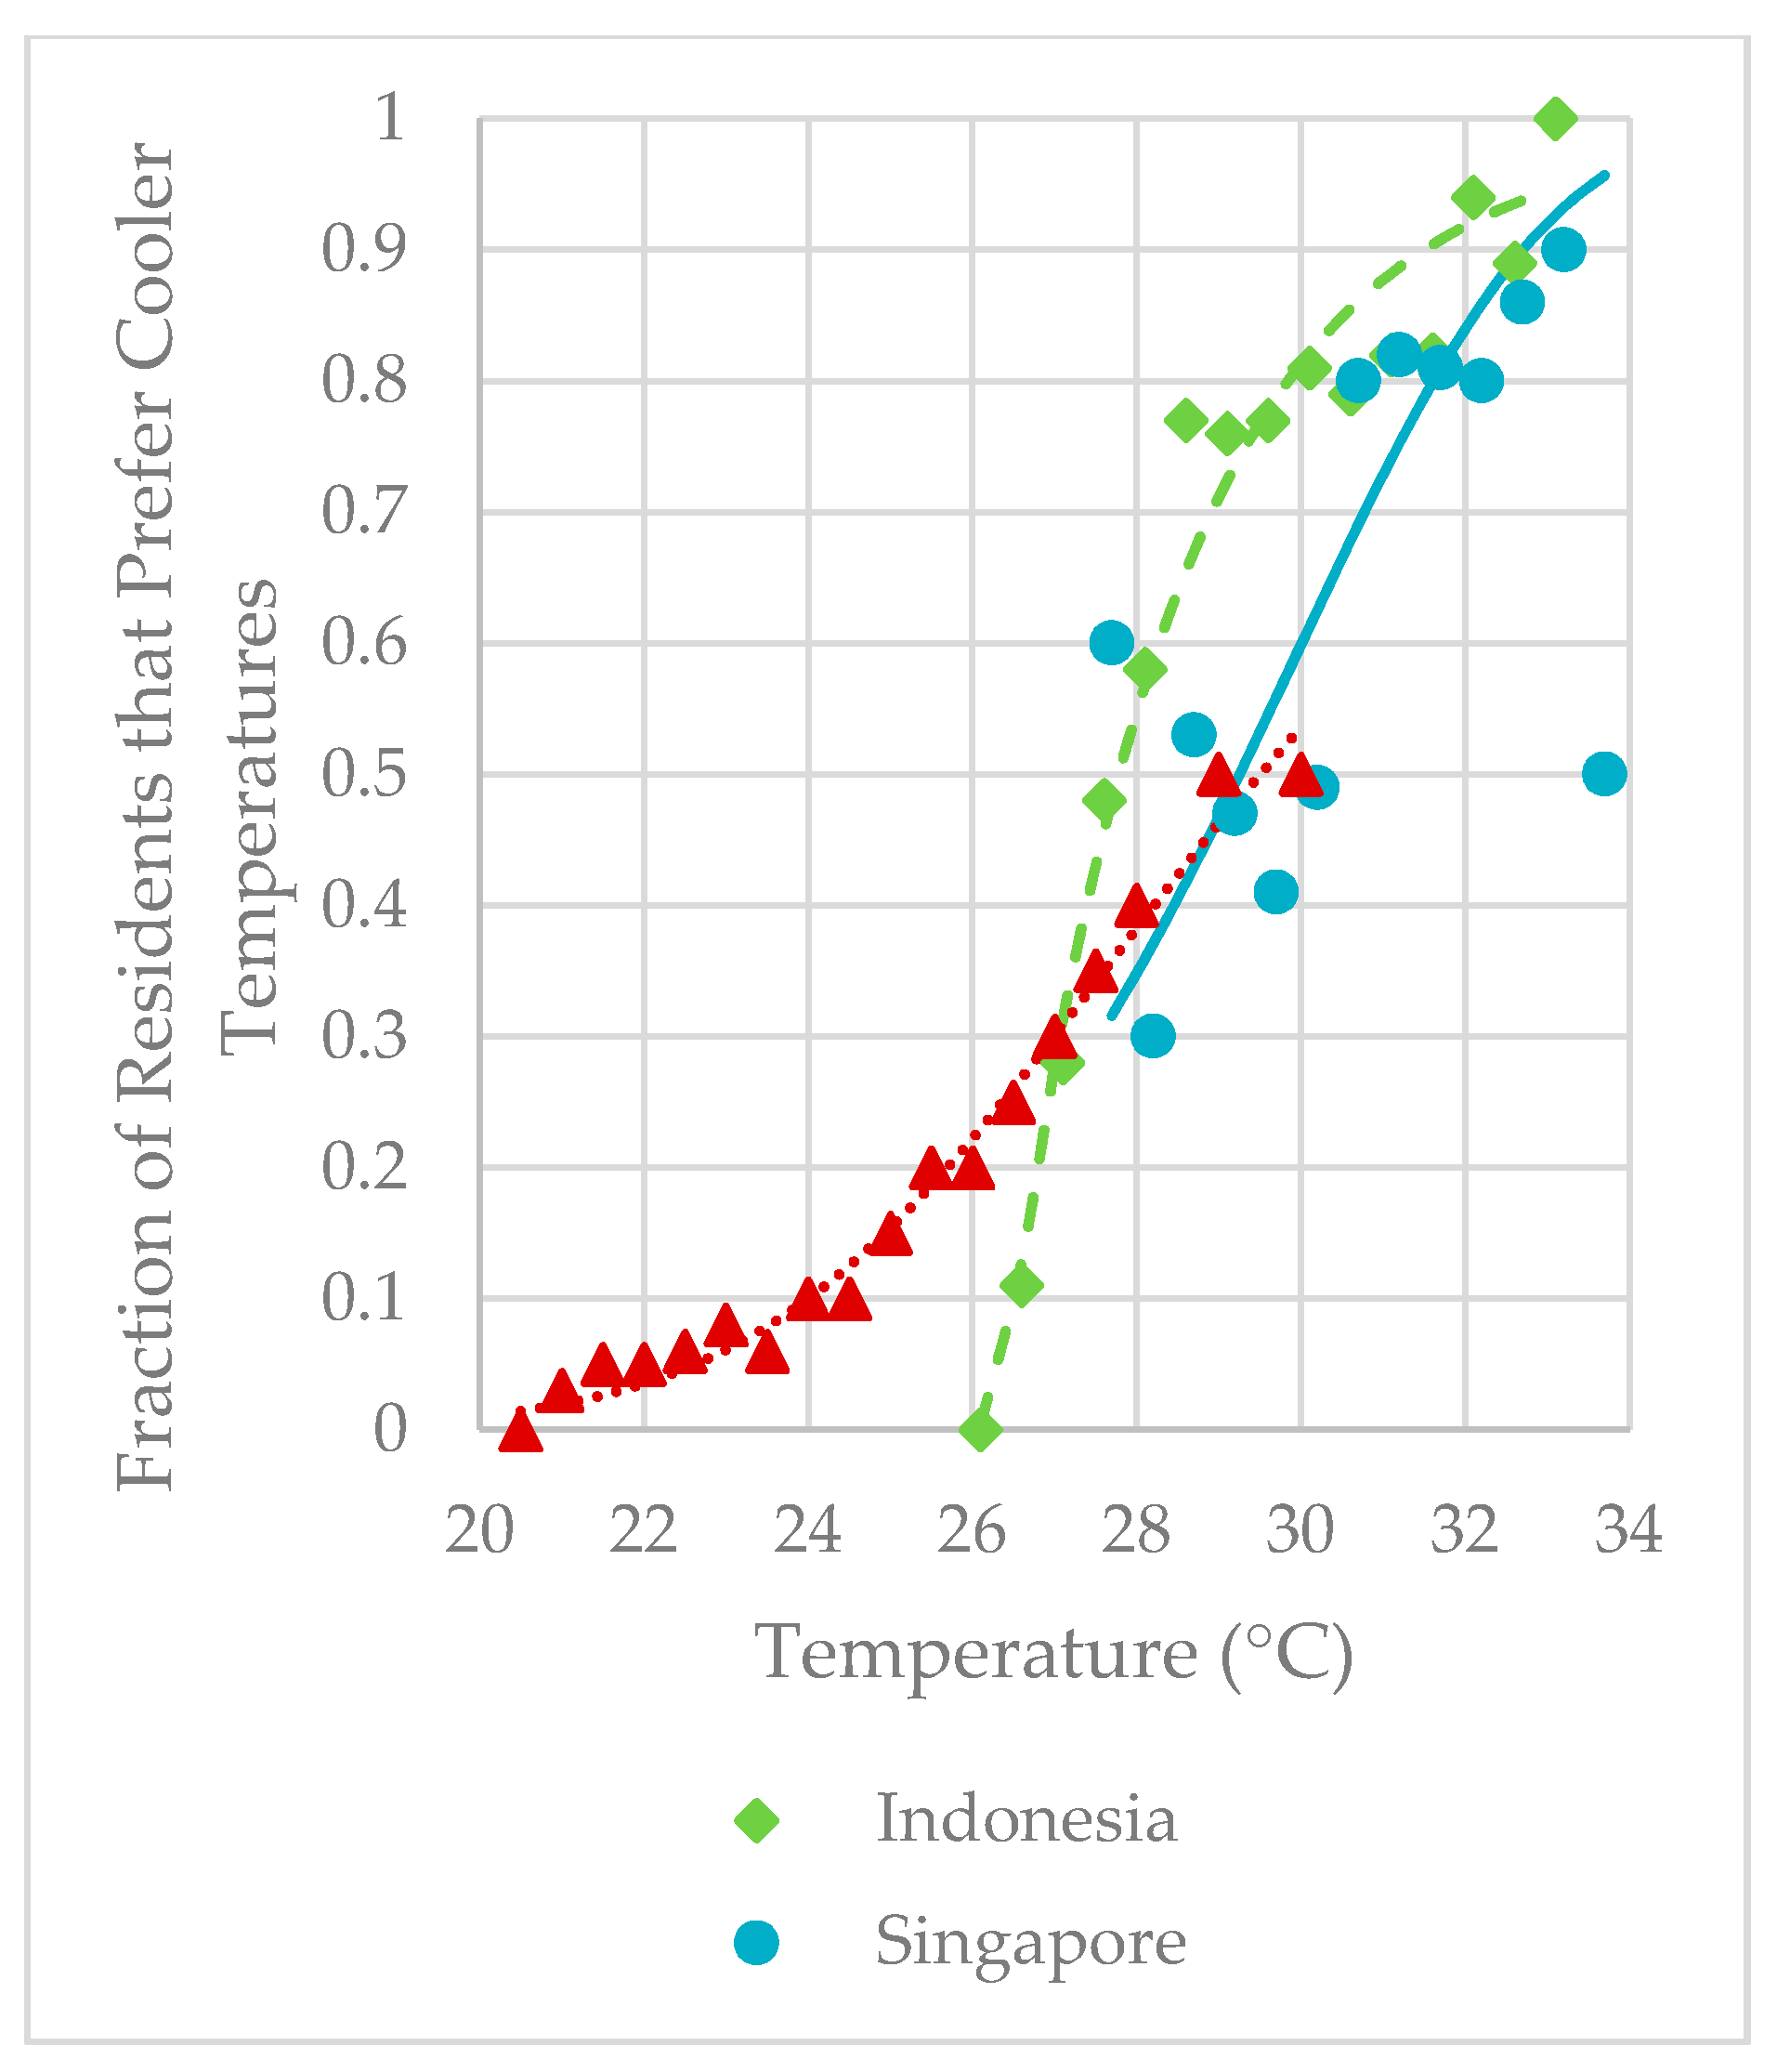
2.4. Factors Driving WTP for AC Ownership in Malaysia

Although both AC and CSB are solutions for indoor thermal comfort, consumer considerations in WTP for these goods are very different. We are not aware of any evidence showing that non-AC thermal comfort is a substantial factor in WTP for residential buildings. There is, however, a strong latent demand for AC in warm climates, with median household income constraining ownership levels [1,2]. As “GDP” and “Median Household Income” grow, societal perceptions of AC in warm climates change quickly, from a luxury good to a necessity and “Willingness to Pay for AC” increases. These relationships are reflected in Figure 5.
Malaysian median household income stood at US$ 16,811 per annum in 2014, having grown at an annualized rate of 8.3% between 2002 and 2014 [60,61,62,63,64,65], slightly below the annualized GDP growth rate of 10.6% (calculated from GDP data [66]) in the same period. This is consistent with observations worldwide that the rate of median household income growth is lower than the rate of GDP growth, though the size of this gap varies widely [67]. Pricewaterhouse Coopers estimates a gradually slowing annual GDP growth rate for Malaysia, decreasing from 7.9% between 2016–2020 to 4.7% between 2041 and 2050 [68]. For the model, the median household income growth rate is assumed to be 0.8 that of GDP (Figure S3). Sensitivity analysis including median household income to GDP growth ratios of 0.7–0.9 and lower GDP growth rates were conducted.
“AC Ownership” in Malaysia was modelled based on past trends. Nationwide AC ownership rates increased from 19.4% in 2002 to 43.3% in 2014 and from 31.2% to 61% in the wealthier urban center of Kuala Lumpur over the same period [60,61,62,63,64,65]. A four-parameter logistic curve was fitted (Appendix A) to median household income and AC ownership for the 13 states and Federal Territory in Malaysia (Figure S4), using data from the Household Income and Basic Amenities surveys [60,61,62,63,64,65] to forecast AC ownership (Figure S5). Increasing ambient temperatures may further increase WTP for AC [1,2] but this effect is not included in the simulations.

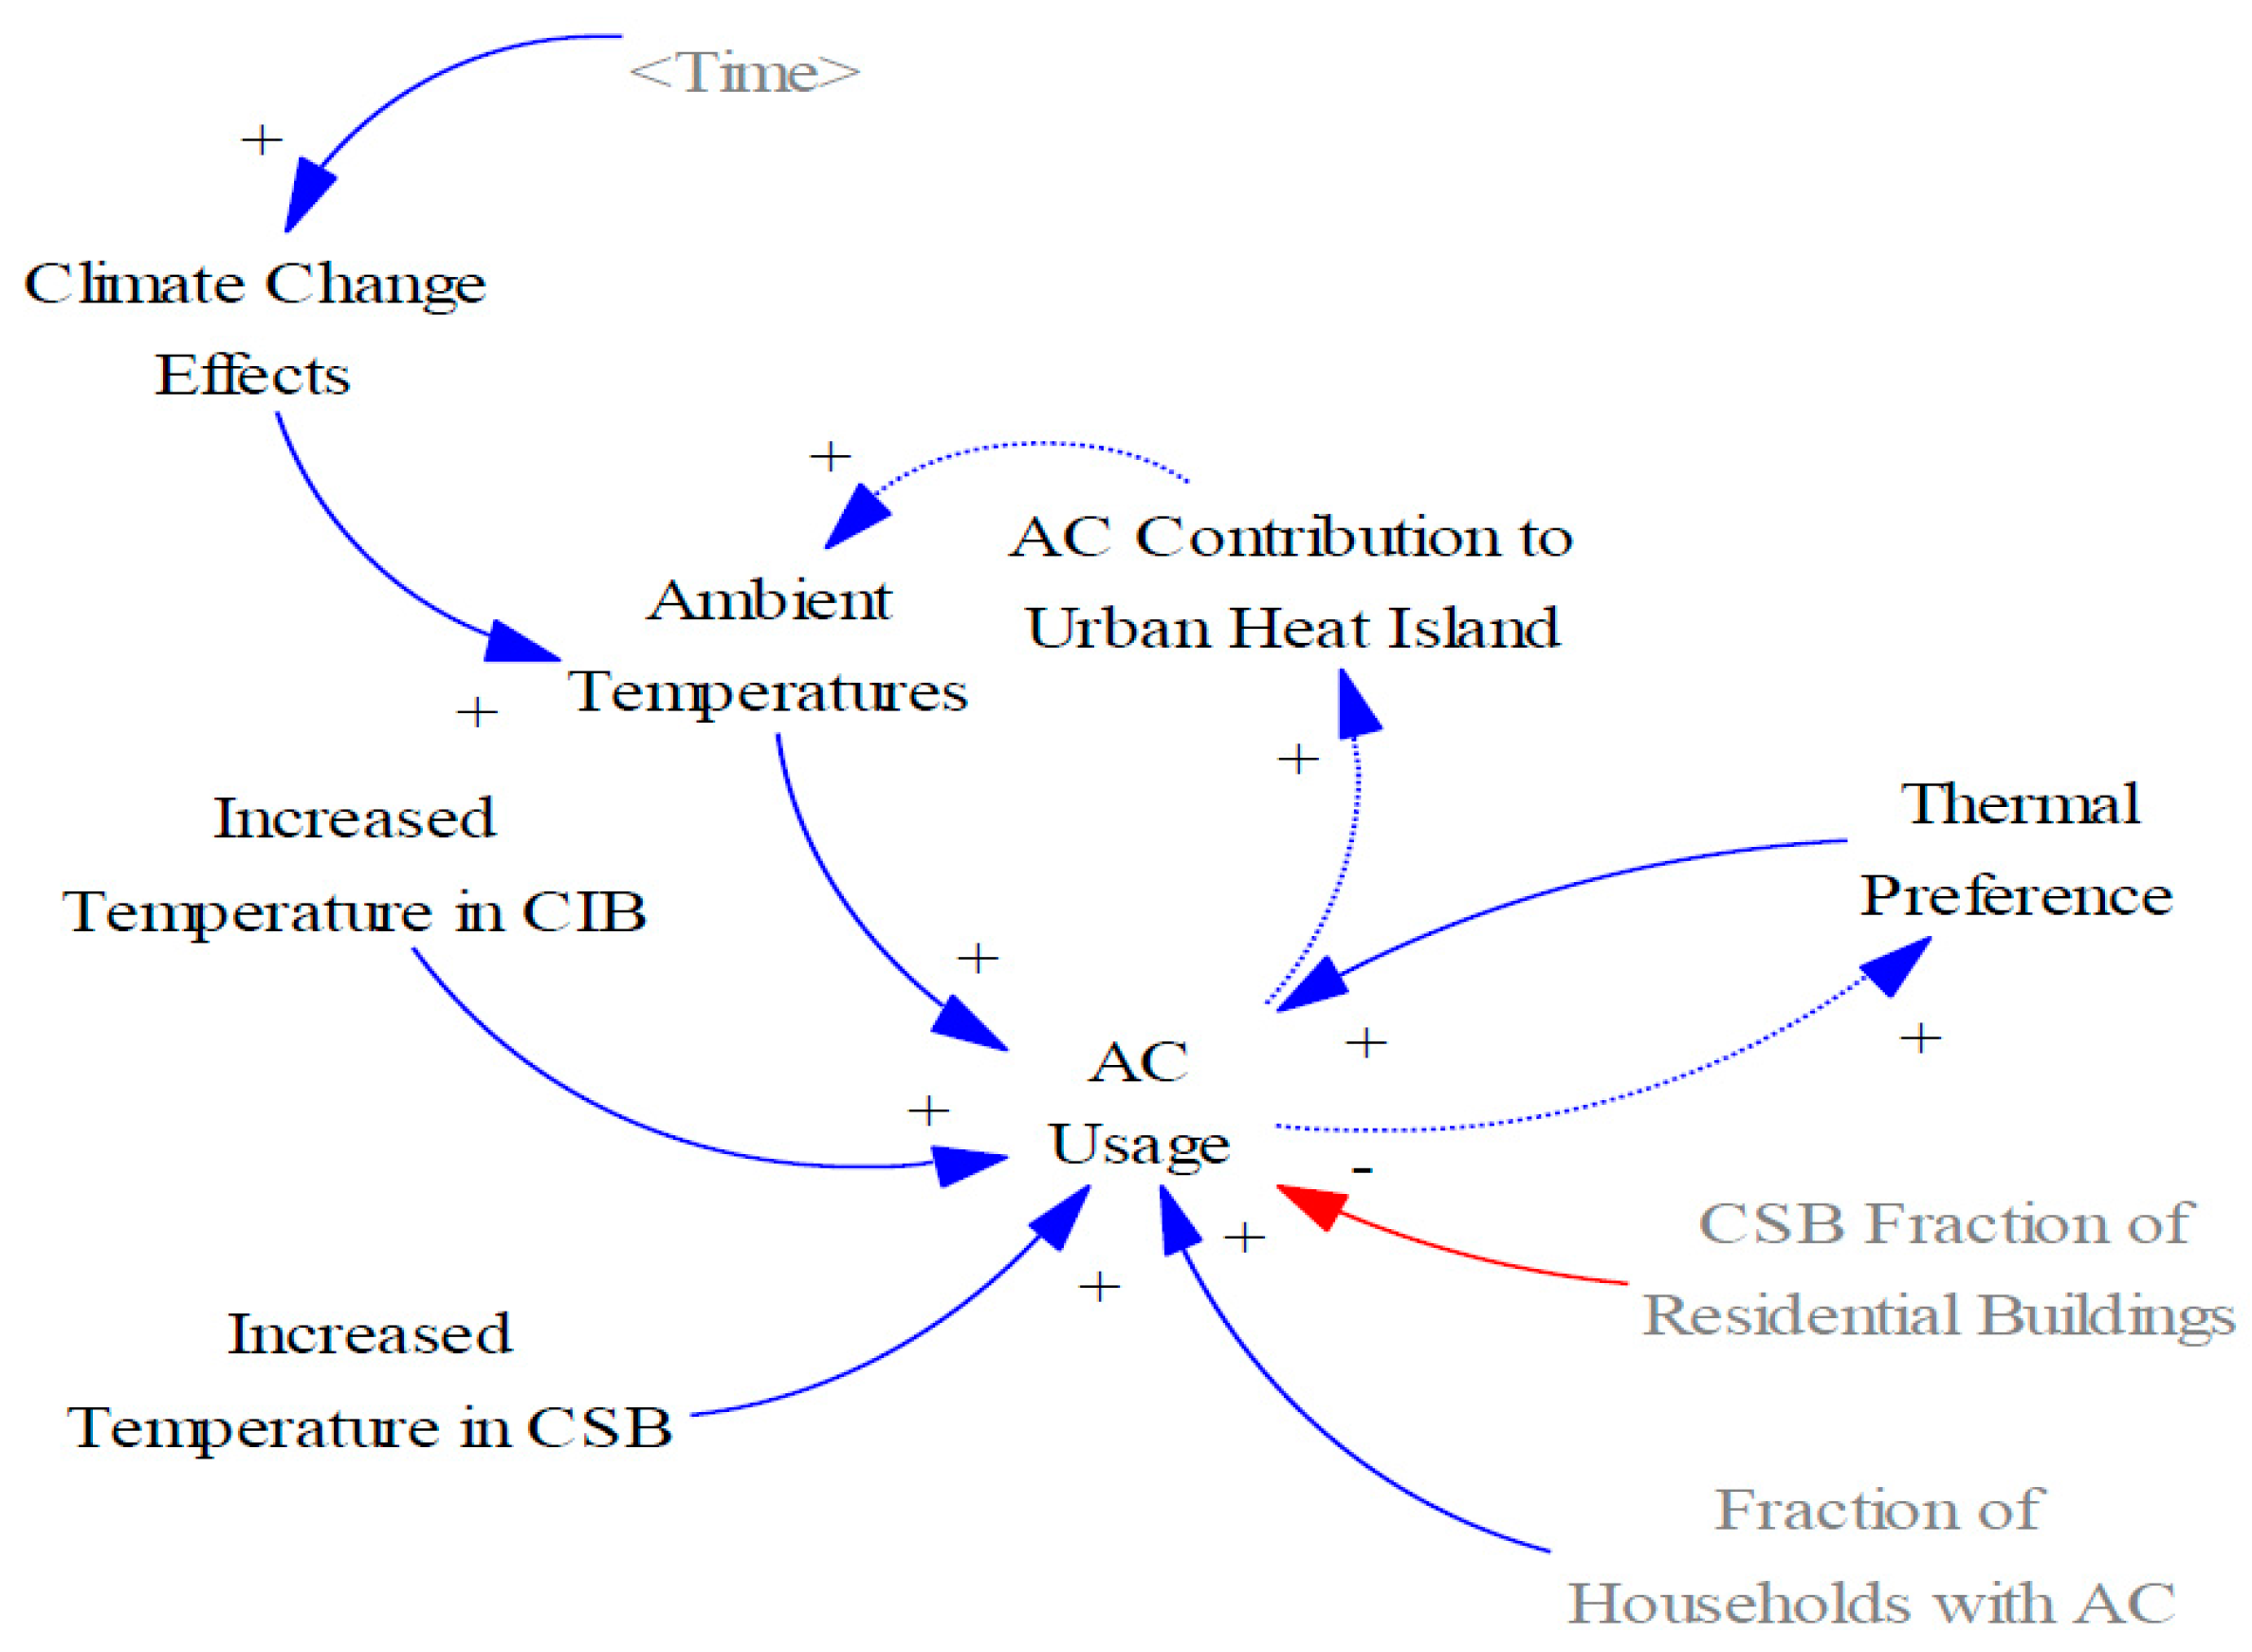
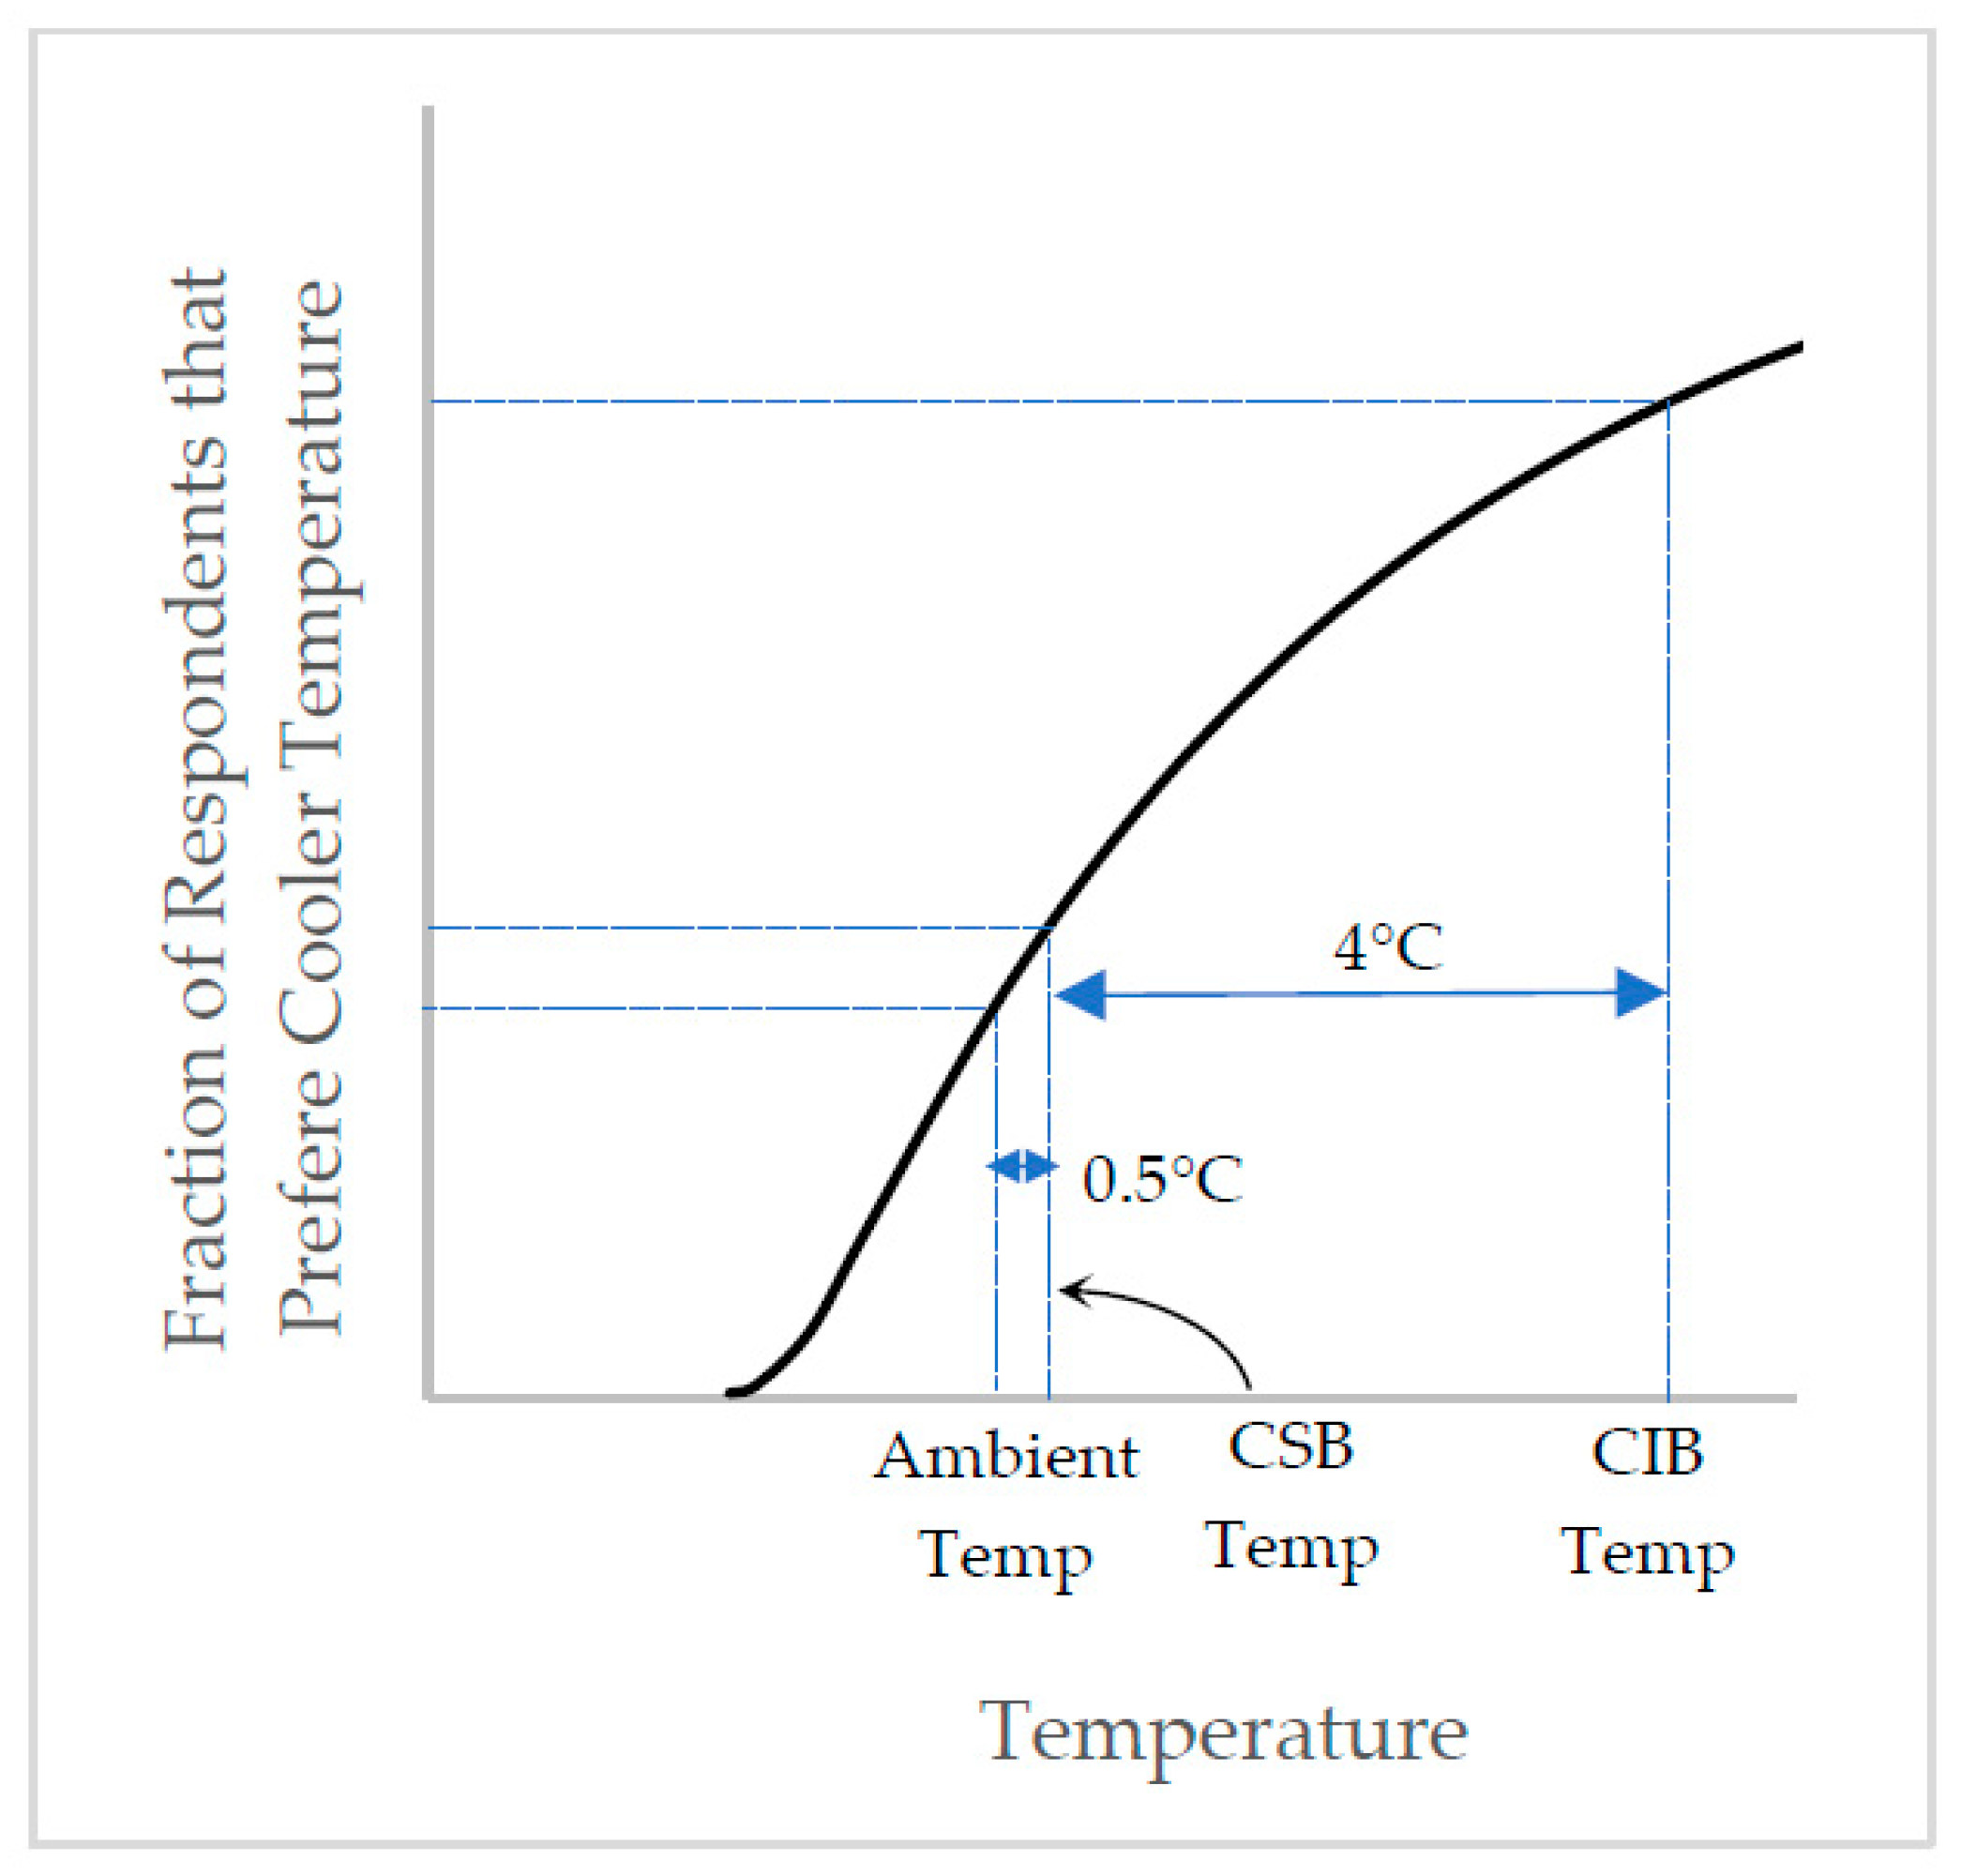
2.5. Factors Driving AC Usage in Malaysia
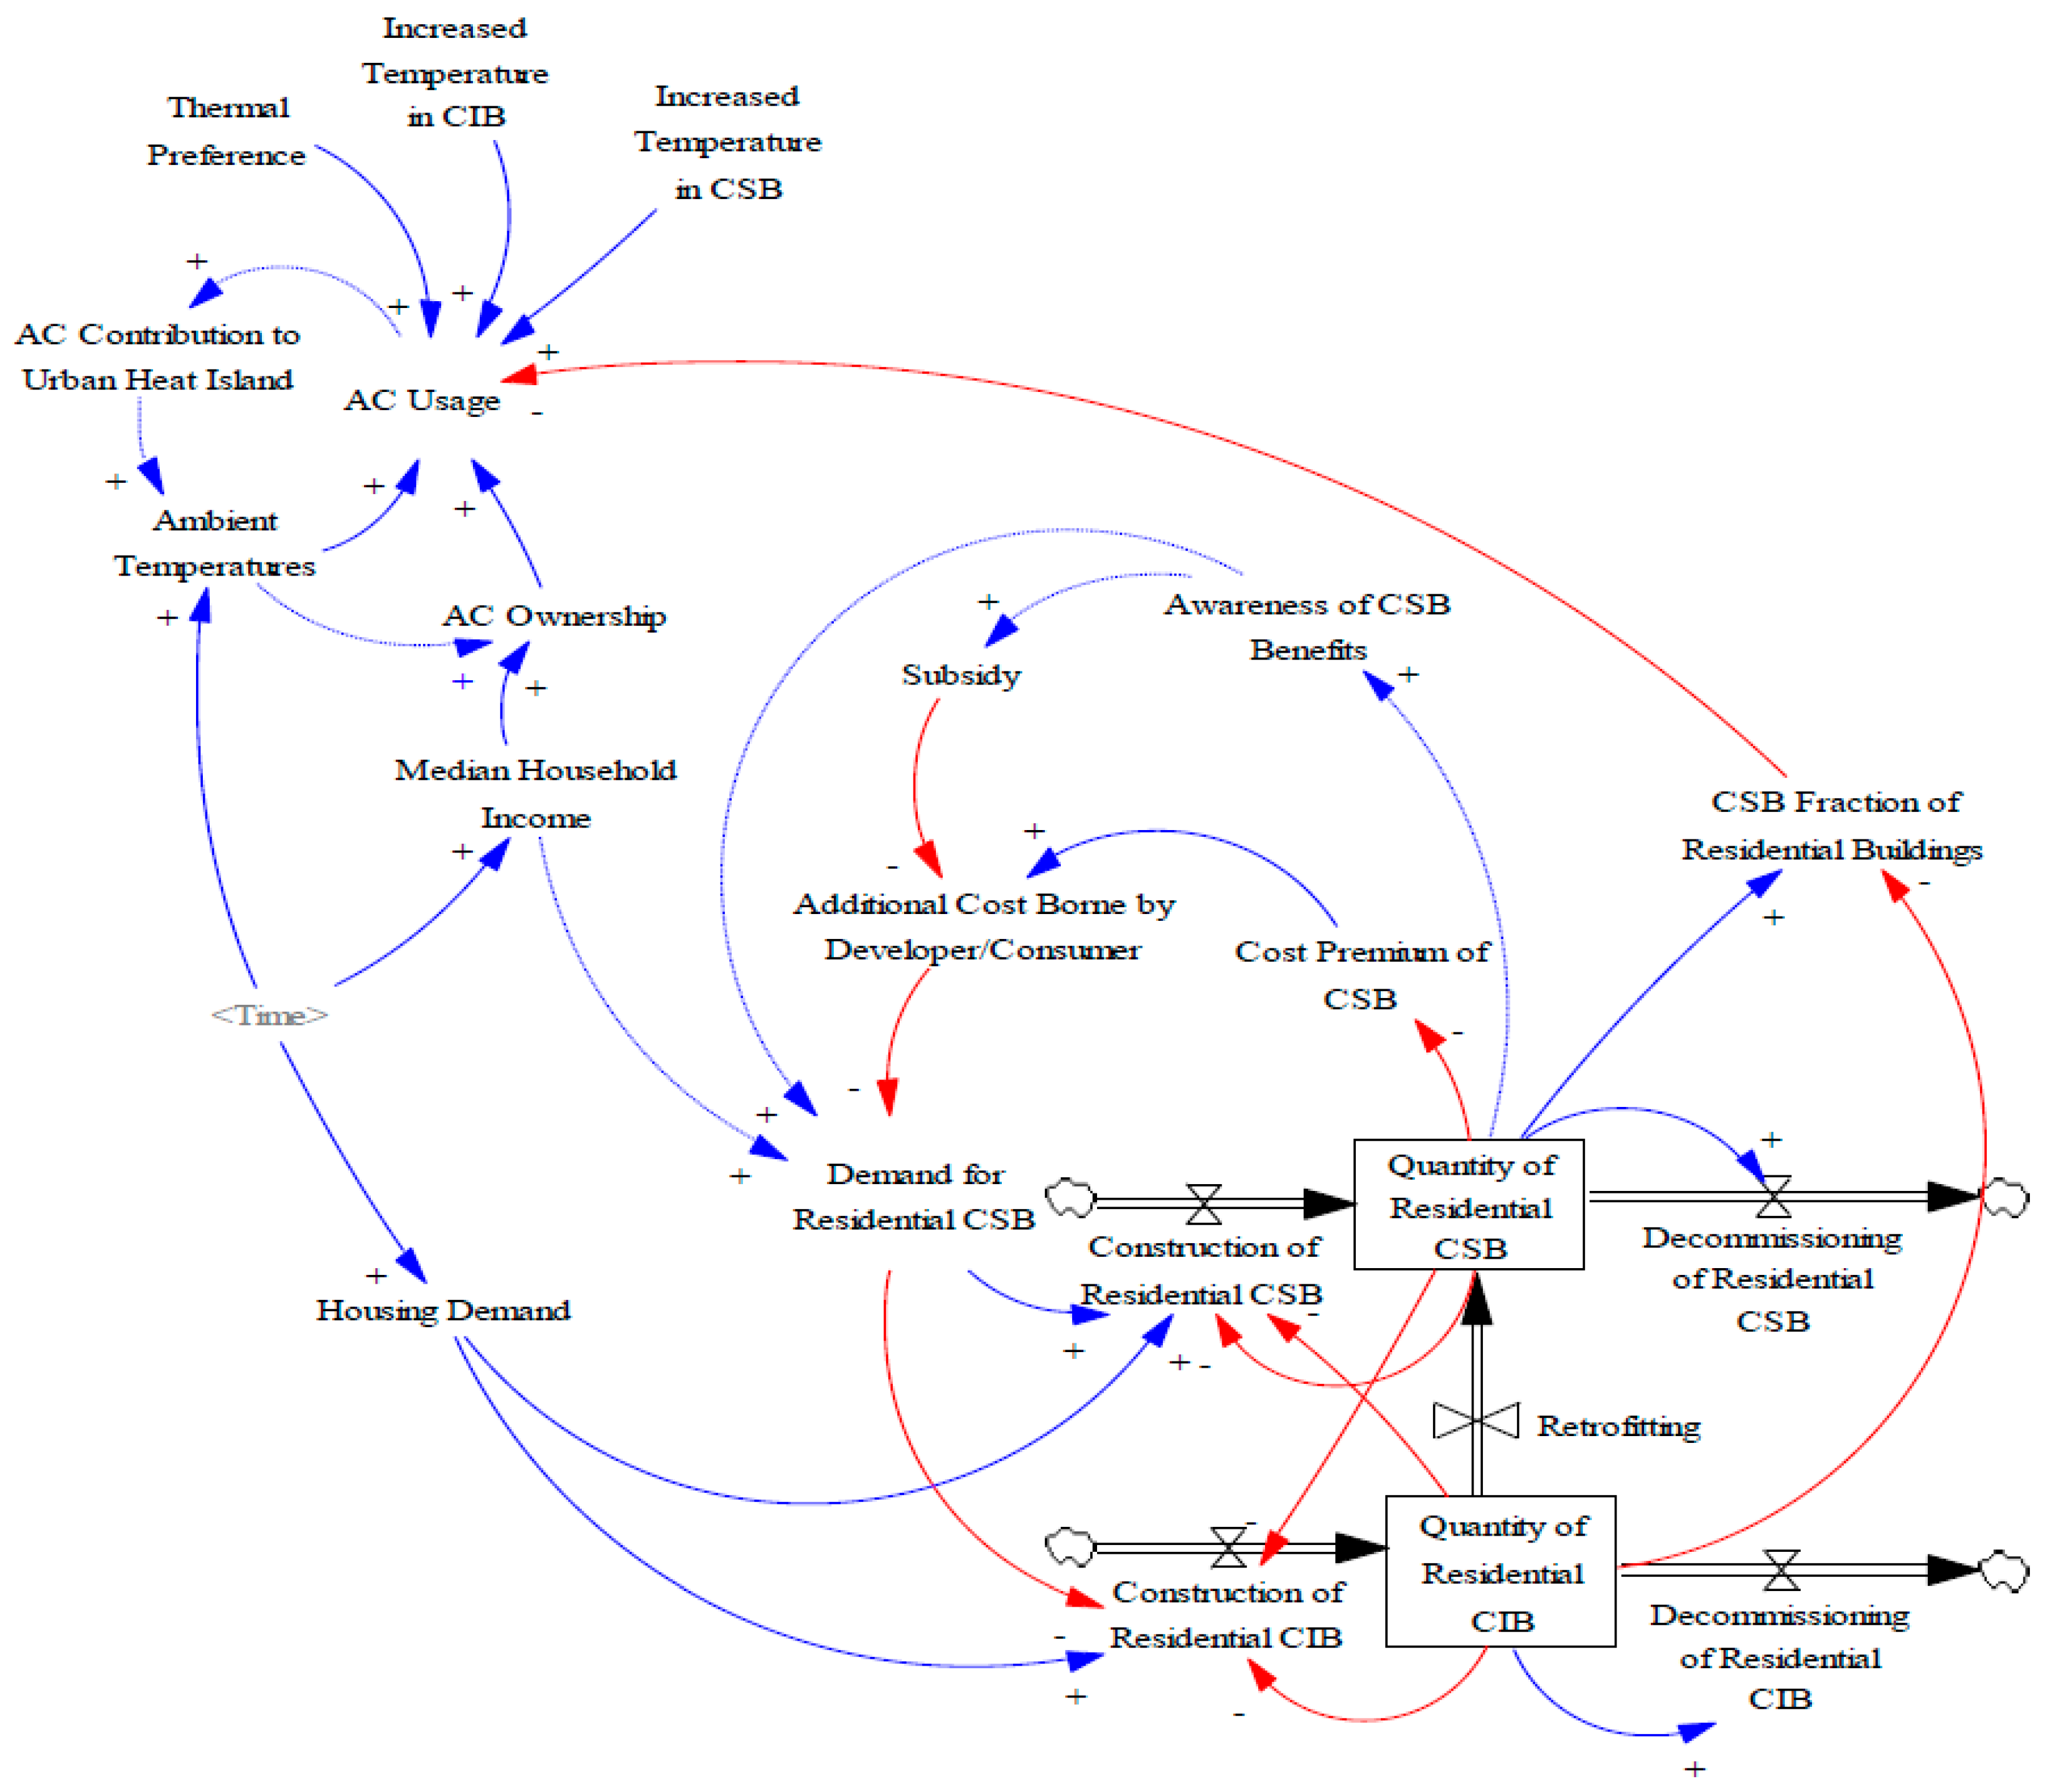
The uptake of CSB and AC are key determinants of future “AC Usage” in Malaysia (Figure 6). “Thermal Preference,” “Climate Change Effects” that increase “Ambient Temperatures,” and elevated indoor temperatures (Increased Temperature in CSB/CIB”) are the other driving factors simulated in the model. The “AC Contribution to the Urban Heat Island” creates a potentially feedback loop but is omitted from the simulation as the time scale of the UHI effect (hours) is not compatible with the time steps used in the simulation (years).
Residential AC usage is primarily for thermal comfort. This is frequently measured via thermal neutrality (the state where respondents report feeling neither cool nor warm). In naturally-ventilated residential buildings in Kota Kinabalu, Malaysia, residents report temperatures of about 30 °C as thermally neutral [69], with little variation during the wet or dry seasons, or at different times during the day (10 a.m. to 7 p.m.) [70]. These values do not explain the high rates of AC usage observed in Malaysia, however. Thermal neutrality and thermal preferences differ [71], with tropical dwellers preferring “cool” rather than “neutral” temperatures. Data from thermal preference studies in Indonesia, Singapore and Southern China [72,73,74] were fitted to five parameter logistic regression models (Appendix A) to construct Figure 7. Air-flow and humidity are important to thermal comfort and preferences but were not recorded in the thermal preference studies used for the model. As these studies took place in naturally ventilated residential buildings and relative humidity in the tropics (Indonesia, Singapore, Malaysia) occur within a tight range, it was assumed that the tropical thermal preference data are applicable without these adjustments.
Night-time indoor temperatures are an important factor for AC usage in Malaysian residences. Indeed, a survey in Johor Bahru shows that AC usage is heavily weighted toward evening/night hours, peaking at 11 p.m. (80% of AC owners using AC), while day-time use is much lower (10% of AC owners using AC), even though 70% of residences are occupied during the day [24]. Most Malaysians do not use window ventilation at night, resulting in indoor temperatures being 4 °C warmer than outdoor ambient temperatures (Increased Temperature in CIB); this gap is reduced to 2.5 °C with window ventilation and to 0.5 °C when effective mechanical ventilation is also employed [25]. It was assumed that CSB design can at least match this performance (Increased Temperature in CSB). This shifts indoor temperatures toward the left of thermal preference curves, reducing the demand for cooler temperatures and AC usage, illustrated in Figure 8.
Reduction in AC usage depends not only on CSB uptake but also on future climate and temperatures. Effective ventilation can enable indoor temperatures to match outdoor temperatures at night when residential AC usage is most prevalent but this alone will not alter AC usage if ambient temperatures already exceed residents’ thermal preferences. Three global climate change scenarios developed by the IPCC were explored: A1FI (assuming rapid economic growth based on fossil fuel-intensive energy sources, yielding a high temperature increase), A1B (assuming rapid economic growth and balanced energy sources, yielding a moderate temperature increase) and B1 (assuming rapid change to less material- and energy-intensive economies, yielding a low temperature increase). These scenarios are translated to the Malaysian context using the National Hydraulic Research Institute of Malaysia (NAHRIM) temperature projections from the CNRM-CM3 model [75].
Night-time AC usage was modelled as a binary variable (use or non-use). AC owners were assumed to use AC if indoor temperatures at 11 p.m. (i.e., peak residential AC usage [24]) were higher than their preferred temperature. Hourly temperature projections for Subang, Malaysia, by [75], were used to estimate ambient temperatures at 11 p.m. through 2065 under the three different climate change scenarios (Figure S6). Temperatures in conventional climate-insensitive buildings (CIB) and CSB were assumed to be 4 °C and 0.5 °C warmer than ambient temperatures, respectively. The Indonesia thermal preference curve was selected as the baseline curve, as it came closest to matching the AC usage rate of 80% observed by Kubota et al. for the night-time outdoor temperatures observed during the study period (25–27 °C) [24], with Singapore preferences used in sensitivity analysis.

2.6. Combined Model

The elements described above were developed into a system dynamics model exploring the potential and limitations of subsidies in accelerating uptake of residential CSB and the consequent night-time AC usage, two factors that are important in health impacts from heat. A conceptual representation of the model is shown in Figure 9, which simplifies and combines the relationships detailed in Figure 3, Figure 4, Figure 5 and Figure 6. The main point of simplification is that factors driving housing demand are collapsed into a single arrow; a few other intermediate variables are also omitted. The cost-premium feedback loop shown in Figure 1 remains the key feedback loop in the modelled system. A list of variables is presented in Table 1, where variables are classified as input variables (utilize exogenous data or scenarios), output variables (calculated from other variables) and conceptual variables (shown in diagram to indicate potentially important linkages but not included in simulations); use of these variables in scenario or sensitivity analysis are noted. Ranges of input variables are not shown in Table 1 as most are not static inputs but have different values over the simulation period. Scenarios and sensitivity analysis are described in Table 2, with results shown in Table S2 and Figures S7–S11.

2.7. Model Assumptions and Limitations

The simple model presented here does not capture a range of other factors that influence CSB uptake. Various simplifying assumptions were used, many of which are captured in some way in the scenarios or sensitivity analysis carried out: (1) That the cost premium, progress ratio and WTP for green buildings are good proxies for CSB, whereas the cost of key features in CSB design and construction may differ from cost of features most widely adopted in green buildings. This assumption was necessary as a starting point due to a lack of CSB data; these three factors are closely examined in scenarios and sensitivity analysis; (2) That subsidies are efficient at reducing the cost premium to homebuyers, whereas some of this funding may in fact be captured by home builders [76]. This would reduce subsidy effects, which would be reflected in the different subsidy cases examined; (3) That the cost premium of CSB and consumer WTP is same across all market segments, whereas demand for green buildings and WTP is positively correlated with income [53,77,78] and the cost premium to achieve CSB standards may be greater for the low-end market segment. We might expect slower uptake than predicted by the model if this assumption is not true and possible step-like delay behavior if different market segments behave substantially differently; it is difficult to estimate the magnitude of this effect; (4) That green/CSB building uptake in the commercial and industrial sectors do not substantially reduce cost premiums in the residential sector. We expect the benefit, if any, to be small, as the majority of green building projects are commercial or industrial and this has not appeared to spur a similar magnitude of green residential uptake; (5) That information asymmetry between home builders and homebuyers is not substantive and that CSB supply would match demand without delay. Depending on the level of information asymmetry, it is possible that home builders never enter the market; however, one function of subsidies is to reduce the perceived risks for home builders; (6) That the WTP curve for CSB remains the same over time. This is explored in limited ways by the different WTP curves; however, it is a critical variable and has large impacts on the system behavior.
Additional simplifications and assumptions were used in simulating AC ownership and use: (1) AC usage was represented as a binary choice (yes/no), so the model does not capture the impact of CSB in reducing thermal loads on AC units. This means that the impact of CSB on AC usage in terms of power demand is likely underestimated; (2) AC usage is measured in nights per housing unit and does not account for the number of people or AC units per housing unit. This may inflate the increase in AC use over time (it accounts for 20–25% of the if expected increase in use between 2015 and 2065) if AC use per capita is not affected by household size; (3) The relationship between AC ownership rates and median income is static, whereas this relationship may change as the climate warms and as AC prices continue to drop. This could cause a small increase in AC ownership (already predicted at 89% in 2065); (4) CSB purchasing decisions do not depend on thermal preferences, while environmental values and income are important drivers for both [53,77]. This simplification becomes more realistic as the fraction of population living in CSB increases; (5) Thermal preferences will not change. Using the steepest point of the thermal preference curve (i.e., the most sensitive point), a 1 °C shift in the Indonesia thermal preferences curve would increase the fraction of households choosing to use AC by from 0.28 to 0.38; (6) Thermal preferences determine whether AC is used for thermal comfort, whereas residents of CSB may encounter other obstacles such as insects, noise and dust, that discourage the use of natural ventilation and are not be easily rectified through CSB design. This would over-predict the impact of CSB on AC usage, though it is not clear to what degree; (7) AC usage is a rational choice governed by thermal preference and indoor temperature, whereas many behavioral patterns related to sleep may be strongly influenced by habit [79,80]. This would over-predict the impact of CSB on AC usage, though it is again not clear to what degree.

3. Results

3.1. Subsidies and WTP

The homebuyer WTP for CSB scenarios shows that WTP for CSB strongly constrains the potential for subsidies to enable and accelerate uptake of residential CSB, altering CSB uptake to a far greater extent than any parameter examined in sensitivity analysis (see SI on Sensitivity Analysis). Three very distinct patterns emerge: (1) high long-term market penetration that occurs whether or not there are subsidies, where subsidies may still accelerate the process and increase uptake on the margins (Figure 10a); (2) subsidies as a necessary condition to create and maintain the CSB market (Figure 10b); and (3) subsidies as an ineffective measure for promoting CSB (Figure 10c). These widely differing patterns result from the position on the WTP curve achievable via the CSB Cost Premium Reinforcing Loop. Subsidies accelerate this loop, with greater effects relative to the baseline observed at lower consumer WTP (Figure S12). However, the reduction of cost premiums may or may not translate into high CSB uptake, depending on homebuyer WTP. Each WTP case is examined in sequence below.
In the High WTP case, the cost premium of CSB drops rapidly and plateaus around 1.3% with or without subsidies. At this point, CSB represents 70% of all new residential construction before subsidy effects are factored in. Nonetheless, subsidies can still play a large role in accelerating CSB uptake: at the 75% subsidy level, CSB represents 60% of all residential buildings in 2038, 20 years ahead of the no-subsidy scenario. Thus, it is possible to use subsidies to accelerate short-term uptake of CSB and reduce or remove those subsidies as target CSB market penetration is achieved. Alternatively, subsidies can be maintained if the target representation for CSB among residential buildings is greater than 70%.
In the Medium WTP case, high levels of subsidies substantially accelerate the drop in CSB cost premiums. However, even at a cost premium of 1.3%, only 8% of consumers are willing to purchase CSB (Figure 2). Nonetheless, WTP sharply increases as the purchase prices drop beyond this point, reflected in highly sensitive and non-linear response of CSB uptake to increased subsidy rates. This means that an ongoing subsidy program is able to sustain the market, if subsidy levels are sufficiently high. Indeed, expanding the statutory income tax-exemption (at the commercial income tax rate of 24%) to include profits from first-sale of CSB has only have a minor effect on CSB uptake.
In the Low WTP case, subsidy effects on CSB uptake are limited, with less than 15% representation by 2065 even at 90% subsidy levels (Figure 10c). Although this is a 20-fold increase over the baseline, subsidies are clearly ineffective at mainstreaming CSB under these conditions. The near-vertical slope of the Low WTP curve as cost premiums approach zero (Figure 2) means that even reduced costs and high subsidy levels together are unable to convince most people to choose CSB.
CSB construction rates under the Medium WTP curve best matched GBI data from 2016–2017, with the High WTP curve and the Low WTP curve yielding results an order of magnitude too high and too low respectively. For this reason, and because of the high sensitivity of CSB uptake to subsidy levels for this case, the Medium WTP curve was chosen for the remaining scenarios and for sensitivity testing.

3.2. Shrinking the Housing Gap

The 2.5 million housing-supply gap is equivalent to half the formal housing stock today and over 15% of the expected housing in 2065. The way in which it is addressed can have persistent effects on CSB representation in Malaysian housing. Indeed, when effective CSB subsidy levels are applied, the manner of housing gap intervention can have synergistic or competing effects. A comparison of the two scenarios in which the housing gap is reduced (Reduced and CIB Int, see Section 2.3 and Table S2 for details) shows that as the level of CSB representation achieved in the Reduced scenario by 2035 at the 75% and 90% subsidy levels are delayed in the CIB Int scenarios by 8 and 11 years respectively (Figure 11).
When the housing gap is successfully addressed, increased construction rates (Figure S13) represent an opportunity to accelerate CSB uptake. If the additional housing units follow the expect CSB/CIB ratio predicted by the WTP curve (Reduced), the CSB fraction of housing stock increases more quickly than the baseline rates (Fixed). However, interventions may rely on increasing the supply of cheaper, conventional housing to overcome the affordability problem thought to be an important driver of the housing gap (CIB Int). This would have the side effect of reducing the CSB share of housing, putting two important policy goals in competition with each other.

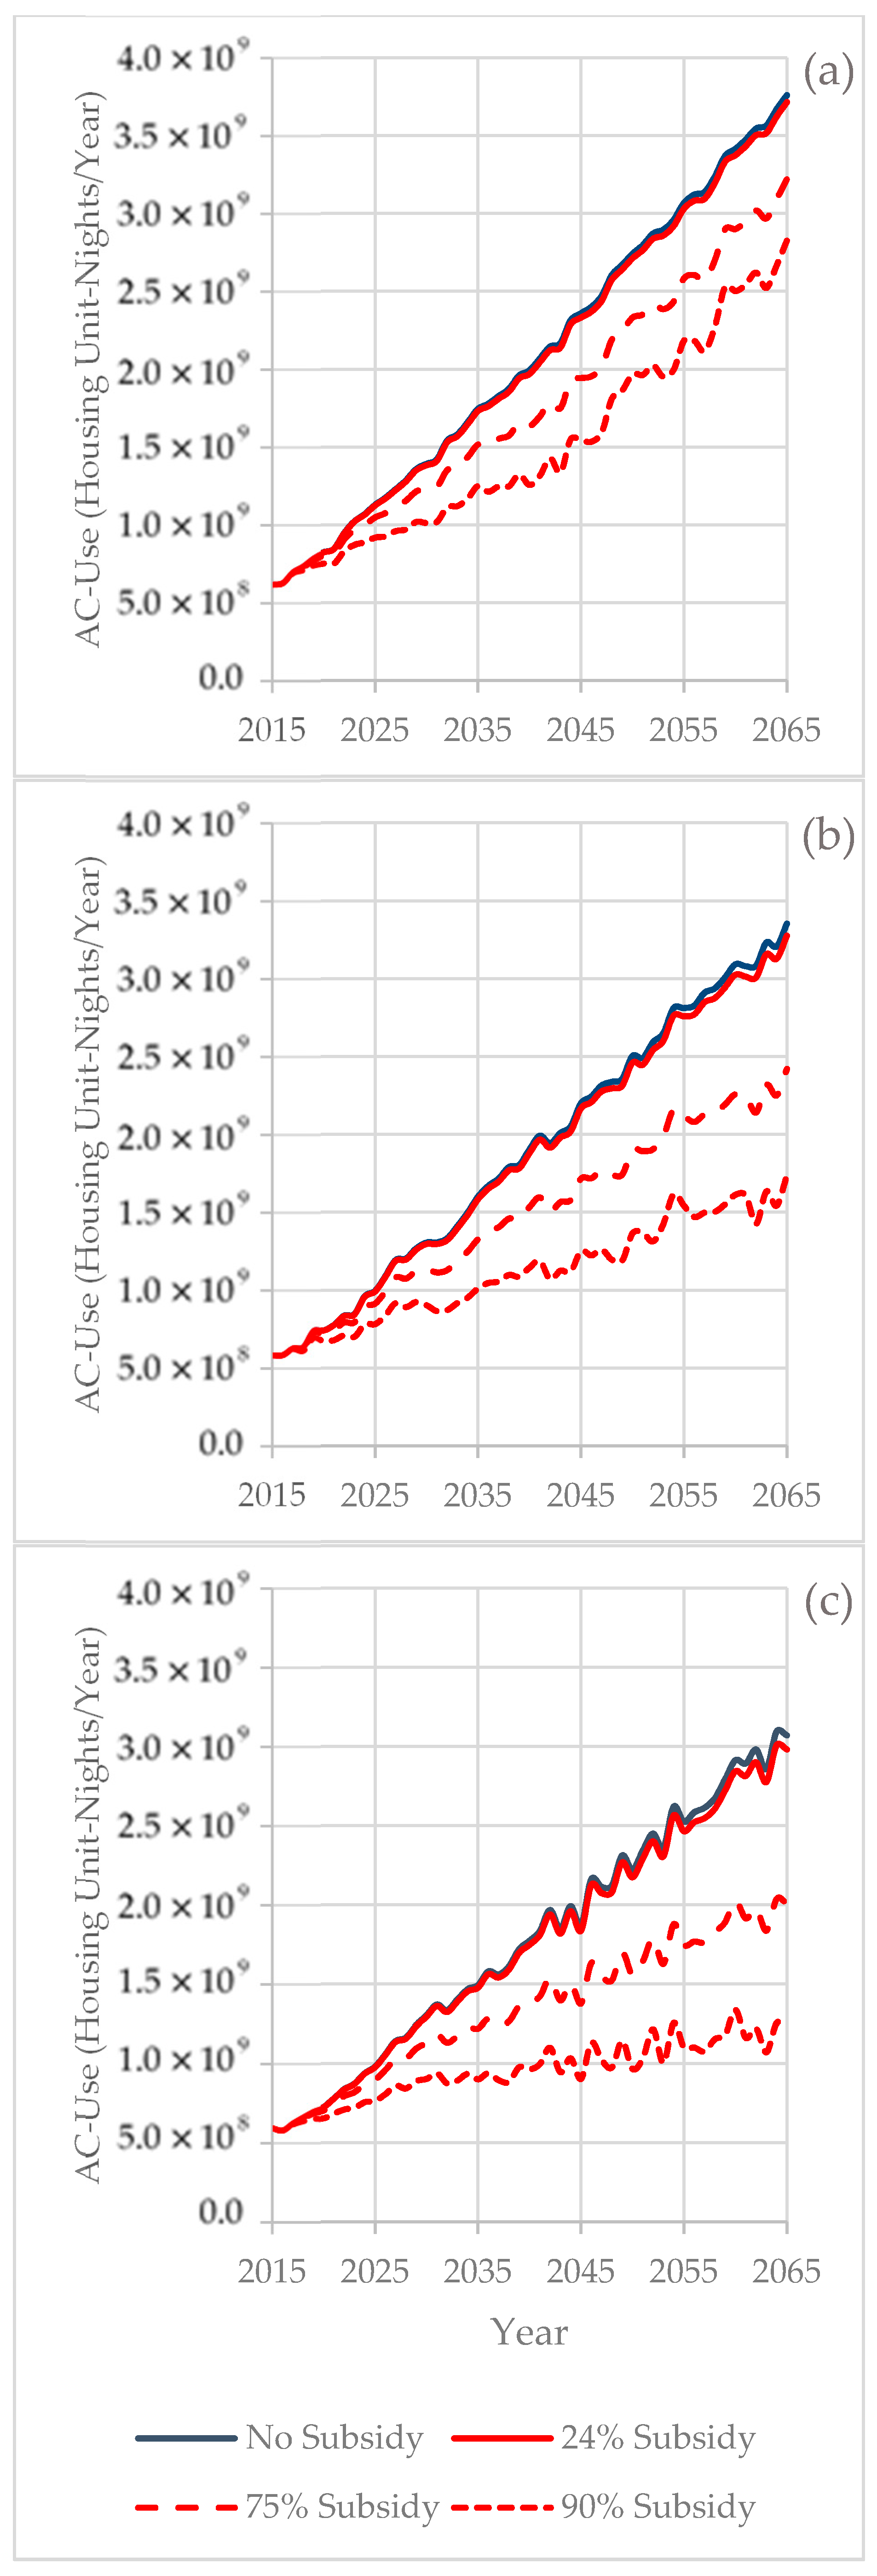
3.3. Climate Change and AC Usage

Large increases in night-time AC usage in Malaysia (five- to six-fold increase) are observed across all climate change scenarios when CSB adoption is low (no subsidy and 24% subsidy conditions, Figure 12). This is unsurprising, given that the expected growth in the number of housing units (from 4.9 million to 13.2 million using the fixed gap assumption) and the expected rise in the fraction of households equipped with AC (0.46 to 0.89, Figure S5) alone predict a five-fold increase in AC use if current AC usage trends remain the same. Increases in ambient temperature from climate change effects are a secondary, though still important, factor.
Adoption of residential CSB can mitigate this increase in household AC use. The representation of CSB in the overall housing stock for this scenario are as in Figure 10b: in 2065, 3.9% under the no subsidy condition, 7.4% under the 24% subsidy condition, 45% under the 75% subsidy condition and 74% under the 90% subsidy condition. The 24% subsidy has negligible effects on AC use. However, increasing residential CSB adoption to 45% or 74% can substantially mitigate AC use if ambient temperature increases are limited, as seen in Table 3. In 2015, median ambient temperature at 11 p.m. was 25.2 °C; by 2065, this increases to 25.7 °C in the B1 scenario, 26.4 °C in the A1B scenario and 28.0 °C in the A1FI scenario (Figure S6). This last increase brings ambient temperatures into a range higher than the thermal preferences of a majority of the population (Figure 7), substantially decreasing the effectiveness of CSB for reducing AC use.

4. Discussion

4.1. Climate Change, Heat Impacts on Health and Residential Buildings

In the changing climate, global temperatures are rising, increasing the frequency and severity of extreme heat events and the risk of associated health impacts [81,82]. Indeed, apart from direct heat-stress morbidities, heatwaves increase health risks associated with obesity, cardiovascular disease, respiratory disease and diabetes mellitus [83,84,85,86,87]. Temperatures in already hot regions approach and may eventually exceed the limits of physiological adaptation [88]. For example, the 0.5 °C rise in mean temperatures in India between 1960 and 2009 resulted in a 146% increase in high mortality events (>100 mortalities) associated with heat [89]. Residential buildings are a strategic context in which to reduce health risks from rising temperatures [90,91]. The young and the elderly, who are especially susceptible to heat stress, spend a high proportion of time at home. Additionally, temperatures experienced at night in the home affect physiological recovery from heat stress accumulated during the day and are thus an important driver for health outcomes during extreme heat events [92,93].
While access to air conditioning (AC) reduces risks of morbidity and mortality during extreme heat events [94,95,96,97], it can also create unanticipated systemic risks [98]. The model results confirm the growing trends in AC ownership and usage observed elsewhere [1,2]. Residential CSB design presents an alternative risk mitigation approach, decreasing exposure to heat by providing a cooler indoor environment and reducing the AC contribution to the UHI, estimated between 0.2–2.6 °C [10,11,12,13,14,15,16]. Model results show that the potential for CSB adoption to reduce AC use and associated UHI effects is limited, especially for large increases in ambient temperatures. In such cases, basic ventilation methods are insufficient to achieve thermal comfort and alternate strategies such as earth-air heat exchangers are required in lieu of AC. Nonetheless, the cooler indoor temperature provided by residential CSB relative to conventional housing remains important, especially for non-AC users.

4.2. Subsidies and WTP

While adoption of green buildings and CSB is desirable, uptake remains limited globally. In 2015, self-reported rates of green building activity in thirteen countries range from 24–41% [99]; however, LEED adoption in the US only covered 8.7% of all new built space in the twenty year period between 1993 and 2013, comprising 2.9% of total built space [28]; likewise, in Switzerland in 2008, only 15% of newly constructed buildings completed the local Minergie certification process [78]. This suggests that the cost premium of green buildings is higher than the 0–2% commonly stated by advocates [46,47], that consumer WTP is very low, or that there is some market failure (e.g., over-estimation of risk) and is consistent with the frequent call for financial incentives. However, a cross-sectional analysis in the US found that, apart from mandatory requirements, policies including financial incentives have had no discernable effect on market penetration [100]. Achieving efficient subsidies is difficult, as some elements of green buildings may require higher levels of subsidies to be financially viable, while others may need no subsidy at all for uptake; this is further complicated by variations in WTP by consumer socio-economic characteristics [101]. Subsidy levels that are too low to be effective [78] may result from failing to consider WTP. High quality information about developer costs and WTP are also necessary to avoid funding capture by developers [76].
The scenarios explored illustrate a difficulty in implementing subsidies. In the medium WTP case, very high incentives are needed to mainstream CSB. Even if resources are available to implement the necessary subsidies, there are plausible WTP levels (i.e., the low WTP case) that may make subsidies even as high as 90% ineffective at mainstreaming CSB. Hypothetically, increasing the subsidy rate to near 100% in the low WTP scenario would yield dramatic increases in CSB uptake; in practice, a robust system for quantifying all soft costs and heightened developer risks involved in CSB construction necessary to achieve that level of subsidy would be difficult to design and implement. Whereas mainstreaming CSB is desirable, subsidies that are too low will fail to substantially reduce the UHI impact of AC or make CSB broadly available but will accrue benefits to early-adopters—who tend to be socio-economically advantaged.
Under these conditions, alternate strategies such as mandatory requirements [100] or efforts to change WTP are necessary, instead of or in combination with subsidies, to increase CSB representation. There is no push for mandatory requirements in the Malaysian context, with the GBI advocating for a voluntary approach toward adoption of higher building standards, as mandatory measures could be unwelcome and thus counter-productive. Influencing homebuyer WTP may be a more promising avenue. Indeed, the radically different responses to subsidies seen in the three cases, demonstrate that homebuyer WTP for CSB could be a highly effective leverage point if it can be understood and effectively influenced.
Factors motivating choice of green residences include prestige, anticipated energy savings, indoor air quality, non-toxicity of building materials and environmental values [77,102,103,104]. The weight given to these factors varies by socioeconomic status. Indeed, Yau found that household income was correlated with both environmental attitudes and willingness to pay for green homes [53]. Spatial correlations in green building diffusion [105,106] indicate that exposure to and awareness of green buildings and their benefits may also be an important driver, potentially increasing WTP and support for subsidies. In contrast, thermal comfort—if it is considered at all—is just one of many competing considerations in home purchases.
While attitudes toward and WTP for green buildings (and presumably CSB) appear to be strongly related to income levels [53], there are other possible avenues for influence. Malaysian residential electricity tariffs, are heavily subsidized and lower than other countries in the region [107]; removing subsidies may increase WTP for CSB while encouraging more sustainable electricity usage. Another barrier to WTP is that public knowledge of green buildings and certification programs tends to be vague and abstract, whereas reliable information about and tangible experience of green buildings are effective at changing perceptions and increasing WTP [54]. This is consistent with spatial correlations in green building diffusion [105,106] and the observation that homebuyers are generally unequipped to calculate trade-offs between future cost savings and increased borrowing [108]. An increasing prevalence of residential CSB and consequent awareness of benefits could increase homebuyer demand as well as support for subsidies and other policies for residential CSB (Figure 3) but this poses a chicken-and-egg problem. Creative strategies that take into account spatial dispersion of residential CSB projects and public access to CSB buildings may be part of a solution.

4.3. Affordable Housing and CSB in the Malaysian Context

The competing needs of delivering affordable housing and increasing the uptake of CSB is an important issue in Malaysia and many other developing countries. There are, however, ways to synergistically address both challenges.
One proposed strategy for addressing the housing gap in Malaysia is a shift from traditional on-site building methods to industrialized building systems (IBS) to reduce construction duration and costs [58]. Such a transition would represent a major change in design and practices for the construction industry. This could be an opportunity to accelerate adoption of CSB designs and other sustainability measures as a norm [109], creating a leverage point for achieving cooler, healthier housing stocks. Conversely, maintaining conventional residential designs under IBS would further entrench CIB due to the heightened difficulty of changing design and practices in mass production.
Procurement policies by federal, state and municipal governments can not only directly increase demand for particular goods and services but can also be designed to encourage private sector participation [110]. Indeed, there is evidence that government procurement overcomes coordination failure in green building markets, when initial investment in green building capabilities seems risky without evidence of demand [111]. There are a substantial number of housing programs in Malaysia, with RM 2.96 billion allocated for affordable housing in the 2016 National Budget [112]. Government support and/or mandates for CSB in social housing and affordable housing projects could increase CSB uptake, signal a long-term demand for CSB, mitigate against heat-related health risks from climate change and address social and health-risk inequities.

4.4. AC Use, Behavioral Feedback Loops and CSB Design

AC ownership and use are rapidly increasing in the Malaysian context and other developing countries in warm climates. Model findings strongly suggest that CSB can only mitigate, not prevent, the rise in AC use. This increase in AC ownership and use can create self-reinforcing effects (Figure 6). These include UHI effects discussed above (Section 4.1) and increasing prevalence of building designs that are “free” from climate constraints—but which force residents to depend on AC [26,27].
Another important feedback loop shown in Figure 6 comes from changing thermal preferences—that becoming accustomed to AC results in shifts in behavior and expectations that encourages further AC use. Peak AC use patterns in Malaysia strongly suggests that it is linked to sleep. Proliferation of AC is likely changing sleep behaviors in ways that increase dependency on AC: the use of comforters, previously unknown in Malaysia, has become commonplace, even though it shifts thermal-neutral temperatures by 2.3 °C compared to single-ply blankets [113]. When AC is used in Malaysian residences, the average temperature set-point is 20.8 °C, with 15% of users choosing temperatures of 16–17 °C [24]. These temperatures are well below the usual temperature range in the tropics and the probable thermal discomfort threshold that prompts the use of AC in the first place. Acclimation to these temperatures, achievable only through AC, reinforces AC usage.
Considering these behavioral challenges, CSB design must not only address technical issues that enable effective ventilation but must also account for resident perceptions and behavior to effectively reduce AC use. Green building rating systems generally use easily quantifiable metrics, including energy efficiency of appliances, minimization of solar heat gain, etc. While important, these do not address resident concerns that prevent use of natural ventilation as a cooling strategy. With only 10% of residents utilizing window ventilation at night due to insects, security, rain and dust [24], installation of window mesh screens may be as important to good CSB design as room layout for airflow. CSB design should also encourage and reinforce desired behavior: design that improves the ease of opening windows/doors, draws attention to these fixtures and rewards use with aesthetically pleasing scenery.

5. Conclusions

Increasing residential CSB and reducing AC dependence are important for cultivating sustainable cities and reducing systemic health risks associated with heat. With rapid urbanization providing an opportunity to reshape housing stocks and climate change increasing health risks from heat, finding ways to promote CSB in developing countries in warm climates is an important and urgent task. We present here a model designed to support exploration of the potential and limitations of CSB subsidies to affect future housing standards and night-time AC usage in Malaysia. While the modelling work here is based on the Malaysian context, key trends in the model inputs are relevant for many other contexts, especially developing countries in the tropical and subtropical regions. Simulation results suggest that WTP is a key leverage point. For plausible WTP curves, subsidies may be highly effective at accelerating CSB uptake, necessary to establish and maintain a thriving CSB market, or unable to mainstream CSB without other supporting policies. It is thus important to assess WTP for CSB and influencing factors in order to formulate effective policies for increasing uptake of CSB.

Supplementary Materials

The following are available online at www.mdpi.com/2071-1050/9/12/2300/s1. Figure S1: Vensim working model for evaluating subsidy effects on climate-sensitive uptake and night-time air-conditioning use. Table S1: Model variables, equations and parameters, Section on AC Ownership. Figure S2: Malaysia projected population. Figure S3: Projected Malaysian median annual household income. Figure S4: Median household income and AC ownership for the 13 states and Federal Territory in Malaysia, 2002–2014. Figure S5: Projected fraction of housing units with AC in Malaysia. Figure S6: Outdoor temperature distributions at 11 pm under various climate change scenarios: (a) A1B, (b) A1FI, (c) B1., Section on Sensitivity Analysis. Table S2: Summary of sensitivity analysis findings. Figure S7: Sensitivity analysis—subsidy effects on CSB fraction of Malaysian residential stock under various progress ratio values: (a) baseline (0.8), (b) 0.75, (c) 0.9. Figure S8: Sensitivity analysis—subsidy effects on CSB fraction of Malaysian residential stock under various initial cost premium values: (a) baseline (5%), (b) 2%, (c) 10%. Figure S9: Sensitivity analysis—subsidy effects on CSB fraction of Malaysian residential stock under various building lifespans: (a) baseline (50 years), (b) 100 years. Figure S10: Sensitivity analysis—subsidy effects on Malaysian residential night-time AC usage under various median income scenarios: (a) baseline (income growth at 80% of GDP), (b) income growth at 90% of GDP, (c) income growth at 70% of GDP, (d) low GDP growth (income growth at 80% of GDP, GDP growth rate at 50% of Pricewater House Coopers projected growth between 2020 and 2050 with subsequent growth rate of 1%). Figure S11: Sensitivity analysis - subsidy effects on Malaysian residential night-time AC usage under various thermal preference curves: (a) baseline (Indonesia thermal preference curve), (b) Singapore thermal preference curve. Figure S12: Subsidy effects on cost premium of climate-sensitive buildings for different willingness to pay preferences: (a) High, (b) Medium, (c) Low. Figure S13: Subsidy effects on Malaysian climate-sensitive building construction (CSB) rates under baseline (Fixed) and shrinking housing gap (Reduced) scenarios. Note that CSB construction rates under the climate-insensitive building intervention (CIB Int) match the Fixed scenario.

Acknowledgments

This work is funded by a Newton-Ungku Omar Institutional Links Grant (Ref:216400607), inclusive of open access publishing costs. We also thank Ir. Chen Thiam Leong from the Green Building Index, for providing insights into the state of the green building industry in Malaysia. Barry Newell provided useful comments on several drafts of the paper.

Author Contributions

David T. Tan conceived, developed and ran the model and wrote the paper. José Gabriel Siri provided extensive feedback on model development, testing and presentation. Yi Gong provided guidance on parameters for sensitivity analysis. All authors contributed to the results discussion and approved the manuscript.

Conflicts of Interest

The authors declare no conflict of interest. The funding sponsors had no role in the design of the study; in the collection, analyses, or interpretation of data; in the writing of the manuscript and in the decision to publish the results.

Appendix A. Logistic Curves—WTP for CSB, Thermal Preference and AC Ownership

Economic demand curves are typically non-linear as price elasticity (the change in demand in response to change in price) varies along the curve. The logistic “S” curve describes a scenario in which demand is inelastic at very high and very low prices but highly elastic at some region in between. The logistic curve is also useful for describing thermal preferences, which can also be thought of as a demand curve for cooling.
Four- and five-parameter logistic curves are used to describe WTP,
p 1 ( p 2 p 1 ) ( 1 + x p 3 ) p 4 ,
p 1 ( p 2 p 1 ) ( ( 1 + x p 3 ) p 4 ) p 5 ,
where both equations share four parameters: maximum value (p1), minimum value (p2), centroid (p3) and steepness at the centroid (p4). Asymmetry (p5) is the additional parameter in the five-parameter curve. Parameter fitting was carried out using the Excel 2016 solver function, with p1 and p2 set to 1 and 0 respectively when appropriate.
For WTP for residential CSB, we assume that as the CSB cost premium approaches zero all homebuyers would prefer CSB over conventional housing, whereas as the CSB cost premium reaches high values, the fraction of homebuyers willing to pay the cost asymptotes toward zero. Maximum and minimum values were set at 1 and 0 respectively in constructing the WTP curves, with the remaining parameters fitted to data or reported statistics from the Dodge [48] and Yau [53] studies.
For the Dodge report, the five-parameter equation provided a visibly better fit to the data (R2 of 0.9987 vs. 0.9947) and was used for the model. In the Yau paper, individual data-points were not given; mean WTP, standard deviation and the fraction of population unwilling to pay any cross premium were reported instead. Together with minimum and maximum values, this results in five-parameters, over-constraining the four-parameter logistic equation. Additionally, the logistic equation is unable to model the vertical asymptote (88% unwilling to pay any cost premium but assumed demand of 100% when the cost premium is set to zero). A four-parameter curve was constructed by ignoring the fraction of population unwilling to pay any cross premium, using only the reported mean WTP and standard deviation values, representing medium WTP. A five-parameter logistic curve was also constructed, assuming the 88% unwilling-to-pay population would, in reality, be willing to pay some very small cost premium (set here at 0.2%).
Logistic curves were also used to describe thermal preference and the relationship between median household income and AC ownership rates. Minimum demand was assumed to be zero (p2 = 0), i.e., below some temperature there would be no demand for cooling and at some median household income, there would be no demand for AC ownership. No assumptions were made regarding maximum demand. Five-parameter curves were fitted to thermal preference data due to the clear asymmetry of the curves. For median household income and AC ownership, the four- and five-parameter curves were indistinguishable within the interpolated range with minor differences appearing when the curves were extrapolated far beyond existing income levels. The four-parameter model was selected for simplicity.

References

  1. Davis, L.W.; Gertler, P.J. Contribution of air conditioning adoption to future energy use under global warming. Proc. Natl. Acad. Sci. USA 2015, 112, 5962–5967. [Google Scholar] [CrossRef] [PubMed]
  2. Sailor, D.J.; Pavlova, A.A. Air conditioning market saturation and long-term response of residential cooling energy demand to climate change. Energy 2003, 28, 941–951. [Google Scholar] [CrossRef]
  3. Isaac, M.; van Vuuren, D.P. Modeling global residential sector energy demand for heating and air conditioning in the context of climate change. Energy Policy 2009, 37, 507–521. [Google Scholar] [CrossRef]
  4. Auffhammer, M.; Baylis, P.; Hausman, C.H. Climate change is projected to have severe impacts on the frequency and intensity of peak electricity demand across the United States. Proc. Natl. Acad. Sci. USA 2017, 114, 1886–1891. [Google Scholar] [CrossRef] [PubMed]
  5. Santagata, D.M.; Castesana, P.; Rossler, C.E.; Comez, D.R. Extreme temperature events affecting the electricity distribution system of the metropolitan area of Buenos Aires (1971–2013). Energy Policy 2017, 106, 404–414. [Google Scholar] [CrossRef]
  6. Australian Productivity Commission. Electricity Network Regulatory Frameworks; Report No. 62; Australian Productivity Commission: Canberra, Australia, 2013.
  7. Faivre, O.; Herve, Y.L.E.; Jehl, P.; Jouhanneau, S.; Bugnot, E. Forecast of faults during heat waves in a medium voltage grid and crisis management. In Proceedings of the CIRED Workshop, Helsinki, Finland, 14–15 June 2016. [Google Scholar]
  8. Steffen, W.; Hughes, L.; Perkins, S. Heatwaves: Longer, Hotter, More Often; Climate Council of Australia Limited: Sydney, Australia, 2014. [Google Scholar]
  9. Entriken, R.; Lordan, R. Impacts of Extreme Events on Transmission and Distribution Systems. In Proceedings of the 2012 IEEE Power Energy Society General Meeting, San Diego, CA, USA, 22–26 July 2012; pp. 1–10. [Google Scholar] [CrossRef]
  10. Salamanca, F.; Georgescu, M.; Mahalov, A.; Moustaoui, M.; Wang, M. Anthropogenic heating of the urban environment due to air conditioning. J. Geophys. Res. Atmos. 2014, 119, 5949–5965. [Google Scholar] [CrossRef]
  11. Munck, C.; Pigeon, G.; Masson, V.; Meunier, F.; Bousquet, P.; Tremeac, B.; Merchat, M.; Poeuf, P.; Marchadier, C. How much can air conditioning increase air temperatures for a city like Paris, France? Int. J. Climatol. 2013, 33, 210–227. [Google Scholar] [CrossRef]
  12. Salamanca, F.; Martilli, A.; Tewari, M.; Chen, F. A study of the urban boundary layer using different urban parameterizations and high-resolution urban canopy parameters with WRF. J. Am. Meterol. Soc. 2011, 50, 1107–1128. [Google Scholar] [CrossRef]
  13. Ohashi, Y.; Genshi, Y.; Kondo, H.; Kikegawa, Y.; Yoshikado, H.; Hirano, Y. Influence of air-conditioning waste heat on air temperature in Tokyo during summer: Numerical experiments using an urban canopy model coupled with a building energy model. J. Appl. Meteorol. Climatol. 2007, 46, 66–81. [Google Scholar] [CrossRef]
  14. Kikegawa, Y.; Genchi, Y.; Yoshikado, H.; Kondo, H. Development of a numerical simulation system toward comprehensive assessments of urban warming countermeasures including their impacts upon the urban buildings’ energy-demands. Appl. Energy 2003, 76, 449–466. [Google Scholar] [CrossRef]
  15. Hsieh, C.M.; Aramaki, T.; Hanaki, K. The feedback of heat rejection to air conditioning load during the nighttime in subtropical climate. Energy Build. 2007, 39, 1175–1182. [Google Scholar] [CrossRef]
  16. Wen, Y.; Lian, Z. Influence of air conditioners utilization on urban thermal environment. Appl. Therm. Eng. 2009, 29, 670–675. [Google Scholar] [CrossRef]
  17. Obradovich, N.; Migliorini, R.; Mednick, S.C.; Fowler, J.H. Nighttime temperature and human sleep loss in a changing climate. Sci. Adv. 2017, 3, e160155. [Google Scholar] [CrossRef] [PubMed]
  18. National Oceanic and Atmospheric Administration National Weather Service. Join the National Weather Service in Promoting Heat Awareness Day on May 30s; National Oceanic and Atmospheric Administration National Weather Service: Washington, DC, USA, 2012.
  19. Farbotko, C.; Waltt, G. Residential air-conditioning and climate change: Voices of the vulnerable. Health Promot. J. Aust. 2011, 22, S13–S16. [Google Scholar] [PubMed]
  20. De Magalhaes Rios, J.L.M.; Boechat, J.L.; Gioda, A.; dos Santos, C.Y.; de Aquino Neto, F.R.; Lapa e Silva, J.R.L. Symptoms prevalence among office workers of a sealed versus a non-sealed building: Associations to indoor air quality. Environ. Int. 2009, 35, 1136–1141. [Google Scholar] [CrossRef] [PubMed]
  21. Sahakian, N.; Park, J.H.; Cox-Ganser, J. Respiratory morbidity and medical visits associated with dampness and air-conditioning in offices and homes. Indoor Air 2009, 19, 58–67. [Google Scholar] [CrossRef] [PubMed]
  22. Graudenz, G.S.; Oliveira, C.H.; Tribess, A.; Mendes, C., Jr.; Latorre, M.R.D.O.; Kalil, J. Association of air-conditioning with respiratory symptoms in office workers in tropical climate. Indoor Air 2004, 15, 62–66. [Google Scholar] [CrossRef] [PubMed]
  23. Preziosi, P.; Czernichow, S.; Gehanno, P.; Hercberg, S. Workplace air-conditioning and health services attendance among French middle-aged women: A prospective cohort study. Int. J. Epidemiol. 2004, 33, 1120–1123. [Google Scholar] [CrossRef] [PubMed]
  24. Kubota, T.; Jeong, S.; Toe, D.H.C.; Ossen, D.R. Energy consumption and air-conditioning usage in residential buildings of Malaysia. J. Int. Dev. Coop. 2011, 17, 61–69. [Google Scholar] [CrossRef]
  25. Kubota, T.; Toe, D.H.C. Potential of passive cooling techniques for modern houses in the tropical climate of Malaysia—Analysis of the indoor thermal environment for various ventilation strategies. Int. J. Vent. 2010, 9, 11–23. [Google Scholar] [CrossRef]
  26. Hassan, J.S.; Zin, R.M.; Majid, M.Z.; Balubaid, S.; Hainin, M.R. Building energy consumption in Malaysia: An overview. J. Teknol. 2014, 70, 33–38. [Google Scholar] [CrossRef]
  27. Maller, C.J.; Strengers, Y. Housing, heat stress and health in a changing climate: Promoting the adaptive capacity of vulnerable households, a suggested way forward. Health Promot. Int. 2011, 26, 492–498. [Google Scholar] [CrossRef] [PubMed]
  28. Van der Heijden, J. On the potential of voluntary environmental programmes for the built environment: A critical analysis of LEED. J. Hous. Built Environ. 2015, 30, 553–567. [Google Scholar] [CrossRef]
  29. Hwang, B.G.; Tan, J.S. Green building project management: Obstacles and solutions for sustainable development. Sustain. Dev. 2010, 20, 335–349. [Google Scholar] [CrossRef]
  30. Issa, M.H.; Rankin, J.H.; Christian, A.J. Canadian practitioners’ perception of research work investigating the cost premiums, long-term costs and health and productivity benefits of green buildings. Build. Environ. 2010, 45, 1689–1711. [Google Scholar] [CrossRef]
  31. Alias, A.; Sin, T.K.; Aziz, W.N.A.W.A. The green home concept- acceptability and development problems. J. Build. Perform. 2010, 1, 130–139. [Google Scholar]
  32. Chan, E.H.W.; Qian, Q.K.; Lam, P.T.I. The market for green building in developed Asian cities—The perspectives of building designers. Energy Policy 2009, 37, 3061–3070. [Google Scholar] [CrossRef]
  33. Chan, A.P.C.; Darko, A.; Ameyaw, E.E. Strategies for promoting green building technologies adoption in the construction industry—An international study. Sustainability 2017, 9, 969. [Google Scholar] [CrossRef]
  34. Nalewaik, A.; Venters, V. Dev. 02: Costs and benefits of building green. AACE Int. Trans. 2008, 1–9. [Google Scholar]
  35. Green Building Index Executive Summary. Executive Summary as of 15 May 2017. Available online: http://new.greenbuildingindex.org/organisation/summary (accessed on 1 June 2017).
  36. Green Building Information Gateway. Malaysia Database. Available online: http://www.gbig.org/places/752 (accessed on 1 June 2017).
  37. Khazanah Research Institute. Economic Development in 2015; Khazanah Research Institute: Kuala Lumpur, Malaysia, 2016. [Google Scholar]
  38. Ministry of Finance Malaysia. The 2010 Budget; Ministry of Finance Malaysia, Percetakan Nasional Malaysia Berhad: Kuala Lumpur, Malaysia, 2009.
  39. Ministry of Finance Malaysia. The 2014 Budget; Ministry of Finance Malaysia, Percetakan Nasional Malaysia Berhad: Kuala Lumpur, Malaysia, 2013.
  40. Abidin, N.Z.; Yusof, N.A.; Othman, A.A.E. Enablers and challenges of a sustainable housing industry in Malaysia. Constr. Innov. 2013, 13, 10–25. [Google Scholar] [CrossRef]
  41. Dwaikat, L.N.; Ali, K.N. Green buildings cost premium: A review of empirical evidence. Energy Build. 2016, 110, 396–403. [Google Scholar] [CrossRef]
  42. Azizi, N.Z.M.; Abidin, N.Z.; Raofuddin, A. Identification of soft cost elements in green projects: Exploring experts’ experience. Procedia Soc. Behav. Sci. 2015, 170, 18–26. [Google Scholar] [CrossRef]
  43. Qian, Q.K.; Chan, E.H.W.; Khalid, A.G. Challenges in delivering green building projects: Unearthing the transaction costs (TCs). Sustainability 2015, 7, 3615–3636. [Google Scholar] [CrossRef]
  44. Chegut, A.; Eichholtz, P.; Kok, N. The Price of Innovation: An Analysis of the Marginal Cost of Green Buildings. Center for Real Estate MIT Working Paper Series. 2015. Available online: http://www.corporate-engagement.com/research/133 (accessed on 30 November 2017).
  45. Aliagha, G.U.; Hashim, M.; Sanni, A.O.; Ali, K.N. Review of green building demand factors for Malaysia. Int. J. Energy Technol. Policy 2013, 3, 471–478. [Google Scholar]
  46. Morris, P.; Langdon, D. What does green really cost? PREA Q. Summer 2007, 55–60. [Google Scholar]
  47. Matthiessen, L.; Morris, P.; Langdon, D. Costing Green: A Comprehensive Cost Database and Budgeting Methodology; U.S. Green Building Council: Washington, DC, USA, 2004. [Google Scholar]
  48. Dodge Data & Analytics. Green and Healthier Homes: Engaging Consumers of All Ages in Sustainable Living; Dodge Data & Analytics: New York, NY, USA, 2015. [Google Scholar]
  49. CBRE Malaysia. CB Richard Ellis Malaysia Special Report: Going Green Malaysia; CBRE Malaysia: Kuala Lumpur, Malaysia, 2010. [Google Scholar]
  50. Kwan, H.H. QS practice notes & qualifying capex for non M&E Items. In Proceedings of the GBI Roadshow 2016, Kota Kinabalu, Sabah, 16 November 2016. [Google Scholar]
  51. Jakob, M.; Madlener, R. Riding down the experience curve for energy-efficient building envelopes: The Swiss case for 1970–2020. Int. J. Energy Technol. Policy 2004, 2, 153–178. [Google Scholar] [CrossRef]
  52. Sundaram, R. Applying Learning Curve Theory in Construction Cost Estimating. Available online: https://www.fgould.com/americas/articles/applying-learning-curve-theory-construction-cost/ (accessed on 30 May 2017).
  53. Yau, Y. Eco-labels and willingness-to-pay: A Hong Kong study. Smart Sustain. Built Environ. 2012, 1, 277–290. [Google Scholar] [CrossRef]
  54. Zhang, L.; Sun, C.; Liu, H.; Zheng, S. The role of public information in increasing homebuyers’ willingness-to-pay for green housing: Evidence from Beijing. Ecol. Econ. 2016, 129, 40–49. [Google Scholar] [CrossRef]
  55. Braganca, L.; Vieira, S.M.; Andrade, J.B. early stage design decisions: The way to achieve sustainable buildings at lower costs. Sci. World J. 2014, 365364. [Google Scholar] [CrossRef] [PubMed]
  56. Syphers, G.; Baum, M.; Bouton, D.; Sullens, W. Managing the Cost of Green Buildings; KEMA Xenergy: Oakland, CA, USA, 2003. [Google Scholar]
  57. Department of Statistics Malaysia eDataBank. Population Projection. Available online: https://www.dosm.gov.my/v1/index.php?r=column/cthree&menu_id=cEhBV0xzWll6WTRjdkJienhoR290QT09 (accessed on 31 May 2017).
  58. Khazanah Research Institute. Making Housing Affordable; Khazanah Research Institute: Kuala Lumpur, Malaysia, 2015. [Google Scholar]
  59. Department of Statistics Malaysia. Population Distribution and Basic Demographic Characteristics 2010; Department of Statistics Malaysia: Putrajaya, Malaysia, 2011.
  60. Department of Statistics Malaysia. Household Income and Basic Amenities Survey Report 2014; Department of Statistics Malaysia: Putrajaya, Malaysia, 2015.
  61. Department of Statistics Malaysia. Household Income and Basic Amenities Survey Report 2012; Department of Statistics Malaysia: Putrajaya, Malaysia, 2013.
  62. Department of Statistics Malaysia. Household Income and Basic Amenities Survey Report 2009; Department of Statistics Malaysia: Putrajaya, Malaysia, 2010.
  63. Department of Statistics Malaysia. Household Income and Basic Amenities Survey Report 2006; Department of Statistics Malaysia: Putrajaya, Malaysia, 2007.
  64. Department of Statistics Malaysia. Household Income and Basic Amenities Survey Report 2004; Department of Statistics Malaysia: Putrajaya, Malaysia, 2005.
  65. Department of Statistics Malaysia. Household Income and Basic Amenities Survey Report 2002; Department of Statistics Malaysia: Putrajaya, Malaysia, 2003.
  66. The World Bank Data Bank Country Profile Malaysia. Available online: https://data.worldbank.org/country/malaysia (accessed on 8 June 2017).
  67. Nolan, B.; Roser, M.; Thewissen, S. GDP Per Capita Versus Median Household Income: What Gives Rise to Divergence over Time? Institute for New Economic Thinking Oxford Working Paper no. 2016–03, 2016. Available online: http://www.lisdatacenter.org/wps/liswps/672.pdf (accessed on 30 November 2017).
  68. Pricewaterhouse Coopers World in 2050. Available online: https://www.pwc.com/gx/en/issues/economy/the-world-in-2050.html#data (accessed on 8 June 2017).
  69. Djamila, H.; Chu, C.M.; Kumaresan, S. Field study of thermal comfort in residential buildings in the equatorial hot-humid climate of Malaysia. Build. Environ. 2013, 62, 133–142. [Google Scholar] [CrossRef]
  70. Djamila, H.; Chu, C.M.; Kumaresan, S. Investigation on hourly and monthly thermal comfort in the humid tropics of Malaysia. Buildings 2015, 5, 1025–1036. [Google Scholar] [CrossRef]
  71. Humphreys, M.; Hancock, M. Do people like to feel ‘neutral’? Exploring the variation of the desired thermal sensation on the ASHRAE scale. Energy Build. 2007, 39, 867–874. [Google Scholar] [CrossRef]
  72. Feiradi, H.; Wong, N.H. Thermal comfort for naturally ventilated houses in Indonesia. Energy Build. 2004, 36, 614–626. [Google Scholar] [CrossRef]
  73. Feriadi, H.; Wong, N.H.; Chandra, S.; Cheong, W.K. Adaptive behaviour and thermal comfort in Singapore’s naturally ventilated housing. Build. Res. Inf. 2003, 31, 13–23. [Google Scholar] [CrossRef]
  74. Han, J.; Zhang, G.; Zhang, Q.; Zhang, J.; Liu, J.; Tian, L.; Zheng, C.; Hao, J.; Lin, J.; Liu, Y.; Moschandreas, D.J. Field study on occupants’ thermal comfort and residential thermal environment in a hot-humid climate of China. Build. Environ. 2007, 42, 4043–4050. [Google Scholar] [CrossRef]
  75. CCSM3 hourly temperature projections for Subang; National Hydraulic Research Institute Malaysia (NAHRIM): Seri Kembangan, Malaysia, 2017.
  76. Chen, W.; Hong, X. Design of effective subsidy policy to develop green buildings: From the perspective of policy benefit. Clean Technol. Environ. Policy 2015, 17, 1029–1038. [Google Scholar] [CrossRef]
  77. Chau, C.K.; Tse, M.S.; Chung, K.Y. A choice experiment to estimate the effect of green experience on preferences and willingness-to-pay for green building attributes. Build. Environ. 2010, 45, 2553–2561. [Google Scholar] [CrossRef]
  78. Salvi, M.; Syz, J. What drives “green housing” construction? Evidence from Switzerland. J. Financ. Econ. Policy 2011, 3, 86–102. [Google Scholar] [CrossRef]
  79. Gardner, B. A review and analysis of the use of ‘habit’ in understanding, predicting and influencing health related behaviour. Health Psychol. Rev. 2015, 9, 277–295. [Google Scholar] [CrossRef] [PubMed]
  80. Kor, K.; Mullan, B.A. Sleep hygiene behaviours: An application of the theory of planned behaviour and the investigation of perceived autonomy support, past behaviour and response inhibition. Psychol. Health 2011, 9, 1208–1224. [Google Scholar] [CrossRef] [PubMed]
  81. IPCC. Climate Change 2013 The Physical Science Basis: Contribution of Working Group I to the Fifth Assessment Report of the Intergovernmental Panel on Climate Change; Stocker, T.F., Qin, D., Plattner, G.K., Tignor, M., Allen, S.K., Boschung, J., Nauels, A., Xia, Y., Bex, V., Midgley, P.M., Eds.; Cambridge University Press: Cambridge, UK; New York, NY, USA, 2013. [Google Scholar]
  82. Adams, S.; Baarsch, F.; Bondeau, A.; Coumou, D.; Donner, R.; Frieler, K.; Hare, B.; Menon, A.; Perette, M.; Piontek, F.; et al. Turn Down the Heat: Climate Extremes, Regional Impacts, and the Case for Resilience; World Bank: Washington, DC, USA, 2013. [Google Scholar]
  83. Kenny, G.P.; Yardley, J.; Brown, C.; Sigal, R.J.; Jay, O. Heat stress in older individuals and patients with common chronic diseases. Can. Med. Assoc. J. 2010, 182, 1053–1060. [Google Scholar] [CrossRef] [PubMed]
  84. Semenza, J.C.; Rubin, C.H.; Falter, K.H.; Selanikio, J.D.; Flanders, W.D.; Howe, H.L.; Wilhelm, J.L. Heat-related deaths during the July 1995 heat wave in Chicago. N. Engl. J. Med. 1996, 335, 84–90. [Google Scholar] [CrossRef] [PubMed]
  85. Semenza, J.C.; McCullough, J.E.; Flanders, W.D.; McGeehin, M.A.; Lumpkin, J.R. Excess hospital admissions during the July 1995 heat wave in Chicago. Am. J. Prev. Med. 1999, 16, 269–277. [Google Scholar] [CrossRef]
  86. Havenith, G.; Coenen, J.M.; Kistemaker, L.; Kenney, W.L. Relevance of individual characteristics for human heat stress response is dependent on exercise intensity and climate type. Eur. J. Appl. Physiol. Occup. Physiol. 1998, 77, 231–241. [Google Scholar] [CrossRef] [PubMed]
  87. Bar-Or, O.; Lundegren, H.M.; Buskirk, E.R. Heat tolerance of exercising obese and lean women. J. Appl. Physiol. 1969, 26, 403–409. [Google Scholar] [PubMed]
  88. Sherwood, S.C.; Huber, M. An adaptability limit to climate change due to heat stress. Proc. Natl. Acad. Sci. USA 2010, 107, 9552–9555. [Google Scholar] [CrossRef] [PubMed]
  89. Mazdiyasni, O.; AghaKouchak, A.; Davis, S.J.; Madadgar, S.; Mehran, A.; Ragno, E.; Sadegh, M.; Sengupta, A.; Ghosh, S.; Dhanya, C.T.; et al. Increasing probability of mortality during Indian heat waves. Sci. Adv. 2017, 3, e1700066. [Google Scholar] [CrossRef] [PubMed]
  90. White-Newsome, J.L.; Sanchez, B.N.; Jolliet, O.; Zhang, Z.; Parker, E.A.; Dvonch, J.T.; O’Neill, M.S. Climate change and health: Indoor heat exposure in vulnerable populations. Environ. Res. 2012, 112, 20–27. [Google Scholar] [CrossRef] [PubMed]
  91. Vandentorren, S.; Bretin, P.; Zeghnoun, A.; Mandereau-Bruno, L.; Croisier, A.; Chochet, C.; Riberon, J.; Siberan, I.; Declercq, B.; Ledrans, M. August 2003 Heat wave in France: Risk factors for death of elderly people living at home. Eur. J. Public Health 2006, 15, 583–591. [Google Scholar] [CrossRef] [PubMed]
  92. Zhang, K.; Rood, R.B.; Michailidis, G.; Oswald, E.M.; Schwartz, J.D.; Zanobetti, A.; Ebi, K.L.; O’Neill, M.S. Comparing exposure metrics for classifying ‘dangerous heat’ in heat wave and health warning systems. Environ. Int. 2012, 46, 23–29. [Google Scholar] [CrossRef] [PubMed]
  93. Martiello, M.A.; Giacchi, M.V. High temperatures and health outcomes: A review of the literature. Scand. J. Public Health 2010, 38, 826–837. [Google Scholar] [CrossRef] [PubMed]
  94. Eisenman, D.P.; Wilhalme, H.; Tseng, C.; Chester, M.; English, P.; Pinceti, S.; Fraser, A.; Vangala, S.; Dhaliwal, S.K. Heat death associations with the built environment, social vulnerability and their interactions with rising temperature. Health Place 2016, 41, 89–99. [Google Scholar] [CrossRef] [PubMed]
  95. Weber, S.; Sadoff, N.; Zell, E.; de Sherbinin, A. Policy-relevant indicators for mapping the vulnerability of urban populations to extreme heat events: A case study of Philadelphia. Appl. Geogr. 2015, 63, 231–243. [Google Scholar] [CrossRef]
  96. Deschenes, O. Temperature, human health, and adaptation: A review of the empirical literature. Energy Econ. 2014, 46, 606–619. [Google Scholar] [CrossRef]
  97. United States Center for Disease Control and Prevention. Heat-related deaths after an extreme heat event—Four states, 2012, and United States, 1999–2009. Morb. Mortal. Wkly. Rep. 2013, 62, 433–436. [Google Scholar]
  98. Siri, J.G.; Newell, B.; Proust, K.; Capon, A. Urbanization, extreme events and health: The case for systems approaches in mitigation, management, and response. Asia Pac. J. Public Health 2016, 28, 15S–27S. [Google Scholar] [CrossRef] [PubMed]
  99. Dodge Data & Analytics. World Green Building Trends 2016; Dodge Data & Analytics: New York, NY, USA, 2016. [Google Scholar]
  100. Fuerst, F.; Kontokosta, C.; McAllister, P. Determinants of green building adoption. Environ. Plan. B Plan. Des. 2014, 41, 551–570. [Google Scholar] [CrossRef]
  101. Yau, Y.; Chiu, S.M.; Lau, W.K. Economising subsidies for green housing features: A stated preference approach. Urbani Izziv 2014, 25, 107–118. [Google Scholar] [CrossRef]
  102. Heinzle, S.L.; Boey, A.Y.Y.; Low, M.Y.X. The influence of green building certification schemes on real estate investor behaviour: Evidence from Singapore. Urban Stud. 2012, 50, 1970–1987. [Google Scholar] [CrossRef]
  103. Hu, H.; Greetman, S.; Hooimeijer, P. Personal values that drive the choice for green apartments in Nanjing China: The limited role of environmental values. J. Hous. Built Environ. 2016, 31, 659–675. [Google Scholar] [CrossRef]
  104. Fuerst, F.; Shimizu, C. Green luxury goods? The economics of eco-labels in the Japanese housing market. J. Jpn. Int. Econ. 2016, 39, 108–122. [Google Scholar] [CrossRef]
  105. Qiu, Y.; Tiwari, A.; Yang, Y.D. The diffusion of voluntary green building certification: A spatial approach. Energy Effic. 2015, 8, 449–471. [Google Scholar] [CrossRef]
  106. Qiu, Y.; Yin, S.; Wang, Y.D. Peer effects and voluntary green building certification. Sustainability 2016, 8, 632. [Google Scholar] [CrossRef]
  107. The Lantau Group. Global Benchmark Study of Residential Electricity Tariffs; The Lantau Group: Hong Kong, China, 2013. [Google Scholar]
  108. CBRE. Who Pays for Green? The Economics of Sustainable Buildings; CBRE: Los Angeles, CA, USA, 2009. [Google Scholar]
  109. Yunus, R.; Yang, J. Sustainability criteria for industrialised building systems (IBS) in Malaysia. Procedia Eng. 2011, 14, 1590–1598. [Google Scholar] [CrossRef]
  110. Marron, D. Greener public purchasing as an environmental policy instrument. OCED J. Budg. 2003, 3, 71–105. [Google Scholar] [CrossRef]
  111. Simcoe, T.; Toffel, M.W. Public Procurement and the Private Supply of Green Buildings; Working Paper 18385; National Bureau of Economic Research: Cambridge, MA, USA, 2012. [Google Scholar]
  112. Ministry of Finance Malaysia. The 2016 Budget; Ministry of Finance Malaysia, Percetakan Nasional Malaysia Berhad: Kuala Lumpur, Malaysia, 2013.
  113. Jaafar, M.F.Z. Adapting to technology: The case of air conditioning use in Malaysian homes. In Proceedings of the Adapting to Change: New Thinking on Comfort Cumberland Lodge, Windsor, UK, 9–11 April 2010. [Google Scholar]
Figure 1. Causal loop diagram illustrating the “Cost Premium Reinforcing Loop,” a reinforcing feedback loop (designated by R) that drives construction of climate-sensitive buildings through reductions in cost premiums. Blue arrows with the “+” sign denote positive causal links while red arrows with the “–” sign denote negative causal links. Thus, for example, high demand for residential CSB leads to a greater number of CSB, then a greater number of CSB leads to reduced cost premiums of CSB.
Sustainability 09 02300 g001
Figure 2. Modelled willingness to pay curves and survey data for homebuyers of climate-sensitive buildings [48,53]. Curve construction is described in Appendix A.
Sustainability 09 02300 g002
Figure 3. Stock-and-flow diagram for adoption of climate-sensitive buildings. The diagram incorporates the “Cost Premium Reinforcing Loop” (Figure 1) and illustrates its relationship to housing stock, housing demand and consumer willingness to pay. Greyed-out variables belong to other sub-sections of the overall model. Links represented by solid arrows were incorporated into a system dynamics model examining the impacts of subsidies on uptake of CSB, while links represented by dotted arrows are beyond the scope of the simulation analysis. All relationships are addressed in qualitative terms in the text.
Sustainability 09 02300 g003
Figure 4. Factors driving housing demand in Malaysia.
Sustainability 09 02300 g004
Figure 5. Driving factors for consumer willingness to pay for air-conditioning.
Sustainability 09 02300 g005
Figure 6. Climate change, air-conditioning ownership, thermal preferences and residential building stock and associated elevated indoor temperatures drive air-conditioning usage.
Sustainability 09 02300 g006
Figure 7. Fraction of residents preferring cooler temperatures for a range of ambient temperatures in Singapore, Indonesia and Central Southern China. Data points are taken from references [72,73,74]. Curves were fitted to data using four or five parameter logistic equations.
Sustainability 09 02300 g007
Figure 8. Night-time thermal preferences are more easily achieved in climate-sensitive buildings as compared to climate-insensitive buildings, due to lower levels of retained heat.
Sustainability 09 02300 g008
Figure 9. Conceptual representation of the system dynamics model in this study.
Sustainability 09 02300 g009
Figure 10. Subsidy effects on climate-sensitive building fraction of Malaysian residential stock for various WTP preferences: (a) High, (b) Medium, (c) Low.
Sustainability 09 02300 g010
Figure 11. Subsidy effects on climate-sensitive building representation of Malaysian residential stock under Fixed, Reduced and CIB Int scenarios.
Sustainability 09 02300 g011
Figure 12. Subsidy effects on Malaysian residential night-time air-conditioning usage under various climate change scenarios: (a) A1FI (high ambient temperature increase), (b) A1B (medium ambient temperature increase), (c) B1 (low ambient temperature increase). Short-term fluctuations in AC usage are due to year-to-year climate variances.
Sustainability 09 02300 g012
Table 1. Variables and Relationships in Conceptual Models in Figure 3, Figure 4, Figure 5 and Figure 6 and Figure 9.
GroupVariableVariable Type and Notes
Cost-Premium Reinforcing Loop and Building Stocks (Section 2.2)Additional Cost Borne by Developer/ConsumerOutput variable.
Awareness of CSB BenefitsConceptual link showing potentially important feedback pathway.
Construction of Residential CIBOutput variable.
Construction of Residential CSBOutput variable.
Cost Premium of CSB Output variable. Progress ratio, describing the rate of change, is an input variable (not easily extracted from the equation as a separate variable) and a sensitivity parameter.
The initial value of the cost premium of CSB is an input variable and sensitivity parameter.
CSB Fraction of Residential BuildingsOutput variable
Decommissioning of Residential CIBOutput variable. Decommissioning rate is built into this variable and is a sensitivity parameter.
Decommissioning of Residential CSBOutput variable.
Demand for Residential CSBOutput variable.
Quantity of Residential CSBOutput variable.
Quantity of Residential CIBOutput variable.
RetrofittingConceptual link showing potential pathway for increasing residential CSB.
SubsidyInput variable and sensitivity parameter used in all scenarios.
Willingness to Pay for CSBInput variable and scenario parameter. Note that this is subsumed into Demand for Residential CSB in Figure 9 and in the simulation working model.
Factors Driving Housing Demand in Malaysia (Section 2.3) Attempts to Reduce the Housing GapInput variable and scenario parameter. Note that this is subsumed into Housing Demand in Figure 9
Household SizeInput variable. Note that this is subsumed into Housing Demand in Figure 9
Housing DemandOutput variable.
Number of HouseholdsOutput variable. Note that this is subsumed into Housing Demand in Figure 9
PopulationInput variable. Note that this is subsumed into Housing Demand in Figure 9
Factors Driving Willingness to Pay for Air-Conditioning in Malaysia (Section 2.4)AC OwnershipOutput Variable.
GDPConceptual link to indicate reason for changes in Median Household Income. Note that this is subsumed into Median Household Income in Figure 9 and in the simulation working model.
Median Household IncomeInput variable and sensitivity parameter.
Willingness to Pay for ACConceptual link between Median Household Income and AC Ownership. Note that this is subsumed into AC Ownership in Figure 9 and in the simulation working model.
Factors Driving AC Usage in Malaysia (Section 2.5)AC Contribution to Urban Heat IslandConceptual link showing potentially important feedback pathway.
AC UsageOutput variable.
Ambient TemperaturesInput variable and scenario parameter.
Climate Change EffectsConceptual link to indicate reason for ambient temperature changes. Note that this is subsumed into Ambient Temperatures in Figure 9 and in the simulation working model.
Increased Temperature in CIBInput variable.
Increased Temperature in CSBInput variable.
Thermal PreferenceInput variable and sensitivity analysis parameter.
Table 2. Scenarios and Sensitivity Analysis.
VariableAnalysis TypeDescription
SubsidyScenario and Sensitivity Four subsidy levels: no subsidy, 24% subsidy, 75% subsidy and 90% subsidy were used to evaluate all scenarios and sensitivity analysis.
Willingness to Pay for CSB (Subsumed under Demand for CSB)ScenarioCSB uptake under different subsidy levels and three different WTP curves: High, Medium and Low.
Attempts to Reduce the Housing GapScenarioCSB uptake under different subsidy levels and three different approaches to reducing the housing gap: Fixed (static housing gap), Reduced (housing gap reduced without compromising CSB uptake) and CIB Int (housing gap intervention relying on cheaper climate insensitive buildings).
Ambient TemperatureScenarioAC use under different subsidy levels and three different climate change scenarios: A1FI (large temperature increases), A1B (moderate temperature increases) and B1 (small temperature increase).
Cost Premium of CSBSensitivity CSB uptake under different subsidy levels and progress ratios (rate at which cost premium of CSB decreases with experience). Progress ratio values of 0.75, 0.8 (baseline) and 0.9 used.
Sensitivity CSB uptake under different subsidy levels and initial cost premium. Initial cost premium values of 2%, 5% (baseline) and 10% used.
Decommissioning of Residential CIB Sensitivity CSB uptake under different subsidy levels and building decommissioning rates. Building lifespans of 50 years (baseline) and 100 years used.
Median Household IncomeSensitivity AC use under different subsidy levels and four household income/GDP scenarios: median household income growth at 70% of GDP, 80% of GDP (baseline) and 90% of GDP, as well as median household income under low GDP growth.
Thermal PreferenceSensitivity AC use under different subsidy levels and two thermal preference curves: Indonesia (baseline) and Singapore.
Table 3. Climate Change Scenarios and CSB Adoption Rate Impacts on Night-time AC Usage.
Climate Chance ScenarioSubsidy Level and Residential CSB Adoption Rate2065 AC Usage Relative to No Subsidy Case2065 AC Usage Relative to 2015
A1FI (High)No subsidy, 3.9%1.06.1
24% subsidy, 7.4%0.996.0
75% subsidy, 45%0.865.2
90% subsidy, 74%0.754.6
A1B (Medium)No subsidy, 3.9%1.05.7
24% subsidy, 7.4%0.985.6
75% subsidy, 45%0.724.1
90% subsidy, 74%0.523.0
B1 (Low)No subsidy, 3.9%1.05.2
24% subsidy, 7.4%0.975.0
75% subsidy, 45%0.653.4
90% subsidy, 74%0.402.1

