Abstract
Developing low-carbon agriculture requires investigating the trajectory, decoupling statuses, and driving forces of agricultural carbon emissions. This study explored the evolution of agricultural carbon emissions based on 18 kinds of major carbon emission sources in Henan Province of China, which produces approximately one-tenth of China’s total grain output. We then analyzed the relationship between carbon emissions and economic growth using the decoupling elasticity model, and identified the factors driving the decoupling status. This analysis was done with a decoupling elasticity model, using the Logarithmic Mean Divisia Index technique. There were three key results: (1) Agricultural carbon emissions totaled 16.61 million tons in 1999, and increased by 7.99% to 17.93 million tons in 2014, with an average growth rate of approximately 0.65%; (2) The decoupling relationship between agricultural carbon emissions and economic output was dominated by weak decoupling during the study period; (3) Agricultural labor productivity was the leading contributor to changes in agricultural carbon emissions, followed by farming-animal husbandry carbon intensity, labor, and agricultural structure.
1. Introduction
The leading cause of global climate change is increases in CO2, CH4, N2O, and other greenhouse gases [1]. In agricultural production, large amounts of greenhouse gases (GHG) are caused by unsustainable exploitation, such as improper land use and chemical fertilizers. These affect climate change [2]. Agriculture is also a major source of GHGs, mostly comprised of CO2, N2O, and CH4 [3]. Rapid agricultural development has become an important factor contributing to climate change and global warming. GHG emissions from the agricultural ecosystem account for 7–20% of the world’s total [4]. CO2, CH4, and N2O emissions from agricultural sources account for 21–25%, 57%, and 65–80%, respectively, of total anthropogenic GHG emissions [5]. China is focused on reducing carbon emissions [6,7,8], as it has overtaken the United States (USA) as the largest GHG-emitting country. Carbon emissions generated by China’s agricultural production activities account for 17% of total emissions [9].
Therefore, agricultural production can be viewed as double-edged, and the potential impact of low carbon technology in agriculture cannot be ignored [10]. Many researchers have studied agricultural carbon emissions. For example, Johnson calculated natural and agriculturally-related carbon emissions in 2007 [11]. The paper summarized the composition of carbon emissions, proposing that agricultural practices may be grouped into primary, secondary, and tertiary sources [12]. Adopting recommended management practices (RMPs) for agriculture involves off-farm or external inputs that reflect carbon (C)-based operations and products [13,14]. There have also been agricultural carbon emissions research projects that address the agricultural operating model and agricultural carbon emissions [15,16,17], in addition to land use changes and ecosystem carbon balance [18,19]. Zaman explored the relationship between agricultural technology and agricultural carbon emissions in Pakistan from 1975 to 2010 [2]. Low carbon agriculture is moving towards the development of low energy consumption agriculture, circular agriculture, and organic agriculture [20,21,22,23,24]. Promoting new technologies is also an option, including biogas generators and energy-saving equipment for feeding, sanitation, and livestock and manure management. These technologies can increase efficiency and reduce energy waste [25]. Mccarl established an agricultural carbon trading market [26], and Peters proposed measures, including a carbon tax [27]. Simulated carbon emissions from land-use changes are substantially enhanced by accounting for agricultural management [28]. China is making significant efforts to reduce carbon emissions [6,8,29,30,31,32], including developing renewable energies [33,34].
Many researchers have focused on calculating China’s carbon emissions by selecting single agricultural carbon emissions. For example, studies have focused on: agricultural CO2 emission of Chinese various provinces based on a 2000–2011 time series of statistical data [35]; agricultural land use from 1993 to 2008 [36]; estimates of carbon emissions, carbon absorption, and the carbon footprint of the farmland ecosystem from 1990 to 2009 [37]; and estimates of methane and nitrous oxide emissions from livestock and poultry from 1949 to 2003 [38].
Henan Province is the most populous province in China (population of 94 million in 2012) with significant food and agricultural production. Henan Province also has high pollutant emissions; for example, the annual average particular matter PM2.5 in the capital, Zhengzhou, was 202 μg/m3 in 2013. This was significantly higher than the national standard of 35 μg/m3 [39]. Some researchers have previously studied Henan Province. For example, RQ Zhao [40] assessed a single carbon emission source: the farmland ecosystem. Li Yan Li [41] used gray correlation to analyze the factors driving carbon emissions in three industries, and in the whole province of Henan, during 1995–2009; M Zhang [42] assessed land use as a single carbon emission source; and X Wang [43] analyzed the factors influencing industry from 1990 to 2010. Finally, SL Peng [44] and Liu Ji Chao [45] completed a decoupling analysis of economic growth and carbon emissions in Henan province from 1985 to 2010 and 2000–2010.
These studies have greatly enriched the agricultural research system of carbon emissions, and provide a solid foundation for subsequent research. There are, however, some limitations that can be overcome by the deepening of related research. This study deepens the existing agricultural research in three ways. First, we extend carbon emission sources, selecting 18 kinds of major carbon emission sources, as shown in Table 1, Table 2 and Table 3. Second, we combine the decoupling elasticity model with an LMDI model, which provides a more detailed and comprehensive way to explore agricultural carbon emissions. Third, Henan Province is selected as a research area, to enrich previous agricultural research work with an empirical study using the latest data.

Table 1.
The carbon emission coefficient from agricultural material input.
Table 2.
The carbon emission coefficient from soil surface.
Table 3.
The carbon emission coefficient from major livestock.
2. Methodologies and Data Definitions
2.1. Measurement of Carbon Emission
To estimate CO2 emissions caused by farmers engaged in agricultural production activities, three types of greenhouse gases are examined in this paper: CO2, CH4, and N2O [3]. Academics generally believe that agricultural carbon emissions mainly come from the following sources: carbon emissions caused by agricultural material inputs; agricultural land use energy consumption, land tilling, agricultural waste treatment, and other aspects involving carbon emissions [46]; CH4 and other greenhouse gas emissions generated from rice growth [11,47]; N2O emissions due to soil surface damage [48]; and livestock breeding emissions, including CH4 emissions from enteric fermentation and CH4 and N2O emissions triggered by manure management [11,15,49]. The Henan province is in the Zhongyuan zone, where the crops are mostly wheat. As such, we consider all three sources of carbon emissions, except the CH4 and other GHG emissions generated by rice growth.
According to research on carbon emission equations [8,50,51,52,53,54] and the method proposed by the Intergovernmental Panel on Climate Change (IPCC) guidelines [55], we built and constructed a agricultural carbon emissions formula, as follows [56,57,58]:
In this equation, represents the total agricultural carbon emissions in Henan province (CO2 equivalent); represents the total carbon emissions of different types of carbon sources (t standard carbon); represents the types of carbon sources; represents the carbon emissions from agricultural material input; represents the carbon emissions from the soil surface; represents the carbon emissions from livestock farming; j represents the types of greenhouse gases; represents the CO2; represents the CH4; and represents the N2O. To facilitate the analysis, we replaced N2O and CH4 with standard CO2 in the final calculation; represents the conversion coefficients between the jth greenhouse gas and standard carbon. The conversion coefficients of N2O and CH4 are 81.2727 and 6.8182, respectively [4].
2.1.1. Carbon Emissions from Agricultural Material Input
The carbon emission sources from agricultural material inputs include fertilizers, pesticides, plastic sheeting, diesel oil, and irrigation. Table 1 shows the carbon emission coefficients of agricultural material inputs [4,59]. The calculation of carbon emissions is expressed as follows:
In this expression, represents the carbon emissions from agricultural material inputs; m represents different kinds of agricultural materials; represents the use of agricultural material inputs (t or million hm2); and represents the carbon emission coefficients of agricultural materials.
2.1.2. Carbon Emissions from Soil Surface
Table 2 shows the nitrous oxide (N2O) emission coefficient associated with the soil surface from all varieties of crops, including paddy rice, winter wheat, soybeans, corn, vegetables, and other dryland crops [15,60,61,62,63,64].
In the following formula, represents the N2O emission from the soil surface; the n represents the crop varieties; refers to the plantation of the crops (million hm2); and indicates the carbon emission coefficients associated with different crops.
2.1.3. Carbon Emissions from Livestock Farming
Carbon emission from livestock farming is an important source of CH4 and N2O. These emissions include livestock enteric fermentation and manure emissions. In Henan province, cows, horses, donkeys, mules, pigs, goats, and sheep are the main livestock breeds producing CH4 and N2O. The CH4 emissions are caused by enteric fermentation; CH4 and N2O emissions are triggered by manure emissions. Table 3 shows the carbon emission coefficient associated with major livestock [4,65].
In this table, represents the CH4 emissions from enteric fermentation and manure of major livestock; q represents the varieties of livestock; represents N2O emissions from manure; refers to the amount of livestock; indicates the CH4 coefficient from enteric fermentation; indicates the CH4 coefficient from manure; and indicates the N2O coefficient from manure.
2.2. Decoupling Elasticity Model
The decoupling of agricultural economic growth can be expressed as decoupling elasticity [66]. The decoupling model proposed by the Tapio model was developed based on the OECD decoupling model, which has been widely used to analyze the relationship between agricultural economic growth and carbon emissions [8,67,68]. The decoupling elasticity is measured using the following formula:
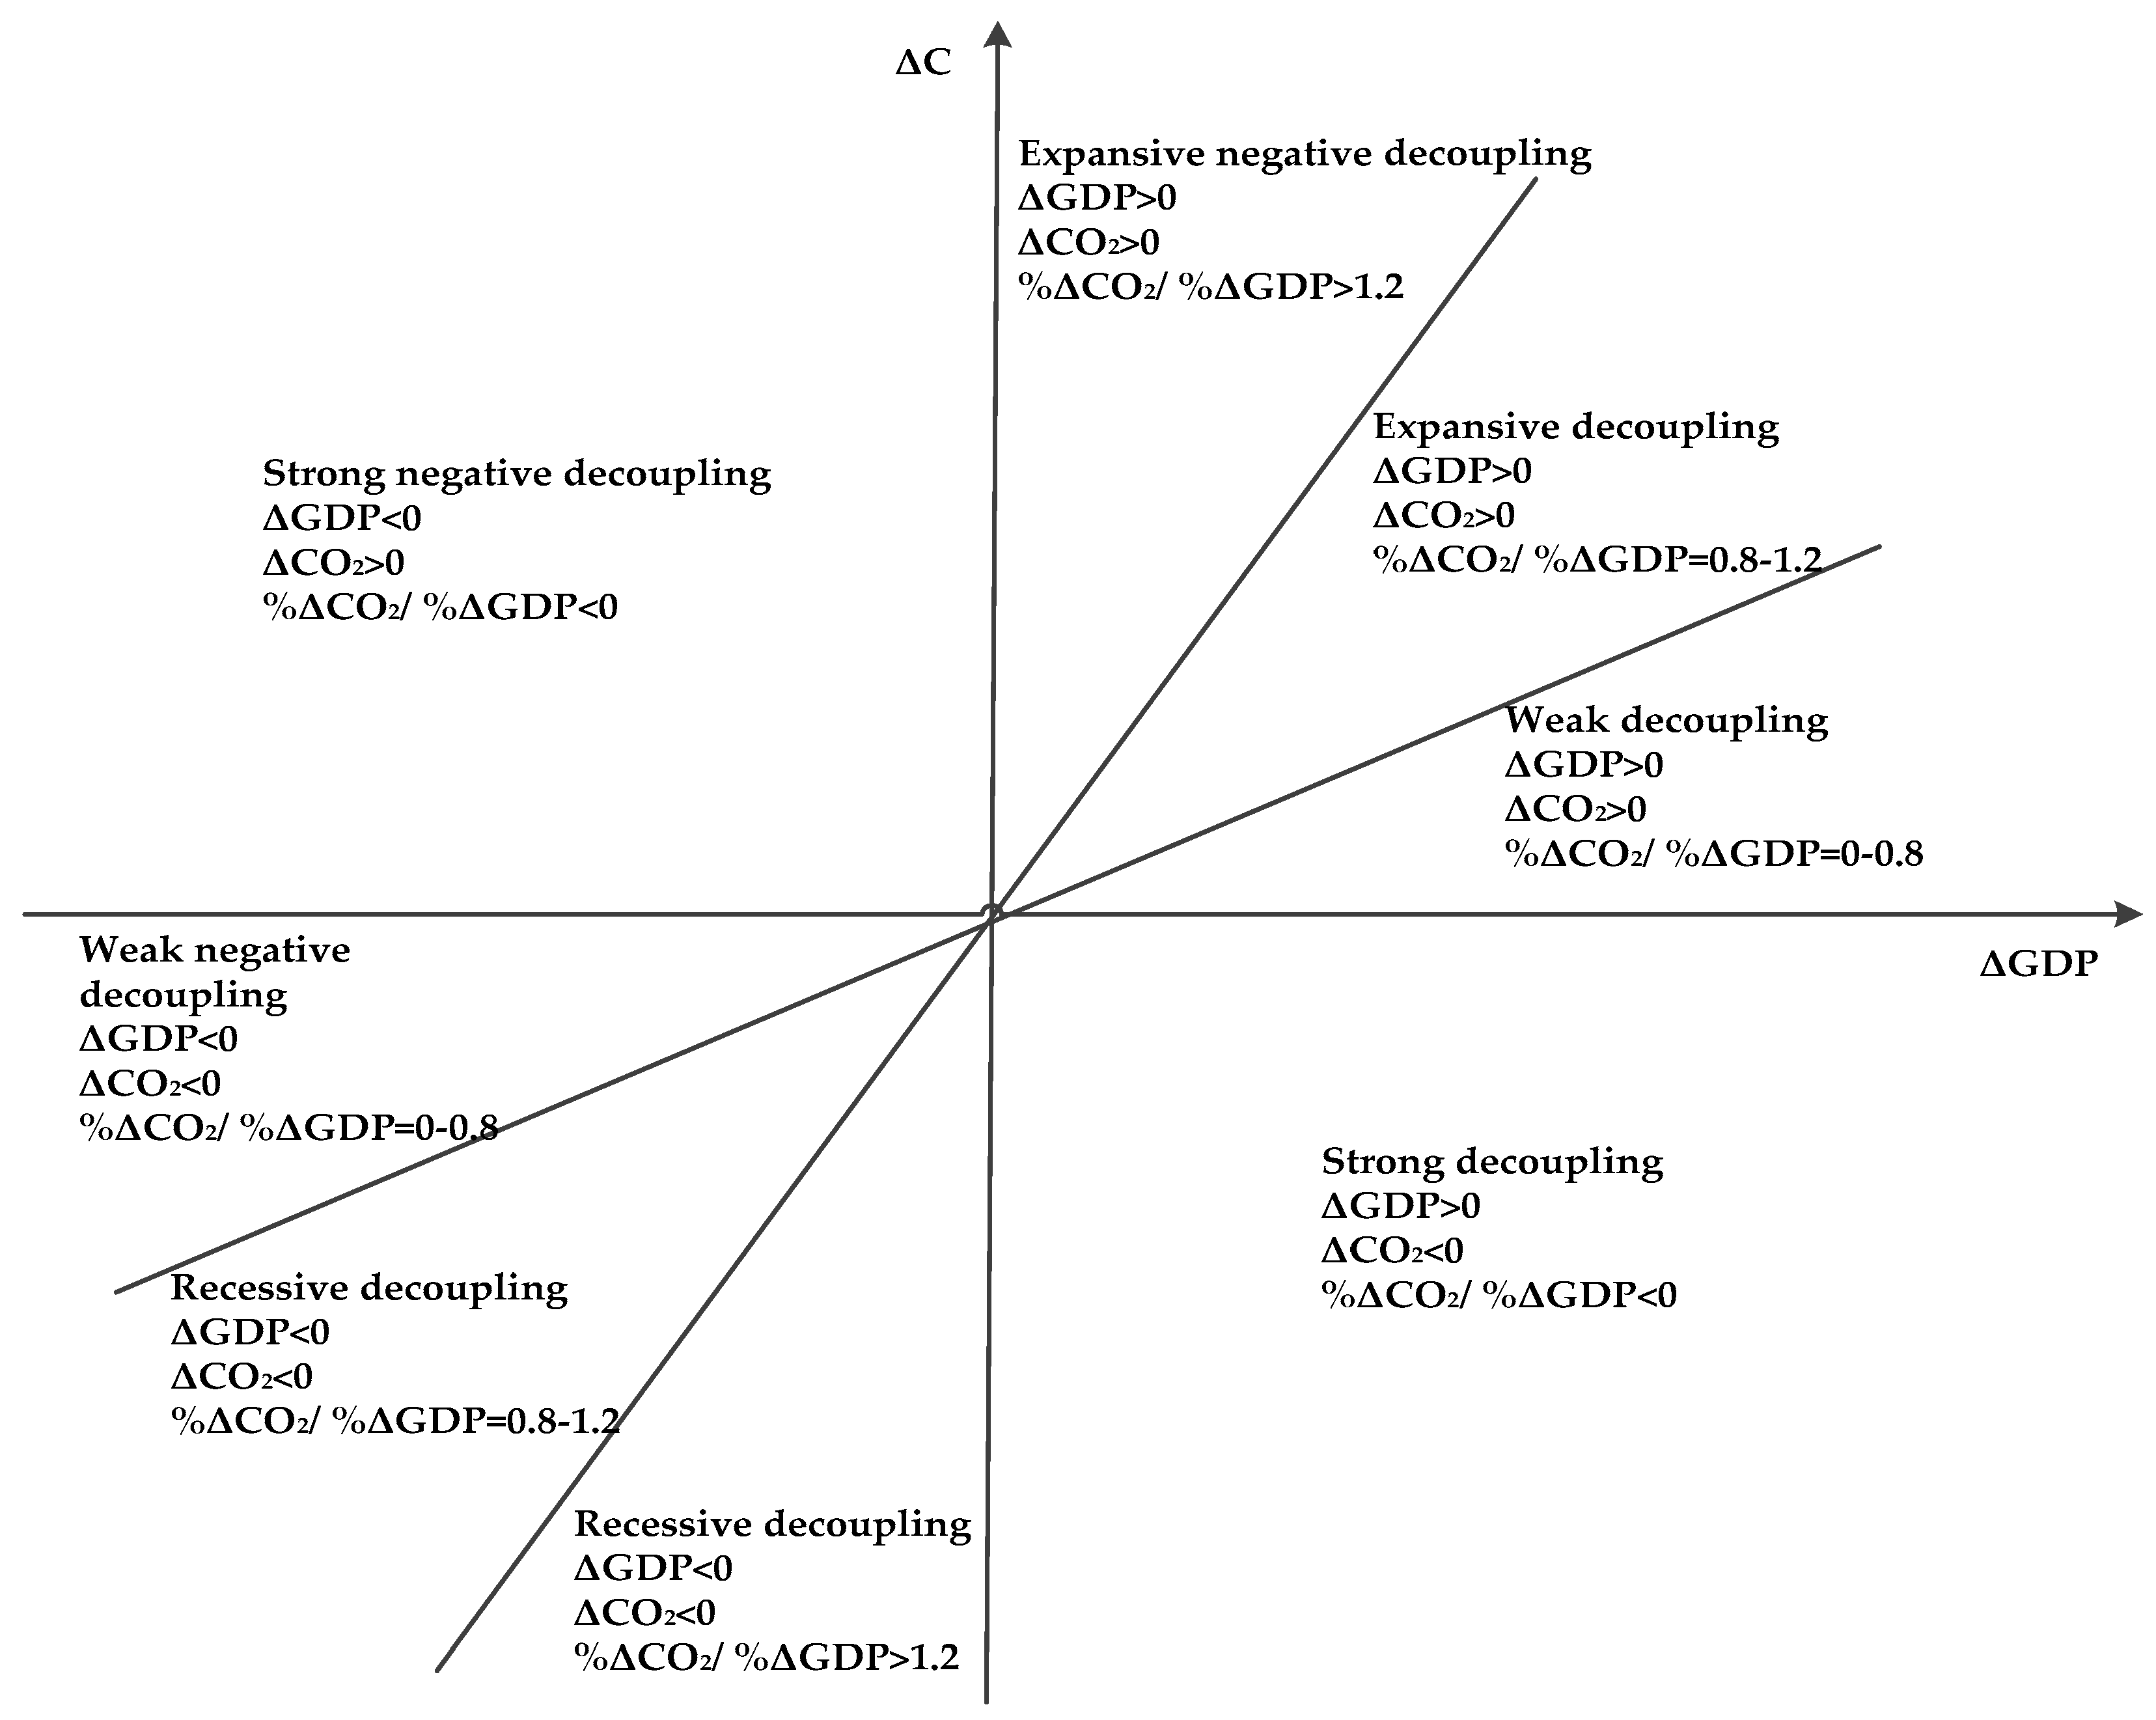
In this expression, is the value of decoupling elasticity; is the variation in the percent of carbon emissions; is the variation in the percent of agricultural economic output; C represents the carbon emissions; indicates the variation in carbon emissions at the current time compared with the base period; and GDP indicates the variation in the agricultural economic output at the current time compared with the base period. Based on the value of , there are eight logical possibilities: weak decoupling (the increase in the pace of carbon dioxide emissions is clearly smaller than agricultural economic output); expansive decoupling (the increase in the pace of carbon dioxide emissions is approximately equal to agricultural economic output); expansive negative decoupling (the increase in the pace of carbon dioxide emissions is clearly larger than agricultural economic output); strong negative decoupling (the agricultural economic output decreases, while the carbon dioxide emissions increase); weak negative decoupling (the decrease in the pace of the carbon dioxide emissions is clearly smaller than the agricultural economic output); recessive coupling (the decreased pace of carbon dioxide emissions is approximately equal to agricultural economic output); recessive decoupling (the decreased pace of carbon dioxide emissions is clearly larger than agricultural economic output); and strong decoupling (agricultural economic output increases, while carbon dioxide emissions decrease). Figure 1 shows these eight possibilities [69,70,71,72].

Figure 1.
Decoupling elasticity between carbon emissions and economic growth.
2.3. Logarithmic Mean Divisia Index (LMDI)
In general, studies have found that the Logarithmic Mean Divisia Index (LMDI) is a preferred method for decomposition analysis, due to its theoretical foundation, adaptability, ease of use, and interpretation results. There are also other desirable properties in the context of decomposition analysis [8,73,74,75,76]. The LMDI can be expressed as an extended Kaya identity, which was first proposed by Yoichi Kaya [68] and which follows the method given by the IPCC [55]. Combined with the reality of true agricultural carbon emissions, the extended Kaya identity is as follows:
In this formula, , , , and indicate the agricultural carbon emissions (CO2 equivalent), farming-animal husbandry gross output value, agricultural gross output value, and labor in the agricultural industry in year t, respectively. represents the farming-animal husbandry carbon intensity; represents the agricultural structure; and represents agricultural labor productivity. Using LMDI decomposition [15], the expression of the contribution of each decomposition factor is as follows:
In this expression, refers to the changes in carbon emissions. These changes can be further decomposed into the following indictors: (the effect of farming-animal husbandry carbon intensity), (the effect of agricultural structure), (the effect of agricultural labor productivity), and (the labor effect). We can use the following formula to calculate the values of , , , and :
2.4. Data Source
Data for this study were collected from issues of the China Rural Statistical Yearbook [77] and Henan Statistical Yearbook [78]. The latest data were from 2015. After considering data availability and integrity, which are fundamental in a pharmaceutical quality system, we selected the data from 1999 to 2015. We used data related to agricultural material input usage, including fertilizers; pesticides; plastic sheeting; diesel oil; irrigation; crop varieties, including paddy rice, winter wheat, soybeans, corn, vegetable and other dryland crops; and livestock breeding levels for cows, horses, donkeys, mules, pigs, goats, and sheep. Agricultural economic output values that were calculated with respect to actual price cannot be compared longitudinally; as such, to facilitate longitudinal comparability, we used the price in the year 2000 as the benchmark price to compare to the added value of agricultural prices.
3. Result and Analysis
3.1. Temporal Characteristics of Agricultural Carbon Emission
Based on the equations above, we calculated the agricultural carbon emissions, and the temporal characteristics of agricultural carbon emissions from 1999 to 2015 in Henan province. Table 4 shows the results. Total agricultural carbon emissions were 16.6079 million tons in 1999; they then increased by 8.80%, to 18.0697 million tons in 2015. This reflects an average growth rate of approximately 0.66%. The carbon emissions reached their highest value in 2005, at 19.8227 million tons. Of the emissions, the largest contributor was carbon emissions from livestock farming, which was 9.4637 million tons in 2015. This accounted for 52.37% of all emissions. This was followed by carbon emissions from agricultural material and the soil surface, contributing 8.5815 and 0.0245 million tons, or 47.49% and 0.14% of total emissions, respectively. The total carbon emissions showed an increasing trend during the period, with positive annual growth rates in every year except 2006.
Table 4.
Temporal characteristics of agricultural carbon emission during 1999–2014 in Henan province.
Based on the temporal characteristics of agricultural carbon emissions, the changes in agricultural carbon emission can be divided into three phases. The first phase was 1999–2005, when there were rapid increases in agricultural carbon emissions, from 16.6079 million tons in 1999 to 19.8227 million tons in 2005. This reflected an average annual growth rate of approximately 3%. The second phase was a sharp decline in agricultural carbon emissions from 2005 to 2006, reaching a low of 16.4095 million tons in 2006. During this period, the growth rate was −17.22%; the drop was due to a sharp decline of cows, goats, and sheep. The third phase, between 2006 and 2015, reflected an overall steady growth phase; the agricultural carbon emissions increased from 16.4095 million tons in 2006 to 18.0697 million tons in 2015. This reflected an average annual growth rate of approximately 1.09%, and can be attributed to the increase of agricultural material inputs and decline of livestock farming.
Analyzing the composition of agricultural carbon emissions shows that the proportion of carbon emissions from livestock farming was highest, with an average proportion up to 61.01%. Livestock farming is the most important carbon emission source in Henan province. From 1999 to 2015, the proportion of carbon emission from agricultural material consistently decreased, from 70.15% in 1999 to 52.37% in 2015. Carbon emission from agricultural material was the second highest contributor to total emissions, with an average proportion of up to 38.86% of the total. The proportion of carbon emissions from livestock farming steadily increased, from 29.73% in 1999 to 47.49% in 2014; however, the annual growth rate fluctuated significantly. The proportion of carbon emissions generated by the soil surface was relatively small and stable; the change amplitude ranged from 0.11 to 0.14%. However, the amount of carbon emissions generated by the soil surface continued to increase at an average annual growth rate of 1.49%.
3.2. The Decoupling Elasticity Analysis
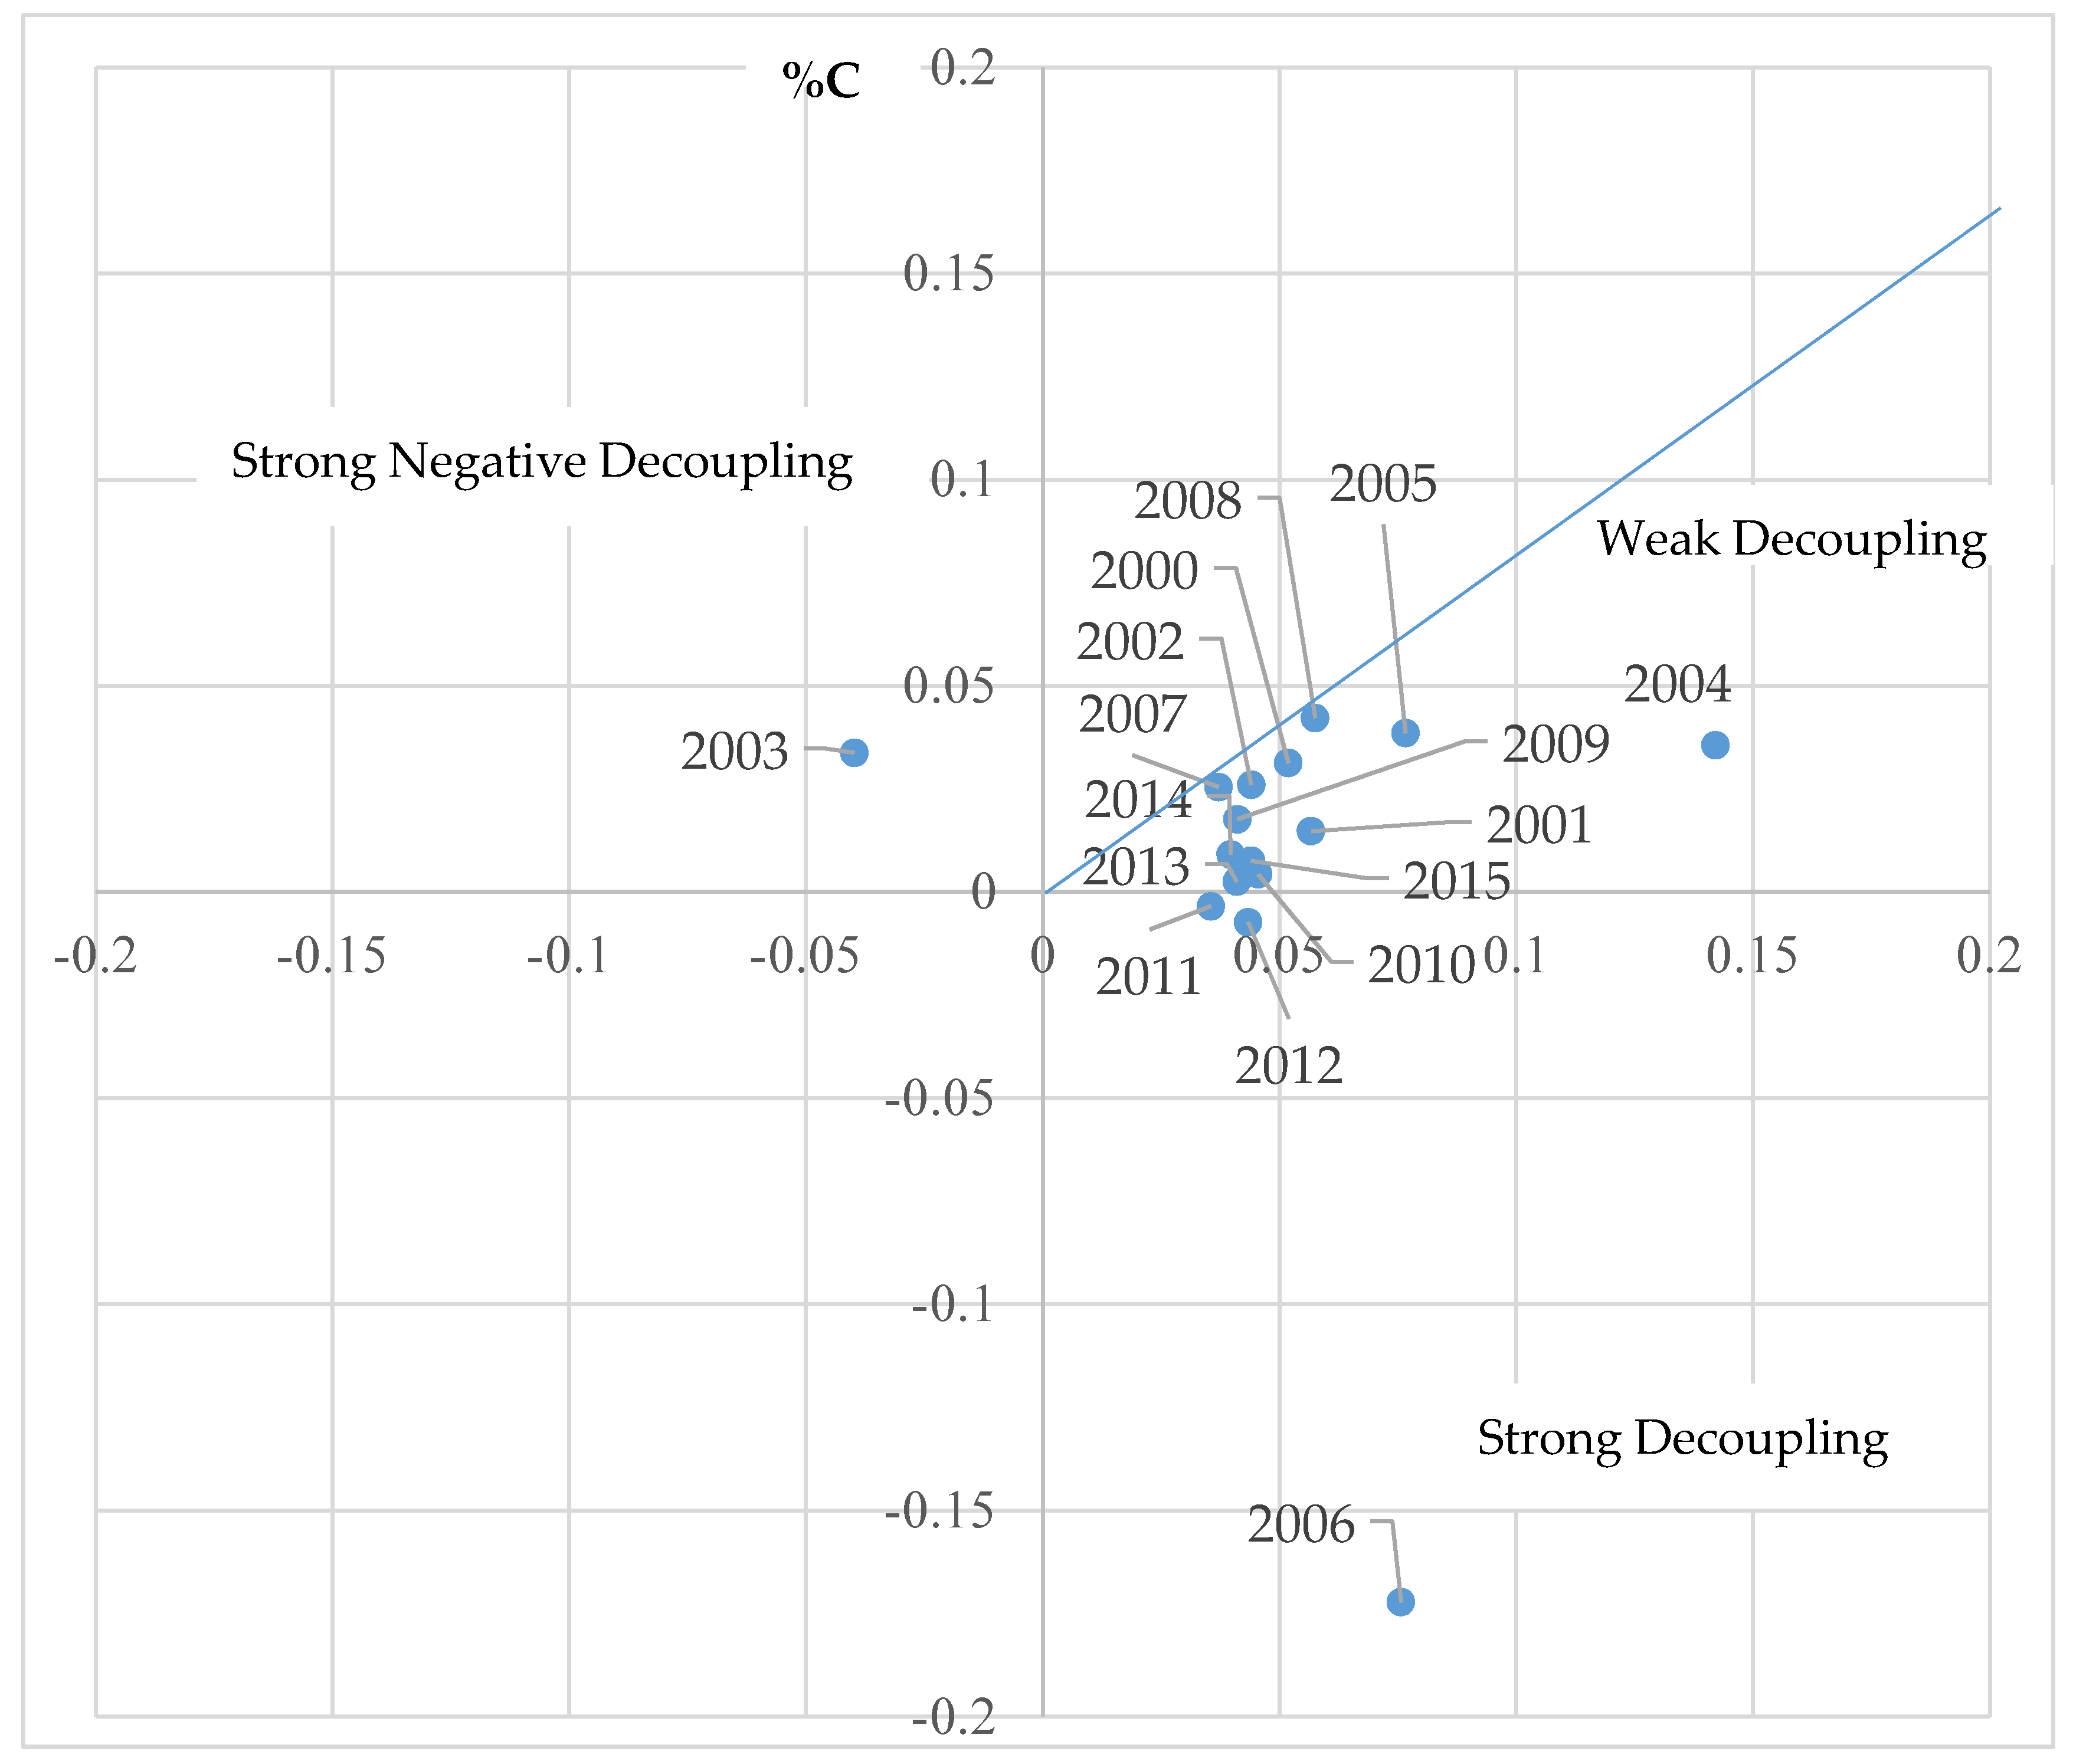
The relationship between carbon emissions and economic growth was analyzed using the carbon emissions measurement method and the Tapio model. This allowed the calculation of the agricultural carbon emission and decoupling elasticity values in Henan province. Figure 2 and Table 5 show the results of decoupling elasticity values and decoupling status. Overall, the decoupling relationship between agricultural carbon emissions and economic output was dominated by weak decoupling during the study period. This means the agricultural carbon emissions grew slowly, while economic output was relatively stable; the agricultural carbon emissions growth rate was significantly lower than the economic output growth rate.
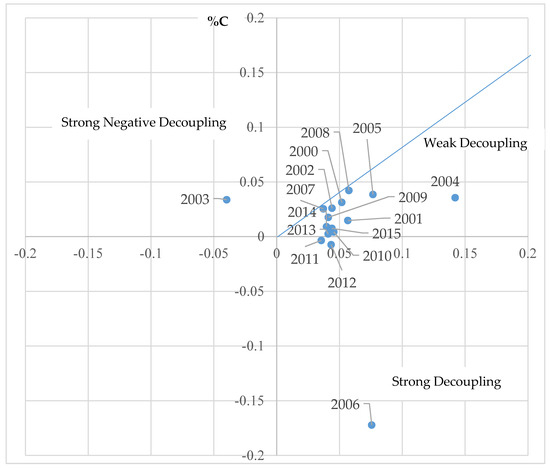
Figure 2.
The decoupling status between agricultural carbon emission and economic output in Henan province.
Table 5.
The results of decoupling elasticity values.
These results show that the Henan province has achieved some success in reducing carbon emissions in the agriculture industry. The decoupling status was weak decoupling in 2000–2002, 2004–2005, 2007–2010, and 2013–2015. Strong decoupling appeared in 2006 and 2011–2012; there was a negative variation in the percent of carbon emissions. This means that the carbon emissions declined compared with 2005; there was a positive variation in the percent GDP. This means that agricultural economic output continued to grow.
3.3. Decomposition Analysis of Agricultural Carbon Emissions
Using the LMDl decomposition model, we analyzed the driving factors and annual impact on the changes in agricultural carbon emissions from 1999 to 2015. Table 6 shows the results of this analysis, and presents the impacts of farming-animal husbandry carbon intensity, agricultural structure, agricultural labor productivity, and labor on agricultural carbon emissions.
Table 6.
The decomposition result of driving factors of agricultural carbon emissions.
A positive value indicates a positive influence on increasing carbon emissions; a negative value indicates a negative influence on decreasing carbon emissions. Table 6 shows that developing agricultural economic efficiencies is the main factor driving the growth of agricultural carbon emissions. In particular, agricultural labor productivity can greatly promote increased carbon emissions. The rapid promotion of the agricultural economy led to consistently increasing agricultural carbon emissions. During the study period, agricultural labor productivity caused cumulative carbon emissions of up to 18.6413 million tons. This demonstrated that the annual contribution was 1.1651 million tons, which was 12.8 times the cumulative increasing carbon emissions. The influence of agricultural labor productivity fluctuated significantly; however, the overall carbon emissions caused by agricultural labor productivity tended to gradually decrease.
Table 6 also reveals that three other factors can decrease carbon emissions: farming-animal husbandry carbon intensity, agricultural structure, and labor. These factors dampened the overall growth of carbon emissions. Of these, farming-animal husbandry carbon intensity had the strongest inhibitive effect on carbon emissions growth. During the study period, farming-animal husbandry carbon intensity caused cumulative carbon emissions of up to −12.2525 million tons; this reflects an annual contribution of −0.7658 million tons, and is −8.38 times as much as the cumulatively increased carbon emissions. The effect of farming-animal husbandry carbon intensity reaches the highest value of 1.3372 million tons in 2003, and decreased to the lowest value of −4.7311 in 2006. The former analysis supports these values. Compared with 2000, the labor factor cumulatively decreased by 4.4702 million tons of carbon emissions from 2000 to 2015. In other words, if other factors remain the same, the growth in the labor factor contributed to the decline in agricultural carbon emissions at an average rate of 0.2794 million tons per year. During the period, the agricultural structure factor cumulatively cut 0.4568 million tons of carbon emissions, which had a minimal impact on reducing carbon emissions.
The agricultural labor productivity factor is likely to remain a dominant factor leading to increased agricultural carbon emissions in the short-term. Other key actions to reduce agricultural carbon emissions may include: reducing the proportion of animal husbandry; transforming the mode of agricultural production and structure; focusing on break-through technologies to save energy, conserve water, save land and fertilizers, and reduce drug use; and increasing recycling. All these approaches promote sustainable agricultural development. Finally, China should expand its leading industries and organize the production of primary agricultural products, including grain, cotton, oil, poultry, and vegetables. This would also limit livestock farming.
4. Discussion
This study used Henan province as a case study to explore the temporal characteristics and driving factors of agricultural carbon emissions. We then analyzed the relationship between carbon emissions and economic output based on data from 1999 to 2015; this was done by studying decoupling elasticity with the LMDI model. The analysis results lead to the following conclusions.
The total agricultural carbon emissions increased from 16.6079 million tons in 1999 to 18.0697 million tons in 2015, which is an increase of 8.80%. Carbon emissions from livestock farming are the biggest contributor, followed by carbon emissions from agricultural material and the soil surface. The change of agricultural carbon emissions can be divided into three phases: the rapidly increasing phase (1999–2005); the sharply declining phase (2005–2006); and an overall steadily growing phase (2006–2015).
Overall, the decoupling relationship between agricultural carbon emissions and economic output was dominated by weak decoupling during the study period. This suggests that Henan province achieved some success in reducing carbon emissions from the agriculture industry. Weak decoupling occurred in 2000–2002, 2004–2005, 2007–2010, and 2013–2015. Strong decoupling appeared in 2006 and 2011–2012. There was a negative variation in the percentage of carbon emissions, meaning the carbon emissions declined compared with 2005. However, in contrast with 2006, there was a negative variation in the percentage of economic output in 2003, resulting in a strong negative decoupling status.
The development of agricultural economic efficiencies is the main driving factor of the growth of agricultural carbon emissions. In particular, agricultural labor productivity (per capita agricultural output) significantly promotes an increase in carbon emissions. The influence of agricultural labor productivity fluctuated significantly; however, the overall carbon emissions caused by agricultural labor productivity tended to gradually decrease. In addition, the farming-animal husbandry carbon intensity had the strongest inhibitive effect on carbon emissions growth. During the study period, farming-animal husbandry carbon intensity caused cumulative carbon emissions of up to −12.2525 million tons. This results in an annual contribution of −0.7658 million tons, which is −8.38 times the cumulatively increasing carbon emissions. The growth in the labor factor contributed to the decline in agricultural carbon emissions, at an average rate of 0.2794 million tons per year. During this period, the agricultural structure factor cumulatively cut 0.4568 million tons of carbon emissions, reflecting a minimal impact on reducing carbon emissions.
Acknowledgments
The current work is supported by “the Fundamental Research Funds for the Central Universities (27R1706019B)” and the Recruitment Talent Fund of China University of Petroleum (East China) (05Y16060020). We have received the grants in support of our research work. The funds we have received for covering the costs to publish in open access.
Author Contributions
Min Su conceived and designed the experiments and wrote the paper. All authors read and approved the final manuscript. Rui Jiang performed the experiments, Rongrong Li analyzed the data, and contributed reagents/materials/analysis tools.
Conflicts of Interest
The authors declare no conflict of interest.
References
- IPCC. The Contribution of Working Group I to the Second Assessment Report of the Intergovernmental Panel on Climate Change; Climate Change 1995; Cambridge University Press: New York, NY, USA, 1996. [Google Scholar]
- Zaman, K.; Khan, M.M.; Ahmad, M.; Khilji, B.A. The relationship between agricultural technologies and carbon emissions in Pakistan: Peril and promise. Econ. Model. 2012, 29, 1632–1639. [Google Scholar] [CrossRef]
- Pratt, C.; Redding, M.; Hill, J.; Shilton, A.; Chung, M.; Guieysse, B. Good science for improving policy: Greenhouse gas emissions from agricultural manures. Anim. Prod. Sci. 2014, 55, 691–701. [Google Scholar] [CrossRef]
- IPCC. Contribution of Working Group III to the Fourth Assessment Report of the Intergovernmental Panel on Climate Change; Climate Change 2007; Cambridge University Press: London, UK, 2007. [Google Scholar]
- Lin, E. Climate Change and Sustainable Development of Agriculture; Beijing Press: Beijing, China, 2001. (In Chinese) [Google Scholar]
- Wang, Q.; Chen, X. Energy policies for managing China’s carbon emission. Renew. Sustain. Energy Rev. 2015, 50, 470–479. [Google Scholar] [CrossRef]
- Wang, Q.; Chen, Y. Energy saving and emission reduction revolutionizing China’s environmental protection. Renew. Sustain. Energy Rev. 2010, 14, 535–539. [Google Scholar] [CrossRef]
- Wang, Q.; Chen, X. China’s electricity market-oriented reform: From an absolute to a relative monopoly. Energy Policy 2012, 51, 143–148. [Google Scholar] [CrossRef]
- Li, Q.; Han, Y.F. Decoupling Effect of Agricultural Carbon Emission in Anhui Province and Factors Influencing the Emission. J. Anhui Agric. Univ. 2016, 24. (In Chinese) [Google Scholar]
- Linda, J. Climate Change and Agricultural Sustainable Development; Beijing Press: Beijing, China, 2001; p. 35. (In Chinese) [Google Scholar]
- Johnson, J.M.; Franzluebbers, A.J.; Weyers, S.L.; Reicosky, D.C. Agricultural opportunities to mitigate greenhouse gas emissions. Environ. Pollut. 2007, 150, 107–124. [Google Scholar] [CrossRef] [PubMed]
- Gifford, R.M. Energy in Different Agricultural Systems: Renewable and Nonrenewable Sources; Springer: Berlin/Heidelberg, Germany, 1984; pp. 84–112. [Google Scholar]
- Pimentel, D. Energy inputs in production agriculture. Energy World Agric. 1992, 184, 103–117. [Google Scholar]
- Marland, G.; West, T.O.; Schlamadinger, B.; Canella, L. Managing soil organic carbon in agriculture: The net effect on greenhouse gas emissions. Tellus Ser. B Chem. Phys. Meteorol. 2003, 55, 613–621. [Google Scholar] [CrossRef]
- Tian, Y.; Zhang, J.B.; He, Y.Y. Research on spatial-temporal characteristics and driving factor of agricultural carbon emissions in China. J. Integr. Agric. 2014, 13, 1393–1403. [Google Scholar] [CrossRef]
- Gomiero, T.; Paoletti, M.G.; Pimentel, D. Energy and environmental issues in organic and conventional agriculture. Crit. Rev. Plant Sci. 2008, 27, 239–254. [Google Scholar] [CrossRef]
- Wise, M.; Calvin, K.; Thomson, A.; Clarke, L.; Bondlamberty, B.; Sands, R.; Smith, S.J.; Janetos, A.; Edmonds, J. Implications of limiting CO2 concentrations for land use and energy. Science 2009, 324, 1183–1186. [Google Scholar] [CrossRef] [PubMed]
- Cbm, A.; Bhatti, J.S.; Chang, S.X.; Sidders, D. Land use change effects on ecosystem carbon balance: From agricultural to hybrid poplar plantation. Agric. Ecosyst. Environ. 2011, 141, 342–349. [Google Scholar]
- Galford, G.L.; Cerri, C.C. Historical carbon emissions and uptake from the agricultural frontier of the Brazilian Amazon. Ecol. Appl. 2011, 21, 750–763. [Google Scholar] [CrossRef] [PubMed]
- Qin, K.C. Construction of Low-Carbon Agriculture. Manag. Eng. 2012, 9, 87–90. [Google Scholar]
- Hong, L. The transformation of agricultural economy development mode under the background of low carbon economy—Aking guangdong as an example. Chin. J. Agric. Resour. Reg. Plan. 2016, 37, 215–219. [Google Scholar]
- Weng, B.; Lei, J.; Xibin, H.U. Develop low-carbon agriculture by relying on scientific and technological progress. Ecol. Environ. Sci. 2010, 19, 1491–1501. [Google Scholar]
- Li, Y.Y. Innovation of China’s circular agricultural development in the perspective of low carbon economy. Agric. Res. 2011, 3, 5–8. [Google Scholar]
- Yu, W.; Wu, F.; Peng, X.; Tong, X. Analysis of economic efficiency and energy flow characteristics of a circular and integrated agriculture model in the Loess hilly region. Trans. Chin. Soc. Agric. Eng. 2016, 32, 199–206. [Google Scholar]
- Colleran, E. Hygienic and Sanitation Requirements in Biogas Plants Treating Animal Manures or Mixtures of Manures and Other Organic Wastes. Anaerobic Digestion: Making Energy and Solving Modern Waste Problem. 2000, pp. 77–86. Available online: http://americanbiogascouncil.org/pdf/Pathogen_kills%20in%20AD.pdf (accessed on 10 December 2017).
- Mccarl, B.A.; Schneider, U.A. U.S. Agriculture’s role in a greenhouse gas emission mitigation world: An economic perspective. Appl. Econ. Perspect. Policy 2000, 22, 134–159. [Google Scholar] [CrossRef]
- Peters, M.; House, R.; Lewandrowski, J.; Mcdowell, H. Economic impacts of carbon charges on U.S. Agriculture. Clim. Chang. 2001, 50, 445–473. [Google Scholar] [CrossRef]
- Pugh, T.A.M.; Arneth, A.; Olin, S.; Ahlström, A.; Bayer, A.D.; Klein Goldewijk, K.; Lindeskog, M.; Schurgers, G. Simulated carbon emissions from land-use change are substantially enhanced by accounting for agricultural management. Environ. Res. Lett. 2015, 10, 124008. [Google Scholar] [CrossRef]
- Wang, Q.; Li, R. Journey to burning half of global coal: Trajectory and drivers of China’s coal use. Renew. Sustain. Energy Rev. 2016, 58, 341–346. [Google Scholar] [CrossRef]
- Wang, Q.; Li, R. Sino-Venezuelan oil-for-loan deal—The Chinese strategic gamble? Renew. Sustain. Energy Rev. 2016, 64, 817–822. [Google Scholar] [CrossRef]
- Wang, Q.; Li, R. Drivers for energy consumption: A comparative analysis of China and India. Renew. Sustain. Energy Rev. 2016, 62, 954–962. [Google Scholar] [CrossRef]
- Wang, Q.; Li, R. Natural gas from shale formation: A research profile. Renew. Sustain. Energy Rev. 2016, 57, 1–6. [Google Scholar] [CrossRef]
- Wang, Q. Effective policies for renewable energy—The example of China’s wind power—Lessons for China’s photovoltaic power. Renew. Sustain. Energy Rev. 2010, 14, 702–712. [Google Scholar] [CrossRef]
- Wang, Q.; Chen, Y. Status and outlook of China’s free-carbon electricity. Renew. Sustain. Energy Rev. 2010, 14, 1014–1025. [Google Scholar] [CrossRef]
- Wu, X.R.; Zhang, J.B.; Tian, Y.; Li, P. Provincial agricultural carbon emissions in China: Calculation, performance change and influencing factors. Resour. Sci. 2014, 36, 129–138. [Google Scholar]
- Tian, Y.; Bo, L.I.; Zhang, J.B. Research on stage characteristics and factor decomposition of agricultural land carbon emission in China. J. China Univ. Geosci. 2011, 11, 59–63. [Google Scholar]
- Duan, H.P.; Zhang, Y.; Zhao, J.B.; Bian, X.M. Carbon footprint analysis of farmland ecosystem in China. J. Soil Water Conserv. 2011, 25, 203–208. [Google Scholar]
- Zhou, J.B.; Jiang, M.M.; Chen, G.Q. Estimation of methane and nitrous oxide emission from livestock and poultry in China during 1949–2003. Energy Policy 2007, 35, 3759–3767. [Google Scholar] [CrossRef]
- Liu, L.; Wang, S.; Wang, K.; Zhang, R.; Tang, X. LMDI decomposition analysis of industry carbon emissions in Henan Province, China: Comparison between different 5-year plans. Nat. Hazards 2016, 80, 997–1014. [Google Scholar] [CrossRef]
- Zhao, R.Q.; Liu, Y.; Ding, M.L.; Jiao, S.X. Research on carbon source and sink of farmland ecosystem in Henan Province. J. Henan Agric. Sci. 2010, 7, 40–44. [Google Scholar]
- Li, Y.-L.; Liang, H.; Liang, B.S. Factor decomposition and correlation analysis on the carbon emissions in Henan Province. J. Henan Agric. Univ. 2011, 45, 605–610. [Google Scholar]
- Zhang, M.; Tan, J.; Huang, X.; Lai, L. A gis-based approach for estimating land use related carbon emissions—A case study in Henan Province. In Proceedings of the International Conference on Geoinformatics, Kaifeng, China, 20–22 June 2013; pp. 1–4. [Google Scholar]
- Wang, X.; Qin, Y.; Jiang, X.; Sun, Y. Study for the carbon emission influencing factors of Henan province based on LMDI model. In Proceedings of the International Conference on Geoinformatics, Kaifeng, China, 20–22 June 2013; pp. 1–5. [Google Scholar]
- Peng, S.L.; Xie, H.; Zhao, G.Q. Decoupling analysis of economic growth and carbon emissions in Henan Province. Adv. Mater. Res. 2015, 1073, 2545–2548. [Google Scholar] [CrossRef]
- Liu, J.C. An empirical study on decoupling relation between carbon emissions and economic growth—A case study of Henan Province. Econ. Surv. 2014, 31, 132–136. [Google Scholar]
- Zhao, Q. Low carbon economy and thinking of agricultural development. Ecol. Environ. Sci. 2009, 18, 1609–1614. [Google Scholar]
- Li, Y.C.; Lin, E.D.; Zhen, X.L. Advances in methods of agricultural greenhouse gas inventories. Adv. Earth Sci. 2007, 2, 335–346. [Google Scholar]
- Qi, Y.-C.; Dong, Y.-S. Nitrous oxide emissions from soil and some influence factors. Acta Geogr. Sin. 1999, 54, 534–542. (In Chinese) [Google Scholar]
- Tian, Y.; Zhang, J.; Li, B. Agricultural carbon emissions in China: Calculation, spatial-temporal comparison and decoupling effects. Resour. Sci. 2012, 34, 2097–2105. [Google Scholar]
- LI, Q.; Han, Y. Decoupling effect of agricultural carbon emission in Anhui Province and factors influencing the emission. J. Anhui Agric. Univ. 2016, 2, 6. [Google Scholar]
- Tian, Y.Z.; Zhang, J.B. Regional differentiation research on net carbon effect of agricultural production in China. J. Nat. Resour. 2013, 28, 1298–1309. [Google Scholar]
- Song, D.-Y.; Liu, Z.B. The factor decomposition and periodic fluctuations of carbon emission in China. China Popul. Resour. Environ. 2009, 19, 18–24. [Google Scholar]
- Wang, Q. China should aim for a total cap on emissions. Nature 2014, 512, 115. [Google Scholar] [CrossRef] [PubMed]
- Wang, Q.; Li, R. Impact of cheaper oil on economic system and climate change: A SWOT analysis. Renew. Sustain. Energy Rev. 2016, 54, 925–931. [Google Scholar] [CrossRef]
- Greenhouse Gas Inventory: IPCC Guidelines for National Greenhouse Gas Inventories; United Kingdom Meteorological Office: Bracknell, UK, 2006.
- Huang, M.; Jiang, Q.E. Study on the Measurement of Carbon Emission in Zhejiang: The Comparison of Consumption-based and Production-based Emission. East China Econ. Manag. 2012, 2, 5. [Google Scholar]
- Zhang, L.; Chen, S.; Zhu, Y.; Xu, X. The measurement of carbon emission effect of construction land changes in Anhui Province based on the extended LMDI model. J. Resour. Ecol. 2012, 4, 186–192. [Google Scholar]
- Pereira, A.B.; Utsumi, S.A.; Dorich, C.D.; Brito, A.F. Integrating spot short-term measurements of carbon emissions and backward dietary energy partition calculations to estimate intake in lactating dairy cows fed ad libitum or restricted. J. Dairy Sci. 2015, 98, 8913–8925. [Google Scholar] [CrossRef] [PubMed]
- Zhi, J.; Gao, J. Analysis of carbon emission caused by food consumption in urban and rural inhabitants in China. Prog. Geogr. 2009, 28, 1–6. [Google Scholar]
- Wang, Z. Estimation of nitrous oxide emission of farmland in China. Rural Eco-Environ. 1997, 13, 51–55. [Google Scholar]
- Xiong, Z. The effects of summer legume crop cultivation on nitrous oxide emissions from upland farmland. Sci. Agric. Sin. 2002, 35, 977–981. [Google Scholar]
- Pang, J.; Wang, X.; Mu, Y.; Ouyang, Z.; Zhang, H.; Lu, F.; Liu, W. Nitrous oxide emissions from winter wheat field in the Loess Plateau. Acta Ecol. Sin. 2011, 6, 1896–1903. [Google Scholar]
- Wang, S.; Su, W. Estimation of nitrous oxide emission and its future change in China. Environ. Sci. 1993, 3, 12. [Google Scholar] [CrossRef]
- Qiu, W.; Liu, J.; Chengxiao, H.U.; Tan, Q. Comparison of nitrous oxide emission from bare soil and planted vegetable soil. Ecol. Environ. Sci. 2010, 19, 2982–2985. [Google Scholar]
- Tian, J.; Yang, H.; Xiang, P.; Liu, D.; Li, L. Drivers of agricultural carbon emissions in Hunan Province, China. Environ. Earth Sci. 2016, 75, 1–17. [Google Scholar] [CrossRef]
- Tapio, P. Towards a theory of decoupling: Degrees of decoupling in the EU and the case of road traffic in Finland between 1970 and 2001. Transp. Policy 2005, 12, 137–151. [Google Scholar] [CrossRef]
- Gray, D.; Anable, J.; Illingworth, L.; Graham, W. Decoupling the Link between Economic Growth, Transport Growth and Carbon Emissions in Scotland. 2006. Available online: https://www.researchgate.net/publication/267221393 (accessed on 31 December 2014).
- Li, W.; Sun, S.; Li, H. Decomposing the decoupling relationship between energy-related CO2 emissions and economic growth in China. Nat. Hazards 2015, 79, 977–997. [Google Scholar] [CrossRef]
- Arrow, K.; Bolin, B.; Costanza, R.; Dasgupta, P.; Folke, C.; Holling, C.S.; Jansson, B.O.; Levin, S.; Mäler, K.G.; Perrings, C. Economic growth, carrying capacity, and the environment. Ecol. Appl. 1996, 268, 89–90. [Google Scholar]
- De Bruyn, S.M.; van den Bergh, J.C.; Opschoor, J.B. Economic growth and emissions: Reconsidering the empirical basis of environmental Kuznets curves. Ecol. Econ. 1998, 25, 161–175. [Google Scholar] [CrossRef]
- Yang, K.; Chen, B.; Tang, X. Decoupling relationship between cultivated land occupation by construction and economic growth in China during 1998–2007. China Popul. Resour. Environ. 2010, 8, 38–46. [Google Scholar]
- Ren, S.; Hu, Z. Effects of decoupling of carbon dioxide emission by Chinese nonferrous metals industry. Energy Policy 2012, 43, 407–414. [Google Scholar] [CrossRef]
- Ang, B.W.; Liu, F.; Chew, E.P. Perfect decomposition techniques in energy and environmental analysis. Energy Policy 2003, 31, 1561–1566. [Google Scholar] [CrossRef]
- Ang, B.W. Decomposition analysis for policymaking in energy: Which is the preferred method? Energy Policy 2004, 32, 1131–1139. [Google Scholar] [CrossRef]
- Ang, B.; Liu, N. Energy decomposition analysis: IEA model versus other methods. Energy Policy 2007, 35, 1426–1432. [Google Scholar] [CrossRef]
- Liu, L.C.; Fan, Y.; Wu, G.; Wei, Y.M. Using LMDI method to analyze the change of China’s industrial CO2 emissions from final fuel use: An empirical analysis. Energy Policy 2007, 35, 5892–5900. [Google Scholar] [CrossRef]
- National Bureau of Statistics of China. China Rural Statistical Yearbook 2015; China Statistics Press: Beijing, China, 2015. (In Chinese) [Google Scholar]
- Henan Province Bureau of Statistics. Henan Statistical Yearbook-2015; Henan Province Bureau of Statistics: Zhengzhou, China, 2015. (In Chinese)
© 2017 by the authors. Licensee MDPI, Basel, Switzerland. This article is an open access article distributed under the terms and conditions of the Creative Commons Attribution (CC BY) license (http://creativecommons.org/licenses/by/4.0/).