Article

A Spatial Disaster Assessment Model of Social Resilience Based on Geographically Weighted Regression

1
Department of Civil and Environmental Engineering, Seoul National University, Seoul 08826, Korea
2
Department of Building, National University of Singapore, Singapore 117566, Singapore
*
Author to whom correspondence should be addressed.
Sustainability 2017, 9(12), 2222; https://doi.org/10.3390/su9122222
Submission received: 6 October 2017 / Revised: 27 November 2017 / Accepted: 28 November 2017 / Published: 4 December 2017
(This article belongs to the Special Issue Management Strategies and Innovations for Sustainable Construction)

Abstract

:
Since avoiding the occurrence of natural disasters is difficult, building ‘resilient cities’ is gaining more attention as a common objective within urban communities. By enhancing community resilience, it is possible to minimize the direct and indirect losses from disasters. However, current studies have focused more on physical aspects, despite the fact that social aspects may have a closer relation to the inhabitants. The objective of this paper is to develop an assessment model for social resilience by measuring the heterogeneity of local indicators that are related to disaster risk. Firstly, variables were selected by investigating previous assessment models with statistical verification. Secondly, spatial heterogeneity was analyzed using the Geographically Weighted Regression (GWR) method. A case study was then undertaken on a flood-prone area in the metropolitan city, Seoul, South Korea. Based on the findings, the paper proposes a new spatial disaster assessment model that can be used for disaster management at the local levels.

1. Introduction

Having the potential to cause great damage to individuals and communities, the frequency and severity of natural hazards are expected to increase [1]. Urban communities are more likely to suffer substantially from disaster losses due to their high population density and complex interdependency [2,3]. Meanwhile, losses can differ greatly depending on the ability to reduce initial damage, physical-social impact from damage, or recovery time. A community’s ability to minimize disaster impact is generally defined as ‘disaster resilience’ [4].
The concept of disaster resilience gained wider interest throughout academic researchers after the adoption of the Hyogo Framework for Action (HFA) 2005–2015 “Building the resilience of nations and communities to disasters”. The HFA is the first 10-year international disaster risk-reduction plan to explain, describe, and detail the work that is required from all of the different sectors and actors to reduce disaster losses. The United Nations Office for Disaster Risk Reduction (UNISDR) has adopted the Sendai Framework for Disaster Risk Reduction 2015–2030 (Sendai Framework) to substantially reduce disaster risk and losses: in lives, livelihoods, and health; and in the economic, physical, social, cultural, and environmental assets of persons, businesses, communities, and countries. There are four priorities for action: (1) understanding disaster risk; (2) strengthening disaster risk governance to manage disaster risk; (3) investigating disaster risk reduction for resilience; and (4) enhancing disaster preparedness for effective response and to “Build Back Better” in recovery, rehabilitation, and reconstruction [5]. As the Sendai Framework indicates, understanding disaster risk is important.
Quantifying disaster resilience is one of the methods that is used to understand disaster risk. It has been carried out in many research fields, including structural engineering, social science, and economics [6,7,8,9]. However, due to the complex concept of resilience, refining and developing a more applicable model is still an ongoing issue [10]. In particular, considerable research focuses on examining the components of the physical and built environment, while overall disaster impact should be measured by the interaction of the two aspects of resilience: physical and social [11,12,13]. The social resilience focuses on the economic and cultural aspects; however, there has been little attention paid to identifying and assessing various attributes for defining social resilience [14]. This creates difficulties when applying social characteristics to the disaster management decision-making process. Thus, it is necessary to include and examine the social aspects in order to comprehensively understand disaster resilience. The assessment model should provide practical results so that it can be discussed for actual use, as well as allow for further development of the model itself in relation to its determinants [6,7,15].
This paper develops a practical assessment model of social resilience through the following steps: (1) examine appropriate variables considered to be related to disaster damage; and (2) analyze the impact of spatial heterogeneity of the social attributes by using the Geographically Weighted Regression (GWR) method. A general model for disaster is developed, and a case study involving a natural disaster (a flood) is used for the experiment. Conducting an experimental case study on the Seoul Metropolitan Area (SMA), the authors propose meaningful variables to the resilience during the flood event and distinguish the relationship between the disaster damage and the social resilience.

2. Literature Review

2.1. Physical and Social Resilience

The general concept of resilience emerged from several research studies, ranging from environmental research to material science and engineering, psychology, and sociology. As the concept has been studied extensively, the definition varies depending on the researchers. Holling [16] and Perrings [17] defined resilience as the capacity to absorb stress and shock, embracing the concept of sustainability. Wildavsky [18] defined resilience as the ability to bounce back, coping with unanticipated dangers. Horne and Orr [19] explained that system resilience is the ability of individuals, groups, organizations, and the system as a whole to withstand stresses. Tinch [20] specified similar measures, such as stability, persistence, resistance, non-vulnerability and resilience, while Rose [3] distinguished two types of resilience: inherent resilience in normal circumstances, and adaptive resilience in crisis situations. As such, the definition of disaster resilience is an ongoing topic by researchers.
Traditionally, such resilience studies focused on physical resilience. McAllister [21] addressed resilience related to the built environments during and after disaster events. The objective of the research was to investigate and improve the performance or capacity of the built environment and infrastructure systems while facing to the disaster. Bosher [22] defined the built environment as a tool to cope with the impacts of disaster demands and to mitigate effects of the disaster for the more sustainable city.
While most of the studies primarily focused upon the physical conditions, social, economic, cultural, and educational aspects were also acknowledged to be the cause of physical damage [23]: an alternative paradigm with social perspective emerged recently. The susceptibility of people and communities exposed, along with their social, economic, and cultural abilities against the damages, were considered as the part of this approach [24]. Cutter et al. [12] used social indexes for discovering social vulnerability from disaster. Bruneau et al. [25] defined resilience as the ability of social units to mitigate hazards for earthquake disaster. They divided resilience into three aspects: the ability to reduce failure probability, the ability to reduce consequences from failures (e.g., lives lost, damage, and negative economic and social consequences), and the ability to reduce recovery time to the before-disaster level. The study involved both pre-disaster measures that seek to prevent damage and losses, and post-disaster strategies that cope with minimizing disaster impacts.

2.2. Assessment Model Review

The authors reviewed a range of assessment models on vulnerability and social resilience, and selected models that have variables related to the following categories: human, community, economic, and organizational. The principal used to choose assessment models were brought out by the works of Bruneau et al. [25] and Norris et al. [8]. As the study focuses on the social-economic part of disaster resilience, the technical dimension was excluded as it was defined as the ability of physical systems and components [25]. 10 assessment models were selected among previous studies (Table 1). Although it was possible to check social resilience-related variables through a model review, it could be said that, currently, social resilience studies in disaster management research are mostly limited in their conceptual model building. The previous studies provided various indicators that can have a relationship with disaster resilience; however, it is still difficult to understand the actual influence, or significance, of the variables to the resilience [26]. This creates difficulties in applying social characteristics to the disaster management decision-making process. Therefore, it is necessary to develop an assessment model for more practical implementation so that it can explain the impact of socio-economic attributes to the resilience, and thus be prepared for the hand-on use against the disaster events.

3. Research Methodology

This paper consists of two major parts: the variable selection and spatial heterogeneity analysis (Figure 1). For the variable selection, a review of previous assessment models was firstly carried out to compose a list of candidate variables. Then, a survey of field experts was conducted to identify the appropriate variables. Using the evaluated variables, a spatial heterogeneity analysis was performed. The GWR method was used to check the spatial difference of local disaster resilience on social aspects. In this study, flood scenarios were applied to understand the resilience of the developed model to the local disasters.

3.1. Variable Selection

To measure the spatial heterogeneity of regional social resilience, appropriate and applicable variables needed to be selected as a first step. As shown in the literature review section, the authors reviewed 10 related research models, specifically focusing on a common set of social resilience- and vulnerability-related attributes. A total of 22 variables were identified from the reviewed models, and the variables were then grouped into four categories: human, community, economic, and organizational (Table 2). Variables from RVAT, EPSON, and FVI are majorly human related, and USAID, DRLA/UEH, and FAO included community and economic variables. The domestic studies included some variables that were related to the organizational category. The BRIC model discussed variables from the four categories at a conceptual level.
With the determined 22 variables, the authors then conducted a survey for further variable selection. As the central government (i.e., the Ministry of Public Safety and Security, the Ministry of Land, Infrastructure and Transport) and local government (i.e., Seoul Metropolitan Government) play major roles in disaster management [33], the survey participants have been selected in both fields on the basis of recognition for their administrative expertise in disaster management. 35 experienced persons of government organization evaluated the variables in the survey. The average work experience of the survey participants was 10.58 years, from senior staffs to general managers. The survey asked the importance of each variable to the regional resilience with Likert scale from 1 (never important) to 7 (most important). As a result, the average score of all 22 variables was 4.48, and 10 variables having the score above the average were selected as being significantly important.
The correlation analysis was then conducted using 10 proxy variables (Table 3), since both correlation and multicollinearity analysis needed to be carried out to perform the GWR analysis. Many datasets were collected from Statistics Korea (KOSTAT). In this study, the variable ‘age’ was considered as vulnerable age, thus the number of residents under 5 and over 65 was used for the test. The number of international marriages was counted for ethnic inequality, and the number of social assistance recipients was counted for poor. The number of administrative officers was considered as ‘administrative work’ that explains the administrative working or supporting power for a region. ‘Political power’, the strength of the opinion of the region, was measured by the voting rate of each region. Some of the datasets (social assistance, regional affordability, business environment, population wellness) have been collected from ‘Seoul Survey’ by Seoul Statistics that makes 227 indexes regularly for governmental decision-making.
The Pearson correlation was checked through the implementation by IBM SPSS Statistics 22.0, and a total of five out of 10 variables that had a p-value less than 0.05 were identified to have a significant correlation with the inundated areas during the flood events in Seoul in 2010: population density, age, ethnic inequality, disability, and administrative work. The selected variables were then examined to see whether multicollinearity existed between the variables. The variance inflation factor (VIF) was used to assess the multicollinearity. Generally, if the VIF result is less than 10, it can be assumed that there exists no multicollinearity, meaning that it will not significantly influence the stability of the parameter estimates [34]. The VIF scores of the five variables ranged between 1.096 and 3.357. Thus, all five variables were determined to be used for the regression model.

3.2. Geographically Weighted Regression

GWR is a spatial analysis technique that captures the variation of spatial data to analyze the relationships of points in space [35]. The topological, geometric, or geographic property information can be used for GWR analysis. Through analyzing the spatial dependency of each variable, it is possible to derive information on spatial relationships. The variables can be sorted into independent and dependent types. The relationship between the two types of variables provides information on the spatial heterogeneity. Thus, estimated parameters can be generated for each spatial point through the GWR technique [36]. The equation for the regression model and the estimator is described below:
y i = β 0 ( i ) + β 1 ( i ) x 1 i + β 2 ( i ) x 2 i + β n ( i )   x ni + ε i β ( i ) = ( X T W ( i ) X ) 1 X T W ( i ) Y
where i denotes the coordinates of the points in space, and W ( i ) is a matrix of weights specified to location i , such that observations nearer to i are given greater weight than others. β represents the vector of global parameters to be estimated, y is a vector of observations on the dependent variable, and X is a matrix of independent variables. This equation can check the spatial heterogeneity of local disaster resilience on social aspects.
Software called GWR4 was used, which was developed and programmed by Professor Tomoki Nakaya of the Department of Geography, Ritsumeikan University, Kyoto in Japan [37]. The GWR4 software provides features for model fitting, including conventional Gaussian models and generalized linear models such as geographically weighted Poisson and logistic regression models. In this study, the adaptive bi-square kernel method was used for geographical weighting to estimate local coefficients and a bandwidth size as the observation points of the studied regions consist of irregular distances. The adaptive spatial kernels can reduce the difficulty of estimating parameters due to insufficient variation in small samples by allowing for variations in the density of the data [38]. To clarify local extents for model fitting, the bi-square kernel was selected as it evidently separates non-zero weighting kernels. The bi-square function is considered as a popular choice for the kernel function, in which observations with distances greater than the bandwidth are zero weighted and excluded from any calculation [39,40]. The golden-section search was then applied to automatically search for the optimal bandwidth size. The optimal bandwidth size is determined by means of comparison of model selection indicators with different bandwidth sizes using AICc and AIC (Akaike’s Information Criterion) as a measure to assess the model fitness [41].
The software also provides ordinary least square (OLS) modeling results; it is useful to compare both the GWR and OLS results. The OLS is a method used to estimate parameters in a linear regression model. It uses the method to minimize the sum of squares of the differences between the observation and prediction of variables. The method provides minimum variance estimation under the assumption that errors are normally distributed.

4. Experimental Results

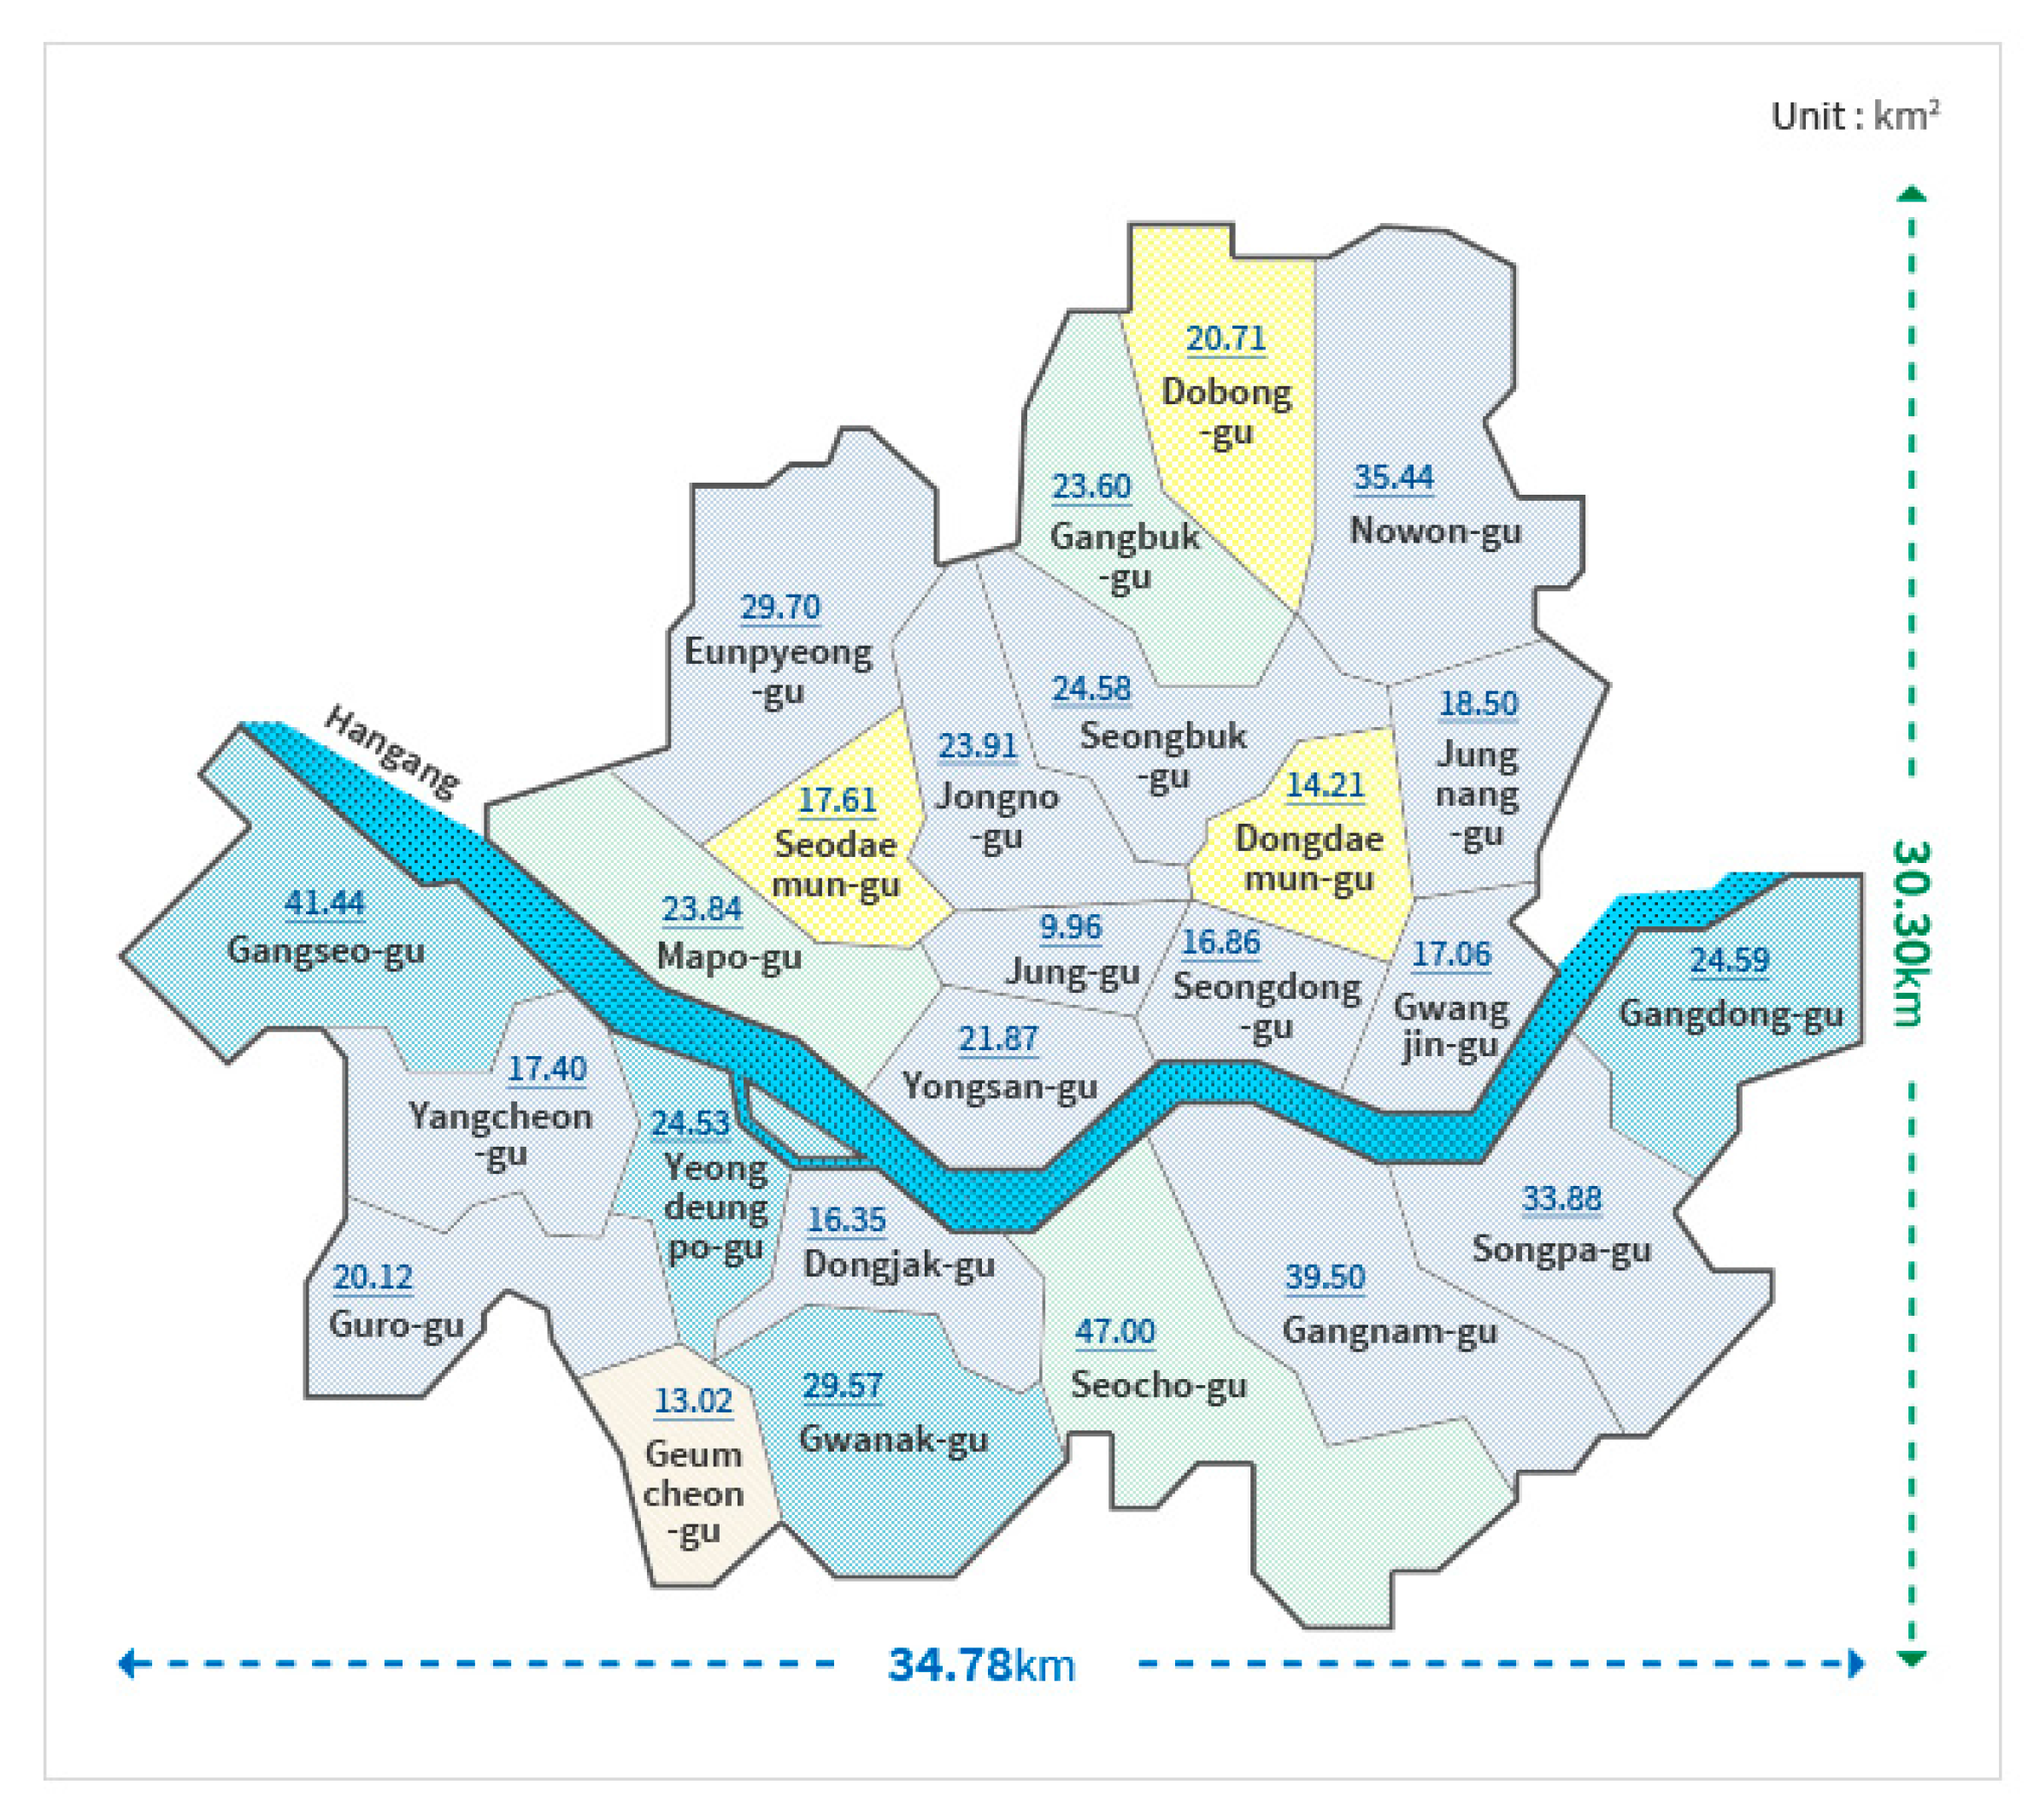
4.1. Case Study Region

Seoul is a city with an intense concentration of political, economic, and other urban functions. Lloyd’s City Risk Index 2015–2025 analyzed the potential impact on the economic output of 301 of the world’s major cities from 18 manmade and natural threats [42]. Seoul was evaluated as being third out of 301 cities for all of the threats, including flood. The expected economic loss is $103.5 billion dollars—2.27% of the total sum of all cities. Nearly 24 million of the nation’s population is settled around the city. There are 25 autonomous districts and 423 administrative “dong” units in Seoul (see Figure 2). Its population is dense, and its buildings and underground networks are intricately structured. Flooding in such a city would result in considerable loss, as well as prohibitive costs and restoration time. In Korea, two thirds of the annual rainfall is typically concentrated during the wet season, from June to September, usually in the form of monsoons, typhoons, or torrential rains.

4.2. Data Collection and Preprocessing

The data used in the case study were collected through public sources. The data of five proxy variables for regression analysis were collected by accessing the Seoul Metropolitan Government department and government websites. The flood-damage data (i.e., inundated area information) were collected through each district offices. Most of the districts only stored the flood-damage data for 2010 and 2011, where Seoul experienced huge storms and heavy rainfalls. The authors used the data of inundated records for 2010 in Seoul.
Before performing regression analysis, all data were standardized to avoid the errors caused by the unit size difference of each variable. Table 4 provides details of the standardization information of proxy variables. In addition, the geographically weighted regression analysis requires coordinates of every data point. In this study, the UTM-K (GRS-80) coordinate system, which is the coordinate designed for the GIS shape file of Seoul districts, was used for the GIS projection of QGIS (Quantum GIS) software.

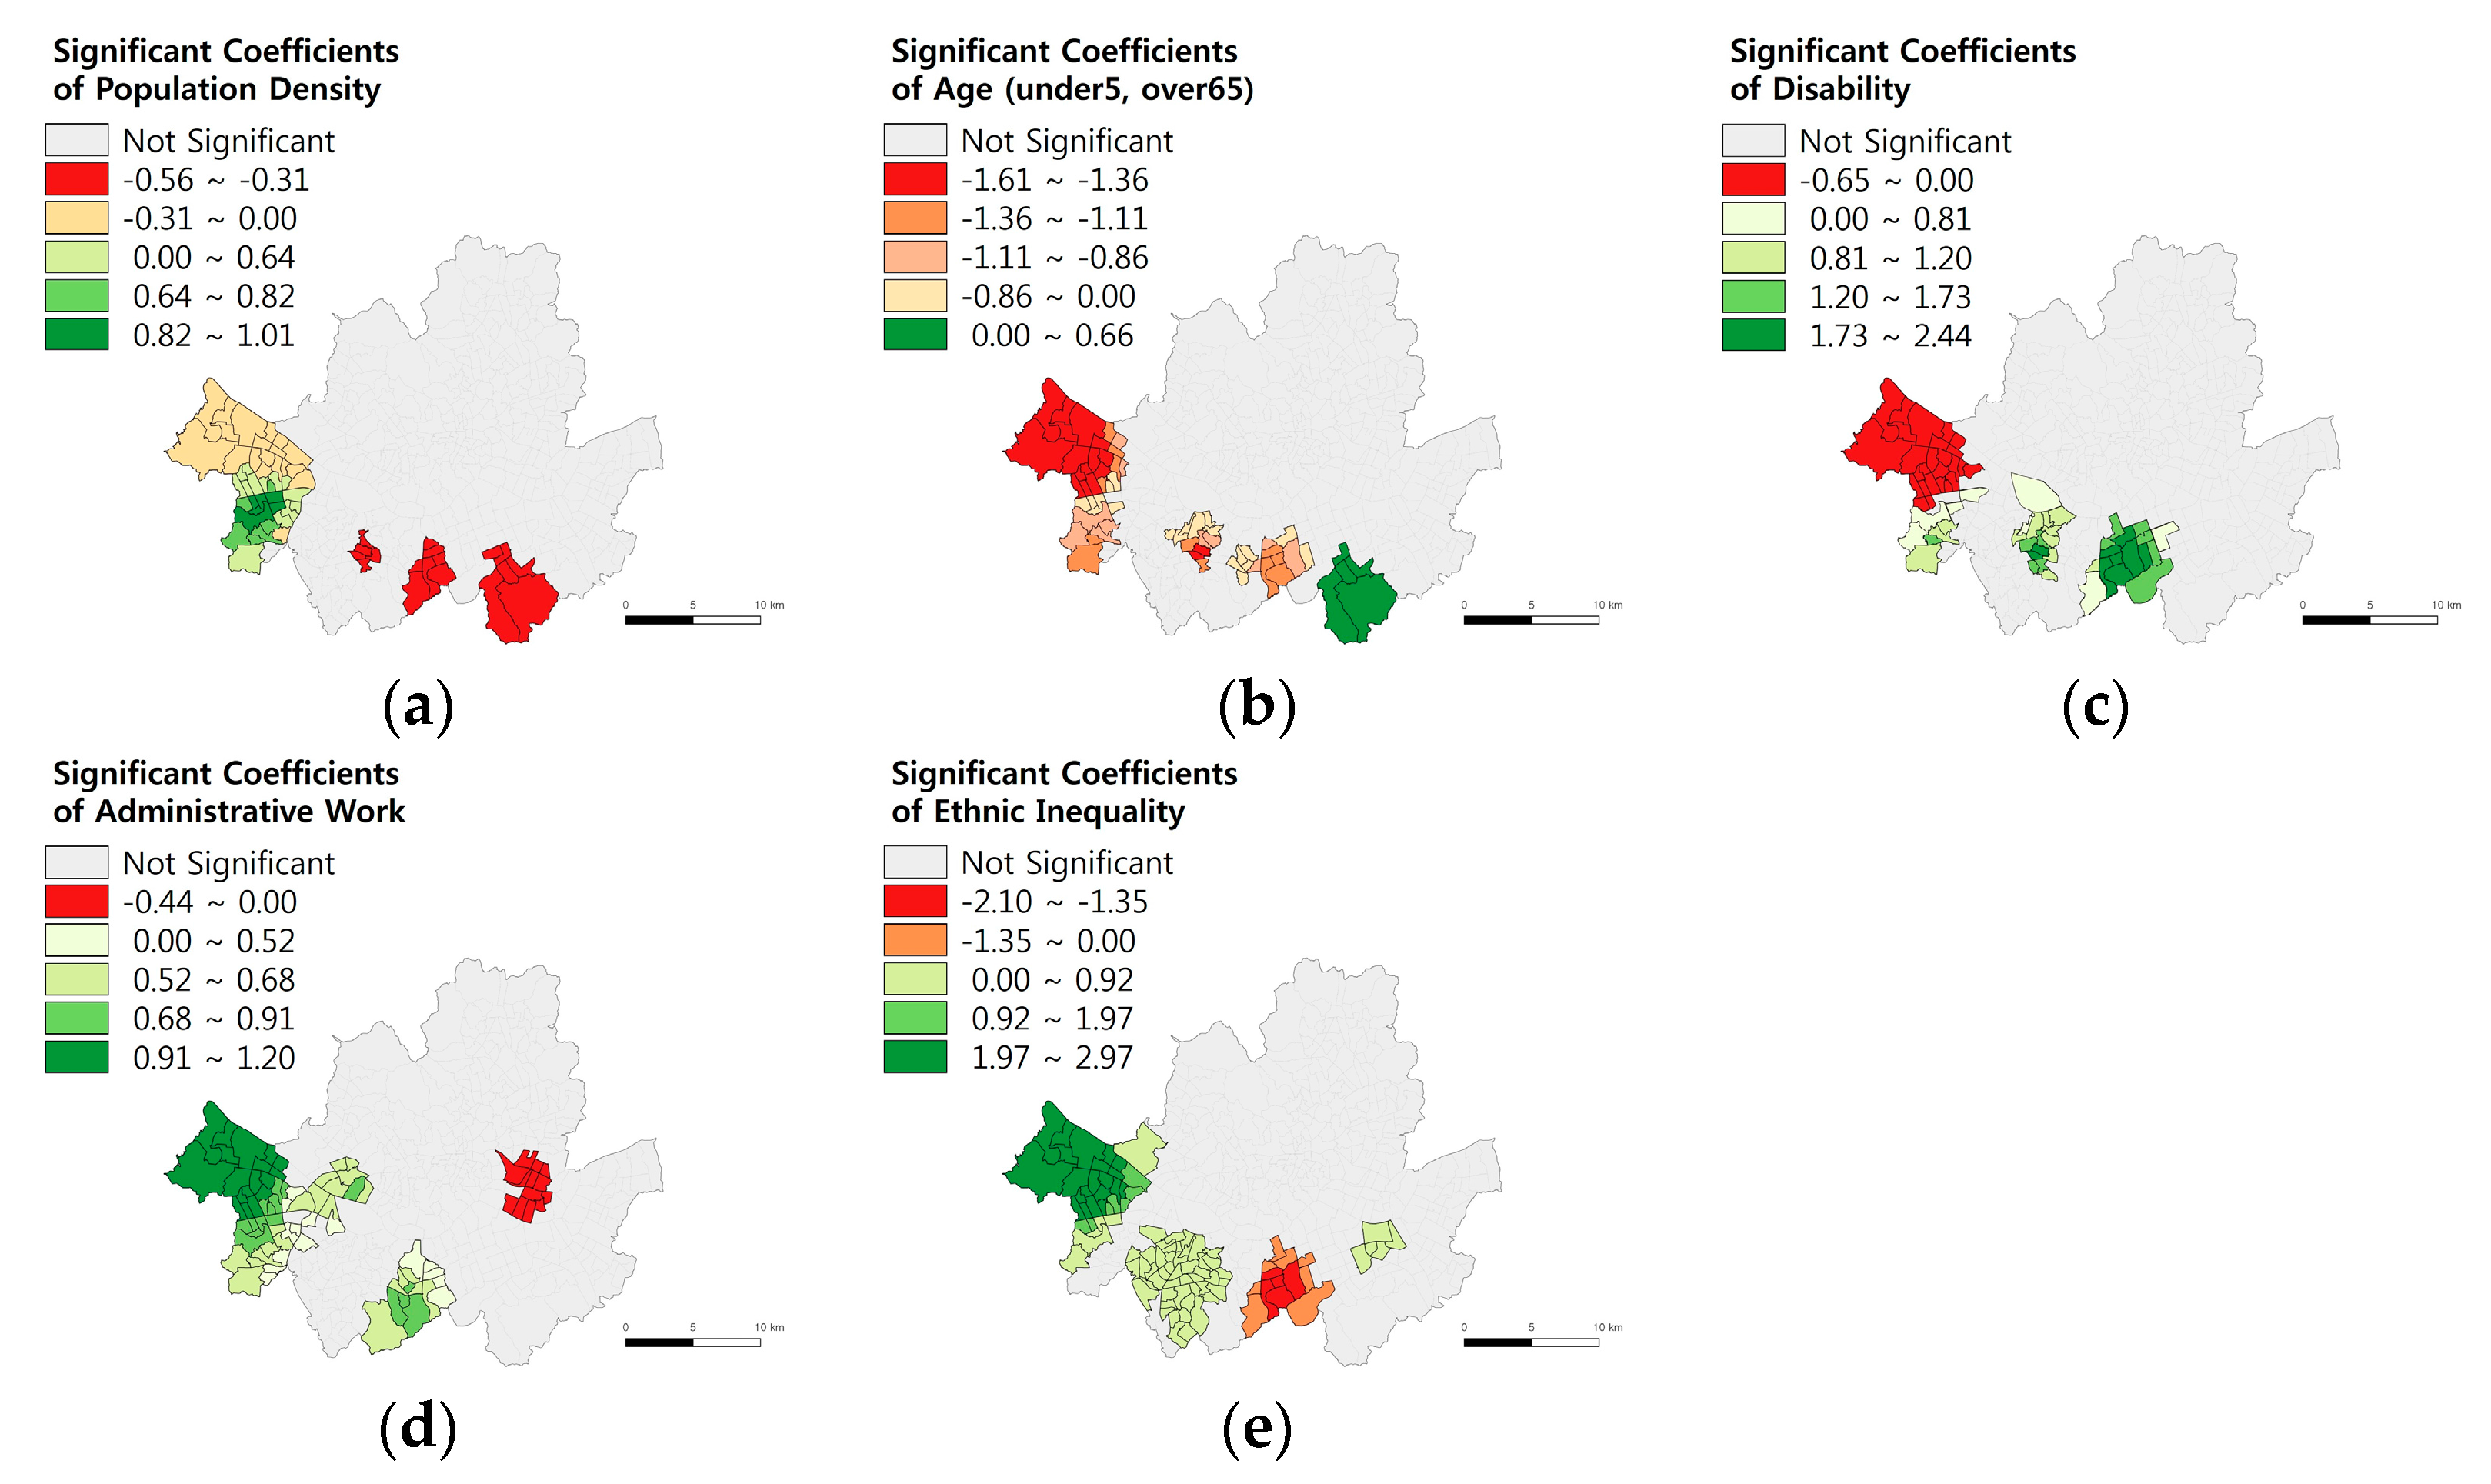
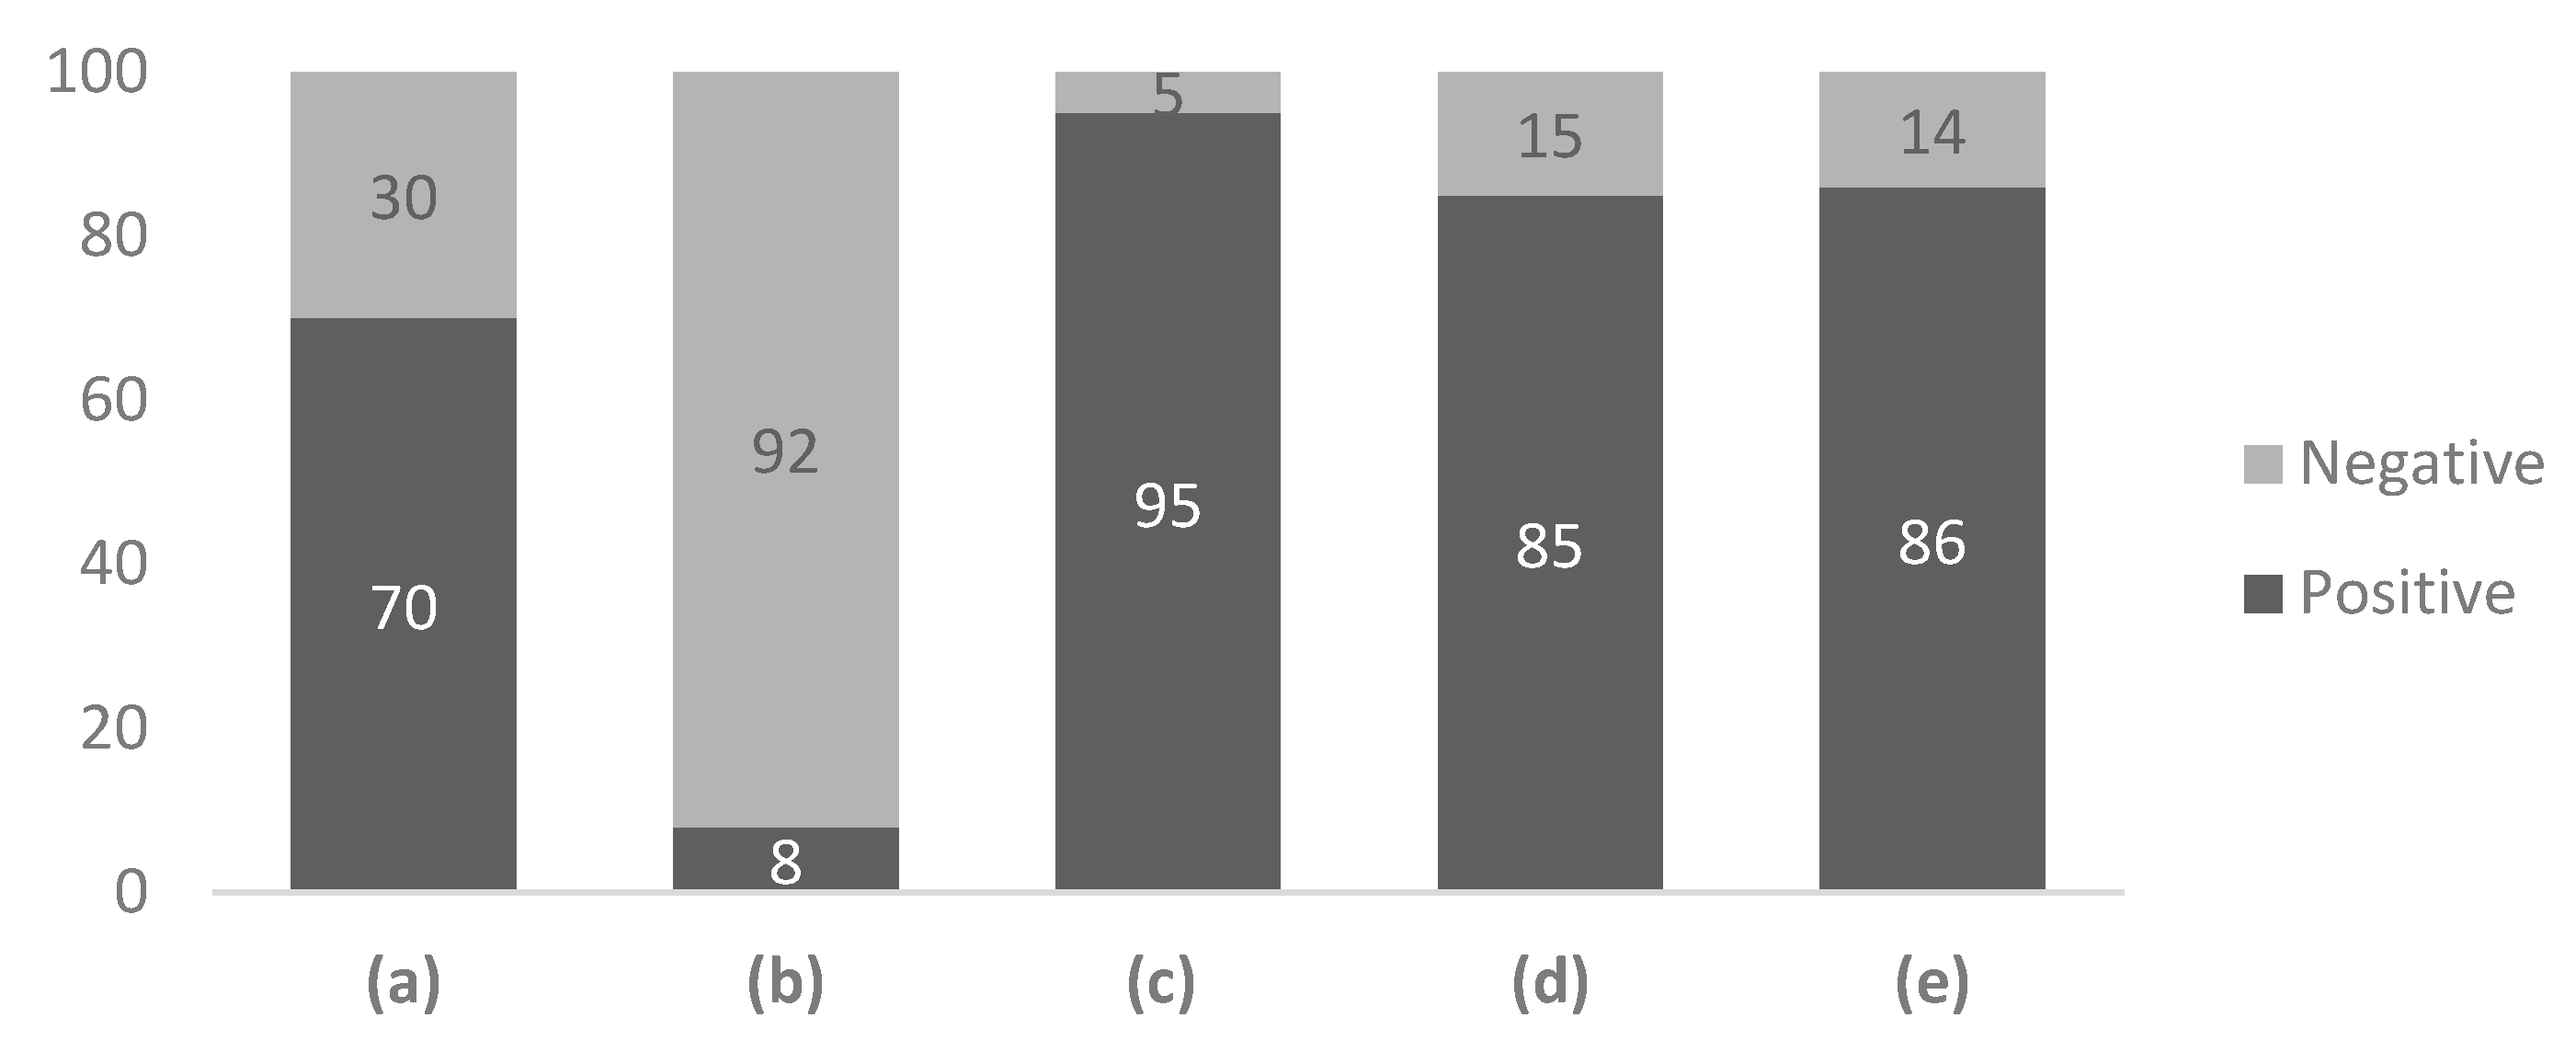
4.3. Geographically Weighted Regression (GWR) Results
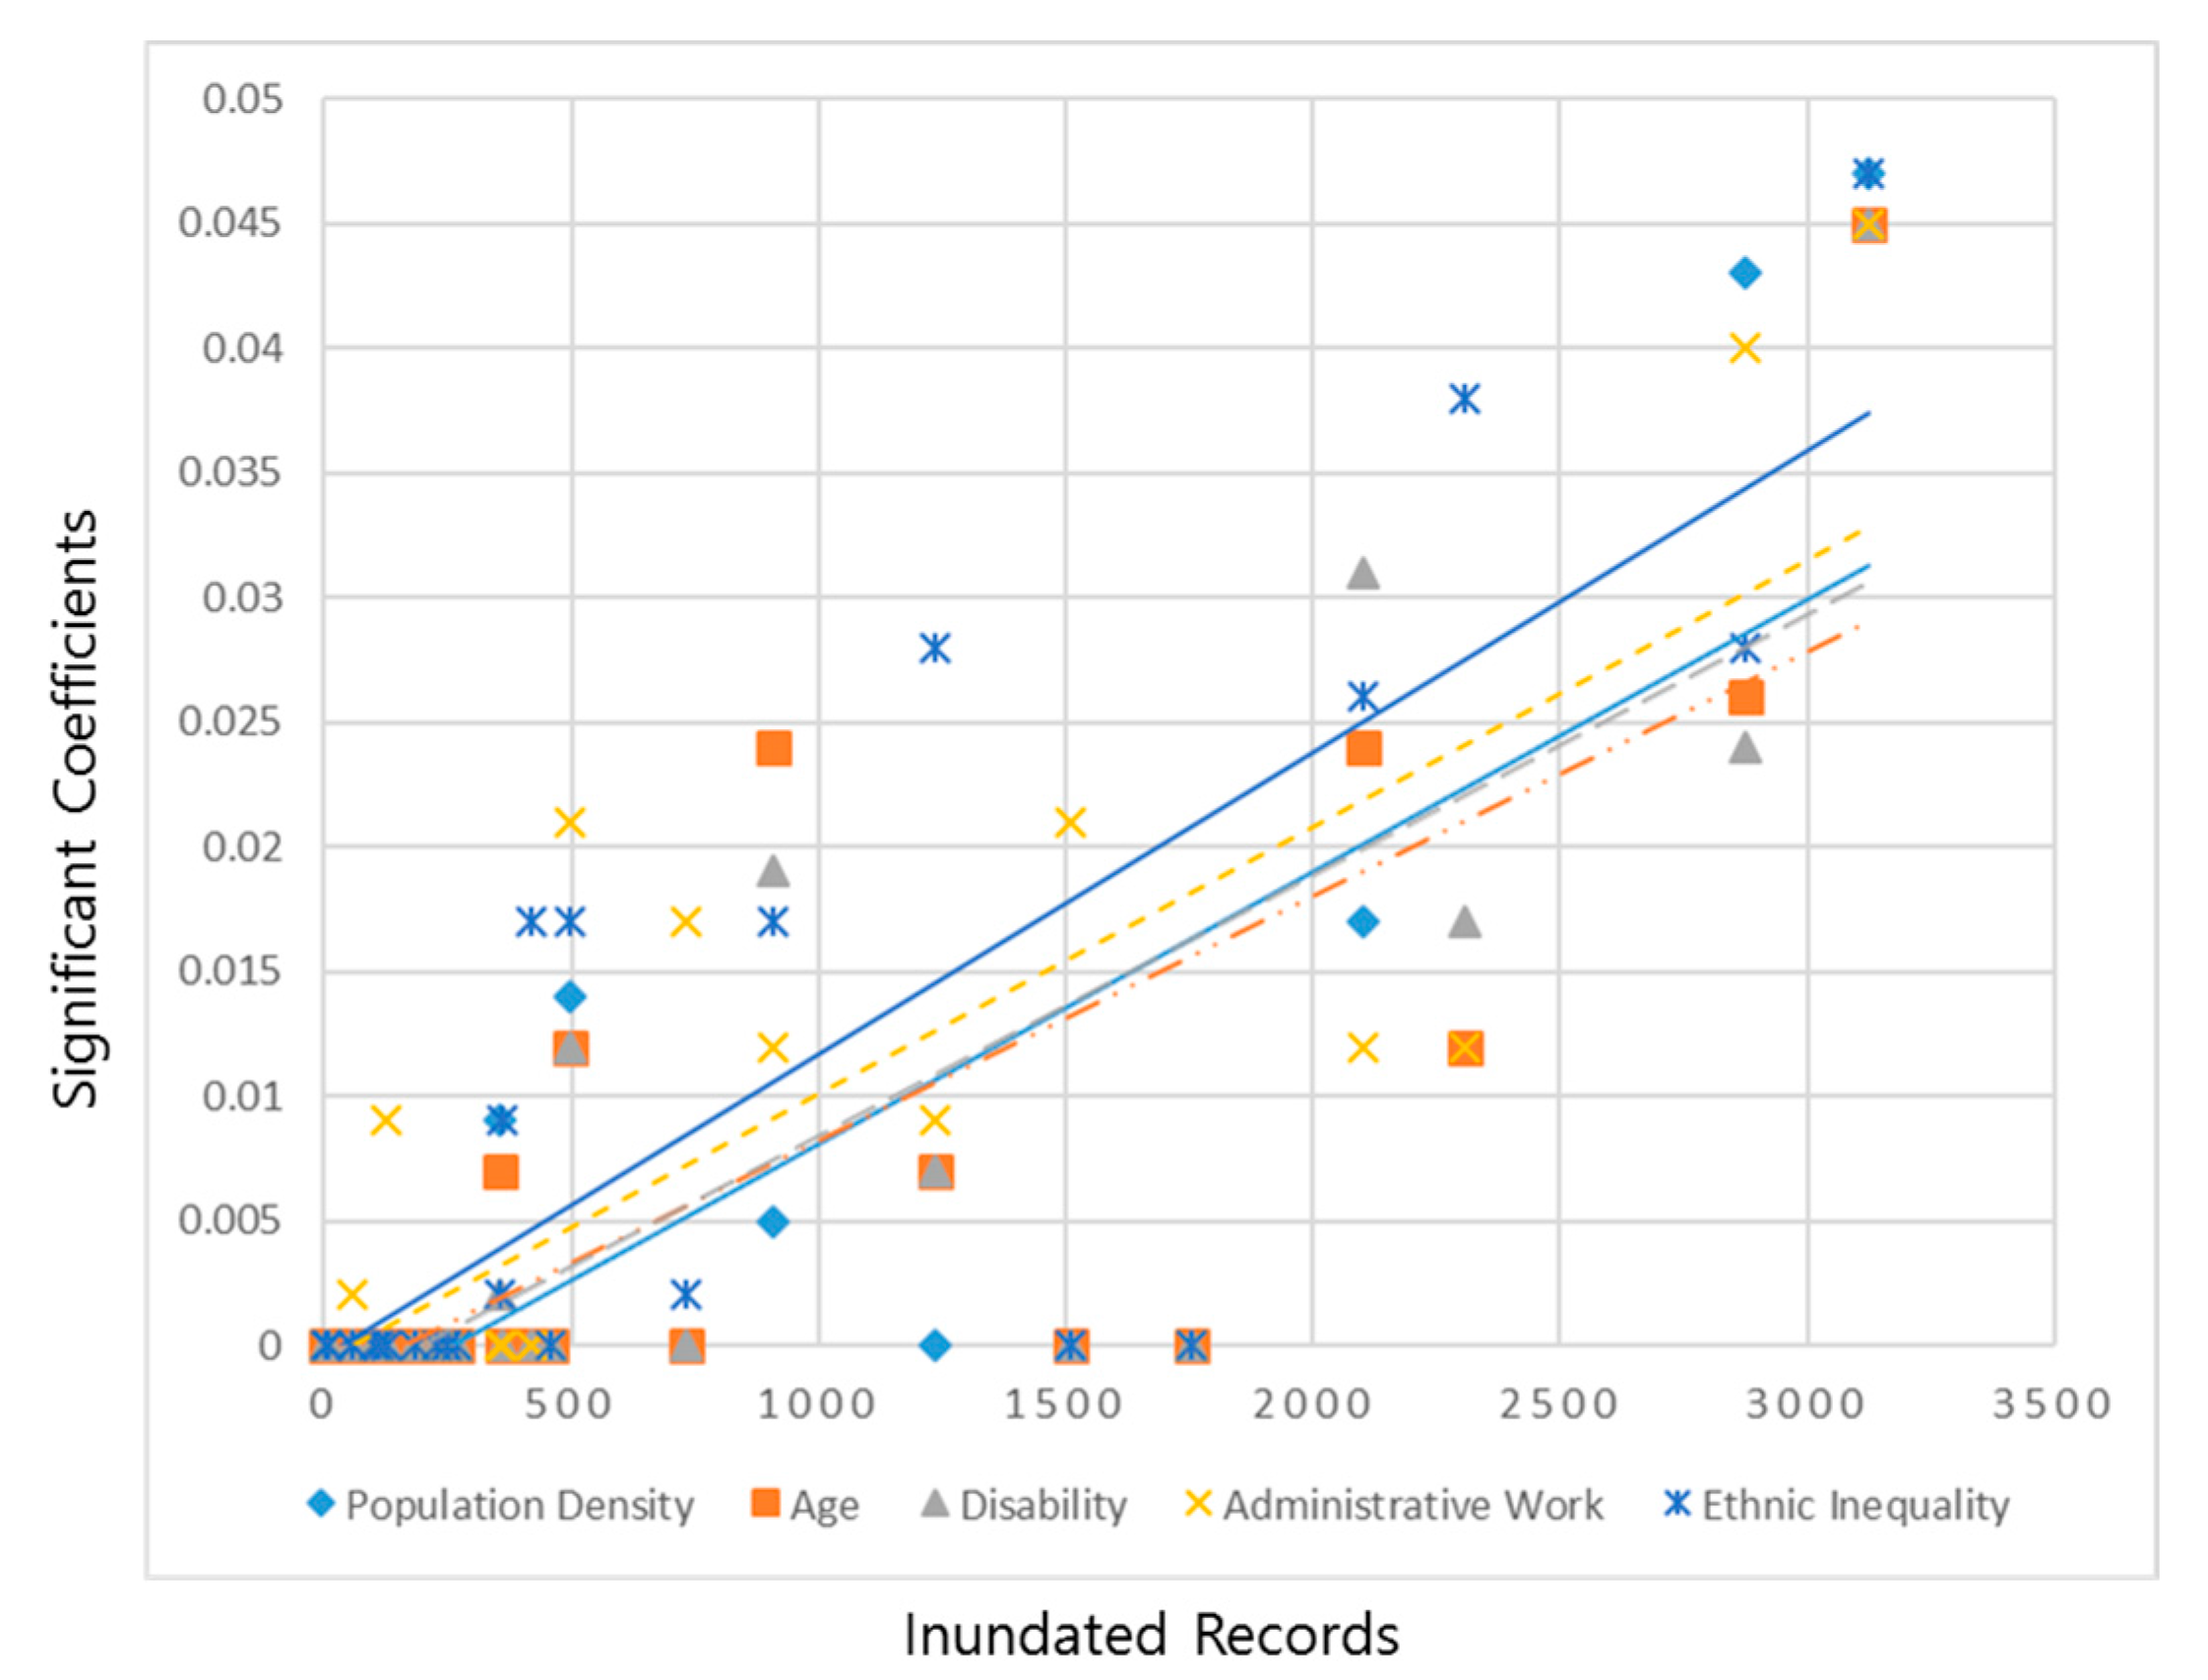
The GWR analysis was performed by using the GWR4 software. The dependent variable was inundated records from 423 sub-districts, and five variables (population density, disability, age, administrative work, and ethnic inequality) were independent variables. As a result, Seoul’s resilience heterogeneity to flood disaster in 2010 was discovered. Figure 3 shows the distribution of significant coefficients. The areas with positive coefficients are in green, whereas the negative coefficient areas are in red. Non-significant areas (i.e., confidence interval 90%) are colored in light-grey. Figure 4 shows the proportion of these coefficients by signs in a bar chart.
In Figure 4a,c–e showed a tendency towards the positive signs. This means that the population density, disability, administrative work, and ethnic inequality are directly proportional to the disaster damage. Thus, these variables should be considered to control the social resilience; for example, whether a region has too high population density or high ethnic inequality levels. On the other hand, the vulnerable age (under 5, over 65), (Figure 4b), was negatively proportional to the disaster damage. It can be interpreted that the damaged regions have less residents in vulnerable ages, or the regions without damage have more residents in vulnerable ages. In the analysis, the result of administrative work shows that more damage occurs when there are more administrative officers. Since the growth in the size and complexity of government may make mistakes more easily and frequently, it can cause greater damage [44]. Defective administrative decision making also tends to cause ineffective and slow implementation of disaster management [45].
Figure 5 shows the relationship between the significant coefficients from the assessment and the inundated records by districts. The x-axis is the damage of each district (inundated records by flood disaster), while the y-axis is the significance of each variable for districts. Each point plotted on the graph indicates each district. The trend line shows the existence of relationships between the disaster damage and the significant coefficients. In other words, the more damaged the area is, variables get more significance for the damage.
Table 5 explains further details of the assessment results. s t indicates the proportion of significant areas by districts from the total 423 districts. p(+) and n(-) represents the significant coefficient’s positive and negative signs. For all of the variables, Gangseo-gu had the highest significant coefficients over 0.045. 10 districts (i.e., Dobong-gu, Eunpyeong-gu, Gangbuk-gu, Gangdong-gu, Jongno-gu, Jung-gu, Jungnang-gu, Seodaemun-gu, Seongbuk-gu, and Yongsan-gu) turned out to have no significance. Here, the districts that are significant can be grouped into three types. One is the district with only positive signs. Three districts (i.e., Gangseo-gu, Guro-gu, and Yangcheon-gu) had positive significance for population density. This means that these areas’ population density is directly proportional to the disaster damage. Another is the districts that have only negative signs. For example, seven districts (i.e., Dongjak-gu, Gangseo-gu, Guro-gu, Gwanak-gu, Seocho-gu, Yangcheon-gu, and Yeongdeungpo-gu) had negative significance for age. This means that these areas’ vulnerable age population is negatively proportional to the disaster damage. The other is the districts with both signs. For example, two districts (i.e., Dongjak-gu and Gwanak-gu) had both positive and negative significance for ethnic inequality. This means that the relationship between disaster damage and ethnic inequality varies among sub-districts. The third type of districts should be monitored more carefully since the level of social resilience cannot be determined uniformly.

4.4. Validation

The performance of the GWR model can be evaluated by the estimated local R 2 and standard residuals. Figure 6a shows the distribution of local R 2 values. Local R 2 values range between 0 and 1, indicating how well the GWR model fits the observed y value [46]. The higher value means that the local model is performing well, whereas the lower value means that the model failed to perform well for the given region. 189 regions were estimated to have higher classes of local R 2 values (above 0.46). These regions fit the model to the observed inundated records. Figure 6b shows the distribution of standard deviations of residuals. It represents that the assessment model fails to explain if the value is under −2.5 or over 2.5. Six sub-districts had standard residuals higher than 2.5 or lower than −2.5; thus, apart from these areas, the assessment model can explain the relationship between disaster damage and social aspects.
The comparison between the results of the OLS and GWR models can also be used for performance evaluation (Table 6). The OLS model refers to the global model, and the GWR model refers to the local model. The Akaike’s Information Criterion (AICc) was used as a measure to assess the model fitness. The corrected AICc is information-based criteria that assess model fit. The AICc is computed from the measure of the divergence between the observed and fitted values, and the measure of the complexity of the model. AICc can be defined as follows:
AICc = 2 log Likelihood + 2 k + 2 k ( k + 1 ) / ( n k 1 )
k is the number of estimated parameters in the model and n is the number of observations in the dataset. These values can be used to compare various models for the same data set to determine the best-fitting model. The model having the smallest value, as discussed in Akaike [41], is usually the preferred model.
The global model’s AICc value was 1178.13, and the local model’s AICc value was 1082.39; thus, the difference of 95.74 is the strong evidence of improvement in the model fit to the data [41]. The global r-squared value was 0.08 and the local r-squared value was 0.61, which suggests that there has been improvement in the model performance. Thus, the local model (GWR) performs better than the global model (OLS).
To verify the result of variable significance, survey results were used to compare with the analysis result qualitatively. The survey results found that the most important feature was population density, and the following variables were administrative work, age, disability, and ethnic inequality. However, the GWR model found that the most important feature was ethnic inequality, and the following variables were age, administrative work, disability, and population. In addition, the OLS model also found the most important variable to be ethnic inequality, followed by administrative work, population density, disability, and age. Ethnic inequality turns out to be the most important feature by the assessment model, with the significant relationship to the disaster damage. This can explain that multi-cultural families or foreign residents may have less social resilience than others, which were not identified by the field expert survey.
The authors also interviewed three disaster management experts from the sewerage treatment division at Seoul Metropolitan Government for further validation of the results. First of all, they agreed with the concept of quantifying each related variable’s influence by each community for social resilience. Currently, physical aspects, for example, road runoff, and drainage system capacity for storm and flood disaster, are the major considerations for decision making and project planning. Recently, attempts to include social aspects in the decision-making process have been made but with insufficient information. Thus, the developed model in this study could gain an affirmative answer. Also, comments on the regions with significant coefficients were made. Historically, during the 70s–80s’ Seoul development plans, inhabitants living without permission after the Korean War were displaced to public land. At the time, most of this public land comprised lowlands, located beside the Han River. Since the lowlands usually act as a storm or flood retarding basin, the land value was low. This could possibly have a relationship with the characteristics of the population living there nowadays. Thus, the variables seem to have a significant relationship with social resilience during a storm and flood disaster.

5. Conclusions

The study developed an assessment model of social resilience through examining appropriate variables that were considered to be related to the disaster damage, and analyzing the impact of spatial heterogeneity of the social attributes by using the GWR method. Through an experimental case study of the SMA, the authors suggested variables that were related to the flood events and distinguished the relationship between the disaster damage and the social resilience. Firstly, a total of 10 variables were suggested to be significant to flood and storm disaster losses. Through the correlation and multicollinearity test, five variables (i.e., population density, vulnerable age, population with a disability, administrative work, and ethnic inequality) were selected as the final variables for the analysis method. Secondly, the spatial heterogeneity was measured on the scale of social resilience using the GWR analysis. The results were visualized by the GIS platform using QGIS (Quantum GIS) software. Thirdly, an assessment model was developed, and the positive or negative signs of coefficients were discussed to analyze the relationship between social resilience and each variable. The quantitative and qualitative validations concluded that the developed assessment model has significant potential for disaster planning, yet more challenges should be solved, such as looking for missing explanatory variables, or combining both physical and social aspects of resilience. However, discovering significance between disaster damages and social indicators by conducting a case study using a proxy variable is meaningful apart from conceptual frameworks or survey results. The proposed model identifies the relationship between disaster damages and the social indicators by estimating a set of local parameter coefficients for each observation point using GWR. Thus, it is possible to identify practical values for social resilience, for example, whether the indicator has a small or big value, or a direct or indirect proportional effect on disaster damage is determined by using the developed model.
The understanding of regional social aspects can support the disaster management decision-making process. More specifically, disaster managers can determine the need for external assistance by using the information. For example, over 70 percent of the fatalities from Hurricane Katrina were represented by individuals aged 65 and older [47]. This suggests that it is necessary to pay attention to the residents in vulnerable ages. The study can support governments and decision-makers to develop and implement a policy that moves from a reactive response to a more proactive approach focusing on the level of preparedness of different districts. The study could also support answering to equity-related residential complaints by providing practical information as a reference, which is the estimated local parameter coefficients of social resilience: the relationship between disaster damages and social indicators.
In this study, the results show that population density, disability, administrative work, and ethnic inequality had positive relationship with the flood damage. From the assessment, it can be derived that areas with more density, disabled population, administrative officers, and multi-cultured population are likely to suffer from the disaster. Hence, these variables should be additionally considered for mitigation project planning. The developed model can be applied to countries or regions that needs an investigation of regional difference on social resilience. The model can strongly perform if there is a significant difference between observation points when compared to the global models. The countries having a possible difference in social aspects across regions could have advantages by adopting this model for their disaster management.

Acknowledgments

This research was supported by X-mind Corps program of National Research Foundation of Korea (NRF) funded by the Ministry of Science, ICT & Future Planning (2017030270); Basic Science Research Program through the National Research Foundation of Korea(NRF) funded by the Ministry of Science, ICT & Future Planning (2017R1E1A2A01077468).

Author Contributions

All of the authors made contributions to the work in this paper.

Conflicts of Interest

The authors declare no conflict of interest.

References

  1. Intergovernmental Panel on Climate Change. Climate Change 2014—Impacts, Adaptation and Vulnerability: Regional Aspects; Cambridge University Press: Cambridge, UK, 2014. [Google Scholar]
  2. Lindell, M.K.; Prater, C.S. Assessing community impacts of natural disasters. Nat. Hazards Rev. 2003, 4, 176–185. [Google Scholar] [CrossRef]
  3. Rose, A. Defining and measuring economic resilience to disasters. Disaster Prev. Manag. An Int. J. 2004, 13, 307–314. [Google Scholar] [CrossRef]
  4. Choi, E.; Chun, H.; Song, J.; Chi, S. Quantitative Assessment of Urban Disaster Resilience by Clustering Analysis of Vulnerability and Recoverability. In Proceedings of the 5th International Symposium on Reliability Engineering and Risk Management (ISRERM 2016), Seoul, Korea, 17–20 August 2016. [Google Scholar]
  5. United Nations International Strategy for Disaster Risk Reduction (UNISDR). Hyogo Framework for 2005–2015: Building the Resilience of Nations and Communities to Disasters. Available online: http://www.unisdr.org/2005/wcdr/intergover/official-doc/L-docs/Hyogo-framework-for-action-english.pdf (accessed on 30 June 2017).
  6. Klein, R.J.; Nicholls, R.J.; Thomalla, F. Resilience to natural hazards: How useful is this concept? Glob. Environ. Chang. Part B Environ. Hazards 2003, 5, 35–45. [Google Scholar] [CrossRef]
  7. Manyena, S.B. The concept of resilience revisited. Disasters 2006, 30, 434–450. [Google Scholar] [CrossRef] [PubMed]
  8. Norris, F.H.; Stevens, S.P.; Pfefferbaum, B.; Wyche, K.F.; Pfefferbaum, R.L. Community resilience as a metaphor, theory, set of capacities, and strategy for disaster readiness. Am. J. Commun. Psychol. 2008, 41, 127–150. [Google Scholar] [CrossRef] [PubMed]
  9. Cutter, S.L.; Barnes, L.; Berry, M.; Burton, C.; Evans, E.; Tate, E.; Webb, J. A place-based model for understanding community resilience to natural disasters. Glob. Environ. Chang. 2008, 18, 598–606. [Google Scholar] [CrossRef]
  10. Gilbert, S.W. Disaster Resilience: A Guide to the Literature; National Institute of Standards and Technology: Gaithersburg, MD, USA, 2010.
  11. Mileti, D. Disasters by Design: A Reassessment of Natural Hazards in the United States; Joseph Henry Press: Washington, DC, USA, 1999. [Google Scholar]
  12. Cutter, S.L.; Boruff, B.J.; Shirley, W.L. Social vulnerability to environmental hazards. Soc. Sci. Q. 2003, 84, 242–261. [Google Scholar] [CrossRef]
  13. De Groeve, T.; Annunziato, A.; Vernaccini, L. Overview of Disaster Risks that the EU Faces; JRC Scientific and Policy Reports; European Commission; Joint Research Centre: Ispra, Italy, 2013. [Google Scholar]
  14. Birkmann, J. Measuring vulnerability to promote disaster-resilient societies: Conceptual frameworks and definitions. In Measuring Vulnerability to Natural Hazards: Towards Disaster Resilient Societies; The Energy and Resources Institute (TERI): New Delhi, India, 2006; Volume 1, pp. 7–54. [Google Scholar]
  15. Klein, R.J.T.; Smit, M.J.; Goosen, H.; Hulsbergen, C.H. Resilience and vulnerability: Coastal dynamics or Dutch dikes. Geogr. J. 1998, 164, 259–268. [Google Scholar] [CrossRef]
  16. Holling, C.S. Resilience and stability of ecological systems. Annu. Rev. Ecol. Syst. 1973, 4, 1–23. [Google Scholar] [CrossRef]
  17. Perrings, C. Resilience and sustainability. In Frontiers of Environmental Economics; Henk Folmer, H., Gabel, H.L., Gerking, S., Rose, A., Eds.; Edward Elgar Publishing Limited: Cheltenham, UK, 2001; Chapter 13; p. 319. [Google Scholar]
  18. Wildavsky, A. Searching for Safety; Transaction: New Brunswick, NJ, USA, 1991. [Google Scholar]
  19. Horne, J.F.; Orr, J.E. Assessing Behaviours that Create Resilient Organisations. Employ. Relat. Today 1998, 24, 29–39. [Google Scholar]
  20. Tinch, R. Resilience and Resource Management under Risk; School of Environmental Science, University of East Anglia: Norwich, UK, 1998. [Google Scholar]
  21. McAllister, T. Developing Guidelines and Standards for Disaster Resilience of the Built Environment: A Research Needs Assessment; US Department of Commerce; National Institute of Standards and Technology: Gaithersburg, MA, USA, 2013.
  22. Bosher, L. (Ed.) Hazards and the Built Environment: Attaining Built-In Resilience; Routledge: Abingdon, UK, 2008. [Google Scholar]
  23. Cardona, O.D. The need for rethinking the concepts of vulnerability and risk from a holistic perspective: A necessary review and criticism for effective risk management. In Mapping Vulnerability: Disasters, Development and People; Earthscan Publishers: London, UK, 2004; Volume 17, pp. 37–51. [Google Scholar]
  24. Hilhorst, D.J.M.; Bankoff, G.E.A. Introduction: Mapping Vulnerability; Earthscan: Sterling, VA, USA, 2004; pp. 1–9. [Google Scholar]
  25. Bruneau, M.; Chang, S.E.; Eguchi, R.T.; Lee, G.C.; O’Rourke, T.D.; Reinhorn, A.M.; von Winterfeldt, D. A framework to quantitatively assess and enhance the seismic resilience of communities. Earthq. Spectra 2003, 19, 733–752. [Google Scholar] [CrossRef]
  26. Irajifar, L.; Alizadeh, T.; Sipe, N. Disaster resiliency measurement frameworks: State of the art. Presented at the World Building Congress, Brisbane, Australia, 5–9 May 2013. [Google Scholar]
  27. Coletti, A.; Howe, P.D.; Yarnal, B.; Wood, N.J. A support system for assessing local vulnerability to weather and climate. Nat. Hazards 2013, 65, 999–1008. [Google Scholar] [CrossRef]
  28. Hara, Y.; Umemura, K.; Kato, K.; Connor, R.F.; Sato, Y. The development of flood vulnerability index applied to 114 major river basins around the world. J. Jpn. Soc. Hydrol. Water Resour. 2009, 22, 10–23. [Google Scholar] [CrossRef]
  29. Cutter, S.L.; Ash, K.D.; Emrich, C.T. The geographies of community disaster resilience. Glob. Environ. Chang. 2014, 29, 65–77. [Google Scholar] [CrossRef]
  30. The National Emergency Management Agency (NEMA) of South Korea. Domestic Disaster Vulnerability Assessment; The National Emergency Management Agency (NEMA) of South Korea: Seoul, Korea, 2008.
  31. Park, S. Estimation of Potential Risk for Flood Damage Occurrence. Available online: https://dspace.inha.ac.kr/handle/10505/13210 (accessed on 4 June 2016).
  32. Lee, C.; Yeo, C. Development of the Regional Safety Assesment Model in Seoul: Focusing on Flood; The Seoul Institute: Seoul, Korea, 2006. [Google Scholar]
  33. Kusumasari, B.; Alam, Q.; Siddiqui, K. Resource capability for local government in managing disaster. Disaster Prev. Manag. An Int. J. 2010, 19, 438–451. [Google Scholar] [CrossRef]
  34. O’brien, R.M. A caution regarding rules of thumb for variance inflation factors. Qual. Quant. 2007, 41, 673–690. [Google Scholar] [CrossRef]
  35. Brunsdon, C.; Fotheringham, A.S.; Charlton, M.E. Geographically weighted regression: A method for exploring spatial nonstationarity. Geogr. Anal. 1996, 28, 281–298. [Google Scholar] [CrossRef]
  36. Fotheringham, A.S.; Charlton, M.E.; Brunsdon, C. Geographically weighted regression: A natural evolution of the expansion method for spatial data analysis. Environ. Plan. A 1998, 30, 1905–1927. [Google Scholar] [CrossRef]
  37. Information of Developer Tomoki Nakaya. Available online: http://tomoki-nakaya.software.informer.com (accessed on 14 September 2017).
  38. Nakaya, T.; Charlton, M.; Yao, J.; Fotheringham, A.S. GWR4.09 User Manual: Windows Application for Geographically Weighted Regression Modelling. 2016. Available online: http://manualslist.info/pdf/gwr409-user-manual-geodacenterorg.html (accessed on 14 September 2017).
  39. Fotheringham, A.S.; Brunsdon, C.; Charlton, M. Geographically Weighted Regression: The Analysis of Spatially Varying Relationships; John Wiley & Sons: Hoboken, NJ, USA, 2003. [Google Scholar]
  40. Chen, V.Y.J.; Deng, W.S.; Yang, T.C.; Matthews, S.A. Geographically weighted quantile regression (GWQR): An application to US mortality data. Geogr. Anal. 2012, 44, 134–150. [Google Scholar] [CrossRef] [PubMed]
  41. Akaike, H. A new look at the statistical model identification. IEEE Trans. Autom. Control 1974, 19, 716–723. [Google Scholar] [CrossRef]
  42. Lloyd. Lloyd’s City Risk Index 2015–2025. City Risk Executive Summary; Lloyd’s of London: London, UK, 2015. [Google Scholar]
  43. Seoul Metropolitan Website. Available online: http://www.seoul.go.kr/main/index.html (accessed on 10 June 2016).
  44. McMillan, J. Ten Challenges for Administrative Justice. In Proceedings of the 61 AIAL Forum 23, Canberra, Australia, 6–7 August 2009. [Google Scholar]
  45. Bang, H.N. 30 Years after the Lake Nyos Disaster: What Prospects for Rehabilitation and Reintegration in the Region; Book Venture Publishing LLC: Ishpeming, MI, USA, 2016. [Google Scholar]
  46. ESRI. Interpreting GWR Results. Available online: http://resources.esri.com/help/9.3/arcgisdesktop/com/gp_toolref/spatial_statistics_tools/interpreting_gwr_results.htm (accessed on 20 September 2017).
  47. Donner, W.; Rodríguez, H. Disaster Risk and Vulnerability: The Role and Impact of Population and Society; Population Reference Bureau: Washington, DC, USA, 2011. [Google Scholar]
Figure 1. Research Process.
Sustainability 09 02222 g001
Figure 2. Distribution of the Districts of Seoul [43].
Sustainability 09 02222 g002
Figure 3. Spatial distribution of significant coefficients for each variable: (a) population density; (b) vulnerable residents by age (under 5, over 65); (c) residents with a disability; (d) administrative work; and (e) the area’s ethnic inequality.
Sustainability 09 02222 g003
Figure 4. Proportion of coefficients by signs: (a) population density; (b) vulnerable residents by age (under 5, over 65); (c) residents with disability; (d) administrative work; and (e) the area’s multi-cultural population.
Sustainability 09 02222 g004
Figure 5. Distribution and trend of significant coefficients from the assessment by districts.
Sustainability 09 02222 g005
Figure 6. (a) Spatial distribution of Local R 2 and (b) spatial distribution of standard residuals.
Sustainability 09 02222 g006
Table 1. Assessment model review.
TypeModelDetails
ForeignRisk Vulnerability Assessment Tool (RVAT)The RVAT was developed by the National Oceanic and Atmospheric Administration (NOAA). It is a tool that helps to identify people, property, and resources that are at risk of injury, damage, or loss from hazardous incidents or natural hazards [27]. The model consists of variables such as age, ethnic inequality, and poverty.
European Spatial Planning Observation Network (EPSON)The EPSON project published a risk assessment based on historical tsunami events and seismic hazards. It was set up to support policy development and to build a European scientific community in the field of territorial development [13]. The model consists of variables such as population density, age, education, and regional affordability.
Flood Vulnerability Index (FVI)The FVI is an index for assessing vulnerability to flood disasters that can be applied at the river basin level. The main objective of the FVI is to be useful in versatile applications for policy-making on flood disasters by governmental decision-makers [28]. The model consists of variables such as population density, age, and poverty.
Baseline Resilience Indicators for Communities (BRIC)The BRIC is an empirically-based resilience metric that was developed to compute related indicators for use in a policy context [29]. The model provides a conceptualization for understanding and measuring community-level resilience to natural hazards. The model consists of variables such as age, foreigners, and disability.
The United States Agency for International Development (USAID) resilience domain frameworkUSAID has adapted a resilience domain framework and identified a number of potential indicators under each domain. The key points of this model are that resilience is not an outcome, but a capacity that influences outcomes, and should be measured at multiple levels. The model consists of variables such as age, education, and social assistance.
Disaster Resilience Leadership Academy (DRLA)—State University of Haiti (UEH) ModelThe DRLA/UEH model was developed by the DRLA in partnership with the UEH. It measures the connection between an event, humanitarian assistance and resilience in seven dimensions: wealth, debt and credit, coping behaviors, human capital, protection and security, community networks, and psychosocial status. The model consists of variables such as education, social assistance, and crime/security.
Food and Agriculture Organization (FAO) resilience frameworkThe FAO resilience framework looks at the root causes of household vulnerability instead of trying to predict how well households will cope with future crises or disasters. The aim of the model is to provide information for decision-makers to objectively target their actions and measure their results over time. The model consists of variables such as education, social assistance, and health access.
Domestic (Korea)The National Emergency Management Agency (NEMA) of South KoreaThe NEMA of South Korea published an assessment on regional safety from disasters [30]. The model consists of variables such as population density and disability.
Park (2006), Lee et al. (2006)Some domestic research models were studied [31,32]. Most of the indicators are focused on the physical aspects of the geology and hazard, some measures are related to community characteristics, opening its potential to consider social resilience. The model consist of variables such as population density and housing asset.
Table 2. Variables listed from the previous assessment models.
No.CategoryVariableRVATEPSONFVIBRICUSAIDDRLA/UEHFAONEMAPark et al. (2006)Lee et al. (2006)
1HumanPopulation Density
2Age
3Ethnic Inequality
4Foreigner
5Disability
6Poor
7Education
8CommunitySocial Assistance
9Political Power
10Crime/Security
11Health Access
12Population Wellness
13Migration
14EconomicHousing Asset
15Income
16Homeownership
17Employment
18Female Participation
19Business Environment
20OrganizationalAdministrative Work
21Regional Affordability
22Shelter Capacity
Table 3. Variable selection by survey, correlation analysis, and multicollinearity test.
No.VariableSurvey ResultSelection
(Above Average)
Pearson CorrelationSig. (2-Tailed)VIFN
1Population Density6.514O0.113 *0.0201.096423
2Age5.371O0.105 *0.0313.357423
3Ethnic Inequality4.771O0.266 **0.0001.183423
4Foreigner3.829
5Disability5.086O0.100 *0.0393.238423
6Poor4.429
7Education3.114
8Social Assistance3.800
9Political Power3.486
10Crime/Security4.057
11Health Access5.314O−0.0210.667423
12Population Wellness4.657O−0.0330.500423
13Migration4.714O0.0280.560423
14Housing Asset3.714
15Income3.800
16Homeownership3.743
17Employment3.600
18Female Participation3.457
19Business Environment4.371
20Administrative Work5.429O0.152 **0.0022.255423
21Regional Affordability5.429O−0.0430.381423
22Shelter Capacity5.8860.0100.845423
* Correlation is significant at the 0.05 level (2-tailed); ** Correlation is significant at the 0.01 level (2-tailed).
Table 4. Details of proxy variables.
VariableRaw DataStandardized Data
MeanStd. Dev.MeanStd. Dev.MinMax
YInundated Records47.34109.320.001.00−0.4310.28
XPopulation Density24,928.7012,384.700.001.00−1.943.28
Disability943.03480.480.001.00−2.433.20
Age (under 5, over 65)3859.921512.130.001.00−1.905.80
Administrative Work15.872.510.001.00−2.744.03
Ethnic Inequality53.4449.000.001.00−1.078.40
Table 5. Results of assessment model by districts.
DistrictsNo. of Sub-DistrictsInundated RecordsPopulation DensityAgeDisabilityAdministrative WorkEthnic Inequality
s t p(+)n(-) s t p(+)n(-) s t p(+)n(-) s t p(+)n(-) s t p(+)n(-)
Dobong-gu142---------------
Dongdaemun-gu1459---------0.002-0.002---
Dongjak-gu159080.005-0.0050.024-0.0240.0190.019-0.0120.012-0.0170.0140.002
Eunpyeong-gu16459---------------
Gangbuk-gu13228---------------
Gangdong-gu181756---------------
Gangnam-gu223550.009-0.0090.0070.007-0.0020.002----0.0020.002-
Gangseo-gu2031260.0470.047-0.045-0.0450.045-0.0450.0450.045-0.0470.047-
Geumcheon-gu10418------------0.0170.017-
Guro-gu154960.0140.014-0.012-0.0120.0120.012-0.0210.021-0.0170.017-
Gwanak-gu2123090.012-0.0120.012-0.0120.0170.017-0.0120.012-0.0380.0350.002
Gwangjin-gu151508---------0.021-0.021---
Jongno-gu1799---------------
Jung-gu15249---------------
Jungnang-gu16268---------------
Mapo-gu16730---------0.0170.017-0.002--
Nowon-gu196--------------0.000
Seocho-gu1821030.017-0.0170.0240.0050.0190.0310.031-0.0120.012-0.026-0.026
Seodaemun-gu14182---------------
Seongbuk-gu2055---------------
Seongdong-gu17126---------0.009-0.009---
Songpa-gu26360------------0.0090.009-
Yangcheon-gu1828760.0430.043-0.026-0.0260.0240.0070.0170.0400.040-0.0280.028-
Yeongdeungpo-gu181235---0.007-0.0070.0070.007-0.0090.009-0.0280.028-
Yongsan-gu16111---------------
Average16.92200240.1470.1040.0430.1560.0120.1440.1560.0950.0610.2010.1680.0330.2320.2010.031
Total423800.960.0060.0040.0020.0060.0000.0060.0060.0040.0020.0080.0070.0010.0090.0080.001
Table 6. Results of ordinary least square (OLS) and Geographically Weighted Regression (GWR) analysis model.
No.VariableGlobal, OLS (n = 423)Local, GWR (n = 423)
CoefficientStandard ErrorT(Est/SE)MeanSTD
1Population Density0.0540.0491.0920.0270.225
2Age−0.0210.086−0.244−0.2260.418
3Disability−0.0520.085−0.6100.1040.479
4Administrative Work0.1260.0711.7900.1620.314
5Ethnic Inequality0.2360.0514.6200.2660.671
R 2 0.0810.612
AICc1178.131082.39

