Article

Value-Added-Based Accounting of CO2 Emissions: A Multi-Regional Input-Output Approach

1
College of Public Administration, Nanjing Agricultural University, Nanjing 210095, China
2
School of Geographical Sciences, Nanjing University of Information Science & Technology, Nanjing 210044, China
*
Author to whom correspondence should be addressed.
Sustainability 2017, 9(12), 2220; https://doi.org/10.3390/su9122220
Submission received: 21 September 2017 / Revised: 29 November 2017 / Accepted: 29 November 2017 / Published: 1 December 2017
(This article belongs to the Special Issue Carbon Footprint: As an Environmental Sustainability Indicator)

Abstract

:
In the era of globalization and international trade, the production-based CO2 emissions accounting system, proposed by United Nations Framework Convention on Climate Change, can easily lead to a “carbon leakage” issue. Thus, the accounting of consumption-based carbon emissions and carbon emissions embodied in international trade has received considerable research attention. Nevertheless, researchers also indicated that the consumption-based principle has some weaknesses, for example, it leads the producers inert on reducing carbon emissions while gaining economic benefits. To share carbon emissions responsibilities between producers and consumers is widely recognized. So, setting an income-based emissions accounting method as to producer is a necessary complement for accounting national carbon emissions. This study promoted a model, called the value-added-based accounting of CO2 emissions method, to account for anthropogenic CO2 emissions within the context of the economic benefit principle. Based on the global multi-regional input-output table and national carbon emissions database, we calculated the national/regional carbon emissions based on the value-added accounting approach as well as the amount of global carbon emissions embodied in value-added chains. If the results are served as a supplement for calculating the amount of CO2 emissions reduction that a country is responsible for, problems such as carbon leakage and resistance to improving the energy efficiency of exporting sector may be solved, because all the supply chains emissions associated with the economic growth of a country would be considered.

1. Introduction

Substantial reductions in global emissions are needed to reduce the risk of “dangerous” anthropogenic climate change [1,2]. According to the datum from The Carbon Dioxide Information Analysis Center (CDIAC), during 2000–2010, global total emissions increase at a rate of 3.1% per year, a significant growth compared with the rate of 1.0% per year around the 1990s, and global per capita emissions also have a surprisingly large growth rate.
One of the reasons behind the above phenomenon is that reduction in CO2 emissions is likely to have a negative impact on economic and social development, which can be especially painful to less developed nations with high rates of population growth [3], under the emissions accounting system of United Nations Framework Convention on Climate Change (UNFCCC), which is called Production-Based Accounting System of CO2 Emissions (PBE) [4]. From the view of the PBE, the direct CO2 generated in the production process within borders are counted in the country’s emissions account, therefore, it is also called “territorial emissions responsibility”. In the perspective of the PBE, the emissions associated with exports are included but those associated with imports are excluded from the national account. In the era of globalization and international trade, the PBE method is probably one of the reasons for the “carbon leakage” phenomenon. In this phenomenon, developed countries with greenhouse gas (GHG) emission reduction responsibilities achieve their emission reduction targets by moving their emission-intensive industries to developing countries without undertaking their reduction responsibilities, may further increase global carbon emissions given that production technology in developing countries is behind that in developed countries and generates excess CO2. Actually, within the framework of the theory of industrial economics, global industrial transfer is a basic law of economic development. The global emission reduction system will only accelerate this process [5].
Numerous studies exist on the subject of carbon leakage. Many studies have put forward the consumption-based CO2 emissions (CBE) accounting system [6,7,8] mostly with the help of multi-regional input-output model (MRIO). Research on this topic may be largely classified into (1) studies on CO2 emissions flows hidden behind global trade for one single country or that between two countries [9,10,11,12,13,14,15,16,17,18,19,20,21]; and (2) studies on CO2 emissions hidden behind global trade fluxes [22,23,24,25,26,27,28,29,30]. Some recent studies indicated that CO2 emissions contained in global product-exchange fluxes have increased. Worldwide, the greatest CO2 efflux originates from China. For example, Peters and Minx [22] found that gross GHG emissions contained in world-traded products and services have expanded from 4.3 Gt CO2 in 1990 (accounting for 20% of world total emissions) to 7.8 Gt CO2 in 2008 (accounting for 26% of world total emissions), with a prominent contribution of CO2 emissions, which was augmenting from 0.4 Gt CO2 to 1.6 during 1990–2008, embodied in the trade from developing countries to developed countries. Their results also showed that carbon emissions contained in exported goods and services of China was equal to 18% of the whole world’s carbon emissions increase. Thus, many researchers have begun to investigate the problem of Chinese GHG emissions [28,31,32,33,34,35]. Some scholars studied CO2 generation associated with the production of import and export products in China [11,12,36]. Others analyzed the CO2 emissions contained in the goods and services exchanged between China and other countries, such as USA, Japan, and the UK [13,14,15,16,17].
However, some studies have argued that allocating all of the responsibility to the final user, mainly based on the consideration that the consumer or service provider is the ultimate factor of carbon emissions, is also inappropriate because the acquisition of fortune or adding of the foreign-exchange reserves are also key factors that affect the production of carbon emissions [37]. Another major criticism of the CBE approach is that it does not encourage producers to improve the energy efficiency of the production process because it attributes all emission responsibility to the consumer [38]. In addition, obtaining reliable data is also a drawback of CBE. Gallego and Lenzen argued that producers should take some responsibility for carbon emissions reduction [39]. And they put forward a compromise approach whereby producers and consumers share carbon responsibility, but determining the share rates of producers and consumers is a key issue. Later, Lenzen et al. proposed a method of sharing carbon emissions determined by the proportion of value gains of each link in the production chains [40]. After that, many scholars have performed a large amount of empirical research and further improvement, such as Ning Chang et al. [29], who developed a shared responsibility calculation framework for carbon emissions served by border carbon tariff rates.
So, to share carbon emissions responsibilities between producers and consumers is widely recognized. At present, many researchers focus only on the carbon emissions hidden behind the final commodities consumed by consumers, namely the supply chain of CO2 emissions [27], but ignore emissions hidden in the value-added gained by producers through production. In the era of globalization, the GPN (global production networks) approach, including the GCC (global commodity chain) and GVC (global value chain), is an important framework for analyzing the global issues and its impacts on territorial development [41]. At present, there many achievements associated with global value chain issues, such as the joint OECD–WTO (Organization for Economic Cooperation and Development–World Trade Organization) Trade in Value-Added database, which provides indicators of the value added by each country in the production of goods and services that are consumed worldwide. Johnson and Noguera combined input-output and bilateral trade data to compute the value-added content of bilateral trade [42]. Stehrer developed two measures of value-added flows between countries: “Trade in value added” and ”Value added in trade” and then studied the value added flows in the world economy [43,44]. Seamus Grimes and Yutao Sun analyzed how the Apple company and its network have become increasingly embedded in China’s information and communications technology (ICT) global value chain [45]. So, value-added chain and commodity chain (or supply chain) are two aspects of global trade; the value-added chain is related to the supply chain, but it is more connected to how companies organize and locate different functions and activities to benefit from the comparative advantage of different regions [46]. CBE attempts to detect the CO2 emissions embodied in the upstream supply chain of a final commodity and relocate the emissions responsibility to final consumers. However, it does not account for the value added to the product as it progresses through the commodity supply chain. This is one of the reasons why CBE is criticized by many scholars. Methods for CO2 accounting should account for carbon emissions embodied in the value-added chain, and a CO2 accounting method based on value-added should be established. Such a method is the main contribution of this study. We will examine the CO2 emissions embodied in the global production network within the framework of the value-added chain.
To differentiate between CBE and the CO2 accounting method based on value-added, we provide a simple example: An enterprise (or region) acquires value-added using high-carbon-intensity raw materials as production input. This enterprise (or region) is an intermediate link in the supply chain. Although the enterprise (or region) may have no carbon emissions from the perspective of production- or consumption-based emissions accounting, it should also be responsible for the carbon released from high-carbon-intensity raw materials because if the external carbon cost is counted in the raw material, then the enterprise’s (or region’s) added value is bound to be affected. Therefore, the carbon burden behind economic growth is crucial for identifying the carbon responsibility of a country or region, that is, the value-added based accounting of CO2 emissions (VBEs). In this regard, several researchers have made some contributions. For example, by applying China MRIO, Liu et al. [47] investigated the CO2 emissions contained in the value-added chains among eight main regions in China. Bo Meng et al. attempted to combine the value-added chain with CBE by using the concept of GVCs to decompose embodied emissions in product-supply chains [48]. In addition, Zhang compared the regional responsibilities of CO2 reduction and regional carbon multipliers at a provincial scale in China [49]. Zhang’s study assigned emissions responsibility on the basis of seven principles, which include the three basic principles of production, income, and consumption, as well as four combined principles. In Zhang’s study, the concept of income principle is a similar to that of the model for VBEs presented in this paper. In the VBE perspective, all emissions embodied in supply chains are accounted for. This approach allows countries to take full responsibility for emissions arising from their economic growth and simultaneously compels countries to improve the carbon intensity of their GDP.
Based on previous research, the value-added-based CO2 emissions accounting method, and the model for evaluating carbon emissions embodied in value-added chains are systematically established in this paper. Then, the above method is demonstrated using global data for the years 2000 and 2010. The next section presents the materials and methods established on the basis of the MRIO. It also provides an explanation for the global data sources used in this study. Section 3 provides an analysis of the CO2 emissions embodied in national gross value-added (in other words GDP), and an investigation of CO2 emissions transfers hidden behind the global value-added chains. Section 4 presents the discussion of advantages and drawbacks of the VBE measure. Conclusions are provided in the final section.

2. Materials and Methods

Currently, in the research field of resources and environment, the MRIO table has been increasingly interested by many scholars [50]. Table 1 shows the global MRIO table used in this paper, where a world has n countries.

2.1 Direct Carbon Emission Factor

In this study, we suppose the global PBE to be Ep, and the PBE of country r to be e p r . It should here be noted that PBE includes carbon emissions from the combustion of fuels and industrial processes such as cement producing, but does not include carbon emissions caused by non-industrial activities such as direct use of natural energy (including rural residents burning firewood, etc.). This is because the latter emissions cannot be reallocated through the product-consumer link, but must be analyzed separately. The focus of this study is the inter-regional carbon emissions transfer caused by global product-consumer link. So, emissions not covered by the global production system are excluded in this study. Then, the PBE of country r divided by gross output in country r could acquire the PBE per unit of output, in other words, the direct CO2 emissions coefficient of country r, written as:
α r = e p r / t r

2.2 Value-Added Based Accounting of CO2 Emissions

Assuming t r s / t r = m r s , here m r s means the direct distribution coefficient for s from r’s output, thus it is not same with technique coefficient frequently used. So, the following formula can be obtained from the longitudinal direction of Table 1:
r m r s × t r + v s = t s
Turn Equation (1) to matrix format as following:
M T × T + V = T
where the uppercase letters represent matrix forms of lowercase letters. And M indicates the direct distribution coefficient matrix of output, and MT means the transposed form of M. V is the column vector consisting of vs, indicating the value added. T is the column vector consisting of ts, which expresses gross output. Then change Equation (2) to get:
T = ( I M T ) 1 × V
If matrix (IMT)−1 is expressed by β, and then multiplied by αr, the global total CO2 emissions could be written as:
E p = α × T = α × β × V
where α is the row vector consisting of αr, written specifically as following:
α × T = ( α 1 α r α n ) × ( β 11 β 12 β 1 n β 21 β 22 β 2 n β n 1 β n 2 β n n ) × [ v 1 v 2 v n ]
where β r s means accumulated demands of output produced in country r for gaining unit value-added in country s. Based on Equation (5), the PBEs in country r could be rewritten:
e p r = α r × s β r s × v s = s α r × β r s × v s
Equation (6) shows that the carbon emissions of country r could be seen as the sum of emissions caused by all countries’ value-added. As to countries r and s, the PBE in country r caused by value increment in country s—that means, CO2 emissions contained in value added chain from r to s—could be obtained as:
e v r s = α r × β r s × v s
Similarly, it is easy to gain the direct emissions in country s caused by the value-added in country r. That is the CO2 emissions transfer hidden behind the value-added chain from s to r, which can be written as following:
e v s r = α s × β s r × v r
So, the total emissions caused by value-added in country r could be obtained:
e v r = s e v s r = s α s × β s r × v r
Equation (9) describes all carbon emissions associated with the added value of region r, and reveals not only the full carbon emissions caused by economic increase in region r, but also where the emissions are emitted. This formula defines a new method, VBEs, to assess CO2 emissions of a country or region. In the VBE perspective, all the supply chains emissions that a country or region’s economic growth should be responsible for would be calculated in this country or region’s carbon emissions inventory.
Then, as to country r, the net carbon flow beneath the value-added chain from r to s could be estimated by,
n e v r s = e v r s e v s r
The net transfer out of CO2 of country r under the global value-added chains could be gained:
n e v r = e p r e v r = s n e v r s

2.3 Data Source

The analysis of this paper uses three datasets: input-output tables by countries, international bilateral trade of industrial production, and national basic information such as carbon emissions caused by fossil fuel use, GDP, population, etc. We retrieved data on economic input-output tables (IOTs) by country from the OECD Input-Output Database (which can be accessed at http://stats.oecd.org/, OECD.Stat → Industry and Services → Structural Analysis (STAN) → Input Output Database → Input-Output Tables) [51]. We retrieved data on international bilateral trade of industrial production from the OECD Bilateral Trade Database (ed. 2000 and ed. 2010) [52]. Unavailable data on trade and IOTs (some small economies such as Tunisia, Serbia, Cuba, Ecuador etc), were referenced from Eora MRIO database (http://worldmrio.com/), which is free for academic work at degree-granting institutions [53,54]. CO2 emissions, population, and GDP (at current $, constant, and Purchasing Power Parity (PPP)) are all derived from the world development indicators (WDI) from the World Bank [55]. CO2 emissions data from the WDI consists of five sectors, namely: CO2 emissions from electricity and heat production, CO2 emissions from manufacturing industries and construction, CO2 emissions from transport, CO2 emissions from residential buildings and commercial and public services, and CO2 emissions from other sectors. For consistency, we merged the first two sectors above into secondary industry and aggregated the third and fourth sectors into tertiary industry. The last sector was classified as the primary industry.
Correspondingly, we aggregated the IOTs of all countries into three sectors. We scaled the values of gross output in IOTs and trade data to conform to the macroeconomic data provided by the World Bank. We then organized all IOTs into a unified format. After that, we rebalanced the tables through the RAS method [56]. We then constructed a global multi-regional IOT on the basis of all countries’ intra-national IOTs and OECD Bilateral Trade Database. Since the OECD Bilateral Trade Database was not available for all countries that we studied and may be inconsistent with import and export data from IOTs, it is necessary to calculate the whole international bilateral trade matrices by sector first. Taking the OECD Bilateral Trade Database as sample data, and using the improved gravity model promoted by Liu W. (2015) [57], we gained the whole international bilateral trade matrices by sectors covering all countries we studied and being consistent with IOTs. Then, we compiled a global international input-output table using all countries’ unified IOTs and the international bilateral trade matrices by sector. In this process, each bilateral trade flow would be distributed linearly to intermediate- and final-use items in accordance with the original distribution coefficient matrix of the inflow country. Finally, the RAS method was used to balance the whole table.
The analysis presented here attempts to include 77 economies, sorted by product-based emissions in 2010: China (refers specially to Mainland of China, hereafter), USA, India, Russia, Japan, Germany, South Korea, Iran, UK, Canada, Italy, France, Indonesia, Brazil, Saudi Arabia, South Africa, Australia, Mexico, Spain, Poland, Turkey, Thailand, Taiwan, Ukraine, Kazakhstan, The Netherlands, Venezuela, Argentina, Egypt, Malaysia, Belgium, UAE, Pakistan, Algeria, Czech Republic, Kuwait, Iraq, Uzbekistan, Philippines, Switzerland, Austria, Sweden, Qatar, Greece, Nigeria, Finland, Norway, Chile, Colombia, Romania, Viet Nam, Israel, North Korea, Peru, Libya, Oman, Denmark, Belarus, Syria, Bangladesh, Hong Kong, Azerbaijan, Portugal, Morocco, Hungary, Turkmenistan, Trinidad and Tobago, Bulgaria, Ireland, New Zealand, Cuba, Angola, Slovakia, Serbia, Ecuador, Bosnia and Herzegovina, and Tunisia, representing over 98% of world GDP and CO2 emissions from fuel combustion (both source World Bank, 2000 and 2010 data), plus the rest of the world (ROW). Therefore, our research almost includes all the world’s sources of carbon emissions and economic growth. In most cases, individual countries are compared in our analysis, except in some cases such as countries in Western Europe, which are aggregated to one region since it is hard to distinguish their bounds in world map. Additional, the term “countries” would be used loosely to refer to some regions with political controversy.

3. Results

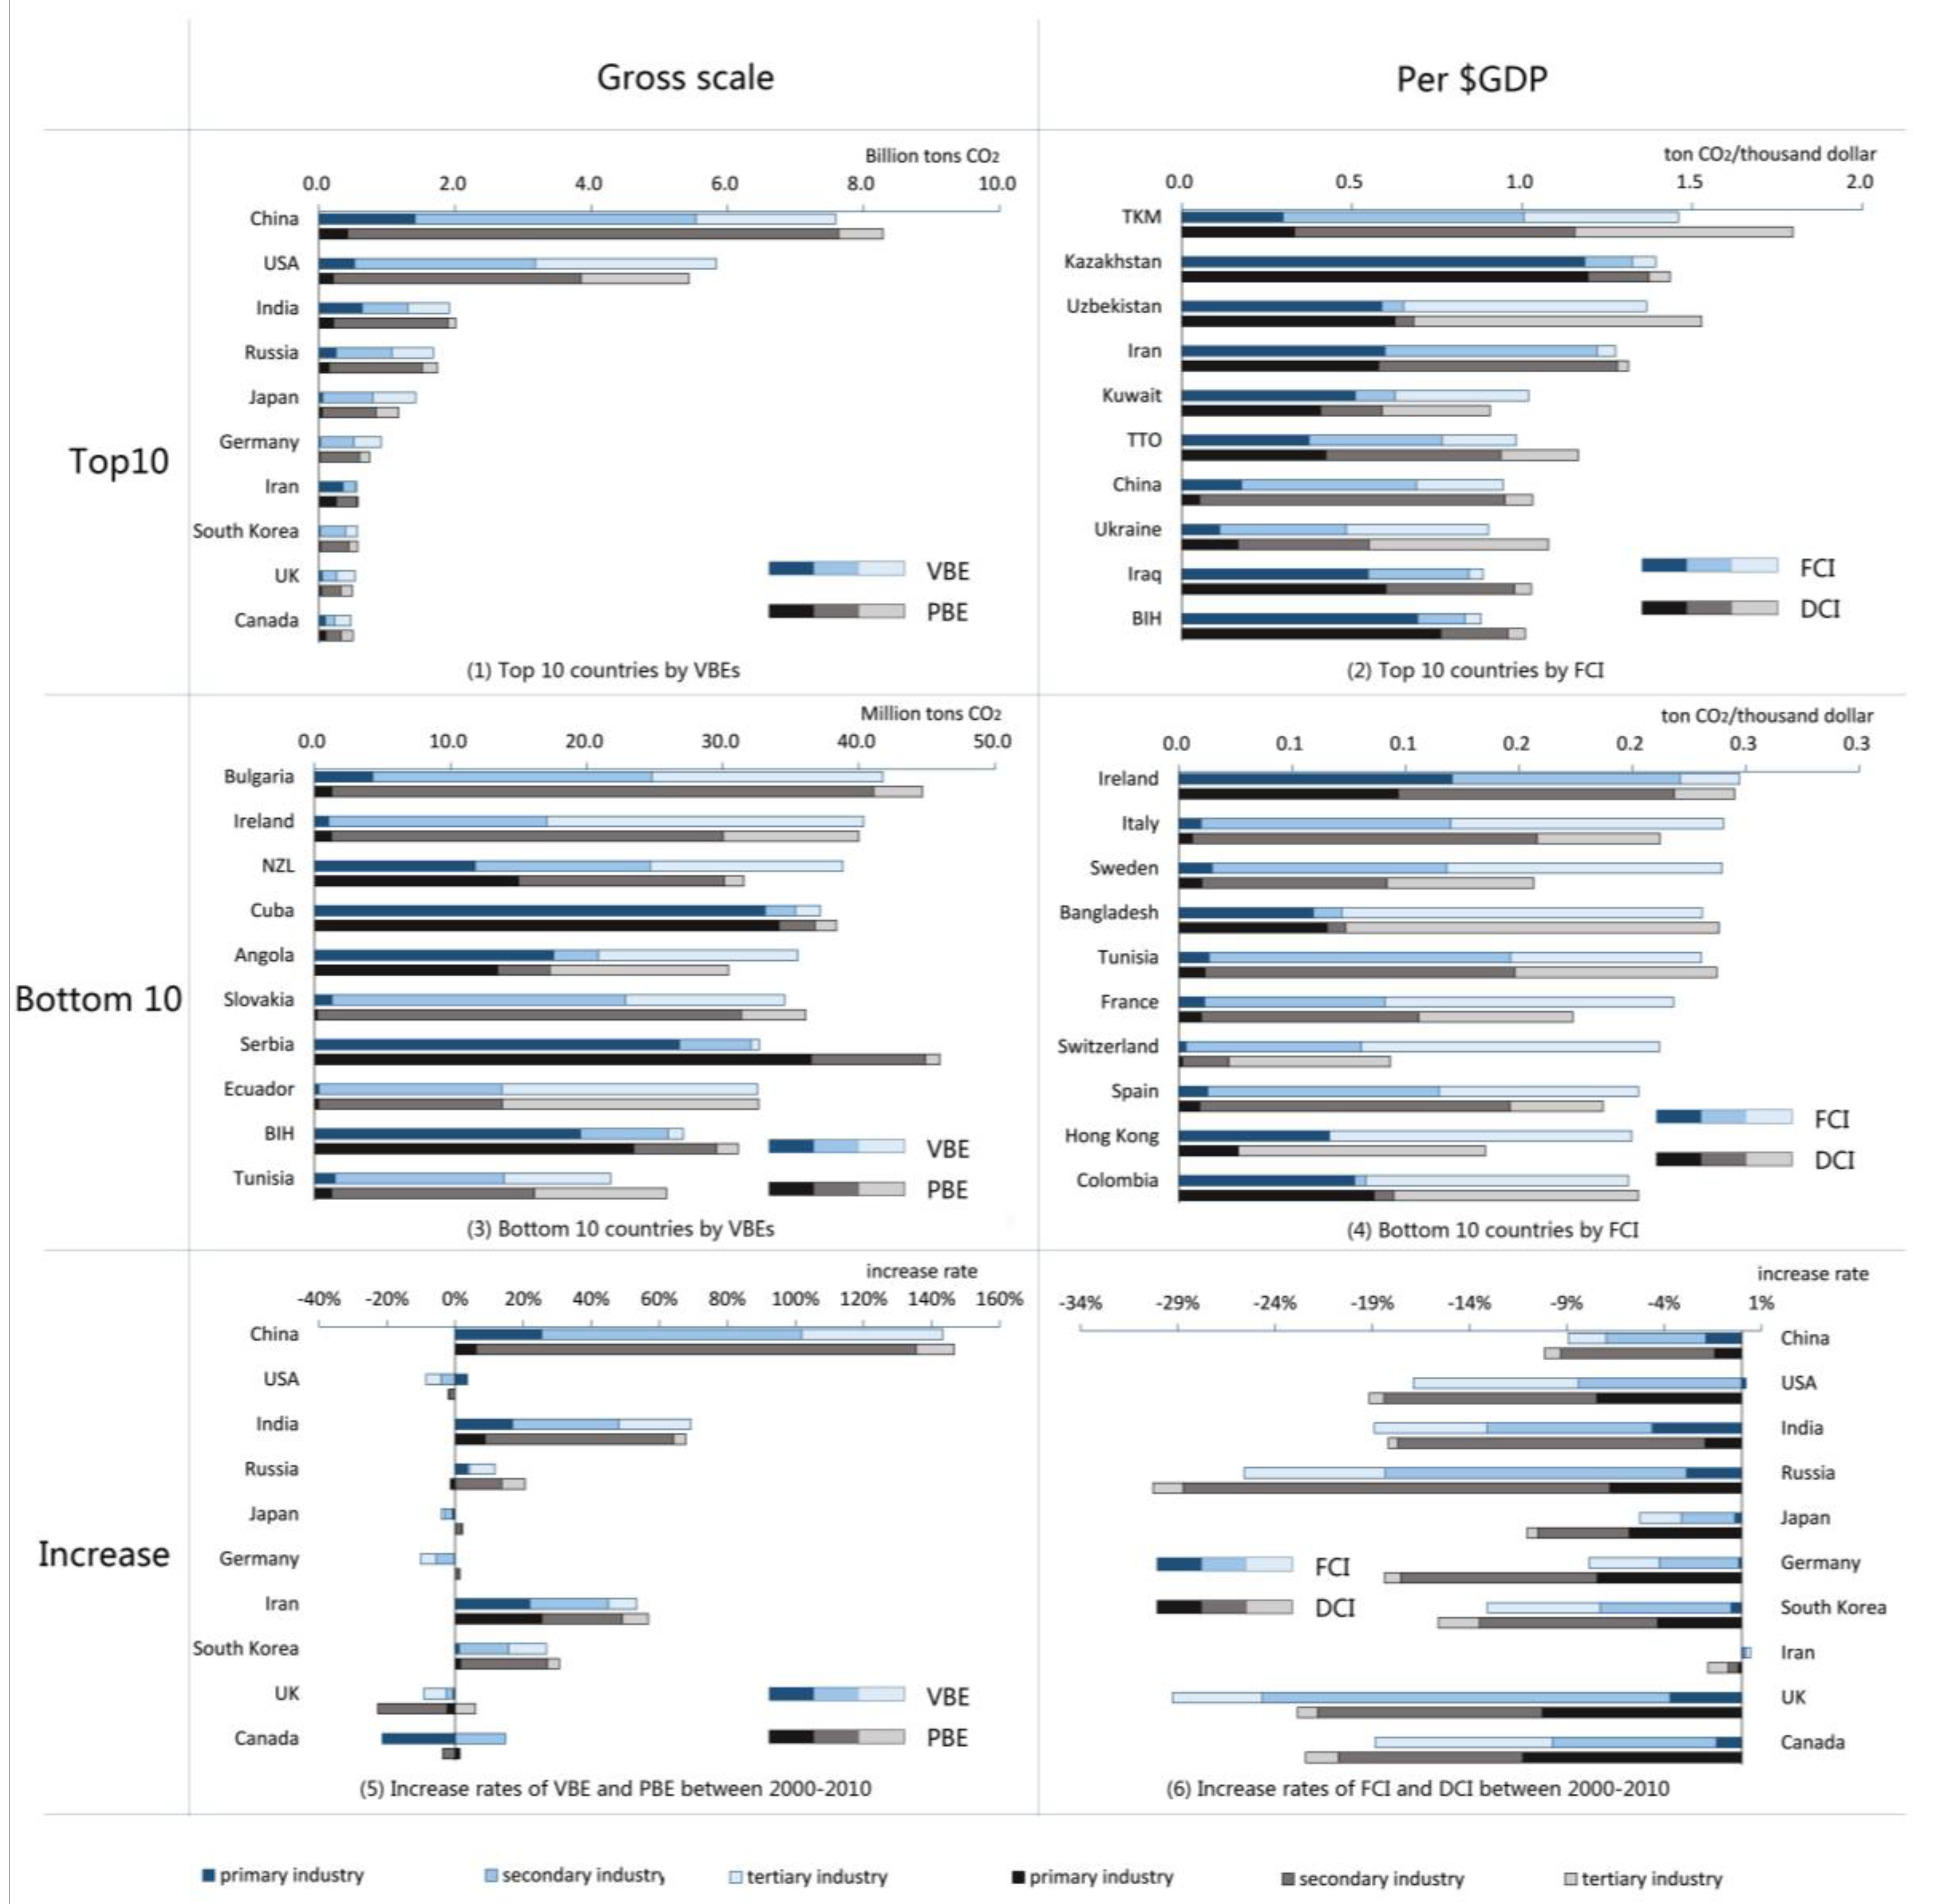
3.1 Gross VBEs and Gross PBEs

In 2010, 31.6 billion tons CO2 were emitted across the whole world. In the value-based perspective, China, USA, India, Russia and Japan were the Top 5 emitters, which all exceeded 1 billion tons of CO2, together accounting for 58.9% of the global gross emissions. This indicated that the economic growth of the above five countries were the main cause of the global CO2 emissions. The left part of Figure 1 shows the top and bottom 10 countries by VBE in 2010, presented with a component of three sectors and their increase rates of VBE for Top 10 countries in 2000–2010. In this figure, comparisons between VBE and PBE were also presented. From Figure 1, it could be found that countries with high VBEs generally have high PBEs. The Top 10 countries by VBEs in the world are also the Top 10 countries by PBEs and collectively accounted for 67.9% of global gross emissions. Thus, the roughly similar sequences of countries by PBE and VBE show that CO2 emissions caused by one country’s economic growth are mostly emitted within its own territory.
From sectoral view, it can be found from Figure 1 (left) that, under the PBE accounting system, carbon emissions in most countries are from the secondary industry. This is particularly obvious for developing countries, such as China, India, and Russia. Even in many developed countries, such as Germany and Japan, emissions from the secondary industry have contributed to a large proportion of PBEs. However, under the VBE accounting system, emissions by tertiary industry significantly contribute to the proportion of gross carbon emissions. All Top 10 countries exhibit this behavior. Therefore, the value-added chain of the tertiary industry actually contributes to carbon emissions by the secondary industry.
From the increase rates of VBE of the Top 10 countries (left bottom of Figure 1), we can find that, between 2000 and 2010, many developing countries, such as China, India and Iran, three of Top 10 countries by VBE, have also high increase rates of VBE, which exceed the average increase rate of global CO2 emissions (31.41%). In contrast, the increase rates of VBE of many developed countries, such as UK, Canada, USA, Germany, Japan and including Russia and South Korea, within the Top 10 countries by VBE, are lower than world increase level. Meanwhile, it could be found that China has the highest increase rate of VBE as well as PBE among the 10 countries, followed by India and Iran. For China and India, the secondary industry is not only a dominant source of growth for PBEs, but also an important driver for VBE growth, while for Iran, the first industry is a factor that cannot be ignored. On the contrary, in some developed countries, such as UK, Canada, Germany and USA, VBEs are decreasing. So, we can say that the economic increases of emerging markets, especially China and India, are the main cause of world CO2 emissions growth in 2000–2010, where the sum of VBEs’ increases in China and India accounts for 70.0% of global CO2 emissions’ growth.
The VBE reflects the full emissions caused by economic growth, so the economic increase is the main cause of increase of VBE. Figure 2 presents the relationship between VBE increase rate and GDP increase rate, which is calculated according to GDP at constant $ price (2005) from the World Bank, and the origin point represents the world average level. Generally, the value-added part in the input-output table consists of employment income, depreciation of fixed assets, taxes, profits, and others, of which employment income is a main part. Here, the value-added can also be regarded as the GDP calculated by the income method. So, here we use the World Bank’s classification of high-income, middle-income, and low-income countries to compare the differences among above three types of countries in terms of the relationship of GDP growth and VBE growth. It could be found that there is a roughly positive correlation between them (the correlation coefficient between them is 0.65), and most of the high income countries have low VBE increase rate and slow GDP growth, excepting Qatar, Oman, Kuwait, etc., which have an economic characteristic of being energy products supplier. Most middle-income countries have a relatively high GDP increase rate (higher than world average level) and about half of them have bigger VBE increase rates than the world average level, especially Angola, China, Azebaijan, and Kazakhstan, whose VBEs increase and GDP increase both much quicker than others. Most low-income countries also have a relatively high GDP increase rate while their increase rates of VBE are not very high.
A nation that has a VBE lower than its PBE indicates that the impact of other nations’ economic growth on this nation’s carbon emissions is greater than the impact of its own economic growth on other nations’ emissions. Thus, this country belongs to the net carbon emissions flow-out area. In contrast, a nation that has a VBE higher than its PBE indicates that the impact of its economic growth on other nations’ carbon emissions is greater than other regions’ impact on this nation’s carbon emissions. Thus, this country belongs to the net carbon emissions flow-in areas.

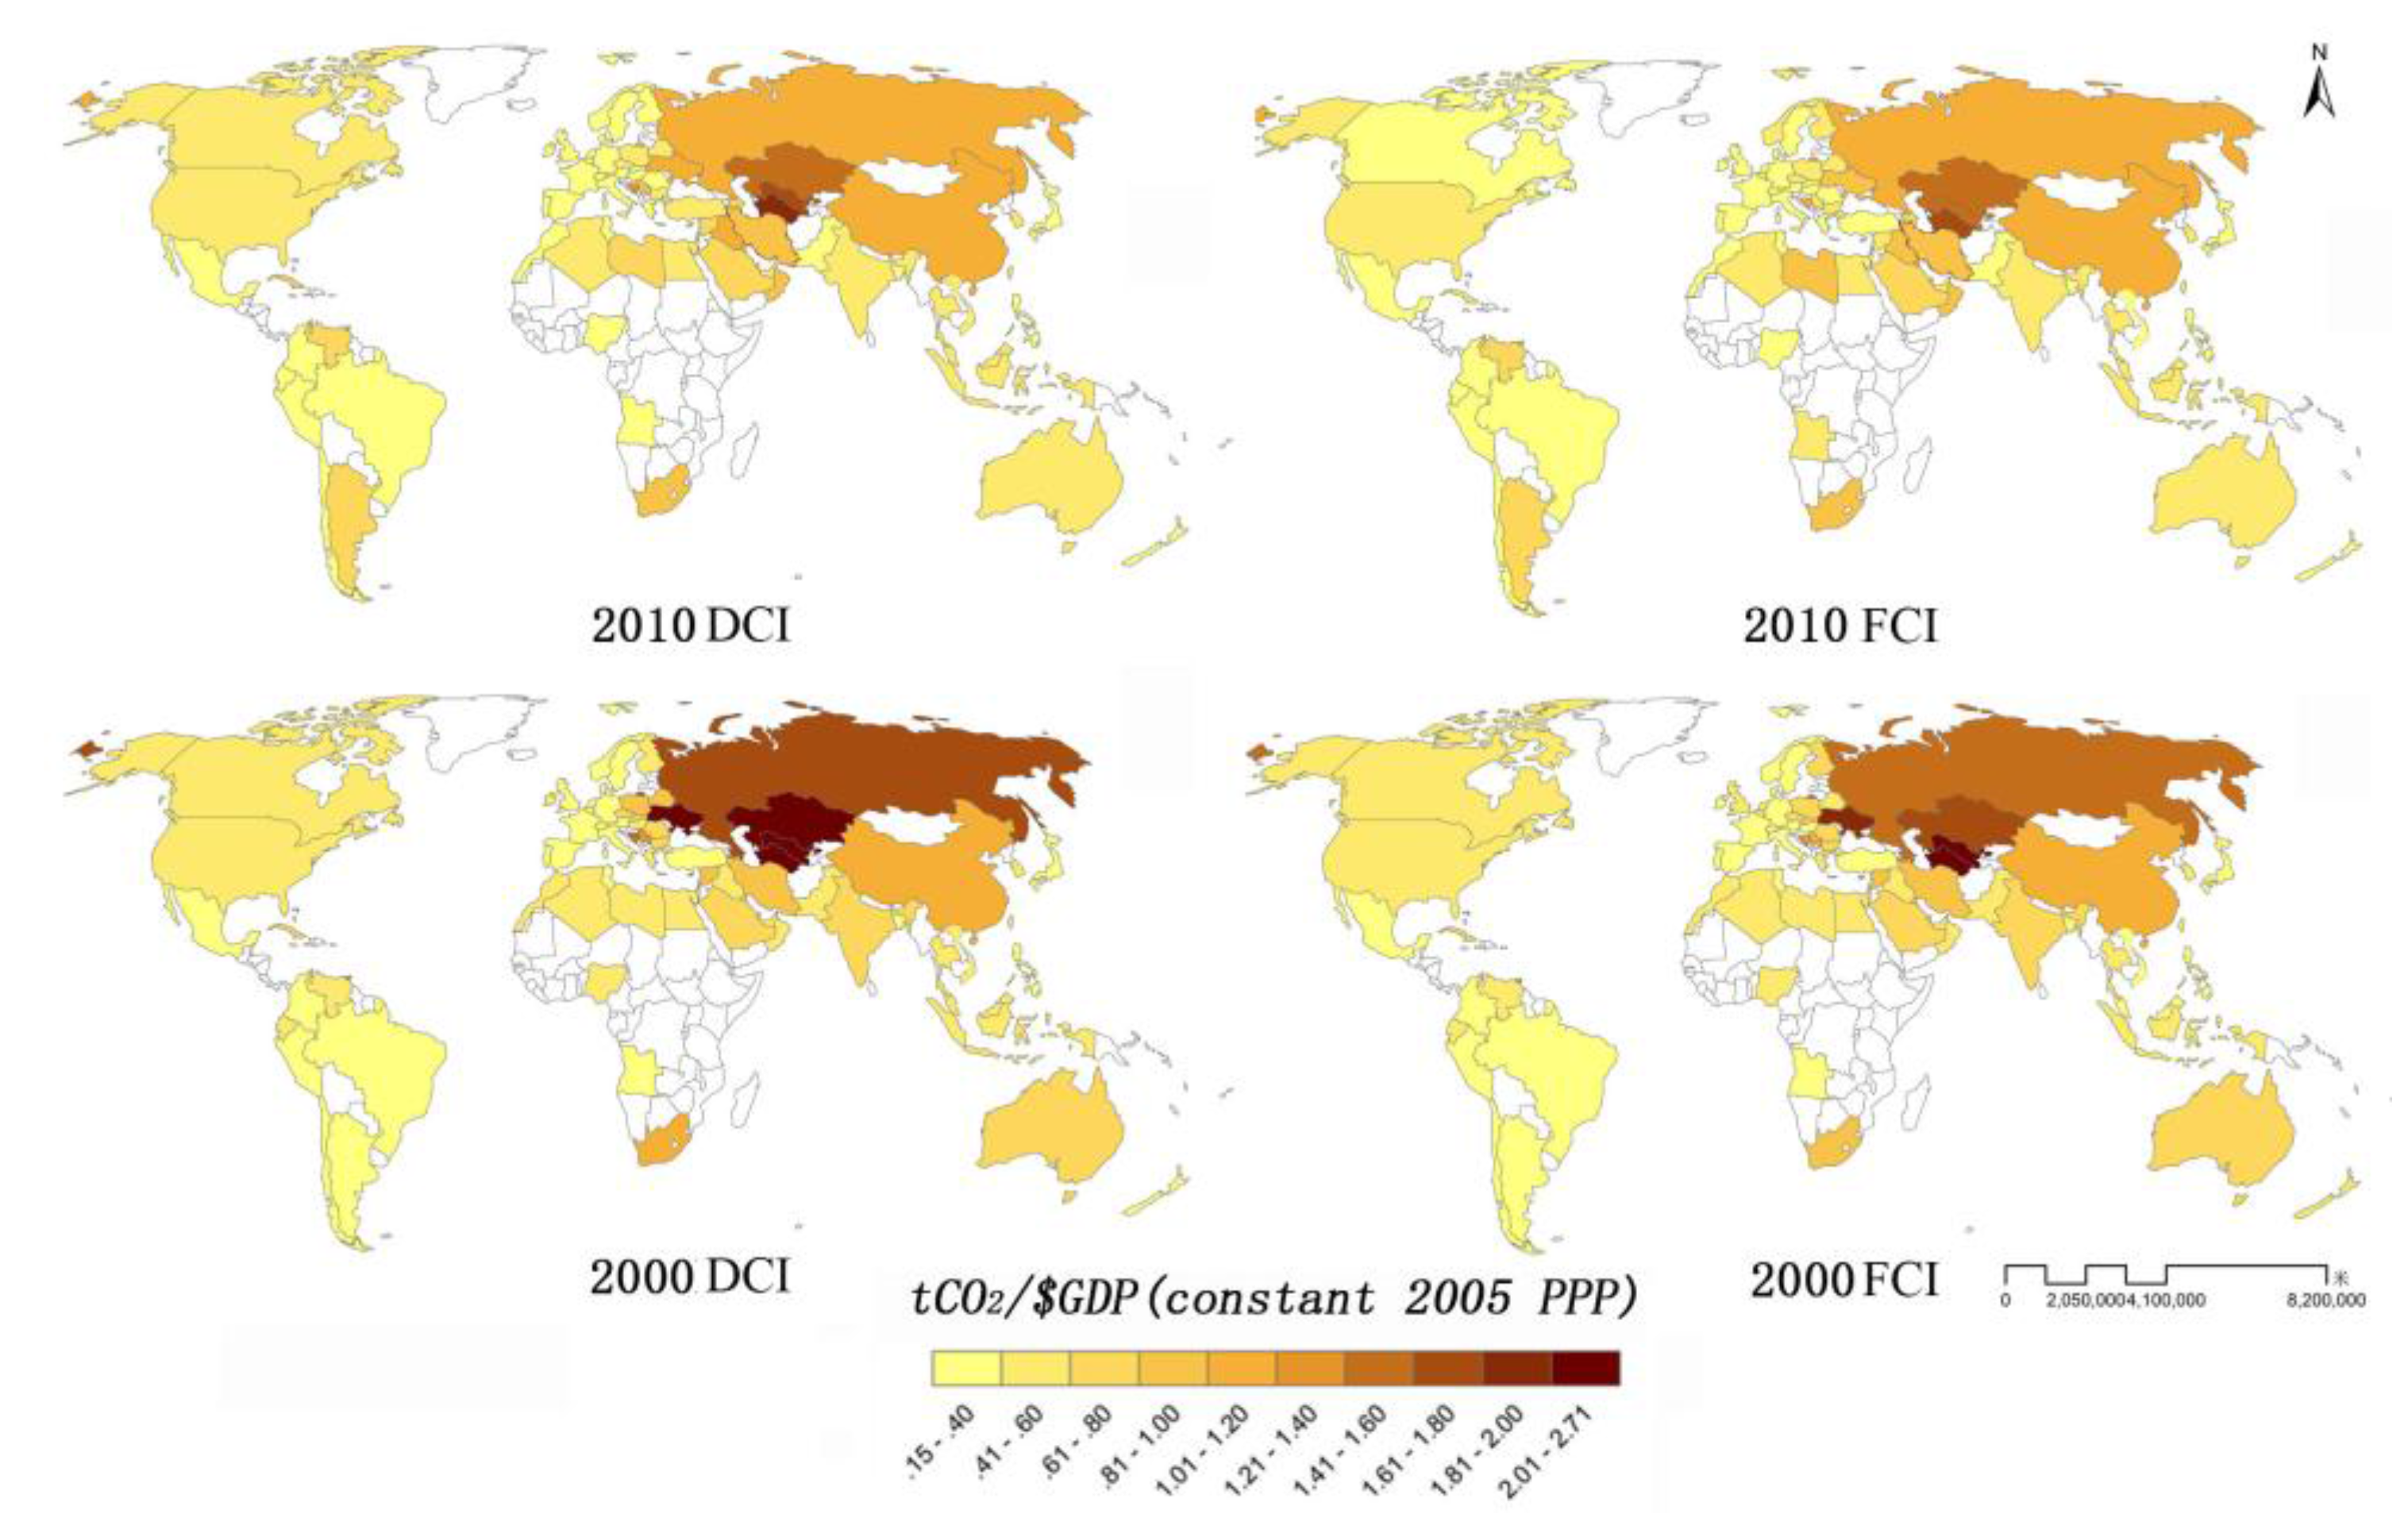
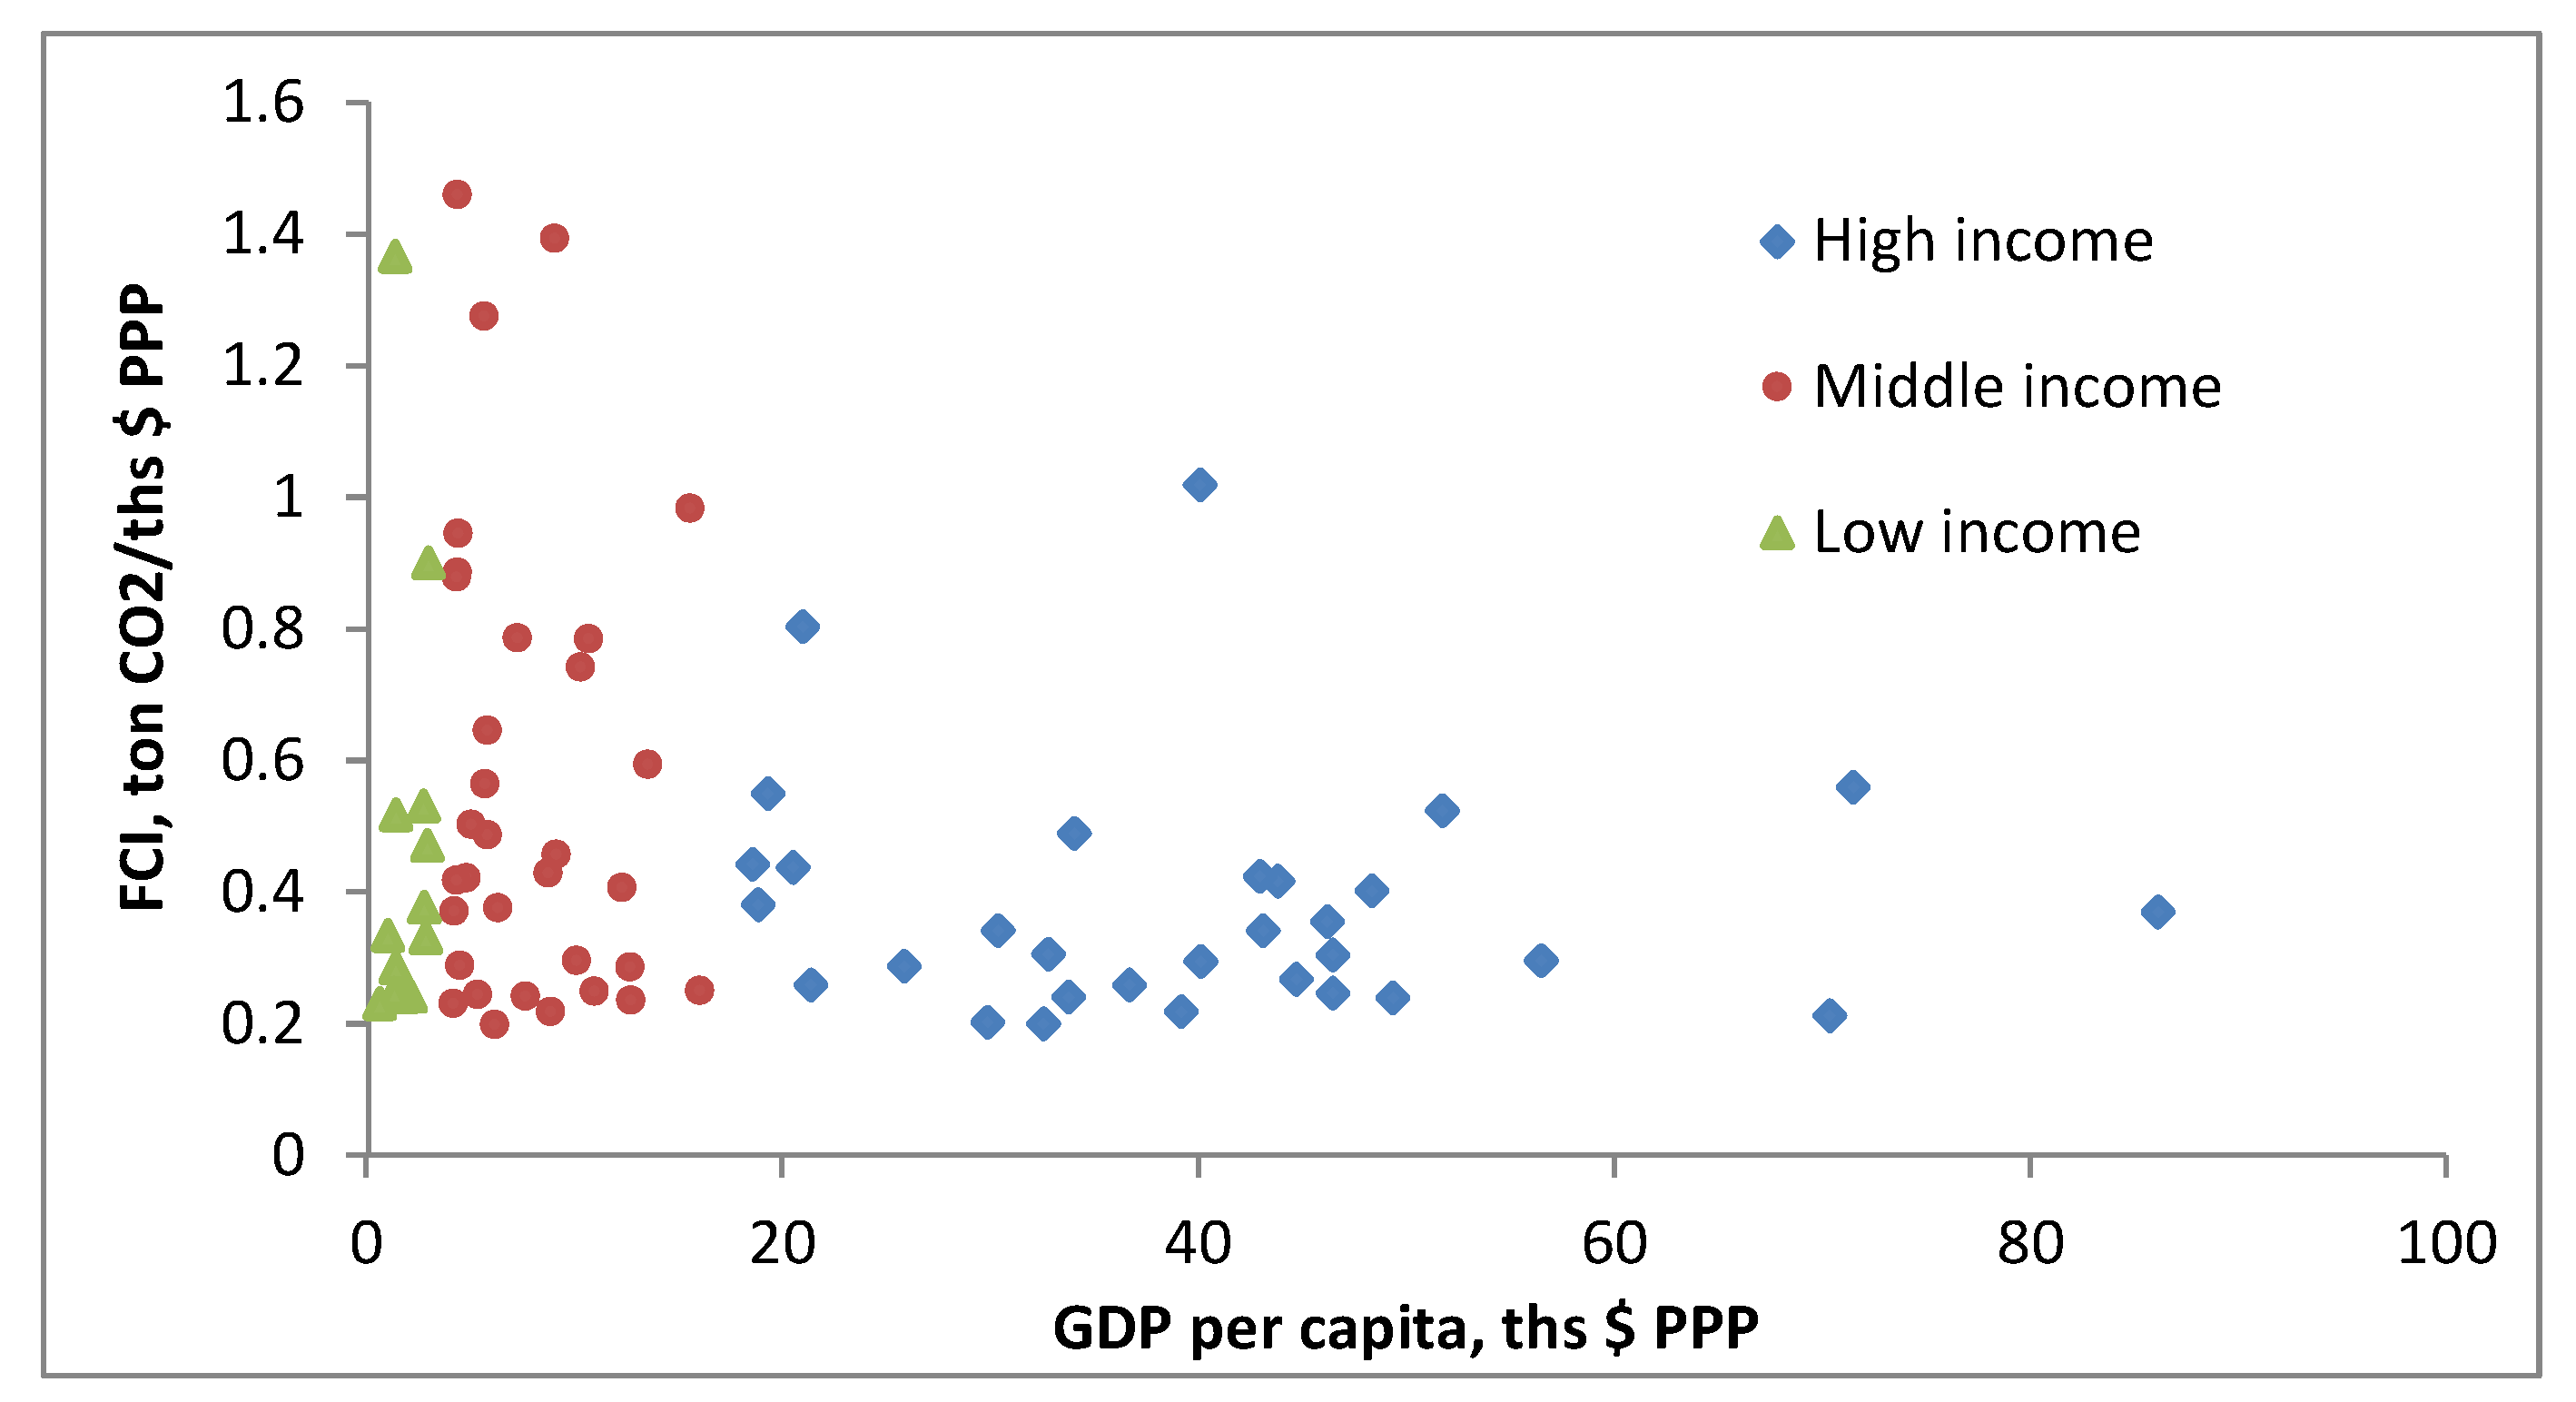
3.2 Full CO2 Emissions Intensity and Direct CO2 Emissions Intensity

Broadly speaking, CO2 intensity is generally expressed by the rate of CO2 emissions to GDP. Typically, it is familiar as the direct CO2 emissions (PBEs) per unit of GDP, that is, the Direct CO2 Emissions Intensity (DCI for short). Here, we employ the term of “Full CO2 emissions Intensity” (FCI for short) by dividing VBE by GDP to express the full impact of unit of GDP on CO2 emissions including direct emissions within territory and indirect CO2 emissions outside the territory.
The right part of Figure 1 gives the top and bottom 10 countries by FCI in 2010, presented as components of three sectors, and compares with DCI. Increase rates of FCI as well as DCI in 2000–2010 refer to the top 10 countries by gross VBE also are given. From this figure, we can find that many middle Asia countries such as Turkmenistan, Kazakhstan, Uzbekistan, Iran, and Kuwait are the areas with high FCI. We can find that most of the FCI sector mixes in these countries are dominated by the primary industry, which includes the mining and quarrying sector. On the contrary, FCIs in many countries in Europe such as Spain, France, Switzerland, Sweden, and Italy are relatively low, and in these countries, FCIs are dominated by the second and tertiary industries. Meanwhile, some countries with low economy growth such as Colombia, Tunisia, and Bangladesh show lower FCIs as well, and Colombia and Bangladesh both have big proportions of the primary sector in the FCIs.
Figure 3 shows the results of FCI at country level in 2010 and 2000. By comparing national FCI and DCI, it is evident that the order of size was not significantly changed. That is to say, a nation with higher FCI also tends to have higher DCI, while a nation with lower FCI generally has lower DCI. For example, Uzbekistan, Turkmenistan and Ukraine rank in the Top 3 by FCI as well as DCI, while Switzerland, Sweden, France, and Spain rank in the bottom 10 by FCI and DCI. Furthermore, from Figure 1 (right-top and -middle), we can find an interesting phenomenon that FCIs in most Top 10 countries are all smaller than their DCIs, while FCIs are all bigger than DCIs in most bottom 10 countries. This indicates that, under the added-value chain, generally, high emissions intensity countries are carbon exporters while low emissions intensity countries are carbon importers.
The Environmental Kuznets Curve (EKC) hypothesis postulates an inverted-U-shaped relationship between different pollutants and per capita income. FCI inflects the full emissions impact of unit GDP as to a country or region; according to the EKC theory, it is instinctive that a developed country should have lower FCI than a developing country. In other words, FCI should be negative with economy development. Figure 4 shows the scatter plot between FCI and GDP per capita. It was found that the law of EKC seems difficult to find in this scatter chart, especially in some exceptional countries, such as Kuwait (1.02), Qatar (0.56) and Oman (0.80), which have high income level and also high FCIs. Some developing countries such as Colombia (0.20), Tunisia (0.23), Brazil (0.25), and Peru (0.24) show low FCI, and even some under-developing countries such as Bangladesh (0.23), exhibit low FCI, too. However, when we investigate the average FCIs and DCIs for different income level regions (Table 2), the EKC law is obvious. The middle-income region has the highest values, and the high-income region and low-income region have obviously low values. We also can find from Table 2 that DCI shows a more curved inverted U-shaped curve than FCI, which is indicated by the higher value of DCI than FCI of middle income region. That means that, as the economy grows, DCI grows faster than FCI and then declines faster than FCI too.
Global CO2 emissions intensity of economic growth went through a slight decline from 2000 (0.52, constant $ 2005) to 2010 (0.50), but at country level, there exists a big difference. The right-bottom section of Figure 1 shows the FCI’s increase of Top 10 countries by VBE; Russia and UK both exhibit quick FCI decline (>25%), and India, Canada, USA, and South Korea also go through rapid FCI decrease (10%–20%). However, China, Japan and Germany performed poorly, with their FCI decrease rates just between 5%–9%, likely because of the rapid economy growth in China and nuclear power reduction in Japan and Germany.

3.3 CO2 Embodied in Value Added Chains

Approximately 4.0 billion tons of CO2, 12.5% of all emissions derived from fossil-fuel combustion were emitted elsewhere during the economic growth of each country in 2010. This percentage is higher than that observed in 2000 (2.45 billion tons, 10.2%). Here, the figures do not include the transfer of embodied carbon emissions among different sectors within one country (the same below) given that the carbon emissions embodied in intra-national flows are not the focus of this study. In additional, the dominant direction of carbon movement is from developing countries to developed countries, thus reinforcing the existing large international difference in PBE and prolonging the decline of global carbon emissions intensity.
Figure 5 describes four groups of Top 10 countries sorted by net exports (left) and net imports (right) of CO2 emissions presented as gross value (up) and per unit GDP (down) in 2010, as well as comparison with 2000. GDP at constant 2005 PPP $ were used in this figure. The top-left section of Figure 5 shows the Top 10 countries by CO2 mass of net exports in 2010, together accounting for 78% of sum of net export CO2 in all exporters. We can find that, at country level, up to 2010, China is the largest net exporter of carbon emissions mainly contributed by the secondary sector beneath the global value-added chain system, followed by India, Vietnam, Russia, South Africa, Mexico, and Ukraine. Top right of Figure 5 shows the Top 10 countries by CO2 mass of net imports in 2010. It can be found that, the main net importers of carbon are the United States, Japan, Germany, France and some other European countries, and Australia. Thus, the main direction of emissions transfer embodied in value-added chains is from developing countries to developed countries.
From the changes in import and export scales of emissions between 2000 and 2010 (top of Figure 5), we found that, during 2000–2010, in most of the main net export countries, except Russia and Canada, the gross scales of net export emissions all have significant increase. For example, China increased from 328 Mt to 696 Mt, increasing by 112%; India increased from 45 Mt to 93 Mt, increasing by 106%; Vietnam had the fastest growth, increasing from 7 Mt to 79 Mt, more than 10-folds. Decreases of net export scale in Russia and Canada may be due to their adjustment of economic structure in that period. Meanwhile, most of the net importers, except UK, The Netherlands and France, all have rapid improvement of the net import scale of CO2 emissions, especially USA (raising from 244 Mt to 406 Mt, increasing by 67%), Japan (raising from 167 Mt to 247 Mt, increasing by 48%) and Germany (raising from 75 Mt to 172 Mt, increasing by 129%). The increase fastest country is Australia with an increase rate of 148% during 2000–2010. The decline of net CO2 imports in UK, Netherland, and France is likely related to the slowdown of their economic development. Regarding most other countries in the world, the gross scales of CO2 net trade were expanding during 2000–2010, except in several countries like Greece and South Korea, both with decline of net CO2 export, and Iceland, with a decrease of net CO2 import. So, this reflects the trend of global CO2 emissions trade embodied in added-value chain wherein it has tended to strengthen.
From a sectoral view, as to most carbon exporters, the main export sectors are the primary and secondary industries, such as China and India from the gross scale, and Turkmenistan and Vietnam from the per $GDP scale. The carbon exports of the tertiary industry in this countries or regions are less, but for most carbon importers, the tertiary industry has become an important sector that cannot be ignored, such as in USA and Japan in gross scale, and Norway and Finland in per $GDP scale. This situation also reflects the inter-sectors transfer of embodied carbon emissions are mainly from the primary and secondary industries to the tertiary industry.
From the view of the relative size, ratios of trade emissions to gross PBEs for countries show lager differences in 2010. Net imports of carbon to Japan, New Zealand, and countries in Western Europe such as Germany, France, The Netherlands, Finland, Austria and Norway account for >20% of their direct fossil fuel emissions. In some small countries such as Switzerland, Belgium, Sweden, these ratios are >50%. Hong Kong SAR also exhibits a high rate (48%) in this field. The net imported emissions fall to 10–15% in Italy, Australia, Kuwait, Qatar etc. In the United States (7.5%) and the UK (7.3%), these ratios are even less, as well as in Spain (8.3%). In contrast, net exports represent less than 10% of emissions produced in most of the main emerging markets such as China (9.6%), India (4.6%), Russia (3.5%), and Brazil (5.2%); however, this ratio is relatively high in South Africa (13.1%). In some under-developing countries in Southeast Asia, the ratios of net export emissions to territorial emissions are higher, such as in Vietnam (32.46%), Malaysia (18.4%), and the Philippines (8.6%), as well as many Middle Asia and Eastern European countries such as Turkmenistan (18.7%), Hungary (10.6%), Uzbekistan (10.6%), Iraq (13.8%), Ukraine (16.5%), and Poland (10.3%).
During 2000–2010, many countries’ ratios of net trade emissions to PBE are increased. For example, the figure in China increases from 8.4% to 9.5%, in India it expands from 3.8% to 4.5%, and that in South Africa improves from 9.6% to 13.1%. This excludes Russia and Canada, whose ratios of net export emissions declined. As to net import countries, the ratios of net imports emissions to territorial emissions are also improved during 2000–2010, i.e., figures in the United State (from 4.3% to 7.5%), Japan (from 13.7% to 21.1%), Germany (from 9.1% to 23.1%), etc. all increased rapidly. However, the ratios in some countries, especially in West Europe including the UK (from 17.0% to 7.3%), France (from 29.7% to 25.6%), and The Netherlands (from 41.4% to 21.5%), decreased. So, the changes of the above figures also demonstrate the strengthened trend of CO2 emissions trade embodied in the global added-value chain.
If we use PBEs minus VBEs and then divide it by GDP (constant 2005 $ PPP), the differences divided by GDP between VBEs and PBEs by country in 2000 and 2010 could be obtained (left of Figure 6), which refer to the net transfers out of carbon emissions per unit of GDP under global value added chains. The blue color (negative data) means net transfer in of CO2, red color (positive data) means net transfer out of CO2; the deeper the color, the larger the value. The right-hand section of Figure 6 shows the total net transfer out of CO2 emissions (the ground color, similarly: red is positive, blue is negative) with international carbon transfer fluxes >10 Mt CO2. The width of the arrow legend in the right-hand section of Figure 6 represents 10 Mt CO2. The rest of the world is excluded and appears white. Western Europe was treated as one region including Austria, Belgium, Denmark, France, Germany, Ireland, Italy, The Netherlands, Portugal, Spain, Sweden, Switzerland, and the United Kingdom.
From Figure 6, we can find that, except for the top exporters and importers indicated in Figure 5, many countries in Middle East, Eastern Europe, Southeast Asia, and North Africa are also CO2 net exporters under the added-value chains system, and several under-developed countries in Africa and South America such as Angola, Libya, Peru, Azerbaijan etc. and several small rich countries such as Qatar, Kuwait and Oman characterized as energy suppliers, also are CO2 net importers, although their import scales are small.
Normalizing the difference between VBE and PBE by GDP (constant 2005 PPP international $) highlights that net exporters of emissions per unit GDP are concentrated in Asia and East Europe (Figure 6, left), especially in Turkmenistan (686 kg CO2/thousand $ GDP), Vietnam (609), and Serbia (402), which rank as the Top 3 by net export emissions per unit GDP, followed by Ukraine (330), Uzbekistan (250), China (232), South Africa (171) and Malaysia (151) in 2010 (Figure 5, lower left). Most of the above numbers are increased from the year 2000, with the largest increased country being Vietnam, a leader of economy growth in Southeast Asia. In some wealthy but smaller economies with high industrial technology, net imports of emissions per unit GDP are large compared to their economic level, such as Belgium (−201), Switzerland (−191), and Sweden (−114), or with abundant natural resources such as Qatar (−185) and Kuwait (−168), which have a relatively steady political environment and good locations. Most of above figures showed an increase during 2000–2010, too (Figure 5, bottom right).
The largest interregional fluxes of emissions embodied in global value-added chains again confirmed that the main direction of emissions transfer is from developing countries to developed countries. A consistently significant global characteristic is the transfer-out of carbon from China to support economic growth in Western Europe, the United States, Japan, and South Korea during 2000–2010. This feature is emphasized with the increase of emissions fluxes from China. In particular, the Sino-Europe flux increased from 89 million tons of CO2 to 200 million tons of CO2 within a decade. Meanwhile, net emissions exports to other large countries, such as Australia, Canada, Russia, and Brazil, from China are also conspicuous. Small net emissions transfers from China to some under-developed countries, such as Indonesia and the Philippines, also exist. While countries with net export of emissions to China just include several under-developed countries (e.g., Vietnam, North Korea), some central Asian countries (e.g., Uzbekistan), and individual Africa countries (e.g., Egypt), all net export amounts are too small to be included in the map. In addition, Russia, South Africa, Mexico, some Eastern European countries, the Middle East, and Southeast Asia all have net transfers of emissions to Western Europe. Canada and Mexico also transfer large amounts of carbon emissions to the United States.

4. Discussion

As previously discussed, the principle of territorial responsibility for CO2 emissions would easily result in carbon leakage under globalization, thus undermining the effects to combat global warming. Therefore, several studies have promoted the CBE method given its effectiveness and neutrality [58,59]. For instance, someone emphasized that “who consume goods … should also share the responsibility”, and recommended China to “claim consumption based accounting system” in the global climate negotiations, which would be a “fairer method of allocating responsibility for GHGs” [60]. Nevertheless, the CBE principle has the following weakness: the producer in the export sector may not improve their energy consumption by upgrading their production technology, while they could derive economic benefits from CO2 emissions generation. Thus, some studies have suggested that producers and consumers should share responsibility for carbon emissions to facilitate an international agreement on global climate policy [4,7,40]. For example, Ferng developed a framework for sharing responsibility for CO2 emissions on the basis of the benefit principle and ecological deficit [61]. The most difficult task in sharing responsibility, however, is to reach a consensus on the share rates of individual participating countries. Our study promotes an optional framework to account for anthropogenic CO2 emissions within the context of the economic benefit principle. If it is served as a supplement for calculating the amount of CO2 emissions reduction that a country is responsible for, problems such as carbon leakage and resistance to improving the energy efficiency of exporting sector may be solved because all the supply chains emissions associated with the economic growth of a country would be considered. Moreover, the only approach to reduce responsibility for pollutant emissions is to improve the energy efficiency of production and supply. Thus, CO2 emissions responsibility should be assessed through the combined methods of PBE, CBE, and VBE to ensure that the overall carbon reduction goal is attained.
Similar to the CBE accounting system, VBEs are less certain than PBEs, too. This is one of the main reasons to delay the applications of VBE as well as CBE. The uncertainty in the VBE system is mostly caused by the following aspects: First, whether imported products are consumed by an intermediated or final user and how the imports are allocated among different sectors are unclearly defined in a compiled MRIO table. Given the assumption that inter-industry transactions within and between regions are linearly proportionate, the GHG emission estimates for complex production chains may be highly uncertainty [24]. Second, the MRIO compilation requires single regional IOT from all associated countries or regions. The original tables contain different levels of uncertainty. Currently, IOTs are unavailable for some countries. So, uncertainty in MRIO modeling is clearly an area that requires further attention by researchers. Third, some studies have shown that sector aggregation also brings great uncertainty for consumption-based emissions accounting in some cases [62]. This uncertainty is more obviously if one single region or country’s IOT, especially competitive import IOT [63], is used to estimate embodied carbon footprints in trade, because some special adjustments should be made for further calculation. As to the global multi-regional IOT, whether there is the uncertainty caused by sector aggregation still needs to be further studied.
Databases containing inter-national IOTs should therefore be well established to improve the quantification of carbon emissions from the perspective of CBE and VBE. At present, some institutes have built and released free global multi-regional IOTs, such as world input-output database (WIOD, http://www.wiod.org), global multi-regional environmentally extended input output database (EXIOBASE, www.exiobase.eu), the inter-country input-output database (ICIO, http://www.oecd.org/sti/ind/inter-country-input-output-tables.htm), global trade analysis project (GTAP, https://www.gtap.agecon.purdue.edu/), and the eora MRIO database (http://www.worldmrio.com/). However, the coverage and quality of these databases still need to be improved. For example, the WIOD database does not provide data for the majority of Middle Eastern and African regions despite their key roles in the global energy supply. This is also the main reason why we did not use the WIOD database. Although we attempted to include Middle Easten and some African countries, we found some data unreliability in the analysis process. Therefore, improving the reliability and authority of the basic data is an important task for defining the carbon emission responsibility of a country or region.

5. Conclusions

Inspired by the idea of CBEs, we set up a model to estimate accumulated CO2 emissions behind economic increase, named VBE. Then we assessed VBEs of the 78 countries or regions in the world, that account for >95% of the global emissions in both the years of 2000 and 2010. We further analyzed the change of each country’s VBEs, FCI, and CO2 fluxes embodied in international value-added chains.
The VBE reflects the full amount of emissions caused by a country’s economic growth. VBE results are roughly consistent with PBE results, indicating that CO2 emissions caused by one country’s economic growth are mostly emitted within its own territory. In general, a country with a high GDP growth rate also has a high VBE growth rate. Our results indicated that the majority of high-income countries have low VBE and GDP growth rates, whereas most low-income countries have high GDP and VBE growth rates. We also found that the low- and high-income countries generally have low FCIs and DCIs, whereas mid-income countries mostly have high FCIs and DCIs. These observations are generally consistent with the EKC law.
Our results showed that approximately 4.0 billion tons of CO2, 12.5% of all emissions produced by fossil-fuel combustion, were emitted elsewhere under the global value chain in 2010. This percentage is higher than that in 2000 (2.45 billion tons, 10.2%) and could be attributed to the increase in exports from China and other emerging markets, such as Russia and South Africa, to developed countries, such as the United States, Germany, Japan, and France. CO2 emissions embodied in international value-added chains could be used to indicate the influence of one country’s increase in wealth on another country’s carbon emissions and thus reveal the international imbalance between environmental pollution and economic development. Our results showed that global unbalance increased during the period of 2000–2010 with the expansion of international fluxes of net trade emissions embodied in the international value chain. Emerging markets, especially China, are generally the main recipients of emissions, whereas Europe, the United States, and Japan are the main countries that outsource their emissions through the international value chain.
As previously discussed in the introduction, the PBE accounting system may cause carbon leakage because developed countries could transfer their carbon-intensive industries to developing countries, thus increasing emissions on the global scale. The CBE accounting system, a hot issue in academic research, lacks the mechanism to provide incentives to producers to reduce their emissions and ignores the wealth acquired by the producer in the process of CO2 emission. Compared with PBE and CBE, the VBE accounting system more efficiently stimulates producers and consumers to reduce carbon emissions. The producer should not only focus on the carbon emissions of their own production process, but reduce carbon emissions during the production of their raw input materials. The consumer has a certain relationship with the carbon emission of all of the upstream production chains of a commodity because their country may have benefitted from commodity circulation. Thus, if the VBE system is applied to supplementary hold nation’s carbon emissions responsibility with PBE and CBE, according to the results of our study, some emission importers, e.g., the United States, European countries, and Japan, would be more willing to help emission exporters, e.g., China, India, and Russia, to reduce carbon emissions by implementing Clean Development Mechanism projects. This approach will promote the achievement of global carbon emission reduction targets, ultimately.

Acknowledgments

This study was funded by the Project of Ministry of Education for the Development of Liberal Arts and Social Sciences of China (Grant No. 16YJA790027).

Author Contributions

Hongguang Liu conceptualized and design the work, operated the calculation, and wrote the paper. Xiaomei Fan collected and analyzed the data, visualized the results.

Conflicts of Interest

The authors declare no conflicts of interest.

Abbreviations

CBEConsumption-Based accounting of CO2 Emissions
CDIACCarbon Dioxide Information Analysis Center
COPGlobal Conference of Parties
DCIDirect Carbon emissions Intensity
EKCEnvironmental Kuznets Curve
FCIFull Carbon emissions Intensity
GDPGross Domestic Production
GHGGreenhouse Gas
IOTInput-Output Table
MRIOMulti-Regional Input-Output table
OECDOrganization for Economic Cooperation and Development
PBEProduction-Based accounting of CO2 Emissions
PPPPurchasing Power Parity
ROWRest Of the World
UNFCCCUnited Nations Framework Convention on Climate Change
VBEValue-added Based accounting of CO2 Emissions

References

  1. Peters, G.; Andrew, R.; Solomon, S.; Friedlingstein, P. Measuring a Fair and ambitious climate agreement using cumulative emissions. Environ. Res. Lett. 2015, 10, 105004. [Google Scholar] [CrossRef]
  2. Edenhofer, O. Climate Change 2014: Mitigation of Climate Change; Working Group III Contribution to the Fifth Assessment Report of the Intergovernmental Panel on Climate Change; Intergovernmental Panel on Climate Change: Geneva, Switzerland, 2010; pp. 159–254. [Google Scholar]
  3. Tolwinski, B.; Martin, W.E. International negotiations on carbon dioxide reductions: A dynamic game model. Group Decis. Negot. 1995, 4, 9–26. [Google Scholar] [CrossRef]
  4. Peters, G.P. From production-based to consumption-based national emission inventories. Ecol. Econ. 2008, 65, 13–23. [Google Scholar] [CrossRef]
  5. Dong, D.; An, H.; Huang, S. The transfer of embodied carbon in copper international trade: An industry chain perspective. Resour. Policy 2017, 52, 173–180. [Google Scholar] [CrossRef]
  6. Istanbul, T.; Wiedmann, T.; Barrett, J. Policy-relevant applications of environmentally extended MRIO databases—Experiences from the UK. Econ. Syst. Res. 2013, 25, 143–156. [Google Scholar]
  7. Davis, S.J.; Caldeira, K. Consumption-based accounting of CO2 emissions. Proc. Natl. Acad. Sci. USA 2010, 107, 5687–5692. [Google Scholar] [CrossRef] [PubMed]
  8. Barrett, J.; Peters, G.; Wiedmann, T.; Scott, K.; Lenzen, M.; Roelich, K.; Le Quéré, C. Consumption-based GHG emission accounting: A UK case study. Clim. Policy 2013, 13, 451–470. [Google Scholar] [CrossRef]
  9. Lenzen, M. Primary energy and greenhouse gases embodied in Australian final consumption: An input-output analysis. Energy Policy 1998, 26, 495–506. [Google Scholar] [CrossRef]
  10. Sánchez-Chóliz, J.; Duarte, R. CO2 emissions embodied in international trade: Evidence for Spain. Energy Policy 2004, 32, 1999–2005. [Google Scholar] [CrossRef]
  11. Pan, J.; Phillips, J.; Chen, Y. China’s balance of emissions embodied in trade: Approaches to measurement and allocating international responsibility. Oxf. Rev. Econ. Policy 2008, 24, 354–376. [Google Scholar] [CrossRef]
  12. Lin, B.Q.; Sun, C.W. Evaluating carbon dioxide emissions in international trade of China. Energy Policy 2010, 38, 613–621. [Google Scholar] [CrossRef]
  13. Li, Y.; Hewitt, C.N. The effect of trade between China and the UK on national and global carbon dioxide emissions. Energy Policy 2008, 36, 1907–1914. [Google Scholar] [CrossRef]
  14. Yu, H.C.; Wang, L.M. Carbon emission transfer by international trade: Taking the case of Sino-U.S. merchandise trade as an example. J. Resour. Ecol. 2010, 1, 155–163. [Google Scholar]
  15. Xu, M.; Allenby, B.; Chen, W.Q. Energy and air emissions embodied in China–U.S. Trade: Eastbound assessment using adjusted bilateral trade data. Environ. Sci. Technol. 2009, 43, 3378–3384. [Google Scholar] [CrossRef] [PubMed]
  16. Dong, Y.; Ishikawa, M.; Liu, X.; Wang, C. An analysis of the driving forces of CO2 emissions embodied in Japan–China trade. Energy Policy 2010, 38, 6784–6792. [Google Scholar] [CrossRef]
  17. Du, H.; Guo, J.; Mao, G.; Smith, A.M.; Wang, X.; Wang, Y. CO2 emissions embodied in China–US trade: Input–output analysis based on the energy/dollar ratio. Energy Policy 2011, 39, 5980–5987. [Google Scholar] [CrossRef]
  18. Machado, G.; Schaeffer, R.; Worrell, E. Energy and carbon embodied in the international trade of Brazil: An input–output approach. Ecol. Econ. 2001, 39, 409–424. [Google Scholar] [CrossRef]
  19. Mäenpää, I.; Siikavirta, H. Greenhouse gases embodied in the international trade and final consumption of Finland: An input–output analysis. Energy Policy 2007, 35, 128–143. [Google Scholar] [CrossRef]
  20. McGregor, P.G.; Swales, J.K.; Turner, K. The CO2 “trade balance” between Scotland and the rest of the UK: Performing a multi-region environmental input–output analysis with limited data. Ecol. Econ. 2008, 66, 662–673. [Google Scholar] [CrossRef]
  21. Rhee, H.C.; Chung, H.S. Change in CO2 emission and its transmissions between Korea and Japan using international input–output analysis. Ecol. Econ. 2006, 58, 788–800. [Google Scholar] [CrossRef]
  22. Peters, G.P.; Minx, J.C.; Weber, C.L.; Edenhofer, O. Growth in emission transfers via international trade from 1990 to 2008. Proc. Natl. Acad. Sci. USA 2011, 108, 8903–8908. [Google Scholar] [CrossRef] [PubMed]
  23. Ahmad, N.; Wyckoff, A. Carbon Dioxide Emissions Embodied in International Trade of Goods; OECD Science, Technology and Industry Working Papers; OECD Publishing: Paris, France, 2003; p. 15. [Google Scholar]
  24. Lenzen, M.; Pade, L.-L.; Munksgaard, J. CO2 multipliers in multi-region input–output models. Econ. Syst. Res. 2004, 16, 391–412. [Google Scholar] [CrossRef]
  25. Munksgaard, J.; Pade, L.L.; Minx, J.; Lenzen, M. Influence of trade on national CO2 emissions. Int. J. Glob. Energy Issues 2005, 23, 324–336. [Google Scholar] [CrossRef]
  26. Chen, Z.M.; Chen, G.Q. An overview of energy consumption of the globalized world economy. Energy Policy 2011, 39, 5920–5928. [Google Scholar] [CrossRef]
  27. Davis, S.J.; Peters, G.P.; Caldeira, K. The supply chain of CO2 emissions. Proc. Natl. Acad. Sci. USA 2011, 108, 18554–18559. [Google Scholar] [CrossRef] [PubMed]
  28. Feng, K.; Davis, S.J.; Sun, L.; Li, X.; Guan, Z.; Liu, W.; Liu, Z.; Hubacek, K. Outsourcing CO2 within China. Proc. Natl. Acad. Sci. USA 2013, 110, 11654–11659. [Google Scholar] [CrossRef] [PubMed] [Green Version]
  29. Chang, N. Sharing responsibility for carbon dioxide emissions: A perspective on border tax adjustments. Energy Policy 2013, 59, 850–856. [Google Scholar] [CrossRef]
  30. Deng, G.; Xu, Y. Accounting and structure decomposition analysis of embodied carbon trade: A global perspective. Energy 2017, 137, 140–151. [Google Scholar] [CrossRef]
  31. Peters, G.P.; Weber, C.L.; Guan, D.; Hubacek, K. China’s growing CO2 emissions—A race between increasing consumption and efficiency gains. Environ. Sci. Technol. 2007, 41, 5939–5944. [Google Scholar] [CrossRef] [PubMed]
  32. Guan, D.; Peters, G.P.; Weber, C.L.; Hubacek, K. Journey to world top emitter: An analysis of the driving forces of China’s recent CO2 emissions surge. Geophys. Res. Lett. 2009, 36, 1–5. [Google Scholar] [CrossRef]
  33. Chen, G.Q.; Zhang, B. Greenhouse gas emissions in China 2007: Inventory and input–output analysis. Energy Policy 2010, 38, 6180–6193. [Google Scholar] [CrossRef]
  34. Mi, Z.; Meng, J.; Guan, D.; Shan, Y.; Liu, Z.; Wang, Y.; Feng, K.; Wei, Y.-M. Pattern changes in determinants of Chinese emissions. Environ. Res. Lett. 2017, 12, 074003. [Google Scholar] [CrossRef]
  35. Mi, Z.; Zhang, Y.; Guan, D.; Shan, Y.; Liu, Z.; Cong, R.; Yuan, X.-C.; Wei, Y.-M. Consumption-based emission accounting for Chinese cities. Appl. Energy 2016, 184, 1073–1081. [Google Scholar] [CrossRef]
  36. Guo, J.; Zhang, Z.; Meng, L. China’s provincial CO2 emissions embodied in international and interprovincial trade. Energy Policy 2012, 42, 486–497. [Google Scholar] [CrossRef]
  37. Berzosa, Á.; Barandica, J.M.; Fernández-Sánchez, G. A New Proposal for Greenhouse Gas Emissions Responsibility Allocation: Best Available Technologies Approach. Integr. Environ. Assess. Manag. 2013, 10, 95–101. [Google Scholar] [CrossRef] [PubMed]
  38. Bastianoni, S.; Pulselli, F.M.; Tiezzi, E. The problem of assigning responsibility for greenhouse gas emissions. Ecol. Econ. 2004, 49, 253–257. [Google Scholar] [CrossRef]
  39. Gallego, B.; Lenzen, M. A consistent input-output formulation of shared producer and consumer responsibility. Econ. Syst. Res. 2005, 17, 365–391. [Google Scholar] [CrossRef]
  40. Lenzen, M.; Murray, J.; Sack, F.; Wiedmann, T. Shared producer and consumer responsibility d theory and practice. Ecol. Econ. 2007, 61, 27–42. [Google Scholar] [CrossRef]
  41. Coe, N.; Dicken, P.; Hess, M. Global production networks: Realizing the potential. J. Econ. Geogr. 2008, 8, 271–295. [Google Scholar] [CrossRef]
  42. Johnson, R.C.; Noguera, G. Accounting for intermediates: Production sharing and trade in value added. J. Int. Econ. 2012, 86, 224–236. [Google Scholar] [CrossRef]
  43. Stehrer, R. Accounting Relations in Bilateral Value Added Trade; No 101, wiiw Working Paper; wiiw—The Vienna Institute for International Economic Studies—Wiener Institut für Internationale Wirtschaftsvergleiche: Vienna, Austria, 2013. [Google Scholar]
  44. Stehrer, R. Trade in Value Added and the Value Added in Trade; No 81, wiiw Working Paper; wiiw—The Vienna Institute for International Economic Studies—Wiener Institut für Internationale Wirtschaftsvergleiche: Vienna, Austria, 2012. [Google Scholar]
  45. Grimes, S.; Sun, Y. China’s evolving role in Apple’s global value chain. Area Dev. Policy 2016, 1, 94–112. [Google Scholar] [CrossRef]
  46. World Trade Organisation. Trade Patterns and Global Value Chains in East Asia: From Trade in Goods to Trade in Tasks. 2013. Available online: https://www.wto.org/english/res_e/bookspe/stat_tradepat_globvalchains_e.pdf (accessed on 20 September 2017).
  47. Liu, H.; Liu, W.; Fan, X.; Liu, Z. Carbon emissions embodied in value added chains in China. J. Clean. Prod. 2015, 103, 362–370. [Google Scholar] [CrossRef]
  48. Meng, B.; Peters, G.P.; Wang, Z. Tracing Greenhouse Gas Emissions in Global Value Chains; Working Paper 525; Stanford University: Stanford, CA, USA, 2015. [Google Scholar]
  49. Zhang, Y. Provincial responsibility for carbon emissions in China under different principles. Energy Policy 2015, 86, 142–153. [Google Scholar] [CrossRef]
  50. Wiedmann, T. A review of recent multi-region input–output models used for consumption-based emission and resource accounting. Ecol. Econ. 2009, 69, 211–222. [Google Scholar] [CrossRef]
  51. OECD. Input-Output Tables (IOTs). 2013. Available online: http://stats.oecd.org/Index.aspx?DataSetCode=IOTS (accessed on 20 September 2017).
  52. OECD. Structural Analysis (STAN) Databases. 2013. Available online: http://stats.oecd.org (accessed on 20 September 2017).
  53. Lenzen, M.; Kanemoto, K.; Moran, D.; Geschke, A. Mapping the Structure of the World Economy. Environ. Sci. Technol. 2012, 46, 8374–8381. [Google Scholar] [CrossRef] [PubMed]
  54. Lenzen, M.; Moran, D.; Kanemoto, K.; Geschke, A. Building Eora: A Global Multi-regional Input-Output Database at High Country and Sector Resolution. Econ. Syst. Res. 2013, 25, 20–49. [Google Scholar] [CrossRef]
  55. The World Bank. World Development Indicators. 2013. Available online: https://data.worldbank.org.cn (accessed on 20 September 2017).
  56. Stone, R. Input-Output and National Accounts; The Organization for European Economic Development: Paris, France, 1961. [Google Scholar]
  57. Liu, W.; Li, X.; Liu, H.; Tang, Z.; Guan, D. Estimating Inter-Regional Trade Flows in China—A sector-specific spatial statistic model. J. Geogr. Sci. 2015, 25, 1247–1263. [Google Scholar] [CrossRef]
  58. Proops, J.L.R.; Faber, M.; Wagenhals, G. Reducing CO2 Emissions: A Comparative Input-Output Study for Germany and the UK; Springer: New York, NY, USA, 1993. [Google Scholar]
  59. Kondo, Y.; Moriguchi, Y.; Shimizu, H. CO2 emissions in Japan: Influences of imports and exports. Appl. Energy 1998, 59, 163–174. [Google Scholar] [CrossRef]
  60. Yan, Y.; Yang, L. China’s foreign trade and climate change: A case study of CO2 emissions. Energy Policy 2010, 38, 350–356. [Google Scholar]
  61. Ferng, J.J. Allocating the responsibility of CO2 over-emissions from the perspectives of benefit principle and ecological deficit. Ecol. Econ. 2003, 46, 121–141. [Google Scholar] [CrossRef]
  62. Su, B.; Huang, H.C.; Ang, B.W.; Zhou, P. Input–output analysis of CO2 emissions embodied in trade: The effects of sector aggregation. Energy Econ. 2010, 32, 166–175. [Google Scholar] [CrossRef]
  63. Su, B.; Ang, B.W. Input–output analysis of CO2 emissions embodied in trade: Competitive versus non-competitive imports. Energy Policy 2013, 56, 83–87. [Google Scholar] [CrossRef]
Figure 1. Top and Bottom 10 countries by VBE presented as gross scale (left) and per unit GDP (right) in 2010, with the increase rates in 2000–2010. Note: DCI is an abbreviation for the direct CO2 emissions intensity. FCI is abbreviation for the full CO2 emissions intensity. These two abbreviations will be discussed later. GDPs (PPP) at current $ price were used when emissions per unit GDP in 2010 were calculated and GDPs (PPP) at constant $ price (2005) were used when increase rates were reckoned. The abnormal FCI of North Korea (7.10 tons CO2/thousand $) was removed. Abbreviations: TKM, Turkmenistan; BIH, Bosnia and Herzegovina; TTO, Trinidad and Tobago; VBE, value-added-based accounting of CO2 emissions; PPP, Purchasing Power Parity.
Sustainability 09 02220 g001
Figure 2. Scatter plot between VBE increase and GDP increase in 2000–2010 by income group.
Sustainability 09 02220 g002
Figure 3. FCI and DCI at the country level in 2000 and 2010. Note: GDPs at constant $ price (2005) PPP were used.
Sustainability 09 02220 g003
Figure 4. Scatter plot between FCI and GDP per capita (current $ PPP) in 2010.
Sustainability 09 02220 g004
Figure 5. Top 10 countries by net exports and net imports of CO2 emissions. Both are presented as gross value (up) and per unit GDP (down) in 2000, 2010.
Sustainability 09 02220 g005
Figure 6. Differences divided by GDP between VBEs and PBEs by country and the main international carbon transfer fluxes >10 Mt CO2 in 2000 and 2010.
Sustainability 09 02220 g006
Table 1. Global multi-regional input–output model (MRIO) table with n countries.
Intermediate UseFinal UseTotal Output
Country 1 … Country nCountry 1 … Country n
Intermediate inputcountry 1 … country ntrsfrstr
Value-addedvs
Total inputts
t r s stands for output in country r to satisfy the need in region s; f r s is the requirement for final use of country s for country rs products; t r refers to the total output in country r; v s is the gross value-added in country s; and t s is the total input in country s.
Table 2. Average FCI and DCI for different income levels.
RegionPer CapitaFCIDCI
GDP/ths Current $Ton CO2/ths $ PPPTon CO2/ths $ PPP
High income38,7760.3530.321
Middle income99210.6710.722
Low income33710.4170.445

