Abstract
Functional structure is an important part of a port system, and can reflect the resource endowments and economic development needs of the hinterland. In this study, we investigated the transportation function of coastal ports in China from the perspective of cargo structure using a similarity coefficient. Our research considered both adjacent ports and hub ports. We found that the transportation function of some adjacent ports was very similar in terms of outbound structure (e.g., Qinhuangdao and Huanghua) and inbound structure (e.g., Huanghua and Tangshan). Ports around Bohai Bay and the port group in the Yangtze River Delta were the most competitive areas in terms of outbound and inbound structure, respectively. The major contributors to port similarity in different regions varied geographically due to the different market demands and cargo supplies. For adjacent ports, the functional convergence of inbound structure was more serious than the outbound. The convergence between hub ports was more serious than between adjacent ports in terms of both outbound and inbound structure. The average similarity coefficients displayed an increasing trend over time. This study further develops the theory of transport geography, improves our understanding of China’s port transportation system, and can provide reference for policy-makers in their port development decisions.
1. Introduction
As an important part of a comprehensive transportation system, ports are considered an open window and bridge for countries and regions. They also enable participation in international cooperation and competition. Port functional structure corresponds to the cargo structure of ports involving the proportion of various kinds of goods, which can reflect the resource endowments and economic development needs of the hinterland. Therefore, it has become a research focus of port geography. Due to economies of scale, national port activities tend to be concentrated in one or two ports with a good location and favorable natural conditions. Many studies have been conducted worldwide on the agglomeration and dispersion of port systems. Rimmer [1] reported a tendency for decentralization in a study of Australian Seaports. Notteboom [2] studied the port system in Europe in 1980–1994, and came to the conclusion that containerization did not necessarily result in centralization or decentralization. In later research, Notteboom [3] found that the European port system had experienced a dispersal process and the degree of concentration of containers had become greater than that of other cargoes. The Pearl River Delta port system in China has evolved from a one-gateway hub to two-gateway port, and then to a three-port, which were related to the container traffic dispersion with increasing operation costs in the original hub port [4]. For ports in the Yangtze River Delta, the degree of concentration of all cargoes has followed a declining tendency. The degree of centralization of cargoes, from high to low, was reported as: containers, oil, gas, and associated products, metallic ores, mining ores, and coal [5].
The main methods used to calculate the degree of agglomeration of ports are the Gini coefficient, Lorenz Curve, and Herfindahl–Hirschman Index [6,7]. Many investigators have conducted studies of port competitiveness. This has involved the selection of indicators and establishment of evaluation models. The main indicators that have been used are port throughput, gross domestic product (GDP) of the port city, and the number of berths [8]. Widely used evaluation methods include factor analysis, principal component analysis, data envelopment analysis, and the analytic hierarchy process [9]. Some models were established to examine ports’ relative competitiveness [10]. The participation of the private sector and port community systems can enhance port competitiveness and adaptability to the demands of customers, which are also important factors [11,12]. The port decentralization regulation mode benefit the whole society, since it lowers the tariff and raises the port efficiency, demand, and social welfare [13]. Many studies have focused on the competition and cooperation among ports in a port group. Tovar studied the competitiveness and connectivity of container ports in Canary Islands by the means of graph theory [14]. Óscar examined the economic incentives and welfare implications of port integration with inland transport services under inter-port competition [15].
Some such studies also have been conducted in China. Ports around Bohai Bay have a similar hinterland and the competition between them is very large [16,17]. For the ports in the Yangtze River Delta, container transportation has become highly concentrated, and the ports of Shanghai and Ningbo-Zhoushan have fiercely competitive relations [18]. There is more competition than cooperation at the Fujian ports and the functional structure of the port system is homogenous [19]. The functional division of ports in the Pearl River Delta is relatively clear and there is more cooperation among ports than competition [20]. There is functional differentiation between adjacent container ports, i.e., large ports focus on foreign trade, while other small ports focus on domestic trade [21]. Smaller ports close to regional hub centers are required to seek collaborations with neighboring ports rather than compete against each other [22]. Effective cooperation can benefit each port. European ports acquired a dominant position by establishing strategic alliances [23]. The function of ports in Guangxi Beibu Gulf was adjusted by the local government to integrate the power of three ports and increase the competitiveness of the whole region [24]. The competition and cooperation of ports has also been studied from the perspective of game theory [25,26]. There are also many studies exploring the influence of government in port competition. Notteboom studied port governance in China since 2004 and found the decentralization of ports caused an increased focus on seaport integration and co-operation [27]. Port efficiency level, port service demand and social welfare are higher under the decentralization mode [13]. Most of these studies focused on port throughput, the distribution of sea routes, and foreign trade. There was no detailed analysis of competition between ports from the perspective of cargo structure. Hinterland is the source location of port cargoes, and also the destination of cargoes and passengers that are received by ports. Thus, the existence and development of ports is dependent on these regions [28]. The competition between ports is actually a fight over the hinterland. A port whose hinterland has richer resources and larger markets will have more potential for development. The similarity coefficient is an effective parameter to indicate the degree of similarity of two structures. Its widest application has been in the assessment of industrial structures. The industrial structure of the interior provinces of China deviates from the national structure, while the coastal provinces host similar industries [29]. The phenomenon of industrial isomorphism has been reported in Fujian and Taiwan [30]. The similarity coefficient has also been widely used in other areas. For example, it was used to measure the degree of homogenization of airports in the Yangtze River Delta Region [31].
In recent years, coastal ports in China have accelerated the construction of various specialized terminals. This has led to similarity in port transportation functions and will result in overbuilding and a waste of resources. The highly similar transportation functions may damage the long-term development of ports [32]. Few studies have focused on the similarity of port transportation functions from the perspective of cargo structure. Therefore, we studied the port transportation functions of China’s coastal ports based on their cargo structure, and explored the characteristics of their geographical distribution.
2. Data and Methods
2.1. Data and Samples
The main data used in this study were the cargo throughput figures of coastal ports in 2014, which were obtained from the “Yearbook of China Transportation and Communications”. Data for 2000, 2005, and 2010 were used for a time series analysis. Therefore, data of 2000, 2005, 2010, and 2014 were used in this paper. The yearbook considers 17 categories of cargo: coal, oil, metal ore, iron and steel, mineral building materials, cement, wood, non-metallic ore, chemical fertilizers and pesticides, salt, grain, machinery and equipment, chemical raw materials, nonferrous metals, light industry and medicine, animal husbandry and fishery, and other goods. Containers and the categories of goods in this paper belong to different classification systems. Container transport is a modern method of transportation, rather than an actual type of cargo. According to the “Port Statistical Report System”, when the cargo in a container cannot be classified, it is recorded as other goods. Therefore, cargo in containers has already been classified into coal, metal ore, and so on in the yearbook, and the other goods category contains some actual cargo that cannot be further categorized. In this study, we used the other goods category and did not involve the study of containers. The analysis of industrial structure was based on the output value of each industry in the coastal provinces, with data obtained from “China Industry Statistical Yearbook”.
As the focus of the study, we selected coastal ports in China, of which there are 49 according to the “National Plan for Coastal Ports Layout” (Figure 1). In the Yangtze River Delta, we followed the traditional definition, in which ports below Nanjing are considered to be ocean ports. It should be noted that some independent ports have become amalgamated into port areas around certain ports, due to integration and reorganization. Port statistics can therefore be confusing and in this study we followed the latest affiliation of port areas as the statistical standard. Suzhou port has three port areas, Zhangjiagang, Changshu, and Taicang; Tangshan port has two port areas, Jingtang and Caofeidian; and Dongguan port has three port areas, Taiping, Machong, and Shatian. The port areas of Longkou and Lanshan belong to the ports of Yantai and Rizhao, respectively. Although Ningbo and Zhoushan ports have been merged, they still belong to different administrative districts and are relatively independent. Therefore, we considered them to be separate ports.
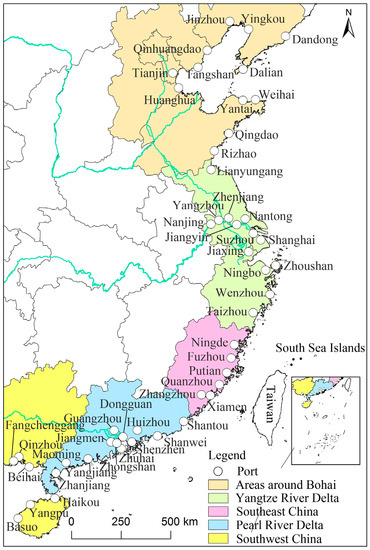
Figure 1.
A map of the coastal ports in China.
2.2. Definition and Evaluation Model
In this paper, the function of ports is defined from the perspective of cargo structure. If a port loads a certain kind of cargo, it is considered having the transportation function of this cargo. For example, if the throughput of a port contains coal and oil, it is considered having coal transportation function and oil transportation function. Functional convergence means that these two ports have similar cargo structure, including the type and proportion of goods. While functional division means they have quite different cargo structure.
The industrial similarity coefficient was proposed by the International Industrial Research Center of the United Nations Industrial Development Organization (UNIDO) [33]. It has been effectively applied for similarity analysis in various disciplines. We used it here in the analysis of the degree of convergence of port transportation functions. The formula used in the calculation is as follows:
where Sij is the similarity coefficient of port transportation functions and Xik and Xjk are the proportion of cargo k in ports i and j, respectively. The range of Sij is (0, 1). The larger the value, the higher the degree of similarity of the transportation structure of the two ports being investigated. If the value is one, then it indicates that the functional structure of the two ports is exactly the same. A value of zero indicates that their functional structure is completely complementary.
3. Similarity of Adjacent Ports in a Port Group
A similarity analysis of port transportation function was conducted at two levels: adjacent ports and hub ports. Adjacent ports usually serve the same economic hinterland. Therefore, studying the similarity between adjacent ports can determine whether there is redundant construction at each port. Hub ports tend to compete and have a deep hinterland; thus, we investigated their similarity of construction by calculating the similarity coefficient of hub ports. Based on experience, we chose 0.2 and 0.8 as cut-off values. If the similarity coefficient was greater than 0.8, the two ports had a similar functional structure. If it was less than 0.2, they were complementary ports.
3.1. Similarities in the Outbound Structure of Adjacent Ports
The outbound structure of a port is a reflection of the resources in its hinterland. The hinterlands of adjacent ports often overlap with each other. Studying the similarity in the outbound structure of adjacent ports can reveal whether there is a clear division of labor associated with the cargo output between them. Based on the principles described above, we calculated the outbound similarity coefficient of all adjacent ports in 2014 and produced Figure 2 (for the detailed results see Table A1 in the Appendix A). In this figure, a red line represents similar ports and a green line represents complementary ports. The thicker the line is, the greater the degree of similarity or complementarity there is.
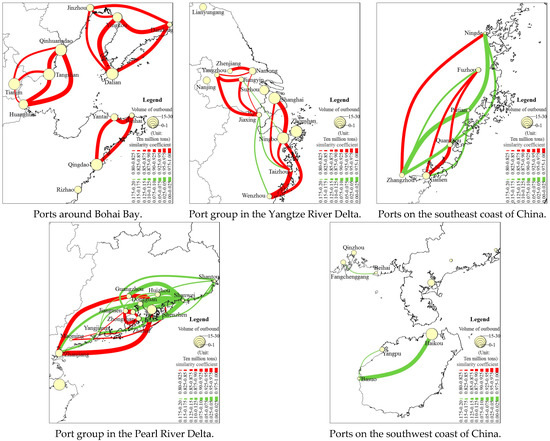
Figure 2.
Similarity of the outbound structure in all port groups in 2014.
According to Figure 2, there were 40 pairs of ports that had a similar outbound structure. Among them, the similarity coefficients of 23 pairs were greater than 0.9. Qinhuangdao and Huanghua had the highest coefficient of 0.999. The similarity coefficients of Taizhou and Wenzhou, Shenzhen and Zhanjiang, Zhongshan and Jiangmen, and Dalian and Yingkou were also greater than 0.98. These pairs had a high degree of transportation structure convergence. After analyzing the cargo structure of these ports, we found that each pair of similar ports handled the same main cargoes and there was no significant difference in the outbound proportions handled. There were three main kinds of cargo: coal, mineral building materials and other goods. Among the 40 pairs of similar ports, the main cargo for 20 pairs was other goods, for 12 pairs it was coal, and for six pairs it was mineral building materials. For example, the outbound structures of Qinhuangdao and Huanghua were both dominated by coal, which accounted for 91.6% and 98.3% of their outbound volume, respectively. The proportions were so close that their transportation function structures were almost the same, and they competed fiercely with each other to supply coal to the hinterland. The proportions of coal among the outbound materials handled at Qinhuangdao and Tangshan, Huanghua and Tangshan, and Zhenjiang and Nantong were also very similar. Another main cargo was mineral building material. The proportion of mineral building materials among the outbound materials handled at Zhongshan and Jiangmen was 62.9% and 68.9%, respectively. There were several similar pairs of ports, such as Ningde and Xiamen, and Zhuhai and Jiangmen. The other outbound goods handled could not be further subdivided; thus, we regarded them as a whole. They accounted for 64.8% and 66.9% in Taizhou and Wenzhou, respectively, and 88.2% and 80.8% in Shenzhen and Zhanjiang, respectively. From the spatial distribution, ports with a similar outbound structure were mainly concentrated in three areas: the areas around Bohai Bay, the Yangtze River Delta, and the southeast coast of China. Bohai Bay and the Yangtze River Delta contained pairs of ports that competed to supply coal, while ports in the southeast coast of China competed to supply mineral building materials. The reasons for this phenomenon in the three areas were not the same. Ports around Bohai Bay transported coal from Shanxi, Shaanxi, and Inner Mongolia. Ports in the north of the Yangtze River Delta transported coal from the north of China to areas along the middle and upper reaches of the Yangtze River. The south of China, and especially Fujian Province, is rich in mineral resources; thus, most ports in this area output mineral building materials and compete fiercely. The number of pairs of ports competing to supply other goods was large and there were no obvious characteristics of spatial agglomeration.
The term complementary ports refers to pairs of ports that have different cargo structures and where there are no competition concerns. As is shown in Figure 2, with regard to the outbound structure, there were 36 pairs of complementary ports in China’s coastal area. Among them, the similarity coefficients of 11 pairs of ports were less than 0.1. The lowest coefficient was 0.008 in Putian and Zhangzhou, which was so small that the two ports can be considered completely complementary. There were seven pairs of ports for which the similarity coefficient was lower than 0.05: Shanwei and Huizhou, Shanwei and Zhuhai, Ningde and Putian, Shanwei and Zhongshan, Haikou and Basuo, Shanwei and Shenzhen, and Shanwei and Guangzhou. These complementary ports were usually prominent in two different transportation functions. For example, non-metallic ore and oil were the principal commodities for Shanwei and Huizhou, respectively, accounting for respective proportions of 78.2% and 60.0% of all outbound goods handled. The main outbound cargo in Ningde was mineral building material. Putian mainly transported coal. Therefore, each port had its own unique cargo and there was a clear functional division of the ports. From Figure 2, it can be seen that the complementary ports were mainly distributed in the south of the Yangtze River, and were especially concentrated in the region of the Pearl River Delta. There were no pairs of complementary ports in the north of the Yangtze River. From this analysis, we concluded that for the outbound structure of China’s coastal ports, functional convergence was mainly distributed in the northern ports, especially those around Bohai Bay, while complementary ports were mainly located in the south of China, especially the Pearl River Delta.
3.2. Similarities in the Inbound Structure of Adjacent Ports
The inbound structure of ports is decided by the economic demand of their hinterlands. The similarity coefficient in the inbound structure of adjacent ports can reflect the degree of competition in the consumer market. The calculated results in 2014 are shown in Figure 3 (for the detailed results see Table A2 in the Appendix A).
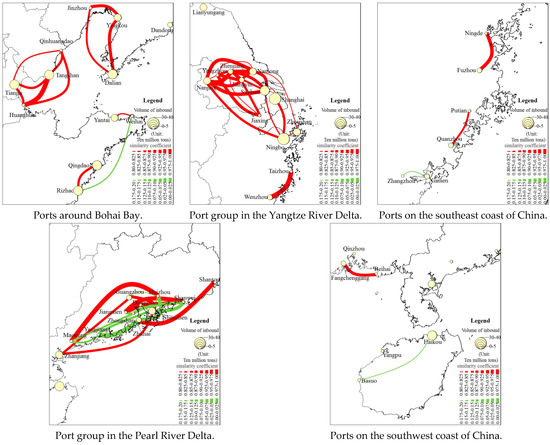
Figure 3.
Similarity of the inbound structure in all port groups in 2014.
There were 46 pairs of ports in China’s coastal area that were found to have a similar inbound structure. The similarity coefficients of half of them were larger than 0.9, and three of them (Huanghua and Tangshan, Taizhou and Wenzhou, and Huizhou and Maoming) were greater than 0.98. The competition in the consumer market was extremely intense among these ports. The factors affecting the level of similarity varied geographically. The handling of inbound metal ore was the main cause of similarity at ports around Bohai Bay. There were eight pairs of ports with a similarity coefficient larger than 0.85, and the principal cargo of six of them was metal ore. These ports were Huanghua and Tangshan, Huanghua and Tianjin, Qinhuangdao and Tangshan, Qingdao and Rizhao, Qinhuangdao and Huanghua, and Tangshan and Tianjin. Metal ore accounted for 77.8%, 75.8%, and 56.1% of all inbound goods handled in Tangshan, Huanghua, and Rizhao, respectively. Coal and other goods were the major contributors to the similarities between ports in the Pearl River Delta. For Shanwei, Dongguan, and Jiangmen, there were three pairwise combinations. All three pairs had a similarity coefficient larger than 0.95. The reason for this was that inputting coal was the main transportation function of these ports, and it accounted for 90.0%, 53.7%, and 57.5% of all inbound goods handled, respectively. At Shenzhen, Guangzhou, and Zhanjiang, the main cargo was other goods, which accounted for 66.2%, 46.6%, and 39.1% of all inbound goods handled, respectively. Therefore, the three pairwise combinations for these three ports showed a strong similarity, with similarity coefficients larger than 0.85. The handling of coal and metal ore were the factors leading to the similarities of ports in the Yangtze River Delta. Most of the ports in this region mainly input these two kinds of goods. At Zhenjiang and Nantong, the amount of coal handled as a proportion of all inbound goods was 40.1% and 27.9%, respectively, while the corresponding figures for metal ore were 26.3% and 24.3%, respectively. The competition was fierce in both consumer markets. The reason that the influencing factors were different in different regions was due to the different geographic market demands. Spatially, ports with a similar inbound structure were mainly concentrated in the Yangtze River Delta. There were few ports with such similarities in the south of China, especially in the Pearl River Delta.
As shown in Figure 3, there were only 15 pairs of ports in China’s coastal area that were complementary with respect to inbound structure. Among them, the similarity coefficients of four pairs of ports (Yangjiang and Zhongshan, Zhongshan and Huizhou, Shenzhen and Shanwei, and Zhongshan and Shanwei) were less than 0.1. The smallest coefficient was 0.02, for Yangjiang and Zhongshan. These two ports specialized in the transportation of different cargoes. Yangjiang mainly input coal and metal ores, which together accounted for 90.4% of its total inbound volume, while mineral building materials was the principal commodity at Zhongshan, accounting for 56.3% of its inbound volume. The similarity coefficients of Shanwei and Zhongshan, and Shanwei and Shenzhen were in the range of 0.07–0.09. At Shanwei, coal accounted for 89.0% of the total inbound volume. Zhongshan mainly input mineral building materials, while Shenzhen specialized in other goods. These ports complement each other in cargo transportation and have developed harmoniously. With regard to the inbound structure, complementary ports were concentrated in the Pearl River Delta. The area around Bohai Bay and the southwest coastal area only had one pair of complementary ports each. Overall, combined with the above analysis, we found that for the inbound structure of China’s coastal ports, the similarity level for northern ports was higher than for southern ports. Functional convergence was concentrated in the Yangtze River Delta, and complementary ports were mainly located in the Pearl River Delta.
3.3. Comparison of the Similarity of Inbound and Outbound Structures between Port Groups
Further investigation of the similarity level within a port group could reveal additional characteristics of the functional convergence of ports. We calculated the number of pairs of similar and complementary ports and the average similarity coefficient for the outbound and inbound structures in each port group. The results are shown in Table 1.

Table 1.
Comparison of port similarity and complementarity between port groups in 2014.
From this table, a number of characteristics were apparent. First, in terms of outbound cargo, the most intense competition occurred between ports around Bohai Bay. This port group had the largest number of pairs of similar ports (15), no pairs of complementary ports, and the highest similarity coefficient (0.90), which reflected coal transportation from the three western districts of the Three Provinces Region (Shanxi, Shaanxi, and Inner Mongolia Autonomous Region). Coal transportation is the main transportation function of these ports. Second, the area with the most intense competition in terms of cargo inbound was the port group in the Yangtze River Delta. There were 24 pairs of similar ports in this area, accounting for more than half of the total number, and there were no pairs of complementary ports. Its similarity coefficient was up to 0.76, which was 0.17 higher than the average. Coal and metal ore were the goods leading to the similarity in this area. Most of the ports in this region input coal and metal ore as their main transportation function. Third, the similarity in south China was generally lower than in the north. In other words, the development of the southern ports was more harmonious. The port group in the Pearl River Delta was the area with the least overall similarity. It had the second-smallest similarity coefficient for outbound structure and the smallest similarity coefficient for inbound structure. In addition, it had the maximum number of pairs of complementary ports for both outbound and inbound structure, accounting for 63.9% and 80.0% of the total number respectively. This was consistent with Zhang [20], who reported a clear functional division of the ports in the Pearl River Delta, with more cooperation among ports than competition. Finally, the inbound similarity coefficient was larger than the outbound coefficient for each port group, except for the ports around Bohai Bay. The inbound similarity coefficient for all coastal ports was 0.59, 0.08 more than that of the outbound structure. This means the inbound competition was fiercer than the outbound competition for all of the coastal ports and each port group. This is because the resource endowments of the port hinterlands varied widely, but Chinese provinces were quite similar in their industrial structures [33]. As a result, each hinterland had a range of supply requirements, but similar demands for goods.
4. Similarity of Hub Ports in China
Hub ports are the core nodes of the port system. With a vast hinterland, they have large throughput, and occupy a high proportion in the global or regional system. In this way, they can affect the operation of the shipping market and dominate the spatial relations of port system. Hub ports often compete and have deep hinterlands. Studying the similarity level of hub ports is a meaningful exercise. It is necessary to clarify the exact definition of “hub port”. For the purposes of this study, a hub port had to satisfy three requirements: first, it must have large throughput, i.e., a high ranking among all coastal ports; second, it should be a regional transportation hub; and third, each hub port should be located far from other hub ports, to ensure that they have different locational characteristics and serve different direct economic hinterlands. Based on these criteria, there were nine hub ports: Dalian, Tianjin, Qingdao, Ningbo, Shanghai, Xiamen, Guangzhou, Fuzhou, and Shenzhen. They all have the highest throughput and play an important role in the regional port group.
The similarity coefficients of hub ports in terms of their outbound structure are shown in Figure 4 (for the detailed results see Table A3 in the Appendix A). The average similarity coefficient of the outbound structure was 0.78, 0.27 higher than that of the adjacent ports. Therefore, the competition between hub ports in the deep hinterlands was more intense than between adjacent ports. There were 28 pairs of similar ports and only two pairs of complementary ports. In addition to Tianjin, the other eight ports were combined pairwise, giving a total of 28 pairs of ports. All 28 pairs of ports showed strong similarities. Among them, Qingdao and Ningbo had the highest similarity coefficient of 0.995. Both ports mainly output other goods, which accounted for 62.4% and 59.6%, of all outbound goods handled, respectively. The second largest cargo for the two ports was metal ore. The similarity coefficient of Dalian and Qingdao was 0.982, ranking it in second place. There were another ten pairs of ports that had a similarity coefficient larger than 0.95. All the hub ports, except for Tianjin, had the common feature of their main outbound cargo being other goods. Other goods, as a proportion of all outbound goods handled, was highest in Shenzhen, at 88.2%. This figure was smallest for Shanghai, although the actual value was still 53.3%. The second largest cargo at Qingdao, Shanghai, Ningbo, and Fuzhou was metal ore, accounting for about 15% of their total inbound volume. Therefore, hub ports competed for the supply of other goods in the deep hinterlands, although Tianjin was an obvious exception. There was a significant difference between the outbound structure of Tianjin and other hub ports. The top three cargoes were coal, oil, and steel, which, together, accounted for 62.9% of all outbound goods handled. Thus, there was no similarity between Tianjin and the other hub ports. The port activities of Tianjin were complementary to those of Shenzhen and Xiamen. The similarity coefficients were 0.12 and 0.14, respectively.
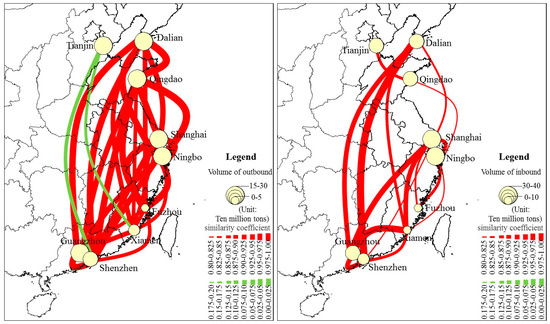
Figure 4.
Similarity of the outbound (left) and inbound (right) structure of hub ports in 2014.
The average similarity coefficient of the hub ports’ inbound structure was 0.71, 0.08 higher than that of the adjacent ports. According to the above analysis of outbound structure, the similarity between hub ports was higher and the competition was more intense than that of the adjacent ports, in both outbound and inbound structure. Unlike the adjacent ports, the outbound structure of hub ports was more similar than the inbound structure. There were 16 pairs of similar ports and no pairs of complementary ports. Dalian and Shenzhen had the largest similarity coefficient of 0.987. Other goods was the main cargo category for the two ports, accounting for 63.6% and 66.2% of the total inbound volume. Xiamen and Guangzhou, Shanghai and Guangzhou, Shenzhen and Guangzhou, Shanghai and Xiamen, and Dalian and Guangzhou also had similarity coefficients higher than 0.9. After calculating the number of similar ports for each port, we discovered that Shanghai was similar to six hub ports, thereby ranking it first, followed by Xiamen. Tianjin had the lowest number of similar hub ports, with Qingdao being the only similar port. The similarity coefficient was 0.861 and the main cargo was metal ore. Therefore, Tianjin had the least similarity to the other hub ports in both outbound and inbound structure.
5. Discussion
The reasons for the structural similarity were as follows. First, industrial structure convergence determines the similarity of market demand in a port’s hinterland, and this was the main reason for the high similarity of inbound cargo. As shown in Table 2, the average similarity coefficient of coastal provinces has been greater than 0.6 since 2000. After a slight decrease from 2003 to 2008, it grew again to reach 0.669 in 2014. Correspondingly, the inbound cargo similarity coefficient showed an increasing trend, from 0.516 in 2000 to 0.595 in 2014. Second, because China’s port management system is decentralized to a basic level, local government is an important factor in the competition between ports. All ports pursue either “large and all-inclusive” or “small and all-inclusive” cargo structures. Local governments have attempted to expand the scale of their ports and to develop comprehensive ports to promote market competitiveness and obtain market share. Therefore, the pursuit of local interests and the competition between ports has led to a similarity of cargo structure. There are many other factors related to port structure convergence, and how to identify them and accurately analyze their relationship are interesting topics for future study.
Table 2.
Average similarity coefficients of industrial structure and cargo structure of ports.
Investigating the time series data is helpful to understand the evolution of the Chinese port system. It can be seen from Table 2 that, over time, the average similarity coefficients of the inbound and outbound structure both displayed an increasing trend. It means that the functional convergence between ports has become more serious and the transportation function division of port system is becoming less clear. As mentioned above, this is closely related to the industrial structure and local government decisions. The functional structure of the Chinese port system needs to be further improved. Strengthening the cooperation between ports is an effective and inevitable option to alleviate the convergence of functional structure. For this reason, the following measures should be taken. First, we should optimize the coordination mechanisms between ports and establish negotiation mechanisms for the competition and cooperation within port groups. Second, the cooperation between ports should be based on rational divisions. Therefore, we need to subdivide the market hinterlands and the type of goods handled by each port, and clearly assign their status and functions. Each port should undertake different transportation functions according to its own characteristics and foundation. Third, the process of port informatization and networking should be accelerated. Through the above measures, coastal ports can achieve a win-win situation and the Chinese port system will achieve healthy development.
It has been noted that we cannot make a negative value judgment about functional structure convergence without further distinction [34]. Under certain circumstances, this is considered reasonable. To judge whether this is reasonable or not, we should consider the similarity of the hinterland’s industrial structure and the existing infrastructure of ports. If this adapts to the economic needs of the hinterland and the port throughput capacity, then a high level of similarity is acceptable. The specific criteria for this judgment are also an important issues for future studies. This paper examines the similarity of the cargo structure of coastal ports and provides perspective to understand the evolution of the Chinese port system.
6. Conclusions
The transportation function of ports is an important research focus of port geography. In this study, we investigated the similarity of adjacent ports and hub ports from the perspective of cargo structure. The main conclusions can be summarized as follows:
- (1)
- There were many adjacent ports that had a similar cargo structure and the phenomenon of functional convergence between these ports was serious. For the outbound structure, typical pairs of similar ports were Qinhuangdao and Huanghua, Taizhou and Wenzhou, Shenzhen and Zhanjiang, Zhongshan and Jiangmen, and Dalian and Yingkou. For the inbound structure, the most serious regions of functional convergence were Huanghua and Tangshan, Taizhou and Wenzhou, and Huizhou and Maoming. Each pair of similar ports handled the same main cargoes and there was no significant difference in the proportions handled.
- (2)
- From the spatial distribution, ports around Bohai Bay were the most serious region of functional convergence in terms of outbound cargo. This reflected coal transportation from the three western districts of the Three Provinces Region. In terms of the inbound structure, the functional convergence of the port group in the Yangtze River Delta was the most serious. The similarity in South China was lower than in the north. The port group in the Pearl River Delta had the least similarity, and there is a clear functional division, with more cooperation among ports than competition.
- (3)
- The major contributors to the similarity in different regions varied geographically due to the different market demands. In terms of the inbound structure, metal ore was the main cause of similarity in ports around Bohai Bay. Coal and metal ore were the leading factors determining similarity in the area of the Yangtze River Delta. Coal and other goods were the main contributors in the area of the Pearl River Delta.
- (4)
- For the adjacent ports, the similarity coefficient of inbound structure was larger than the outbound. This was because the resource endowments of port hinterlands vary widely, but the industrial structures of provinces in China are quite similar. The similarity of resource endowments of the hinterland is smaller than that of the industrial structure. The functional convergence between hub ports was more serious than between adjacent ports, in terms of both the outbound and inbound structure. Tianjin had the least similarity with the other hub ports. The main cargo of hub ports was other goods.
- (5)
- Over time, the average similarity coefficients of the inbound and outbound structure both displayed an increasing trend. The transportation function division of port system is becoming less clear. Industrial structure convergence and local government policy were the main reasons for the structural similarity of ports.
In terms of policy-making, the state should strengthen macro-control and create a port group development plan. In this strategic plan, the functional positioning of each port should be clear, and for the local government, local protectionism must be eliminated. Each port should form its own characteristics and realize a double win by dislocation development in accordance with market demand. This study showed the functional convergence of adjacent ports and hub ports in China. How to identify all of the factors related to port structure convergence and how to determine the specific criteria for judging an unreasonable similarity are interesting topics for future studies.
Acknowledgments
This work has been financially supported by the National Natural Science Foundation of China (41571113, 41771134 and 41701126) and a Category of Strategic Priority Research Program of CAS (Evaluation of Connectivity of Infrastructure Network and Spatial Optimization). The authors are very grateful to have the paper manuscript reviewed by the journal editors and reviewers.
Author Contributions
Wei Wang designed the research, analyzed the data, and wrote and revised the paper. Chengjin Wang and Fengjun Jin supervised the whole process and revised the paper. All authors have read and approved the final manuscript.
Conflicts of Interest
The authors declare no conflict of interest.
Appendix A
Table A1.
Similarity coefficient of the outbound structure in all port groups in 2014.
Table A1.
Similarity coefficient of the outbound structure in all port groups in 2014.
| Port Group | A Pair of Ports | Similarity Coefficient | Port Group | A Pair of Ports | Similarity Coefficient |
|---|---|---|---|---|---|
| Ports around Bohai Bay | Qinhuangdao and Huanghua | 0.9994 | Port group in the Pearl River Delta | Shenzhen and Zhanjiang | 0.9930 |
| Dalian and Yingkou | 0.9825 | Zhongshan and Jiangmen | 0.9860 | ||
| Qinhuangdao and Tangshan | 0.9697 | Guangzhou and Zhanjiang | 0.9658 | ||
| Yantai and Weihai | 0.9690 | Shenzhen and Guangzhou | 0.9642 | ||
| Huanghua and Tangshan | 0.9642 | Zhuhai and Jiangmen | 0.9097 | ||
| Dandong and Yingkou | 0.9549 | Zhongshan and Zhuhai | 0.8970 | ||
| Weihai and Qingdao | 0.9494 | Zhuhai and Yangjiang | 0.8409 | ||
| Yantai and Qingdao | 0.9483 | Huizhou and Maoming | 0.8311 | ||
| Dandong and Dalian | 0.9254 | Yangjiang and Maoming | 0.8238 | ||
| Dandong and Jinzhou | 0.9217 | Jiangmen and Yangjiang | 0.8124 | ||
| Tangshan and Tianjin | 0.8853 | Shenzhen and Jiangmen | 0.1939 | ||
| Dalian and Jinzhou | 0.8771 | Huizhou and Dongguan | 0.1904 | ||
| Yingkou and Jinzhou | 0.8757 | Guangzhou and Yangjiang | 0.1786 | ||
| Qinhuangdao and Tianjin | 0.8591 | Huizhou and Jiangmen | 0.1778 | ||
| Huanghua and Tianjin | 0.8464 | Dongguan and Yangjiang | 0.1694 | ||
| Port group in the Yangtze River Delta | Taizhou and Wenzhou | 0.9961 | Shantou and Huizhou | 0.1684 | |
| Shanghai and Ningbo | 0.9588 | Huizhou and Zhongshan | 0.1640 | ||
| Zhenjiang and Nantong | 0.9217 | Shantou and Zhuhai | 0.1621 | ||
| Jiangyin and Yangzhou | 0.9169 | Dongguan and Zhongshan | 0.1553 | ||
| Jiaxing and Yangzhou | 0.9098 | Shantou and Jiangmen | 0.1489 | ||
| Ningbo and Wenzhou | 0.9092 | Dongguan and Jiangmen | 0.1483 | ||
| Jiaxing and Jiangyin | 0.8948 | Yangjiang and Zhanjiang | 0.1458 | ||
| Ningbo and Taizhou | 0.8877 | Dongguan and Zhanjiang | 0.1222 | ||
| Shanghai and Taizhou | 0.8673 | Shantou and Shanwei | 0.1204 | ||
| Nantong and Yangzhou | 0.8454 | Shenzhen and Yangjiang | 0.1134 | ||
| Jiaxing and Nantong | 0.8144 | Shenzhen and Dongguan | 0.1037 | ||
| Ningbo and Jiangyin | 0.1753 | Shanwei and Jiangmen | 0.0851 | ||
| Jiaxing and Taizhou | 0.1725 | Shanwei and Dongguan | 0.0712 | ||
| Jiaxing and Wenzhou | 0.1694 | Shanwei and Guangzhou | 0.0465 | ||
| Ports on the southeast coast of China | Quanzhou and Xiamen | 0.9437 | Shanwei and Shenzhen | 0.0385 | |
| Ningde and Zhangzhou | 0.9159 | Shanwei and Zhongshan | 0.0378 | ||
| Fuzhou and Quanzhou | 0.8901 | Shanwei and Zhuhai | 0.0228 | ||
| Fuzhou and Xiamen | 0.8874 | Shanwei and Huizhou | 0.0080 | ||
| Putian and Xiamen | 0.1465 | Ports on the southwest coast of China | Yangpu and Basuo | 0.1856 | |
| Fuzhou and Zhangzhou | 0.1406 | Beihai and Fangchenggang | 0.1828 | ||
| Putian and Quanzhou | 0.1359 | Haikou and Basuo | 0.0380 | ||
| Ningde and Quanzhou | 0.1129 | ||||
| Quanzhou and Zhangzhou | 0.0770 | ||||
| Ningde and Putian | 0.0283 | ||||
| Putian and Zhangzhou | 0.0077 |
Table A2.
Similarity coefficient of the inbound structure in all port groups in 2014.
Table A2.
Similarity coefficient of the inbound structure in all port groups in 2014.
| Port Group | A Pair of Ports | Similarity Coefficient | Port Group | A pair of Ports | Similarity Coefficient |
|---|---|---|---|---|---|
| Ports around Bohai Bay | Huanghua and Tangshan | 0.9971 | Ports on the southeast coast of China | Fuzhou and Ningde | 0.9344 |
| Yingkou and Jinzhou | 0.9109 | Putian and Quanzhou | 0.8684 | ||
| Dalianand Yingkou | 0.9095 | Zhangzhou and Xiamen | 0.1898 | ||
| Huanghua and Tianjin | 0.8989 | Port group in the Pearl River Delta | Huizhou and Maoming | 0.9854 | |
| Qinhuangdao and Tangshan | 0.8923 | Shanwei and Dongguan | 0.9629 | ||
| Qingdao and Rizhao | 0.8865 | Dongguan and Jiangmen | 0.9541 | ||
| Qinhuangdao and Huanghua | 0.8846 | Shantou and Zhuhai | 0.9515 | ||
| Tangshan and Tianjin | 0.8770 | Shanwei and Jiangmen | 0.9502 | ||
| Dalian and Jinzhou | 0.8676 | Shenzhen and Guangzhou | 0.9238 | ||
| Qinhuangdao and Tianjin | 0.8436 | Guangzhou and Zhanjiang | 0.8817 | ||
| Yantai and Weihai | 0.8336 | Shenzhen and Zhanjiang | 0.8788 | ||
| Weihai and Rizhao | 0.1548 | Guangzhou and Huizhou | 0.1836 | ||
| Port group in the Yangtze River Delta | Taizhou and Wenzhou | 0.9882 | Shenzhen and Huizhou | 0.1759 | |
| Zhenjiang and Nantong | 0.9509 | Zhongshan and Dongguan | 0.1725 | ||
| Nanjing and Zhenjiang | 0.9508 | Dongguan and Shenzhen | 0.1577 | ||
| Nanjing and Nantong | 0.9484 | Maoming and Yangjiang | 0.1406 | ||
| Zhenjiang and Jiangyin | 0.9480 | Jiangmen and Zhongshan | 0.1318 | ||
| Nanjing and Suzhou | 0.9356 | Maoming and Zhongshan | 0.1297 | ||
| Jiaxing and Yangzhou | 0.9247 | Yangjiang and Shenzhen | 0.1012 | ||
| Zhenjiang and Suzhou | 0.9235 | Zhongshan and Shanwei | 0.0878 | ||
| Suzhou and Nantong | 0.9195 | Shenzhen and Shanwei | 0.0718 | ||
| Nanjing and Jiangyin | 0.9187 | Zhongshan and Huizhou | 0.0657 | ||
| Jiangyin and Yangzhou | 0.9150 | Yangjiang and Zhongshan | 0.0249 | ||
| Jiaxing and Jiangyin | 0.8930 | Ports on the southwest coast of China | Beihai and Fangchenggang | 0.9045 | |
| Ningbo and Nanjing | 0.8896 | Basuo and Haikou | 0.1871 | ||
| Shanghai and Ningbo | 0.8858 | ||||
| Zhenjiang and Yangzhou | 0.8794 | ||||
| Nantong and Jiangyin | 0.8791 | ||||
| Suzhou and Jiangyin | 0.8663 | ||||
| Ningbo and Suzhou | 0.8320 | ||||
| Zhoushan and Nantong | 0.8183 | ||||
| Nanjing and Yangzhou | 0.8141 | ||||
| Shanghai and Suzhou | 0.8101 | ||||
| Jiaxing and Zhenjiang | 0.8074 | ||||
| Nantong and Yangzhou | 0.8059 | ||||
| Ningbo and Zhoushan | 0.8029 |
Table A3.
Similarity coefficient of the outbound and inbound structure of hub ports in 2014.
Table A3.
Similarity coefficient of the outbound and inbound structure of hub ports in 2014.
| A Pair of Ports | Similarity Coefficient | A Pair of Ports | Similarity Coefficient | ||
|---|---|---|---|---|---|
| Outbound | Qingdao and Ningbo | 0.9954 | Inbound | Dalian and Shenzhen | 0.9870 |
| Dalian and Qingdao | 0.9818 | Xiamen and Guangzhou | 0.9666 | ||
| Dalian and Shenzhen | 0.9729 | Shanghai and Guangzhou | 0.9312 | ||
| Ningbo and Fuzhou | 0.9703 | Shenzhen and Guangzhou | 0.9238 | ||
| Shanghai and Guangzhou | 0.9664 | Shanghai and Xiamen | 0.9230 | ||
| Dalian and Guangzhou | 0.9661 | Dalian and Guangzhou | 0.9199 | ||
| Dalian and Ningbo | 0.9649 | Shanghai and Ningbo | 0.8858 | ||
| Shenzhen and Guangzhou | 0.9642 | Xiamen and Shenzhen | 0.8733 | ||
| Qingdao and Shanghai | 0.9630 | Dalian and Xiamen | 0.8712 | ||
| Shanghai and Ningbo | 0.9588 | Tianjin and Qingdao | 0.8611 | ||
| Qingdao and Shenzhen | 0.9549 | Ningbo and Fuzhou | 0.8518 | ||
| Qingdao and Fuzhou | 0.9527 | Dalian and Shanghai | 0.8355 | ||
| Qingdao and Guangzhou | 0.9493 | Shanghai and Fuzhou | 0.8319 | ||
| Dalian and Shanghai | 0.9445 | Ningbo and Xiamen | 0.8195 | ||
| Shanghai and Fuzhou | 0.9434 | Shanghai and Shenzhen | 0.8153 | ||
| Ningbo and Shenzhen | 0.9391 | Qingdao and Ningbo | 0.8047 | ||
| Ningbo and Guangzhou | 0.9308 | ||||
| Shanghai and Shenzhen | 0.9281 | ||||
| Xiamen and Shenzhen | 0.9255 | ||||
| Xiamen and Guangzhou | 0.9121 | ||||
| Dalian and Xiamen | 0.9068 | ||||
| Dalian and Fuzhou | 0.9054 | ||||
| Fuzhou and Shenzhen | 0.8950 | ||||
| Ningbo and Xiamen | 0.8903 | ||||
| Qingdao and Xiamen | 0.8884 | ||||
| Fuzhou and Xiamen | 0.8874 | ||||
| Fuzhou and Guangzhou | 0.8854 | ||||
| Shanghai and Xiamen | 0.8719 | ||||
| Tianjin and Xiamen | 0.1433 | ||||
| Tianjin and Shenzhen | 0.1201 |
References
- Rimmer, P.J. The search for spatial regularities in the development of Australian seaports 1861–1961/2. Geogr. Ann. 1967, 49, 42–54. [Google Scholar]
- Notteboom, T.E. Concentration and load centre development in the European container port system. J. Transp. Geogr. 1997, 5, 99–115. [Google Scholar] [CrossRef]
- Notteboom, T.E. Concentration and the formation of multi-port gateway regions in the European container port system: An update. J. Transp. Geogr. 2010, 18, 567–583. [Google Scholar] [CrossRef]
- Liu, L.M.; Wang, K.Y.; Yip, T.L. Development of a container port system in Pearl River Delta: Path to multi-gateway ports. J. Transp. Geogr. 2013, 28, 30–38. [Google Scholar] [CrossRef]
- Chen, C.F. Port system’s structure evolution and advantage compare in Yangtze River delta. Port Waterw. Eng. 2011, 6, 54–60. [Google Scholar]
- Cao, Y.H.; Li, H.J.; Chen, W. The spatial structure and the competition pattern of the container port system of China. Acta Geogr. Sin. 2004, 59, 1020–1027. [Google Scholar]
- Ducruet, C.; Roussin, S.; Jo, J.C. Going west? Spatial polarization of the North Korean port system. J. Transp. Geogr. 2009, 17, 357–368. [Google Scholar] [CrossRef]
- Wang, Z.L.; Han, Z.L. Research on competitiveness of main ports in circum-Bohai area. Resour. Dev. Mark. 2012, 28, 214–217. [Google Scholar]
- Wang, A.H.; Liu, X.H. Port competiveness: A structured literature review and implications for future research. J. South China Univ. Technol. 2013, 15, 9–25. [Google Scholar]
- Song, D.P.; Lyons, A.; Li, D.; Sharifi, H. Modeling port competition from a transport chain perspective. Transp. Res. Part E Logist. Transp. Rev. 2016, 87, 75–96. [Google Scholar] [CrossRef]
- Tongzon, J.; Heng, W. Port privatization, efficiency and competitiveness: Some empirical evidence from container ports (terminals). Transp. Res. 2005, 39, 405–424. [Google Scholar] [CrossRef]
- Carlan, V.; Sys, C.; Vanelslander, T. How port community systems can contribute to port competitiveness: Developing a cost–benefit framework. Res. Transp. Bus. Manag. 2016, 19, 51–64. [Google Scholar] [CrossRef]
- Zheng, S.Y.; Negenborn, R.R. Centralization or decentralization: A comparative analysis of port regulation modes. Transp. Rev. 2014, 69, 21–40. [Google Scholar] [CrossRef]
- Tovar, B.; Hernández, R.; Rodríguez-Déniz, H. Container port competitiveness and connectivity: The Canary Islands main ports case. Transp. Policy 2015, 38, 40–51. [Google Scholar] [CrossRef]
- Álvarez-SanJaime, Ó.; Cantos-Sánchez, P.; Moner-Colonques, R.; Sempere-Monerris, J. The impact on port competition of the integration of port and inland transport services. Transp. Res. 2015, 80, 291–302. [Google Scholar] [CrossRef]
- Han, Z.L.; Wang, C.J. The discussion of the port transportation system in the region around Bo Sea. Hum. Geogr. 2002, 17, 86–89. [Google Scholar]
- Zhao, X.J. An analysis on competition and cooperation within the circum-Bohai port cluster. Soc. Sci. J. Univ. Shanxi 2011, 23, 39–41. [Google Scholar]
- Li, J.B.; Oh, Y.S. A research on competition and cooperation between Shanghai Port and Ningbo—Zhoushan Port. Asian J. Shipp. Logist. 2010, 26, 67–91. [Google Scholar] [CrossRef]
- Chen, L.; Wu, S.D.; Chen, P.J. A research on the structure of Fujian port system. Trop. Geogr. 2007, 27, 249–283. [Google Scholar]
- Zhang, F. A study on the competition and cooperation of the ports in Pearl Delta. Urban Stud. 2004, 11, 75–81. [Google Scholar]
- Wang, L.H.; Notteboom, T.; Lau, Y.Y.; Ng, A. Functional Differentiation and Sustainability: A New Stage of Development in the Chinese Container Port System. Sustainability 2017, 9, 328. [Google Scholar] [CrossRef]
- Hoshino, H. Competition and collaboration among container ports. Asian J. Shipp. Logist. 2010, 26, 31–47. [Google Scholar] [CrossRef]
- Heaver, T.; Meersman, H.; Moglia, F.; Van de Voorde, E. Do mergers and alliances influence European shipping and port competition? Marit. Policy Manag. 2000, 27, 363–373. [Google Scholar] [CrossRef]
- Wang, J.X. Interaction and Development between Chinese Ports and Cities, 1st ed.; Southeast University Press: Nanjing, China, 2010; pp. 98–103. [Google Scholar]
- Zhang, X.J. Analysis of game theory for cooperation of ports. Logist. Eng. Manag. 2009, 31, 13–15. [Google Scholar]
- Yu, H.H.; Wang, X.P. Research on the relations among ports in the Yangtze River Delta based on co-opetition game. Logist. Sci-Tech 2010, 10, 16–20. [Google Scholar]
- Notteboom, T.; Yang, Z.Z. Port governance in China since 2004: Institutional layering and the growing impact of broader policies. Res. Transp. Bus. Manag. 2017, 22, 184–200. [Google Scholar] [CrossRef]
- Cao, Y.H.; Mao, H.Y.; Xu, G. The functional structure of the lower Changjiang River port system. Acta Geogr. Sin. 2002, 56, 590–598. [Google Scholar]
- He, C.F.; Zhu, S.J. Economic transition and industrial restructuring in China: Structural convergence or divergence? Post-Communist Econ. 2007, 19, 317–342. [Google Scholar]
- Wei, S.Q.; Chen, Y.H.; Ge, J.H. Empirical study on industrial isomorphism comparing Fujian and Taiwan provinces by the similar coefficient and R/S. Geogr. Res. 2010, 29, 491–499. [Google Scholar]
- Jiang, Y.L.; Yang, Z.Z.; Wang, L.; Zou, W.Q. Homogenization analysis of airports in China Yangtze River Delta region. Econ. Geogr. 2013, 33, 122–127. [Google Scholar]
- Ishii, M.; Lee, T.W.; Tezuka, K.; Chang, Y.T. A game theoretical analysis of port competition. Transp. Res. Part E Logist. Transp. Rev. 2013, 49, 92–106. [Google Scholar] [CrossRef]
- He, C.F.; Liu, Z.L.; Wang, L. Economic transition and convergence of regional industrial structure in China. Acta Geogr. Sin. 2008, 63, 807–819. [Google Scholar]
- Chen, Y. Measurement of industrial structure convergence and its desirability or non-desirability. China Ind. Econ. 1998. [Google Scholar] [CrossRef]
© 2017 by the authors. Licensee MDPI, Basel, Switzerland. This article is an open access article distributed under the terms and conditions of the Creative Commons Attribution (CC BY) license (http://creativecommons.org/licenses/by/4.0/).