Article

In-Depth Analysis of Energy Efficiency Related Factors in Commercial Buildings Using Data Cube and Association Rule Mining

1
Department of Civil and Environmental Engineering, Korea Advanced Institute of Science and Technology (KAIST), 291 Daehak-ro, Yuseong-gu, Daejeon 34141, Korea
2
School of Planning, Design, and Construction, Michigan State University, 552 W. Circle Dr., East Lansing, MI 48824, USA
*
Author to whom correspondence should be addressed.
Sustainability 2017, 9(11), 2119; https://doi.org/10.3390/su9112119
Submission received: 25 September 2017 / Revised: 16 November 2017 / Accepted: 16 November 2017 / Published: 17 November 2017
(This article belongs to the Section Energy Sustainability)

Abstract

:
Significant amounts of energy are consumed in the commercial building sector, resulting in various adverse environmental issues. To reduce energy consumption and improve energy efficiency in commercial buildings, it is necessary to develop effective methods for analyzing building energy use. In this study, we propose a data cube model combined with association rule mining for more flexible and detailed analysis of building energy consumption profiles using the Commercial Buildings Energy Consumption Survey (CBECS) dataset, which has accumulated over 6700 existing commercial buildings across the U.S.A. Based on the data cube model, a multidimensional commercial sector building energy analysis was performed based upon on-line analytical processing (OLAP) operations to assess the energy efficiency according to building factors with various levels of abstraction. Furthermore, the proposed analysis system provided useful information that represented a set of energy efficient combinations by applying the association rule mining method. We validated the feasibility and applicability of the proposed analysis model by structuring a building energy analysis system and applying it to different building types, weather conditions, composite materials, and heating/cooling systems of the multitude of commercial buildings classified in the CBECS dataset.

1. Introduction

Recently, increasing amounts of energy are consumed due to the growth in energy demand, therefore emitting a vast amount of greenhouse gas (GHG). This has caused various adverse environmental problems such as global warming and air pollution [1]. One sector that primarily affects increasing global energy use is the building sector. According to studies performed by the U.S. Department of Energy (DoE), nearly 40% of the total energy use in the world is attributable to buildings [2,3]. In particular, commercial buildings are responsible for approximately 40% of the total energy usage in the U.S.A., which is more than that of the transportation or industry sectors [4]. In commercial buildings, heating and cooling are the biggest sources of major energy consumption [5]. To reduce building energy use for heating and cooling, it is essential to design buildings for maximized energy efficiency during the early design phase, considering location, architectural components, form, materials, orientation, and so on. Therefore, it is necessary to analyze energy use in buildings, and to provide efficient building design.
To date, much research has been conducted to reduce energy consumption and to improve energy efficiency in buildings [6,7,8,9,10]. For example, Chae et al. proposed a prediction model for electrical energy consumption in buildings based on an artificial neural network and Bayesian regularization algorithm [8]. They also identified the important variables that affected electrical energy consumption for the purpose of feature reduction. Lei et al. investigated the energy performance of building envelopes integrating the phase change materials (PCMs) for cooling load reduction in Singapore by using numerical simulations [9]. Mathew et al. analyzed the performance of energy efficiency according to the composition of various building envelopes [10].
In addition, many countries operate database systems—which include building type, energy source, and end-use—based on surveys and measurements to manage the energy-use intensity (EUI). For example, in the United States, database systems such as the Commercial Buildings Energy Consumption Survey (CBECS), the Residential Energy Consumption Survey, and the Manufacturing Energy Consumption Survey have been operated [11]. Such building energy benchmarking datasets make it possible to analyze a set of useful information on the status and performance of energy consumption, and are applied to solve shortcomings in a building. As one of the aforementioned datasets, CBECS, provided by the U.S. Energy Information Administration (EIA), includes various factors that affect the energy consumption of commercial buildings [11,12]. A detailed description of the CBECS dataset is described in Section 2.1. By applying the CBECS dataset, Kahn et al. studied the association between a building’s electricity consumption and the physical attributes of the selected buildings [13]. Arroyo et al. investigated the change of building energy efficiency and energy use taking into account the building type, climate, equipment, and so on [14]. Jeon et al. compared the annual energy performance of different types of heating, ventilation, and air-conditioning (HVAC) equipment in existing small- and medium-sized commercial buildings [15]. Furthermore, they identified appropriate HVAC systems that could be retrofitted into different commercial building types in a cost effective manner.
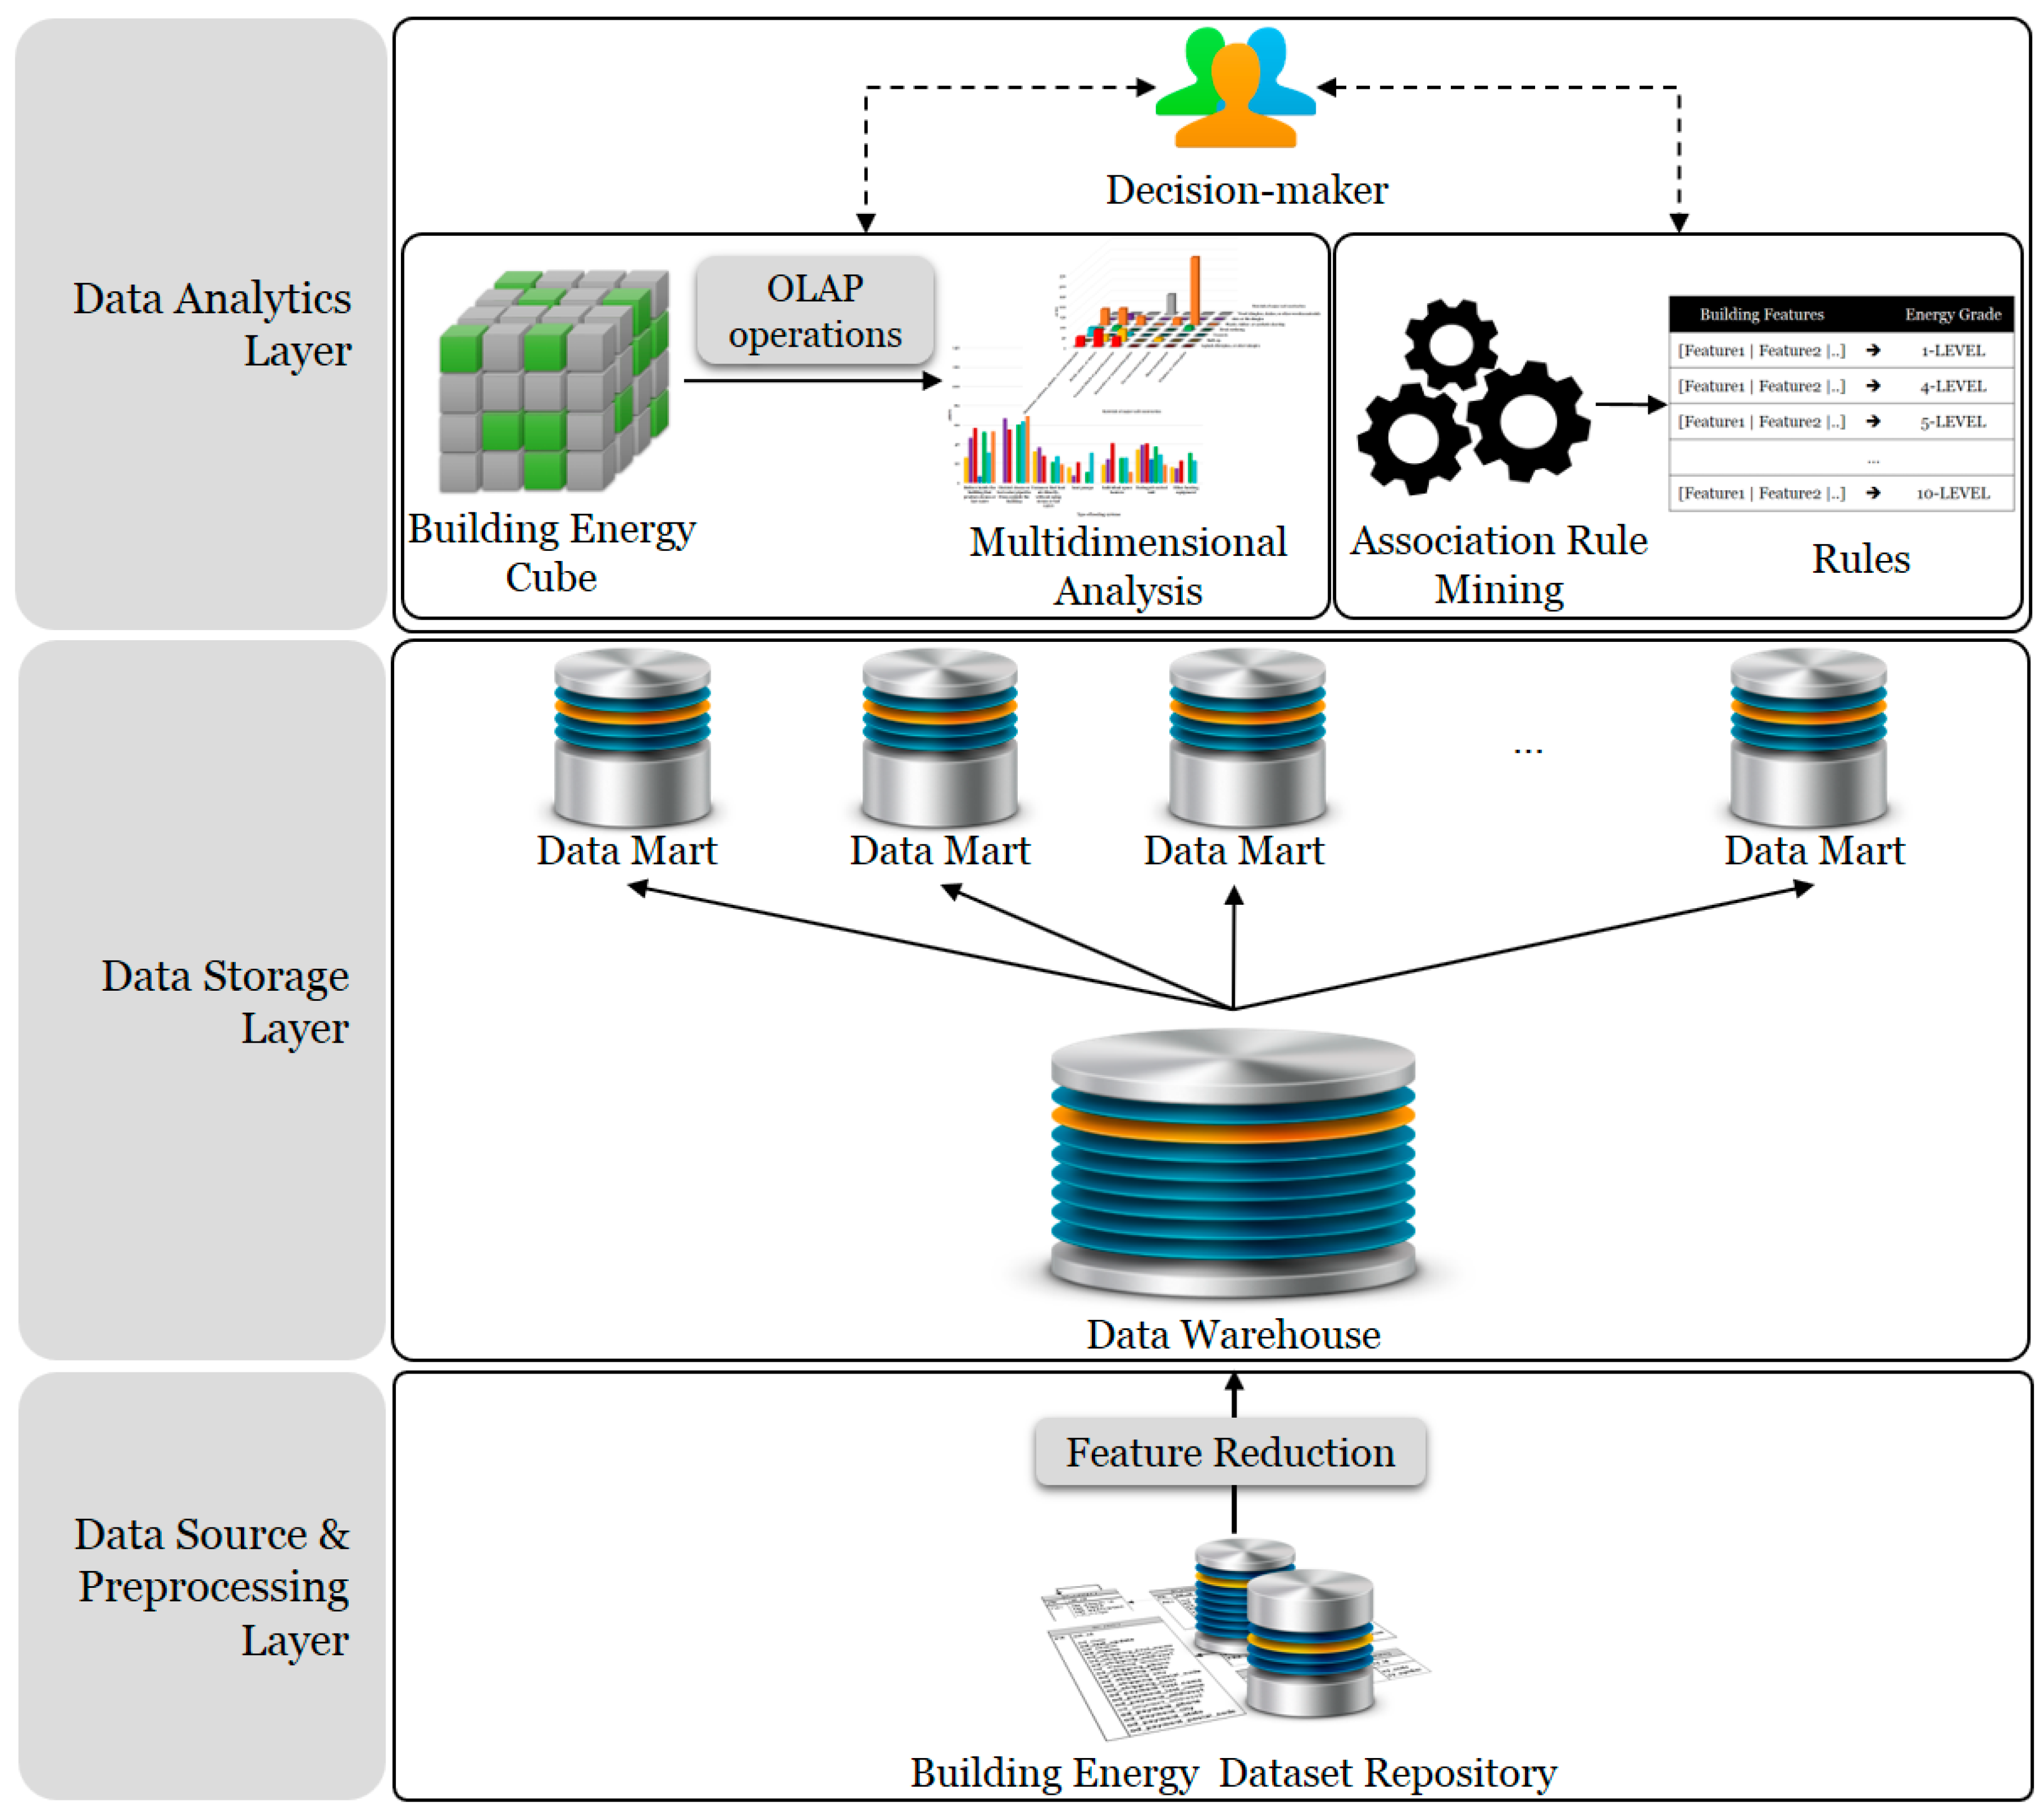
In this study, unlike ordinary perspectives in the current research literature, we propose a new designed system for effective building energy use analysis. One of the core methodologies proposed in this research was a data cube model for the multidimensional analysis of energy efficiency for heating/cooling according to various factors in a building by using the CBECS dataset. Based on the construction of the data cube model, multidimensional building energy consumption analysis was performed using on-line analytical processing (OLAP) operations with multiple levels of abstraction. In addition, the proposed analysis model also provided a comprehensive set of information out of the vast building energy data by applying the association rule mining. To the best of our knowledge, this was the first attempt of an OLAP analysis combined with association rule mining on large-scaled building energy datasets for an in-depth analysis of building energy.

2. Materials and Methods

2.1. Conceptual Framework of the Proposed Building Energy Analysis

In this section, we introduce a building energy analysis system able to scrutinize large amounts of CBECS datasets using diversified OLAP operations at various levels of abstractions. Figure 1 demonstrates the overall architecture of the proposed analytical system. The energy consumption analysis system consists of three layers: (1) the data source and preprocessing layer; (2) the data storage layer; and (3) the data analytics layer. In the first layer, the building energy dataset is stored in repositories, and the preprocessing is performed to select important features that affect energy consumption and to reduce the feature dimensions, as previously mentioned. As required, all data related to building energy consumption might be candidate data repositories. Thus, we used a data warehouse for the effective storage of large-scale building energy data. Finally, we conducted the analysis by applying OLAP operations and association rule mining so that the results of the analysis supported the decision-makers. Each layer is described in detail through the progression of the research explanation.

2.2. Data Sources and Descriptions

In this study, we used the CBECS dataset provided by the U.S. EIA in 2012 [11]. The objective of this dataset was to obtain the factual data on energy consumption for commercial buildings in the U.S.A. in relation to the energy related qualities of those buildings. The U.S. EIA reported that there were 5.6 million business structures in the U.S.A. in 2012. Since it would be unreasonable and cost prohibitive to investigate and analyze all 5.6 million structures, the U.S. EIA utilized a factual sample that was intended to represent the whole populace. For the CBECS in 2012, interviews were conducted professionally with building proprietors, managers, and other personnel using computerized survey instruments for 6720 commercial buildings to gather information for each structure from April to November 2013. The CBECS dataset contains approximately 28 features of the commercial buildings: energy consumption, climate region, building type, envelope materials, annual heating and cooling degree days (HDD and CDD, respectively), number of laptops and computers, construction year, type of HVAC system, and so on. In particular, climate regions were defined as five types: hot-dry/mixed-dry/hot-humid, mixed-humid, very-cold/cold, marine, and subarctic. The detailed descriptions and regions for each climate are presented in Figure 2 and Table 1, respectively.

2.3. Data Preprocessing

Prior to designing the schema for multidimensional analysis, we removed 1586 records (5134 remaining), which included missing values for a precise analysis. Additionally, due to the huge volume of the given datasets as well as the potential existence of the correlations among the features, it was essential to reduce and select the most essential features. To accomplish these objectives, we adapted the C5.0 algorithm, one of the most popular decision tree methods [16,17,18]. Decision trees are a very effective and powerful method of classification, feature selection, segmentation, and predicting problems in building energy studies as well as in data science fields [19,20,21,22]. The C5.0 method is based on the ID3 and C4.5 algorithm. The ID3 algorithm builds a tree based on the information obtained from the training instances and uses the same to classify the test data. In addition, it is generally used in classifying nominal attributes without missing values. In accordance with the various effects of C5.0, we used it for selecting the features that affect energy consumption in buildings. A more detailed explanation of the C5.0 method can be found in Reference [23]. As a result of feature reduction, 10 features were selected, which represented the most influential factors on building energy consumption. Table 2 presents the selected features and their descriptions. In the analysis, no data or confidential features were excluded such as the “Subarctic” and “withheld to protect confidentiality” in the PUBCLIM variable, respectively. In addition, data that did not have values were eliminated for more precise analysis in the experiments. These selected features are marked as (X) in Table 2. With these preprocessing steps, we obtained the refined 5134 items and 10 essential features.

2.4. Multidimensional Data Cube

Generally speaking, traditional database schemas are usually adopted as a constructive part of relational databases (RDB), where a database is comprised of an arrangement of elements and the connections among them [24]. Such data models are fit for an online transaction processing (OLTP) system. However, for analysis in multiple viewpoints, data warehouses demand more flexible, succinct, and subject-oriented schema than traditional schema such as a multidimensional data model [18,25]. This multidimensional model enables data to be modeled and viewed in a variety of dimensions in the form of a data cube. In this paper, to construct the data cube, we used a star schema, one of the diversified multidimensional schemas. The star schema resembles a starburst with the dimension tables shown in an outspread pattern around the central fact table. It is defined by dimensions and facts: (1) dimensions mean the perspectives and objects with respect to what a user hopes to keep records; and (2) facts include the names of the facts or measures as well as the keys to each of the related dimension tables [26,27].
In this study, we designed a star schema for multidimensional analysis suitable for building energy consumption with four dimensions: building activity, building feature, building operations, and climate, as seen in Figure 3. Thus, “average use of energy per square feet for heating (notated by AHES)” and “average use of energy per square feet for cooling (notated by ACES)” were used as the measurements in the fact table. Due to the differences in building energy consumption profiles depending on the size of building, we set measurements by considering those important factors. Therefore, we utilized the value representing the area of each building divided by the heating and cooling energy usage. However, since summation is used as an operator when measurements are aggregated in a data cube, energy consumption is increased where there is a densely populated building cluster. Hence, we used the mean value for the operation of aggregation in order to investigate the average heating and cooling energy consumption of buildings, represented by AHES and ACES, respectively. In addition, we used the British thermal unit (Btu) for the representative energy unit which was derived by the summation of fuel and electricity consumed in commercial buildings for heating and cooling. For instance, if the square footage of building A is 500,000 ft 2 and the amount of used energy is 9,334,774 Btu for heating and 3,418,546 Btu for cooling, the AHES and ACES of building A are 18.67 (=9,334,774 Btu/500,000 ft 2 ) and 6.84 (=3,418,546 Btu/500,000 ft 2 ), respectively.

2.5. Concept Hierarchy and OLAP Operations

A concept hierarchy characterizes a sequence of mapping from a set of low-level concepts to higher-level and more generalized concepts [28]. It allows data to be managed at multiple levels of abstraction. In this paper, we defined four concept hierarchies based on the reduced features set: (1) climate zone dimension; (2) building activity dimension; (3) building feature dimension; and (4) building operation dimension. As depicted in Figure 4, each concept hierarchy of dimension was based on the structure of a hierarchical tree. For example, the concept hierarchy of the climate zone dimension was represented on the lowest level “New England” to the highest level “very-cold/cold” (see Figure 4a). Similarly, the concept hierarchy of building activity is presented in Figure 4b. Meanwhile, the lowest level in building feature and building operation dimensions were designed in the form of attributes, not hierarchy, as seen in Figure 4c,d, respectively. For instance, the concept hierarchy of building feature dimension was represented on the lowest level “material of major wall construction” or “type of window glass” (see Figure 4c). In addition, the concept hierarchy of building operation was also represented on the lowest level “type of cooling system” to the highest level “equipment” (see Figure 4d).
In a multidimensional model, OLAP data cube operations allow interactive querying, and analysis of the available data. OLAP operations also make it possible to construct a flexible and extensible analytical system and provide the user with the flexibility to view data from different perspectives [18]. The OLAP operations are described as follows:
  • Roll-up: The roll-up operation performs aggregation on a data cube either by climbing up a concept hierarchy for a dimension or by dimension reduction.
  • Drill-down: The drill-down is the reverse of roll-up. It navigates from less detailed data to more detailed data. Drill-down can be realized by either stepping down a concept hierarchy for a dimension or introducing additional dimensions.
  • Slice and Dice: The slice operation performs a selection in one dimension of the given cube, resulting in a sub-cube. The dice operation defines a sub-cube by performing a selection on two or more dimensions.
For these types of multidimensional analysis, the Oracle database management system and R tools were employed to store the data in a data warehouse and to build the data cube, respectively. After being loaded into the data warehouse, the data cube was constructed for analysis and reporting. The user could analyze the data or create reports in real-time depending on what was needed by choosing the desired dimensions.

2.6. Association Rule Mining

In this section, we describe the association rule mining method. Association rule mining, as one of the most widely used data mining techniques, aims at uncovering interesting and useful patterns [29,30]. Through association rule mining, the rules are generated in the form of X Y that satisfies the predefined minimum support and confidence threshold from any given data (X and Y are a set of items). Support is the percentage of the task-relevant tuples, and confidence is a predefined probability of satisfying Y under the condition that X is satisfied. Support and confidence are the measurements of rule effectiveness, and can be figured by probability, P ( X Y ) and P ( Y | X ) , respectively [31]. Associations can be further analyzed to uncover correlation rules, which convey statistical correlations between sets of items X and Y. It is known as lift, as third evaluation parameter, and expressed as follows:
L i f t ( X Y ) = P ( X Y ) P ( X ) P ( Y ) = P ( Y | X ) P ( Y )
According to Lee et al., lift = 1 indicates no correlation between X and Y [32]. lift > 1 and lift < 1 indicate the positive and negative correlation between X and Y, respectively. In other words, if the lift value is less than 1 (negative lift between X and Y), the occurrence of one does not lead to the occurrence of other and vice versa. For the association rule mining, in this study, we used the “arules” package in R tools, which is based on the Apriori algorithm, one of the association rule mining algorithms, and provides the infrastructure for representing, manipulating, and scrutinizing transaction data and patterns [33].

3. Results and Discussion

This section introduces a multidimensional building energy analysis system using the data cube model and association rule mining. Furthermore, we validated the feasibility and applicability of the proposed system by describing the experimental results that were applied to the CBECS dataset provided by the U.S. EIA using the Oracle database management system and R tools.

3.1. Building Energy Analysis Results Derived by OLAP

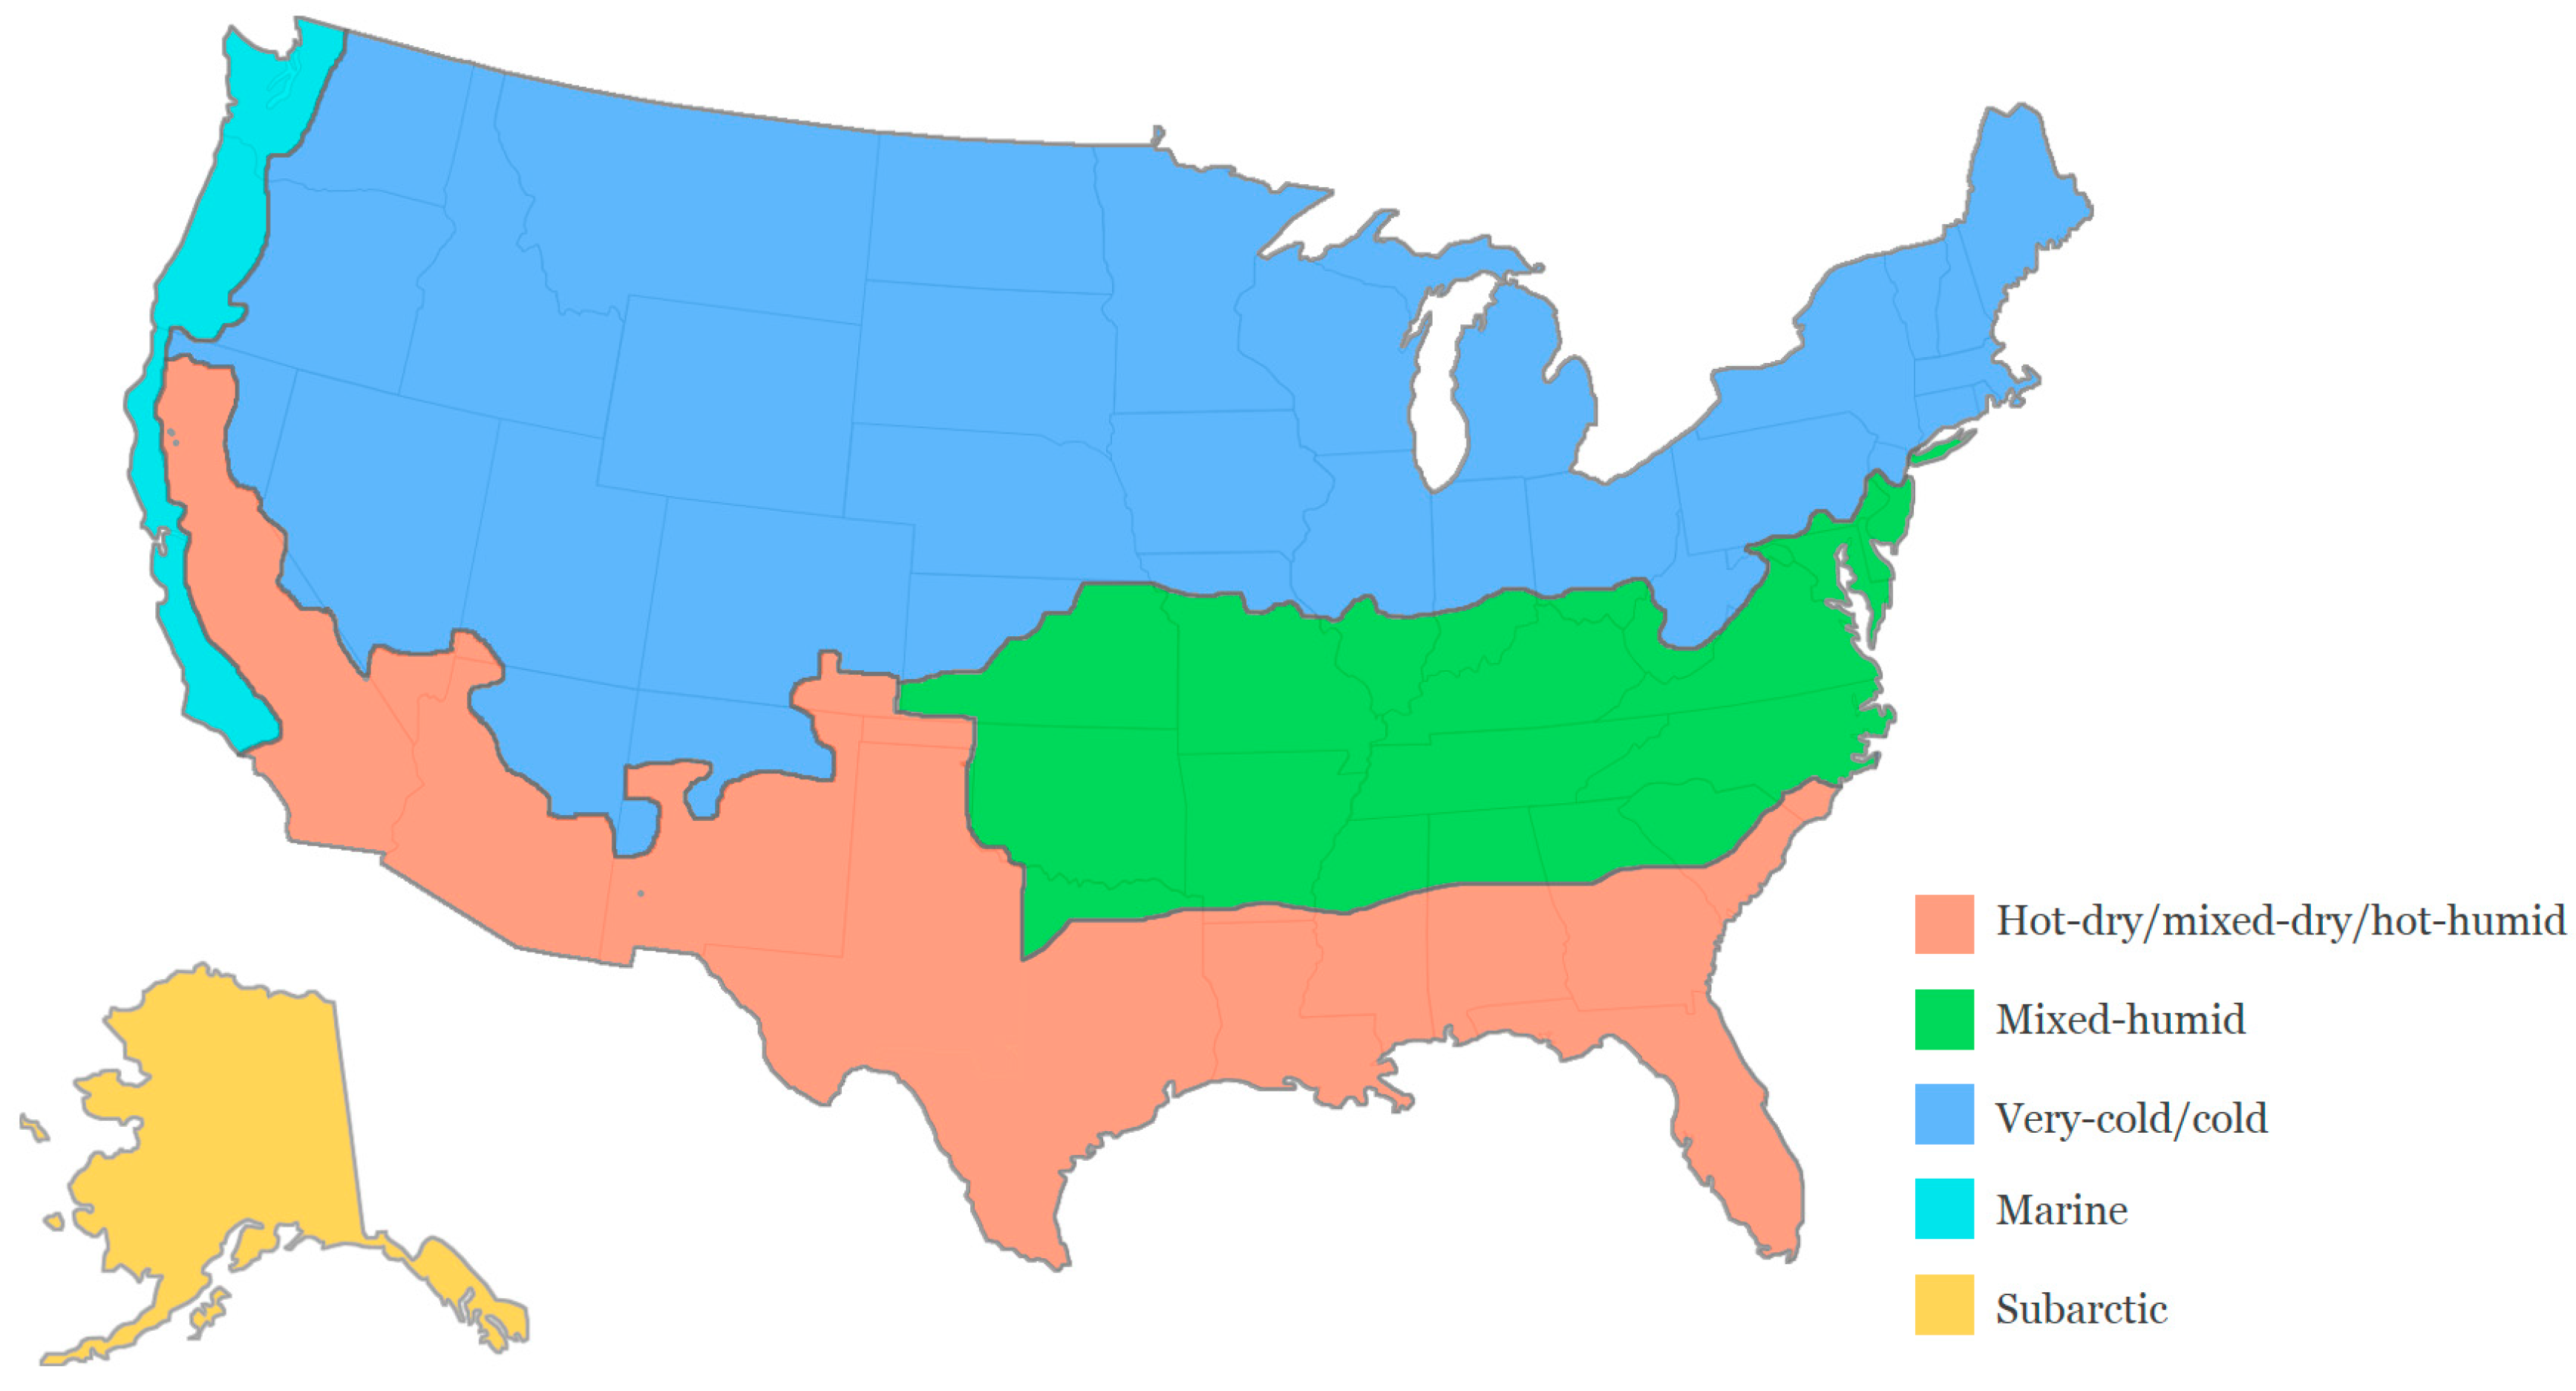
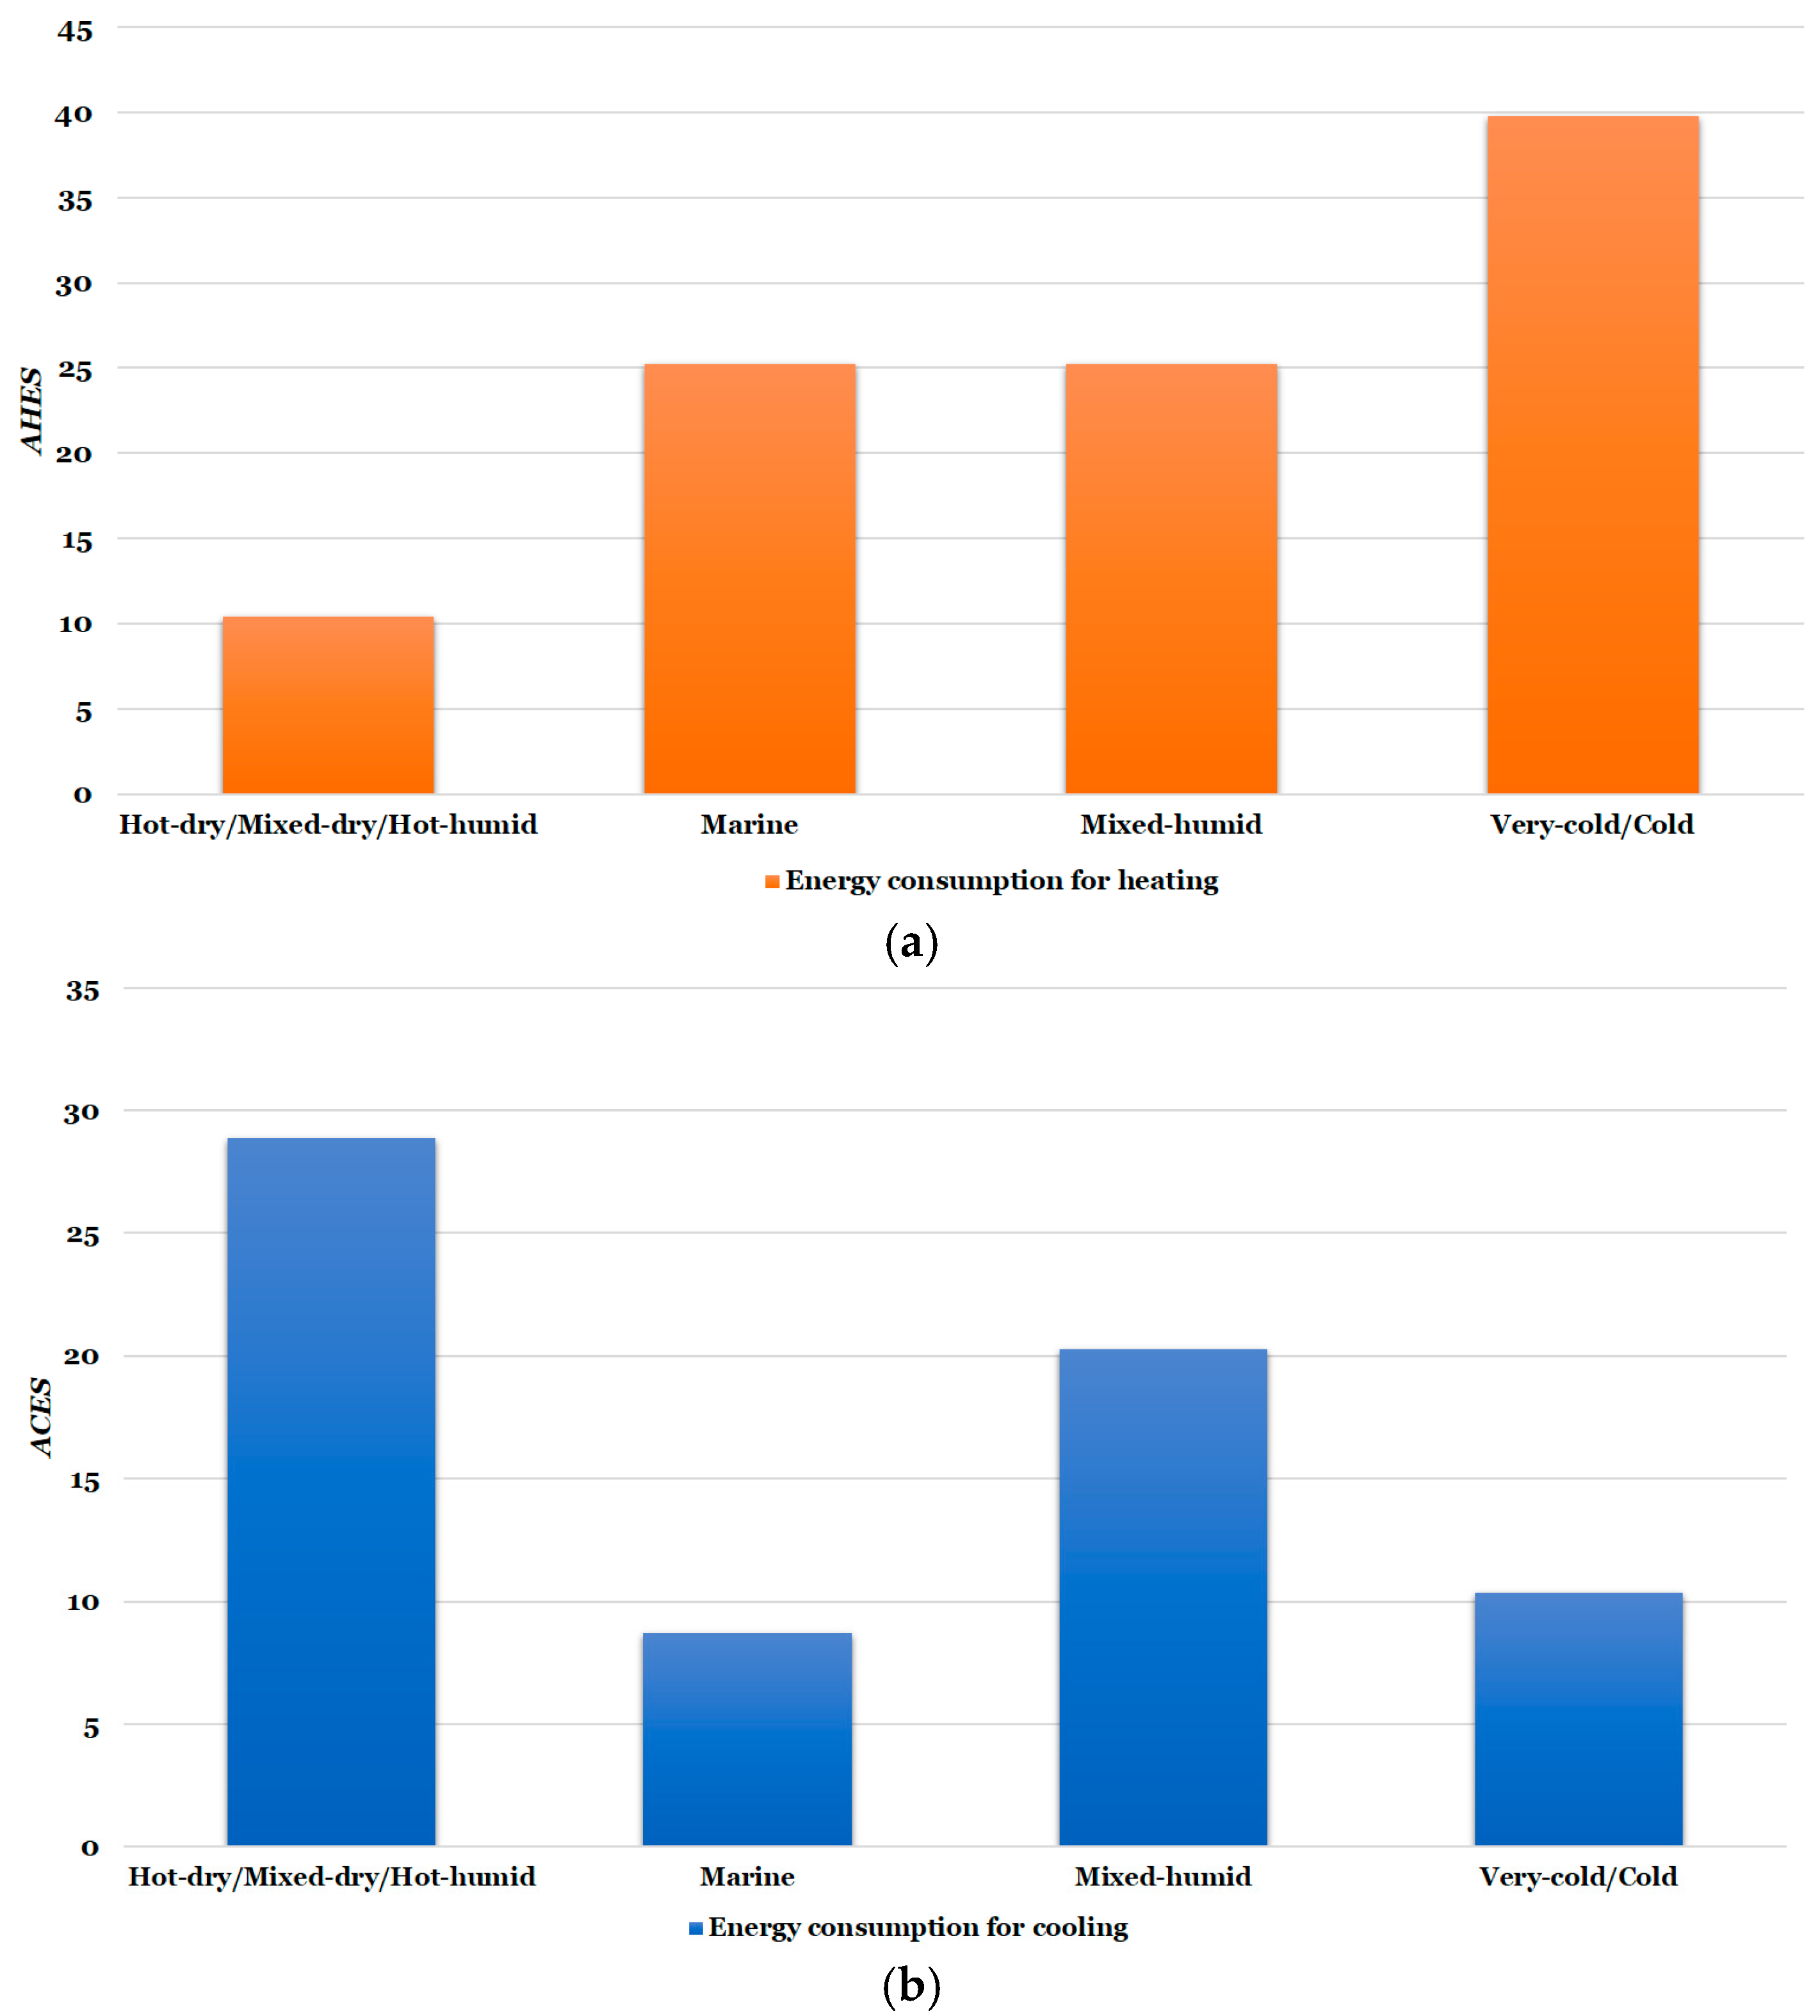
In this section, we describe the multidimensional analysis outcomes, which were obtained by adjusting the levels of abstraction. A system manager attempts to choose a dimension with the viewpoint, and analyzes it with various levels of abstraction using the proposed model described in the previous section. First, we demonstrated that the system could be used to conduct a descriptive analysis for the amount of building energy consumption in different climate regions. For estimating heating and cooling energy usage, we adjust the data cube by using the drill-down and dice operations in relation with different climate zones, as seen in Figure 5. In a very-cold/cold climate zone, it seems that a lot of energy is consumed for heating the space as seen in Figure 5a. On the other hand, a significant amount of energy is also consumed for cooling in hot-dry/mixed-dry/hot-humid climate regions, as seen in Figure 5b. Based on these results, we conducted a drill-down operation on building feature and building operation dimensions to look more closely at what factors affect energy efficiency. A system manager can consider various factors and adjust dimensions with varying levels of abstraction, but in our analysis scenarios, the building feature (e.g., materials and types of envelopes) and building operation (e.g., type of heating/cooling equipment) dimensions were chosen to confirm in detail which factors significantly affected the energy efficiency. The adopted analysis scenarios are as follows: (1) Scenario I: energy efficiency related factors for heating in very-cold/cold climate zones; and (2) Scenario II: energy efficiency related factors for cooling in hot-dry/mixed-dry/hot-humid climate zones with the various viewpoints.

3.1.1. Scenario I: Analysis on Heating Energy Influencing Factors in Very-Cold/Cold Climate Zones

To identify which factors of the chosen buildings affected the energy efficiency, we performed an in-depth analysis focusing on the very-cold/cold climate zones that had the highest AHES. First, we conducted a drill-down operation on the building operation dimension. Thereafter, a dice operation was performed in the type-level.
Figure 6 demonstrates that buildings with “district steam or hot water piped in from outside the building” consumed more energy than buildings using other systems, whereas those buildings with “heat pumps” or “individual space heaters” consumed relatively less energy for heating. In other words, the “district steam or hot water piped in from outside the building” was a heating system with poor energy efficiency, especially in very-cold/cold climate zones where using such systems are not recommended. To show energy usage in accordance with each heating system type, the capacity of a specific heating system has to be considered. However, only the average value for energy usage was used in this study. Practically, the analysis results are presented in Figure 7 when using an aggregation operator with absolute energy usage that only considered the heating systems of buildings that were located in very-cold/cold climate zones.
Figure 7 shows that the “packaged central unit” had a higher value of heating energy usage unlike Figure 6. From this result, there are potentially other factors that affect energy efficiency, not just heating systems. Therefore, we analyzed the AHES considering both heating system type and other factors in these climatic regions.
The drill-down operation was conducted on building feature dimension, and the dice operation was also performed for the material-level in major wall construction. 
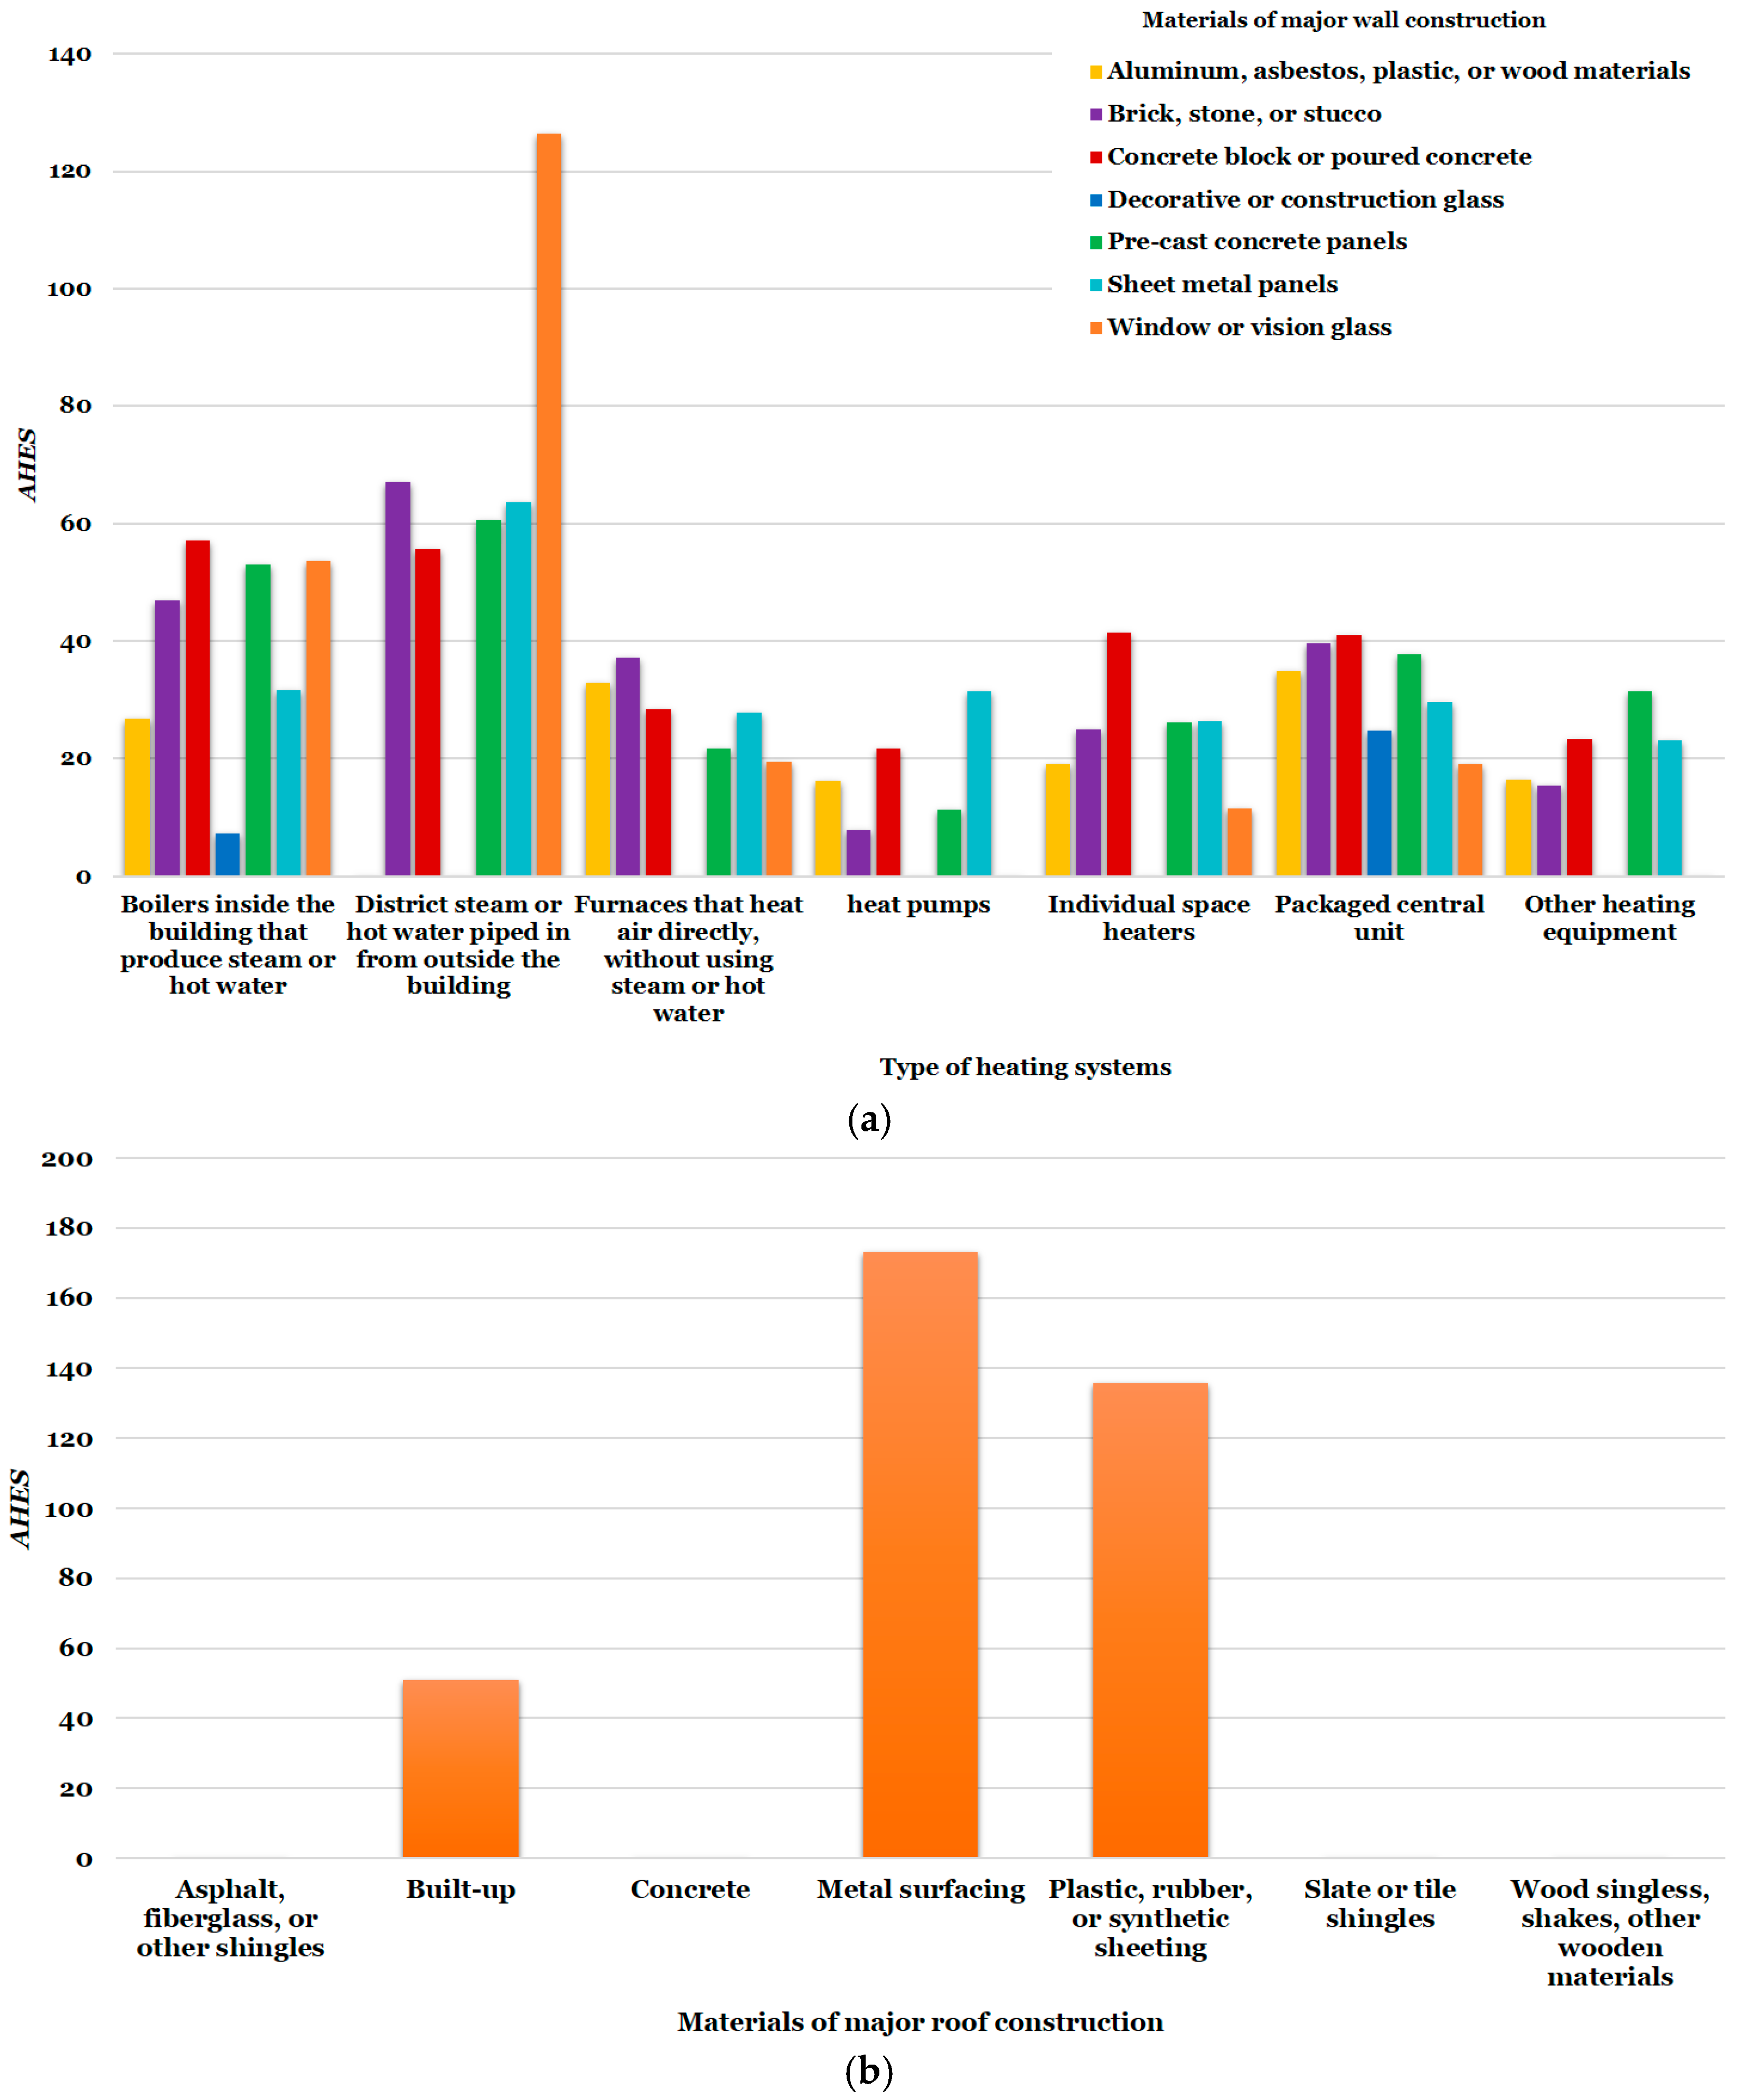
Figure 8a indicates the AHES values for different heating systems and materials of major wall construction in terms of three-dimension perspectives. Figure 8a shows that the buildings using “district steam or hot water piped in from outside the building” had a higher energy use for heating than others regardless of the material of the major wall construction. In particular, buildings using both “district steam or hot water piped in from outside the building” and “window or vision glass”, simultaneously, consumed the highest AHES. In other words, the use of “district steam or hot water piped in from outside the building” as a type of heating system and “window or vision glass” as the wall construction material are not recommended when designing a building in very-cold/cold climate regions. We then conducted drill-down and dice operations on building feature dimension to perform more detailed analysis in relation to roof materials in addition to heating system types and wall materials.
Figure 8b presents that the buildings with specific energy consumption factors used only “built-up”, “metal surfacing”, or “plastic, rubber, or synthetic sheeting” as the major roof construction material and no cases were recorded as having other roof materials. Buildings with “metal surfacing” as the roof material tended to show more energy consumption than buildings with other roofing materials; that is to say, the combination consisting of factors such as “district steam or hot water piped in from outside the building” as the heating system, “window or vision glass” as the wall material, and “metal surfacing” as the roof material was marked as having a low energy efficiency for heating. Therefore, this combination is not recommended when designing a commercial building in very-cold/cold climate regions.
In Scenario I, we analyzed the factors that affected the heating energy efficiency in very-cold/cold climate regions by using OLAP operations with various levels of abstraction. To sum up, we conducted the drill-down and dice operations on the building operations dimension to understand which heating systems significantly affected the overall building energy efficiency. Thus, to perform a detailed heating energy efficiency analysis, we drilled down from the envelope system-level to the material-level for walls in the building feature dimension and diced for each heating system. As a result, we observed that most of the buildings which used both “district steam or hot water piped in from outside the building” as the heating system and “window or vision glass” as the wall material had higher overall AHES values. Furthermore, we derived the fact that it became the lowest energy-efficient combination when adding “metal surfacing” with the combination above-mentioned.

3.1.2. Scenario II: Analysis on Cooling Energy Influencing Factors in Hot-Dry/Mixed-Dry/Hot-Humid Climate Zones

Scenario II analyzed the factors that affect the cooling energy efficiency in hot-dry/mixed-dry/hot-humid (hereafter referred to hot-dry) climate regions. As seen in Figure 5b, the ACES of buildings located in hot-dry climate zones showed the highest value, thus, the focus was placed upon these climate zones. In terms of the cooling energy driving factor analysis, a system manager can perform OLAP operations with varying levels of abstraction. In this scenario, we looked at it from the window glass in building feature dimension. In 
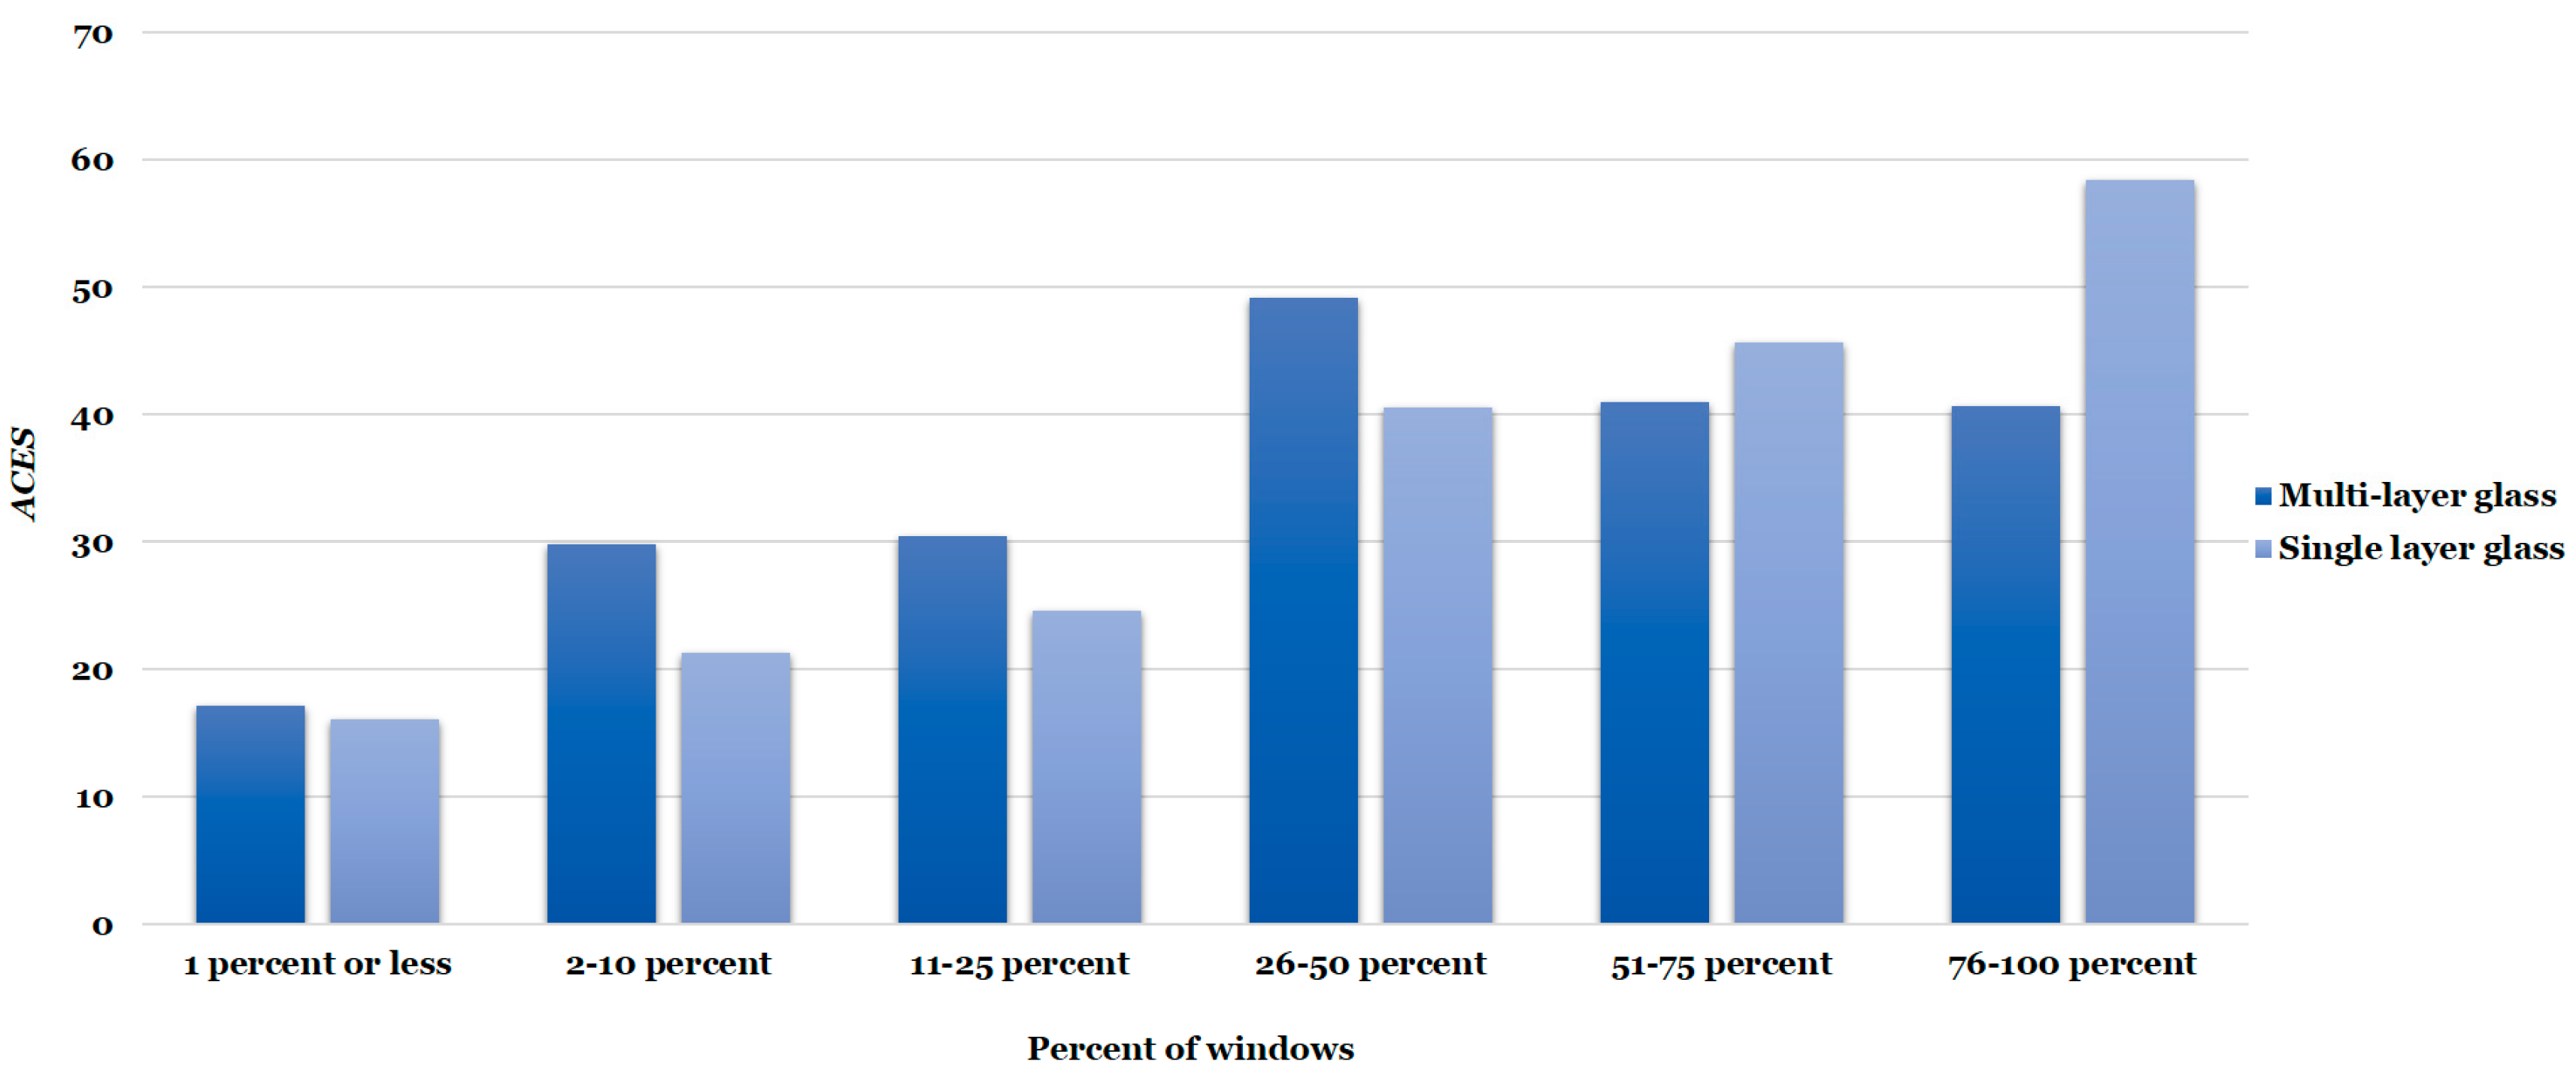
Figure 9, we observed that, in the case of “single layer glass”, generally, the higher the percentage of window, the more the cooling energy tends to be consumed in hot-dry climate zones. In other words, it is more effective to reduce the ratio of windows to improve cooling energy efficiency in buildings using “single layer glass”. However, “single layer glass” is proportional to the ratio of the window glass to the cooling energy consumption, while “multi-layer glass” represents a slightly different pattern. Additionally, when compared to “single layer glass”, the ACES value of “multi-layer glass” was higher than that of “single layer glass” when the percentage of windows was 50% or less. In particular, the ACES was highest in buildings with “26–50%” and “multi-layer glass”.
Common sense tells us that the cooling energy efficiency of the buildings using “multi-layer glass” should be better than that of the buildings with “single layer glass”. It can be inferred from this phenomenon that there are other factors that affect the cooling energy efficiency such as major wall and/or roof construction materials. To perform a detailed cooling energy efficiency determining factors analysis, we introduced an additional viewpoint for seeking other materials by performing a dice operation, focused on both the wall and roof materials, satisfying both “multi-layer glass” and “26–50%” as the target window glass features. In Figure 10, we observed that buildings using “sheet metal panels” as the wall materials and “plastic, rubber, or synthetic sheeting” as the roof material had the highest ACES value; that is to say, the combination consisting of the above factors had low energy efficiency for cooling. Therefore, such factors together in this combination are not recommended for use when constructing a commercial building in hot-dry climate regions. Note that this graph focused on the ACES of the buildings using “multi-layer glass” and “26–50%” as the window glass features in addition to the major wall and roof construction materials.
Scenario II described the process used to identify which factors or combinations of those factors affected the cooling energy efficiency in hot-dry climate zones by using an OLAP operation with various levels of abstraction. In summary, we performed drill-down and dice operations on building feature dimension to understand changes in cooling energy efficiency in relation to window glass features such as window type and window coverage percentage. As a result, the use of “single layer glass” in buildings turned out to be more energy efficient for cooling when combined with a low window glass coverage ratio. However, if the window glass percentage increased, the use of “multi-layer glass” was a way to improve energy efficiency. Thus, to conduct a detailed analysis, we focused on “multi-layer glass” and “26–50%” as window features and performed the dice operation on both the wall and roof materials. By applying this operation, we observed that the combination of “multi-layer glass” as the type of window glass, “26–50%” as the ratio of window, “sheet metal panels” as the wall material, and “plastic, rubber, or synthetic sheeting” as the roof materials showed the lowest energy efficiency for cooling.
In this section, we constructed the data cube model to perform multidimensional analysis in combination with various levels of abstraction with OLAP operations. This was a new way to find meaningful results and to improve the energy efficiency determining factors for buildings with these specific conditions. As representative examples of analysis, we focused on specific climate regions such as very-cold/cold and hot-dry. Thereafter, we analyzed the AHES and ACES for chosen building features and building operation dimensions including major wall and roof construction materials, type of window glass, percentage of window, and type of heating/cooling systems. The proposed data cube model was able to analyze AHES and ACES in multidimensional viewpoints, and provided a useful tool to discover sometimes unexpected facts. However, the proposed system has limitations in analyzing the relationships that potentially exist among a variety of building factors. In addition, it is difficult for a system manager to establish the complete rules for deriving energy efficient combinations. To address these challenges, the association rule mining method was applied to derive meaningful rules and provide useful knowledge in the form of rules, which could possibly represent various sets of energy efficiency combinations.

3.2. Building Energy Analysis Results Based on Association Rule Mining

In this section, based on the results of the multidimensional analysis described in the previous section, we derive a set of useful rules in building feature and operation perspectives. This process works with the application of association rule mining to establish the combination of building factors such as material and type for each envelope component, and the heating/cooling systems that affect energy efficiency in a building. That is to say, these association rules were derived to extract frequent and meaningful correlations between various factors in buildings and energy efficiency that could not be analyzed with a multidimensional data cube.
Since the association rule mining was applied to the categorical data (energy consumption data in our study) in numeric form, our sample datasets needed to be transformed into categorical data before performing this method [34]. Therefore, prior to the experiment, the energy consumption was divided into 10 steps. The grade was divided by 10% of the energy consumption rank for heating and cooling in very-cold/cold and hot-dry climate regions. For example, 1-level was the top 10% of the lowest energy consumption for heating and cooling in very-cold/cold and hot-dry climate regions, respectively. In other words, the rules extracted using association rule mining were in the form of {[wall material|roof material|type of window glass|percentage of window|heating or cooling system]} → {[the grade of energy consumption for heating or cooling]}. Table 3 and Table 4 present samples of the obtained association rules (ordered by lift) in very-cold/cold and hot-dry climate regions, respectively. By looking at each rule, the results showed the amount of average energy consumption (AHES/ACES) when there was a combination of specific material, type of envelope components, and the heating/cooling system in the buildings.
In Table 3, if the buildings located in very-cold/cold climate zones had “multi-layer glass (type of window glass)”, “26–50% (percentage of window)” and “boiler inside the building that produces steam or hot water (heating system)”, the grade of AHES was 1-level (refer to Rule No. 1). This meant that the buildings consisting of such materials and equipment systems consumed less energy for heating. Compared with the multidimensional analysis using OLAP, each material, envelope type, and heating system are energy efficiency determining factors in very-cold/cold climate regions. On the other hand, in Rule No. 3, the buildings with “brick, stone, or stucco (wall)”, “26–50% (percentage of window)”, and “packaged central unit (heating system)” were marked at 8-level of the energy consumption grade. Hence, this combination was not energy-efficient for heating in very-cold/cold climate zones. Similarly, the other rules could be analyzed as aforementioned.
The rules for hot-dry climate regions are shown in Table 4. Rule No. 1 depicts that the grade of ACES for buildings with “pre-cast concrete panels (wall)”, “single layer glass (type of window glass)”, “1% or less (percentage of window)”, and “packaged air conditioning units (cooling system)” was 1-level. Even if “single layer glass (type of window glass)” was used, the grade of ACES was lowered by “26–50% (percentage of window)” and “residential-TYPE central air conditioners without using chiller water (cooling system)”, as seen in Rule No. 2. In addition, Rule No. 5 showed that a combination of factors with less energy efficiency such as “plastic, rubber, or synthetic sheeting (roof)”, “combination of single and multi-layer glass (type of window glass)”, and “central chillers inside the building that chill water for air conditioning (cooling system)” had a lower grade of energy efficiency. Compared with the results of the multidimensional analysis, most combinations of the factors that had less energy efficiency turned out to be less energy-efficient.
In fact, by studying the relationships of building energy related parameters (construction materials, types of envelope, and equipment systems in this research) with the association rules obtained from the vast amount of data, it would be possible to effectively see a variety of other potential combinations of building factors such as lighting system and activities in the buildings. Further studies looking into the underlying reasons for these associations are needed to derive more detailed and reliable combinations considering all influential factors.

3.3. Discussion

The proposed system in this research had two main objectives: (1) to organize the datasets to identify energy consumption profiles in buildings so that it could be depicted and visualized by OLAP operations according to a variety of factors such as building feature, building operation, climate zone and so on; and (2) to derive the rules for energy efficiency enhancing combinations in buildings by utilizing association rule mining. Therefore, the primary goal of this system was to provide decision-makers (or system managers) with the ability to improve the building energy efficiency and to obtain a better understanding of the building components that may have the biggest chances for energy-saving. Note that the proposed system was motivated from the lack of an efficient building energy analysis model to help the administrators (such as building designers and architects) effectively make a decision from multiple choices at the initial stage of building design. Even though the proposed system is a unique data-driven system, it is difficult to declare its own effects since this prototype system has yet to be verified in the field. Consequently, the efficiency of the proposed system needs to be proven through an actual trial; furthermore, the functions of this system could be enhanced and fitted into any situation. To implement an in-depth and detailed analysis of the factors affecting building energy consumption, more diversified building characteristics should be considered in addition to the variables selected from the building datasets used in this study. Especially, as shown in Figure 6, it would support more precise analysis if both the type of heating system and the number of installation instances and capacities were considered. The best case would be to perform analysis with all known properties of the buildings, accurately. However, in the real world, there are always limitations in the gathering and measuring of all the variables and properties that impact on building energy consumption. Therefore, in this study, we intended to obtain a promising insight into building energy consumption profiling based on the CBECS dataset that was built by systematically surveying and measuring commercial buildings across the entire U.S. boundary. At least, we believe that the proposed system can be a supplementary tool for decision makers to establish suitable strategies in energy saving based on data driven building energy analysis sessions. In fact, the system itself will not provide an answer on the best control measures used in the processes to explain the observed and predicted energy saving. Nevertheless, it should provide clues to guide further research providing valuable and unknown information about the development of appropriate design strategies influencing energy saving in buildings. Thus, additionally collaborative research with eco-friendly building designers and architects will be required for the construction of an advanced energy sensitive building design support system in the future.

4. Conclusions

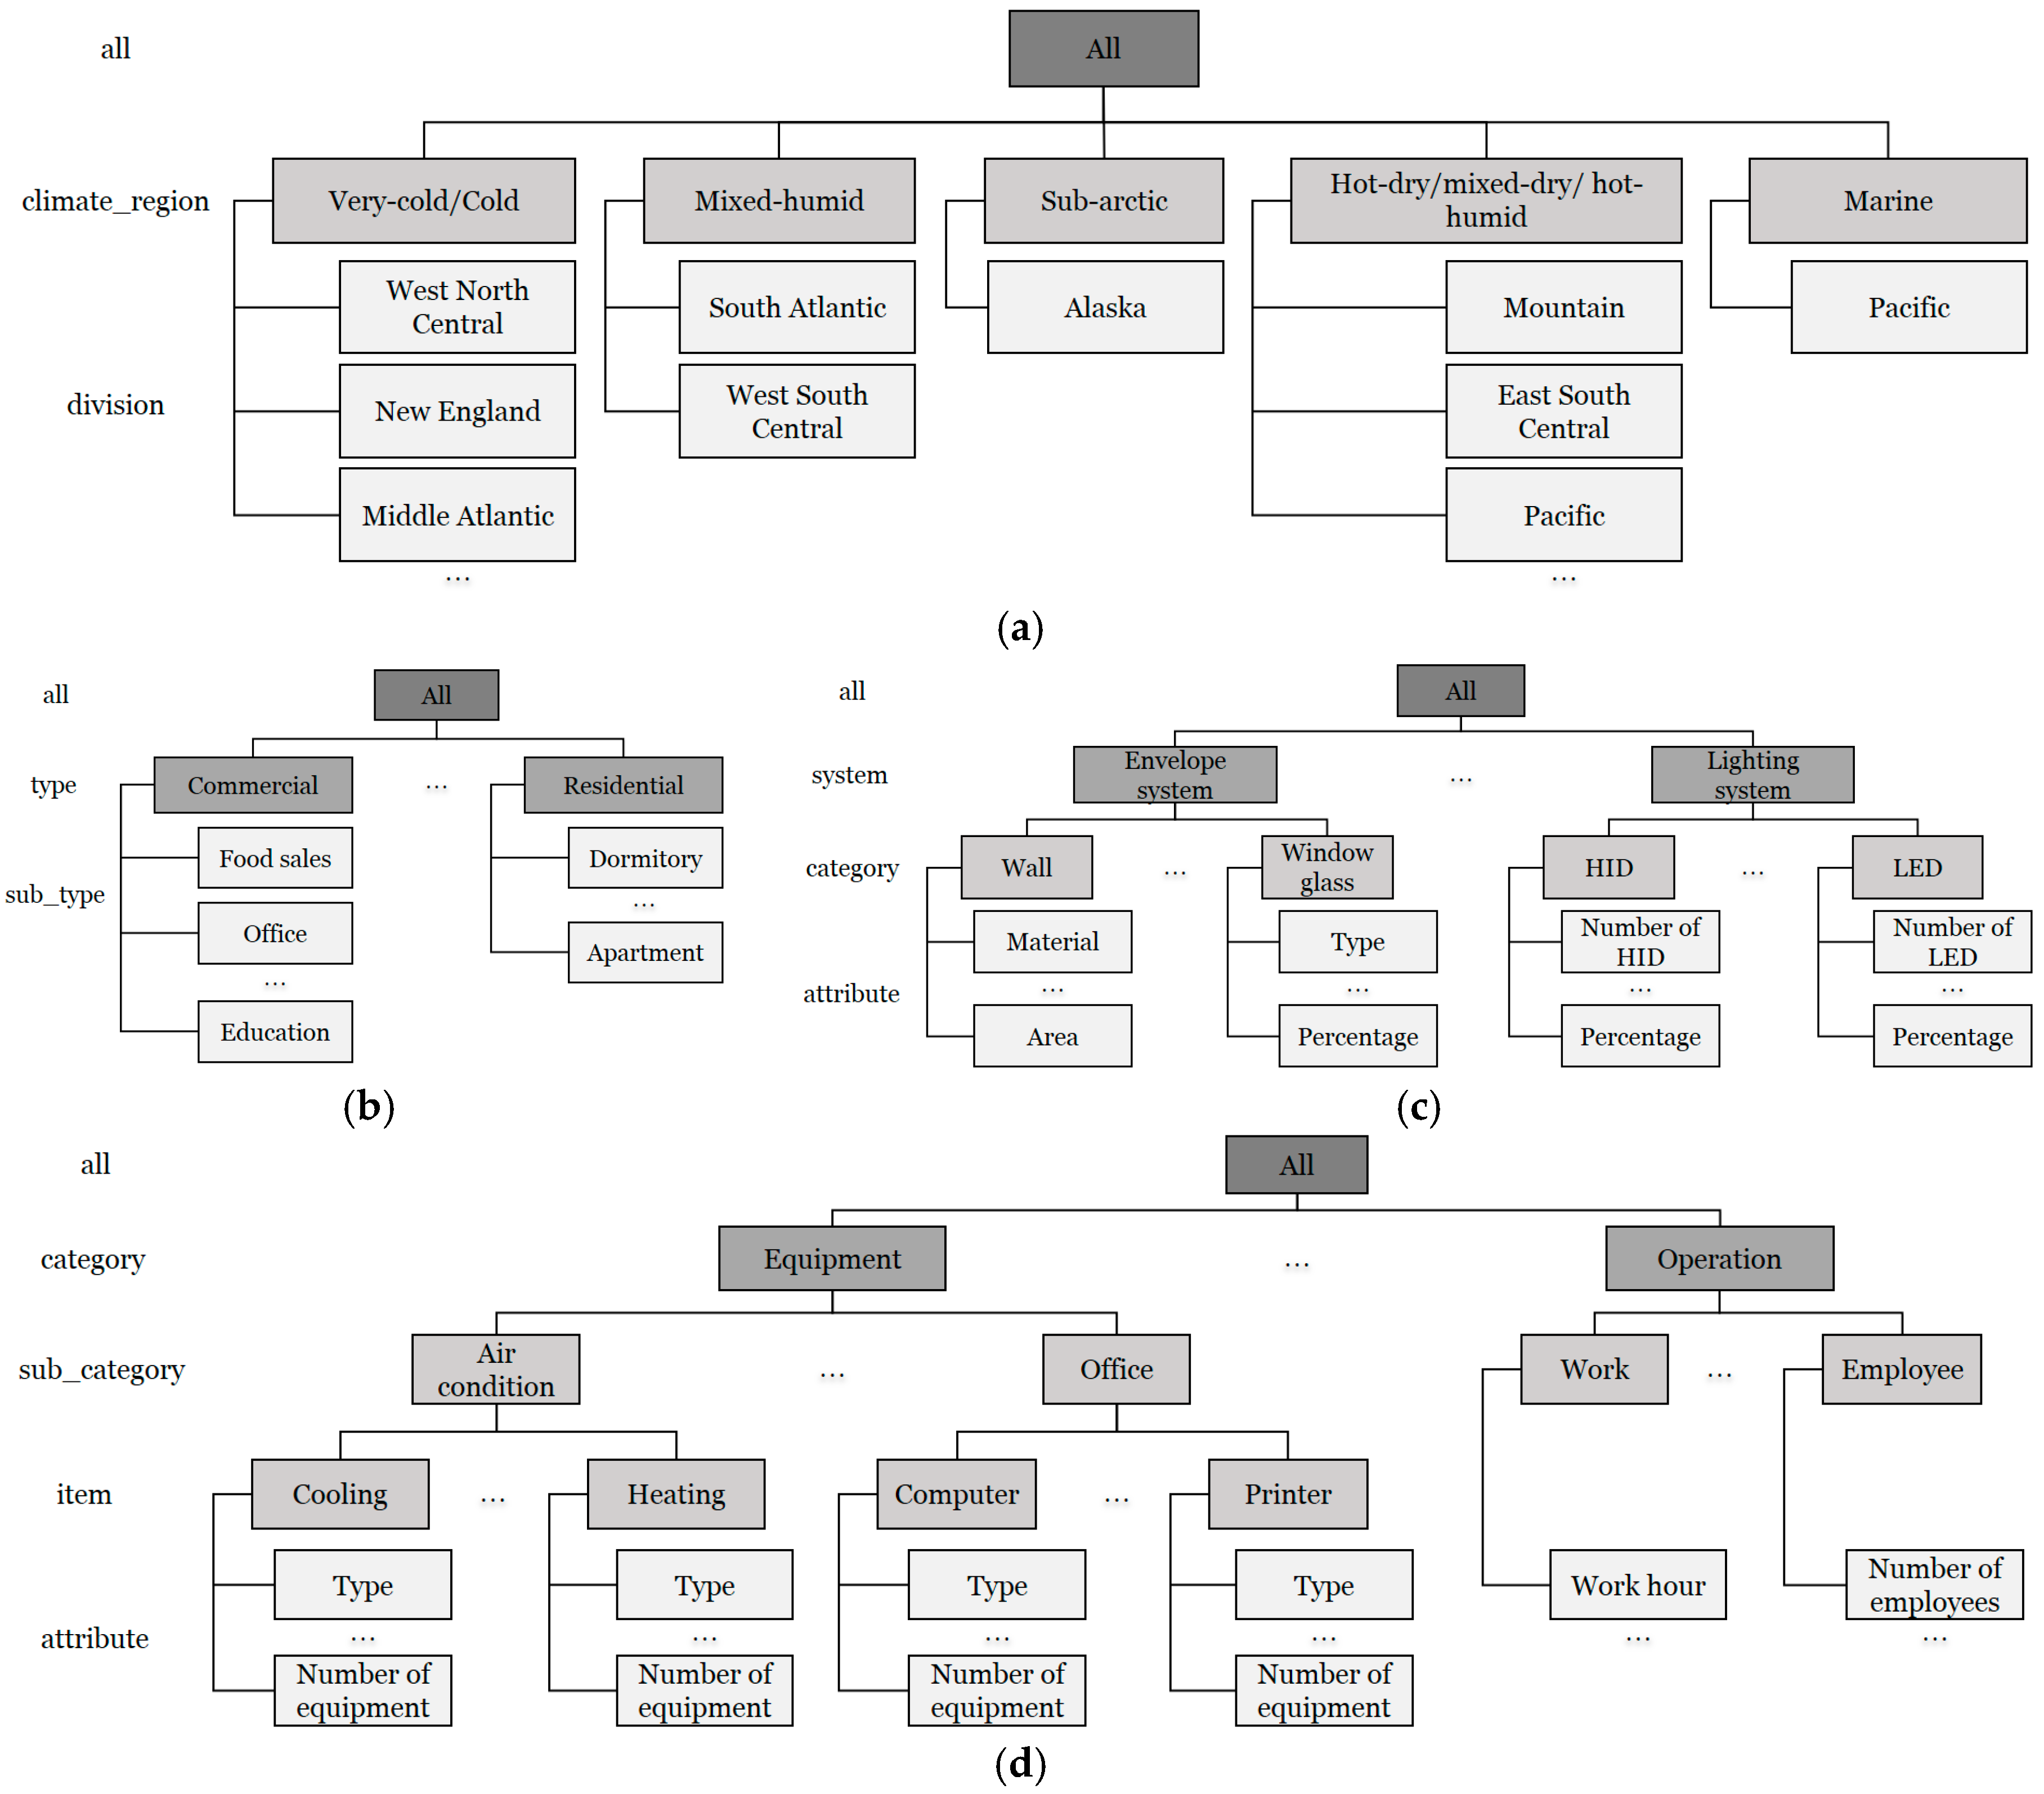
In this study, we proposed a new evaluative methodology for the analysis of influencing factors that affect energy efficiency derived from selected commercial buildings in the U.S. by utilizing the CBECS dataset. The CBECS dataset built by U.S. EIA includes factual information about different building attributes and energy consumption for 6720 commercial buildings in the U.S. It also contains almost 28 building related features such as climate regions, divisions, materials, heating/cooling system, and so on. In the preprocessing steps, the CBECS dataset was refined by filtering out most of the important features affecting the energy consumption profile in a building. Thus, the records containing missing or noisy values were removed for more precise analysis. As a result, 5134 records and 10 features were used in this study.
The core of the methodology was the construction of a data cube model to handle the vast amount data regarding building variables and energy consumption measurements accumulated in a data warehouse. Multidimensional building energy analysis was performed using the OLAP operations, varying the levels of abstraction according to the dimensions of building features, building operation, and climate regions. The proposed analysis model elicited the useful pieces of information that revealed the advantageous and disadvantageous combinations of materials and types for the studied buildings was dependent on the climate conditions and modes of energy consumption (heating or cooling) by applying association rule mining. We confirmed the feasibility and applicability of the proposed analysis model by implementing it using the R tools; and then applied it to the analysis of the building energy consumption pattern identification in the U.S. To conclude, our research results provide a useful knowledge acquisition method that can help decision makers identify the critical building factors that could potentially increase energy efficiency so that eco-friendly and energy-saving buildings can be designed without heavy computer simulations with a specific set of conditions. Further validation and refinement of the proposed system is required and that certainly will be a part of our ongoing research.

Acknowledgments

This work was supported by Grant No. N11170058 from EEWS Research Project of the KAIST EEWS Research Center (EEWS: Energy, Environment, Water and Sustainability). This work is also financially supported by Korea Ministry of Land, Infrastructure and Transport (MOLIT) as “U-City Master and Doctor Course Grant Program”.

Author Contributions

Byeongjoon Noh and Juntae Son conceived and designed the experiments; Hansaem Park conducted the preprocessing; Byeongjoon Noh and Seongju Chang selected and analyzed the datasets; Byeongjoon Noh and Juntae Son implemented the analysis system; and Byeongjoon Noh, Juntae Son, and Seongju Chang wrote the paper.

Conflicts of Interest

The authors declare no conflicts of interests.

References

  1. Amasyali, K.; El-Gohary, N.M. Energy-related values and satisfaction levels of residential and office building occupants. Build. Environ. 2016, 95, 251–263. [Google Scholar] [CrossRef]
  2. Suh, D.; Chang, S. A heuristic rule-based passive design decision model for reducing heating energy consumption of Korean apartment buildings. Energies 2014, 7, 6897–6929. [Google Scholar] [CrossRef]
  3. Korkas, C.D.; Baldi, S.; Michalilidis, I.; Kosmatopoulos, E.B. Intelligent energy and thermal comfort management in grid-connected microgrids with heterogeneous occupancy schedule. Appl. Energy 2015, 149, 194–203. [Google Scholar] [CrossRef]
  4. Barnes, E.; Parrish, K. Small buildings, big impacts: The role of small commercial building energy efficiency case studies in 2030 Districts. Sustain. Cities Soc. 2016, 27, 210–221. [Google Scholar] [CrossRef]
  5. Harish, V.; Kumar, A. A review on modeling and simulation of building energy systems. Renew. Sustain. Energy Rev. 2016, 56, 1272–1292. [Google Scholar] [CrossRef]
  6. Hirano, Y.; Gomi, K.; Nakamura, S.; Yoshida, Y. Analysis of the impact of regional temperature pattern on the energy consumption in the commercial sector in Japan. Energy Build. 2017, 149, 160–170. [Google Scholar] [CrossRef]
  7. Daut, M.A.M.; Hassan, M.Y.; Abdullah, H. Building electrical energy consumption forecasting analysis using conventional and artificial intelligence methods: A review. Renew. Sustain. Energy Rev. 2017, 70, 1108–1118. [Google Scholar] [CrossRef]
  8. Chae, Y.T.; Horesh, R.; Hwang, Y.; Lee, Y.M. Artificial neural network model for forecasting sub-hourly electricity usage in commercial buildings. Energy Build. 2016, 111, 184–194. [Google Scholar] [CrossRef]
  9. Lei, J.; Yang, J.; Yang, E.H. Energy performance of building envelopes integrated with phase change materials for cooling load reduction in tropical Singapore. Appl. Energy 2016, 162, 207–217. [Google Scholar] [CrossRef]
  10. Mathew, P.A.; Dunn, L.N.; Sohn, M.D. Big-data for building energy performance: Lessons from assembling a very large national database of building energy use. Appl. Energy 2015, 140, 85–93. [Google Scholar] [CrossRef]
  11. U.S. Energy Information Administration. Available online: www.eia.gov/consumption/commercial/data/2003/ (accessed on 21 September 2017).
  12. Jin, H.Y.; Choi, B.H.; Kang, J.K.; Kim, S.I. Measurement and Normalization Methods to Provide Detailed Information on Energy Consumption by Usage in Apartment Buildings. Energy Procedia 2016, 96, 881–894. [Google Scholar] [CrossRef]
  13. Kahn, M.E.; Kok, N.; Quigley, J.M. Carbon emissions from the commercial building sector: The role of climate, quality, and incentives. J. Public Econ. 2014, 113, 1–12. [Google Scholar] [CrossRef]
  14. Arroyo, M.M. A Look at Commercial Building Energy Use and Energy Efficiency Technologies from 1980 to Present. Bachelor’s Thesis, University of Arkansas, Fayetteville, NC, USA, 2015. [Google Scholar]
  15. Jeon, B.S.; Horton, W.T. HVAC Solutions for Small- and Medium-sized Commercial Building Retrofit Opportunities. 2016. Available online: http://docs.lib.purdue.edu/ihpbc/215/ (accessed on 16 November 2017).
  16. Sakthivel, N.R.; Nair, B.B.; Elangovan, M. Comparison of dimensionality reduction techniques for the fault diagnosis of mono block centrifugal pump using vibration signals. Eng. Sci. Technol. 2014, 17, 30–38. [Google Scholar] [CrossRef]
  17. Wimmer, H.; Powell, L. Principle Component Analysis for Feature Reduction and Data Preprocessing in Data Science. In Proceedings of the Conference on Information Systems Applied Research, Las Vegas, NV, USA, 6–9 November 2016. [Google Scholar]
  18. Han, J.; Kamber, M.; Pei, J. Data Mining: Concepts and Techniques, 3rd ed.; Morgan Kaufmann Publishers: Burlington, MA, USA, 2012; ISBN 978-0-12-381479-1. [Google Scholar]
  19. Bastardie, F.; Nielsen, J.R.; Andersen, B.S.; Eigaard, O.R. Integrating individual trip planning in energy efficiency–Building decision tree models for Danish fisheries. Fish. Res. 2013, 143, 119–130. [Google Scholar] [CrossRef]
  20. Guo, W.; Page, U.K.; Ninomiya, S. Illumination invariant segmentation of vegetation for time series wheat images based on decision tree model. Comput. Electron. Agric. 2013, 96, 58–66. [Google Scholar] [CrossRef]
  21. Fan, C.; Xiao, F.; Zhao, Y. A short-term building cooling load prediction method using deep learning algorithms. Appl. Energy 2017, 195, 222–233. [Google Scholar] [CrossRef]
  22. Hssina, B.; Merbouha, A.; Ezzikouri, H. A comparative study of decision tree ID3 and C4. 5. Int. J. Adv. Comput. Sci. Appl. 2014, 4, 13–19. [Google Scholar]
  23. Kuhn, M.; Weston, S.; Coulter, N.; Kuhn, M. Package ‘C50’. 2015. Available online: http://www.gtlib.gatech.edu/pub/CRAN/web/packages/C50/C50.pdf (accessed on 16 November 2017).
  24. Varshney, A.; Metkewar, P. Literature Review of Issues in Data Warehousing and OLTP, OLAP Technology. Imp. J. Interdiscip. Res. 2016, 2, 699–702. [Google Scholar]
  25. Boutkhoum, O.; Hanine, M. An integrated decision-making prototype based on OLAP systems and multicriteria analysis for complex decision-making problems. Appl. Inform. 2017, 4, 11. [Google Scholar] [CrossRef]
  26. Jeon, Y.; Cho, C.; Seo, J.; Kwon, K.; Park, H.; Chung, I. Rule-Based Topic Trend Analysis by Using Data Mining Techniques. In Advanced Multimedia and Ubiquitous Engineering; Springer: Singapore, 2017; pp. 466–473. [Google Scholar]
  27. Zhu, J.; Potti, N.; Sauraph, S.; Patel, J. Looking ahead makes query plans robust: Making the initial case with in-memory star schema data warehouse workloads. Proc. VLDB Endow. 2017, 10, 889–900. [Google Scholar] [CrossRef]
  28. Schymik, G.; Corral, K.; Schuff, D. Architecting a Dimensional Document Warehouse. In Proceedings of the 40th Annual Hawaii International Conference on System Sciences, Waikoloa, HI, USA, 3–6 January 2007. [Google Scholar]
  29. Xu, Z.; Lee, J.; Park, D.; Chung, Y. Multidimensional analysis model for highly pathogenic avian influenza using data cube and data mining techniques. Biosyst. Eng. 2017, 157, 109–121. [Google Scholar] [CrossRef]
  30. Faridi, M.; Verma, S.; Mukherjee, S. An Agricultural Intelligence Decision Support System: Reclamation of Wastelands Using Weighted Fuzzy Spatial Association Rule Mining. In Proceedings of the International Conference on Information and Communication Technology for Intelligent Systems, Ahmedabad, India, 25–26 March 2017; Springer: Cham, Switzerland, 2017. [Google Scholar]
  31. Verma, A.; Khan, S.D.; Maiti, J.; Krishna, O.B. Identifying patterns of safety related incidents in a steel plant using association rule mining of incident investigation reports. Saf. Sci. 2014, 70, 89–98. [Google Scholar] [CrossRef]
  32. Lee, C.; Song, B.; Park, Y. Design of convergent product concepts based on functionality: An association rule mining and decision tree approach. Expert Syst. Appl. 2012, 39, 9534–9542. [Google Scholar] [CrossRef]
  33. Arules: Mining Association Rules and Frequent Itemsets. Available online: https://cran.r-project.org/web/packages/arules/index.html (accessed on 9 September 2017).
  34. Xiao, F.; Fan, C. Data mining in building automation system for improving building operational performance. Energy Build. 2014, 75, 109–118. [Google Scholar] [CrossRef]
Figure 1. Overall architecture of the proposed energy analysis system.
Sustainability 09 02119 g001
Figure 2. Map of the United States of America for climate zones.
Sustainability 09 02119 g002
Figure 3. Star schema for the proposed data cube model.
Sustainability 09 02119 g003
Figure 4. Concept hierarchies of building: (a) climate region; (b) activity; (c) feature; and (d) operation dimensions.
Sustainability 09 02119 g004
Figure 5. (a) AHES; and (b) ACES in different climate regions.
Sustainability 09 02119 g005
Figure 6. AHES with different heating system types in very-cold/cold climate regions.
Sustainability 09 02119 g006
Figure 7. Sum of heating energy according to type of heating system in very-cold/cold climate zones.
Sustainability 09 02119 g007
Figure 8. (a) AHES based on the type of heating systems and wall materials in very-cold/cold climate regions; and (b) AHES based on the wall materials in combination with “window or vision glass” and “district steam or hot water piped in from outside the building” in very-cold/cold climate regions.
Sustainability 09 02119 g008
Figure 9. ACES based on the type of percentage of window glass in hot-dry climate regions.
Sustainability 09 02119 g009
Figure 10. ACES based on various wall and roof materials combined with “multi-layer glass” and “26–50%” window features in hot-dry climate regions.
Sustainability 09 02119 g010
Table 1. Description of climate zones in the U.S.A. [11].
Climate ZonesExplanation
Hot-dry/mixed-dry/hot-humidHot-dry is defined as regions
  • Receiving less than 50 cm of annual precipitation; and
  • Remaining above 7 °C monthly average outdoor temperature throughout the year
Mixed-dry is defined as regions
  • Receiving less than 50 cm of annual precipitation; and
  • Having approximately 5400 heating degree days or less; and
  • Remaining above 7 °C monthly average outdoor temperature during the winter months
Hot-humid is defined as regions
  • Receiving more than 50 cm of annual precipitation; and
  • 19.5 °C or higher wet bulb temperature for 3000 or more hours during the warmest six consecutive months of the year; or
  • 23 °C or higher wet bulb temperature for 1500 or more hours during the warmest six consecutive months of the year
Mixed-humidDefined as regions that
  • Receiving more than 50 cm of annual precipitation; and
  • Having approximately 5400 heating degree days or fewer; and
  • Having average monthly outdoor temperature drops below 7 °C during winter months.
Very-cold/coldVery-cold is defined as regions
  • Having between 9000 and 12,600 heating degree days
Cold is defined as regions
  • Cold: having between 5400 and 9000 heating degree days
MarineDefined as regions
  • A coldest month mean temperature of −3 to 18 °C; and
  • A warmest month mean of less than 22 °C; and
  • At least months with mean temperatures higher than 10 °C
SubarcticDefined as regions that
  • 12,600 heating degree days or more (only Alaska in the U.S.)
Table 2. The selected features and descriptions (except features marked as (X)).
VariableDescriptionValue
PUBCLIMBuilding America climate region
  • Very-cold/Cold
  • Mixed-humid
  • Hot-dry/Mixed-dry/Hot-humid
  • Marine
  • Subarctic (X)
  • Withheld to protect confidentiality (X)
CENDIVCensus division
  • New England
  • Middle Atlantic
  • East North Central
  • West North Central
  • South Atlantic
  • East South Central
  • West South Central
  • Mountain
  • Pacific
WLCNSMajor wall construction material
  • Brick, stone, or stucco
  • Pre-cast concrete panels
  • Concrete block or poured concrete (above grade)
  • Aluminum, asbestos, plastic, or wood materials (siding, shingles, tiles, or shakes)
  • Sheet metal panels
  • Window or vision glass (glass that can be seen through)
  • Decorative or construction glass
  • No one major type
RFCNSRoof construction material
  • Built-up (tar, felts, or fiberglass and a ballast, such as stone)
  • Slate or tile shingles
  • Wood shingles, shakes, or other wooden materials
  • Asphalt, fiberglass, or other shingles
  • Metal surfacing
  • Plastic, rubber, or synthetic sheeting(single or multiple ply)
  • Concrete (X)
  • No one major type (X)
  • Other (X)
WINTYPWindow glass type
  • Single layer glass
  • Multi-layer glass
  • Combination of both (X)
  • No windows (X)
GLASSPCPercent exterior glass
  • 1% or less
  • 2–10%
  • 11–25%
  • 26–50%
  • 51–75%
  • 76–100%
MAINHTMain heating equipment
  • Furnaces that heat air directly, without using steam or hot water
  • Packaged central unit (roof mounted)
  • Boilers inside (or adjacent to) the building that produce steam or hot water
  • District steam or hot water piped in from outside the building
  • Heat pumps (other than components of a packaged unit)
  • Individual space heaters (other than heat pumps)
  • Other heating equipment
  • Not applicable (X)
MAINCLMain cooling equipment
  • Residential-type central air conditioners (other than heat pumps) that cool air directly and circulate it without using chilled water
  • Packaged air conditioning units (other than heat pumps)
  • Central chillers inside (or adjacent to) the building that chill water for air conditioning
  • District chilled water piped in from outside the building
  • Heat pumps for cooling
  • Individual room air conditioners (other than heat pumps)
  • Swamp coolers or evaporative coolers
  • Other cooling equipment
  • Not applicable (X)
PBAPrincipal building activity
  • Vacant
  • Office
  • Laboratory
  • Non-refrigerated warehouse
  • Food sales
  • Public order and safety
  • Outpatient health care
  • Refrigerated warehouse
  • Religious worship
  • Public assembly
  • Education
  • Food service
  • Inpatient health care
  • Nursing
  • Lodging
  • Strip shopping mall
  • Enclosed mall
  • Retail other than mall
  • Service
  • Other
SQFTSquare footage
  • 1001–1,500,000
Table 3. Rules for energy-grade for heating in very-cold/cold climate regions.
Rule No.RulesLift
Left Hand SideRight Hand Side
1{Multi-layer glass (type of window glass)|26–50% (percentage of window)|Boilers inside the building that produce steam or hot water (heating system)} {2-LEVEL}4.74
2{Plastic, rubber, or synthetic sheeting (roof)|Multi-layer glass (type of window glass)|Boilers inside the building that produce steam or hot water (heating system)} {1-LEVEL}3.51
3{Brick, stone, or stucco (wall)|2650% (percentage of window)|Packaged central unit (heating system)} {8-LEVEL}3.13
4{Concrete block or poured concrete (wall)|Plastic, rubber, or synthetic sheeting (roof)|Multi-layer glass (type of window glass)} {5-LEVEL}2.70
5{Brick, stone, or stucco (wall)|Plastic, rubber, or synthetic sheeting (roof)|Multi-layer glass (type of window glass)|Packaged central unit (heating system)} {10-LEVEL}2.54
Table 4. Rules for energy-grade for cooling in hot-dry climate regions.
Rule No.RulesLift
Left Hand SideRight Hand Side
1{Pre-cast concrete panels (wall)|Single layer glass (type of window glass)|1% or less (percentage of window)|Packaged air conditioning units (cooling system)} {1-LEVEL}6.37
2{Single layer glass (type of window glass)|26–50% (percentage of window)|Residential-TYPE central air conditioners without using chill water (cooling system)} {10-LEVEL}5.40
3{Plastic, rubber, or synthetic sheeting (roof)|Combination of single and multi-layer glass (type of window glass)|Central chillers inside the building that chill water for air conditioning (cooling system)} {10-LEVEL}5.01
4{Sheet metal panels (wall)|Metal surfacing (roof)|1% or less (percentage of window)|Residential-TYPE central air conditioners without using chill water (cooling system)} {2-LEVEL}4.52
5{Brick, stone, or stucco (wall)|Plastic, rubber, or synthetic sheeting (roof)|11–25% (percentage of window)|Central chillers inside the building that chill water for air conditioning (cooling system)} {10-LEVEL}4.38

