1. Introduction
The amount of energy consumption and energy consumption structure are two important factors to ensure national energy security and realize sustainable development. China’s economy is entering a new stable phase, and correspondingly, the energy consumption growth rate appears to be slowing, however, the coal-dominated energy consumption structure becomes a prominent issue. The Chinese government proposed in “The 13th Five-Year Plan for Energy Development” (The 13th Five Year Plan, a period during 2016–2020) [
1], that the total energy consumption and energy intensity would be taken as binding indicators of economic and social development. The projected energy intensity (energy consumption per unit of gross domestic production (GDP)) and carbon intensity (carbon emissions per unit of GDP) would reduce by 15% and 18% respectively by 2020, compared with those in 2015. Meanwhile, the share of coal will be less than 58% while the share of non-fossil fuels will increase to 15%, according to “The 13th Five-Year Work Plan for Controlling Greenhouse Gas Emissions” (The 13th GHG Control, a document published by National Development and Reform Commission) [
2]. The government decomposed the national emissions reduction target to the provincial level by dividing the 31 provinces into five categories with different responsibilities. Since the energy consumption amount and energy structure directly determine carbon emissions, this allocation mechanism always is treated as a background for provincial governments to formulate energy saving targets. However, this distribution mechanism takes care of the less developed regions and eases their responsibility for energy-saving, which can inevitably cause efficiency loss. The purpose of this paper is to find an effective way to allocate the energy consumption quota to provinces, and then compare the allocation results with the current administrative allocation plans, to evaluate the effectiveness of the administrative plans and give further policy recommendations.
Many studies focus on allocating distributed energy resources according to their capacity and locations, in terms of energy allocation, rather than taking the problem as a political or economic issue. Some methods have been proposed for energy quota allocation, including indicator, optimization, game theoretic, and hybrid approaches [
3]. Foo et al. presented algebraic targeting techniques via pinch analysis for energy sector planning with carbon emission limitation and land availability constraints [
4]. Jun Chen established an optimal model based on differences in regional energy efficiency to give an empirical analysis about the optimization problem of China’s non-regeneration energy [
5]. Wang et al. developed a hybrid nonlinear grey-prediction and quota allocation model for minimizing the total abatement cost at both departmental and provincial levels in 2020 [
6]. Guo et al. proposed a three-step procedure to equitably and efficiently disaggregate the national energy use cap among provinces [
7]. Jie developed a context-dependent DEA technique, which can characterize the changeable production with reductions of CO
2 emission and energy intensity to allocate the national reduction targets over provincial industrial sectors [
8]. Furthermore, more studies have focused on a relevant resource allocation issue, the allocation of carbon emissions quota by using various allocation strategies including grandfathering method, baseline distribution method, mixed integer programming allocation method [
9], and the ZSG-SBM model [
10]. These studies can be classified at the international [
11,
12], national [
8,
13,
14], and sectoral levels [
15,
16].
The previous researches have provided useful references to construct an energy quota allocation mechanism; however, little literature has discussed the energy quota allocation under total amount constraints, making their allocation methods practically infeasible. Conversely, some methods were posterior allocation based on historical data, making them lack forward-looking guidance. Thus, these methods failed to meet the goal of allocating quota under the total constraints in 2020. Additionally, there lacks a scientific index to evaluate the optimal degree of energy allocation by each method; thus, it is robust to claim one method is more applicable than others.
Data envelopment analysis (DEA) was first proposed by Chames and Cooper [
17] and has been widely applied in the energy and environment fields. DEA is a non-parametrical mathematical programming technique to evaluate the relative efficiencies of a set of decision-making units (DMUs) with multiple inputs and multiple outputs. The traditional DEA models assume complete independence among DMUs, that each decision-making unit can adjust its inputs or outputs without being affected by other DMUs. An input-oriented DEA model assumes that, given the same output, one DMU should reduce its inputs as much as possible to reach the frontier. However, it is hardly practical for every inefficient unit to freely reduce its inputs or outputs. Conversely, China has undergone extensive industrialization and urbanization, and needs a certain level of energy consumption to meet the development demand, making it impossible for every province to set the goal of minimized energy consumption to reach the same frontier. Thus, under the constant total constraints, provinces should cooperate to adjust their energy consumption inputs. A zero sum game-DEA (ZSG-DEA) model was first proposed by Lins et al. [
18] and has gained popularity in the quota allocation field, for example Gomes et al. [
19], Sun et al. [
20], Miao et al. [
21], Wang et al. [
14] and Chiu et al. [
22]. Through their ZSG-DEA allocation models, all DMUs can reach the DEA efficiency frontier and achieve overall Pareto optimality.
Although the existing researches have provided references to allocate resources or carbon emissions by using a ZSG-DEA model, there still exists some deficiencies. First, in terms of variables, most studies put carbon emissions as input or undesirable output [
23,
24]. Nonetheless, carbon emissions are closely linked with the energy structure by different energy coefficients. Thus, when the energy consumption amount of each energy type is unknown, carbon emissions cannot be treated as an independent variable. Additionally, some examples in the literature use energy or emission allowance as inputs, and GDP and population as outputs [
22]. However, such variables cannot reflect the production mechanism, where the efficiency differences are all attributed to the energy inputs. Second, most studies obtained variable data by prediction, using a macro system model, Markov chain analysis, multi-objective decision-making method, scenario analysis, etc. [
3]. However, due to the difficulty of model building and the subjective setting of macro scenarios, the prediction of energy consumption and other variables greatly vary in different literatures, increasing the incredibility of these studies. Third, Lins et al. and Gomes and Lins showed that there exists a linear transformation relationship between the original DEA efficiency and the ZSG-DEA efficiency [
18,
19]. Nonetheless, the equation is inapplicable to the non-controlled inputs or multi-controlled (non-radial) inputs/outputs, as in this case [
25].
Considering the above research deficiencies, this paper builds a weighted ZSG-DEA model to allocate energy consumption quota, with the consideration of provincial capital stock, labor force, economic level, and four types of energy, including coal, oil, natural gas and non-fossil fuels. The contributions of this paper include two parts: first, by the weighted ZSG-DEA model, different types of energy can change with user-specified proportion, reflecting the energy-saving preferences; second, the comparison between results here and the administrative goals provides practical references for governments to adjust the administrative plans to ensure the realization of the national goal in 2020. The rest of this paper is organized as below:
Section 2 presents the materials and methods,
Section 3 presents research results, and
Section 4 shows the discussion and provides some policy recommendations.
2. Materials and Methods
2.1. Methods
The input-oriented CCR-DEA model proposed by Chames and Cooper [
17] has the following formulation
Model (1) shows is the energy efficiency measure of the DMU and is the optimized efficiency value for the DMU; m means the number of input variables and s means the number of output variables; and . are the input and output values of each DMU, and and are the input and output values for the under-evaluating . DMU; is the contribution of each DMU to the efficient projection.
Considering the constraints on variables from freely changing, Lins originally built the radial ZSG-DEA model and proposed two allocation principles, including the equal reduction strategy and the proportional reduction strategy [
18]. The proportional reduction strategy can avoid the negative and zero values and has been widely used in practice. The ZSG-DEA model with the proportional reduction strategy is shown as
Model (2) shows is the output-oriented ZSG-DEA efficiency value of the being evaluated DMU and . and are the inputs and outputs for DMU, respectively. The input and output values for the being-evaluated DMU are and . respectively. The proportional reduction strategy means that the sum of the output must be fixed, so the increase on would lead the other DMUs to proportionally decrease their outputs, and the proportion for DMU(j) is . The contribution of DMU to the efficient projection is ; expresses the convexity restriction, meaning variable returns to scale.
Four types of energy are considered as inputs in this study, and each of them has a constant total amount, but the proportion of change may be different when the specified DMU is evaluated and adjusted. Additionally, due to the differences in source endowment and economic level, it is considered that the application of variable returns to scale setting will be appropriate. The proportional reduction strategy by which the inefficient DMU loses a certain amount of input is adopted; the others must increase that amount of input proportionally to their original values.
This paper built an input-oriented model and put capital stock and labor force as non-energy inputs; coal, oil, natural gas and non-fossil fuels as energy inputs; and GDP as an output. It is noticeable that this paper does not put carbon dioxide as an undesirable output, given that carbon emissions would greatly vary with the adjustment of energy structure. Additionally, the carbon intensity calculated by this model is compared with that proposed by the “The 13th GHG Control”, to analyze the effectiveness and feasibility of the administrative plans. The improved weighted ZSG-DEA model is shown as
is the energy efficiency measure of the DMU and is the weighted efficiency value of the DMU, under the constraint that the sum of the input is a constant value; is the normalized weight of , here, set as 0.58, 0.17, 0.10, and 0.15, respectively, according to the national expected proportion proposed in the “The 13th Five Year Plan”; m means the types of energy and equals 4, denoting coal, oil, natural gas and non-fossil fuels; K and L denote capital stock and labor force, respectively, without the limitation of constant amount; g denotes GDP; and are the original input and output values for the DUM; . and are the original input and output values for the DUM; n is the number of DUMs and equals 30. Due to the inaccessibility of data, Tibet, Hong Kong, Macau, and Taiwan are not included in this study, and all provinces and municipalities are called jointly as provinces in this paper; is the contribution of the DMU to the efficient projection; means variable returns to scale.
2.2. Materials
Table 1 shows the statistic characteristics of the input and output variables.
Capital stock data are estimated using the perpetual inventory method, described in Zhang [
26]. The average growth rate of China's capital stock during the years 2011–2015 is adopted as the growth rate during 2015–2020 to estimate the capital stock of each province in 2020. Since the investment data before 2002 are not directly acquirable, 2002 is set as the base year.
Labor force, represented by the number of permanent population at the end of a year, are calculated via the base data in 2015 plus the predicted increment during “The 13th Five-Year” period. The predicted increment data are obtained from each province’s “The 13th Five Year Plan”.
The data of projected energy consumption in 2020 are obtained by the value in 2015 plus the added value during the 2015–2020 period. The original value in 2015 was acquired from the “Energy Statistical Yearbook”; the added value was proposed in the “13th GHG Control”. Most provinces have put forward the ideal energy proportion, by which the energy consumption of four types can be calculated and applied as the initial input values. Values are extrapolated based on current energy structure in provinces which do not predict their targeted proportions, including Heilongjiang, Jiangxi, Shanxi, Gansu, and Xinjiang. The amounts of each type of energy consumption have been converted to tons of coal equivalent (Tce).
Reginal GDP values in 2020 are based on the GDP in 2015, multiplied by the average annual growth rate in each year during 2015 to 2020, which were predicted by each provincial government in their “The 13th Five Year Plan”.
Carbon emissions in 2020 are calculated by taking the energy consumption quota after optimizing, and multiplying the corresponding carbon emission coefficients, which were provided by the Intergovernmental Panel on Climate Change (IPCC 2006) [
27]. Carbon emissions in 2015 are calculated by the primary energy consumption multiplied by the corresponding carbon emission coefficients. The energy data used were acquired from the energy balance sheets, published in the Energy Statistical Yearbook. Considering the prediction error, the ZSG-DEA results with the administrative targets within an interval are compared, which take 90% and 110% of the administrative targets as upper and lower bounds, respectively.
3. Results
3.1. Energy Efficiency Values
Using MATLAB genetic algorithm programming, the initial energy efficiency of each DMU was calculated and then the adjusted inputs were used to iterate in the model.
Table 2 shows the initial energy efficiencies and the energy efficiencies after each iteration.
The original energy inputs are presupposed based on administrative optimal energy structure goals; thus, the initiative efficiency results reflect the efficiency of the administrative allocation method. The initial average efficiency of 30 provinces is 0.694. The initial energy efficiencies of 30 provinces show remarkable differences. Eight provinces—including Beijing, Tianjin, Shanghai, Jiangsu, Guangdong, Hainan, Qinghai, and Ningxia—are at the frontier of energy efficiency. Xinjiang is the least efficient province, with the efficiency of 0.223. The results suggest the energy efficiency of more developed provinces are higher, generally, than that of less developed provinces, given that the government emphasizes easing the responsibilities of undeveloped regions.
Each iteration shows the energy efficiency of most provinces has gradually improved. Following four iterations, the number of efficient provinces increases to 13 and the average efficiency of 30 provinces is 0.912. The efficiency differences among provinces have considerably narrowed, and the efficiency of Xinjiang, the least efficient province, increases to 0.766.
Compared to the existing ZSG-DEA studies for resource allocation, where all DMUs reach the efficient frontier and achieve the Pareto optimality after several iterations, the results in this paper imply that Pareto optimality has not been realized, resulting from the multi-ZSG variables and the weighted objective function. However, after the fourth iteration, both the average efficiency value and the number of effective DUMs tend to converge, so this paper argues that it has achieved the optimal results.
3.2. Energy Intensity and Carbon Intensity (Comparison with the Administrative Goals)
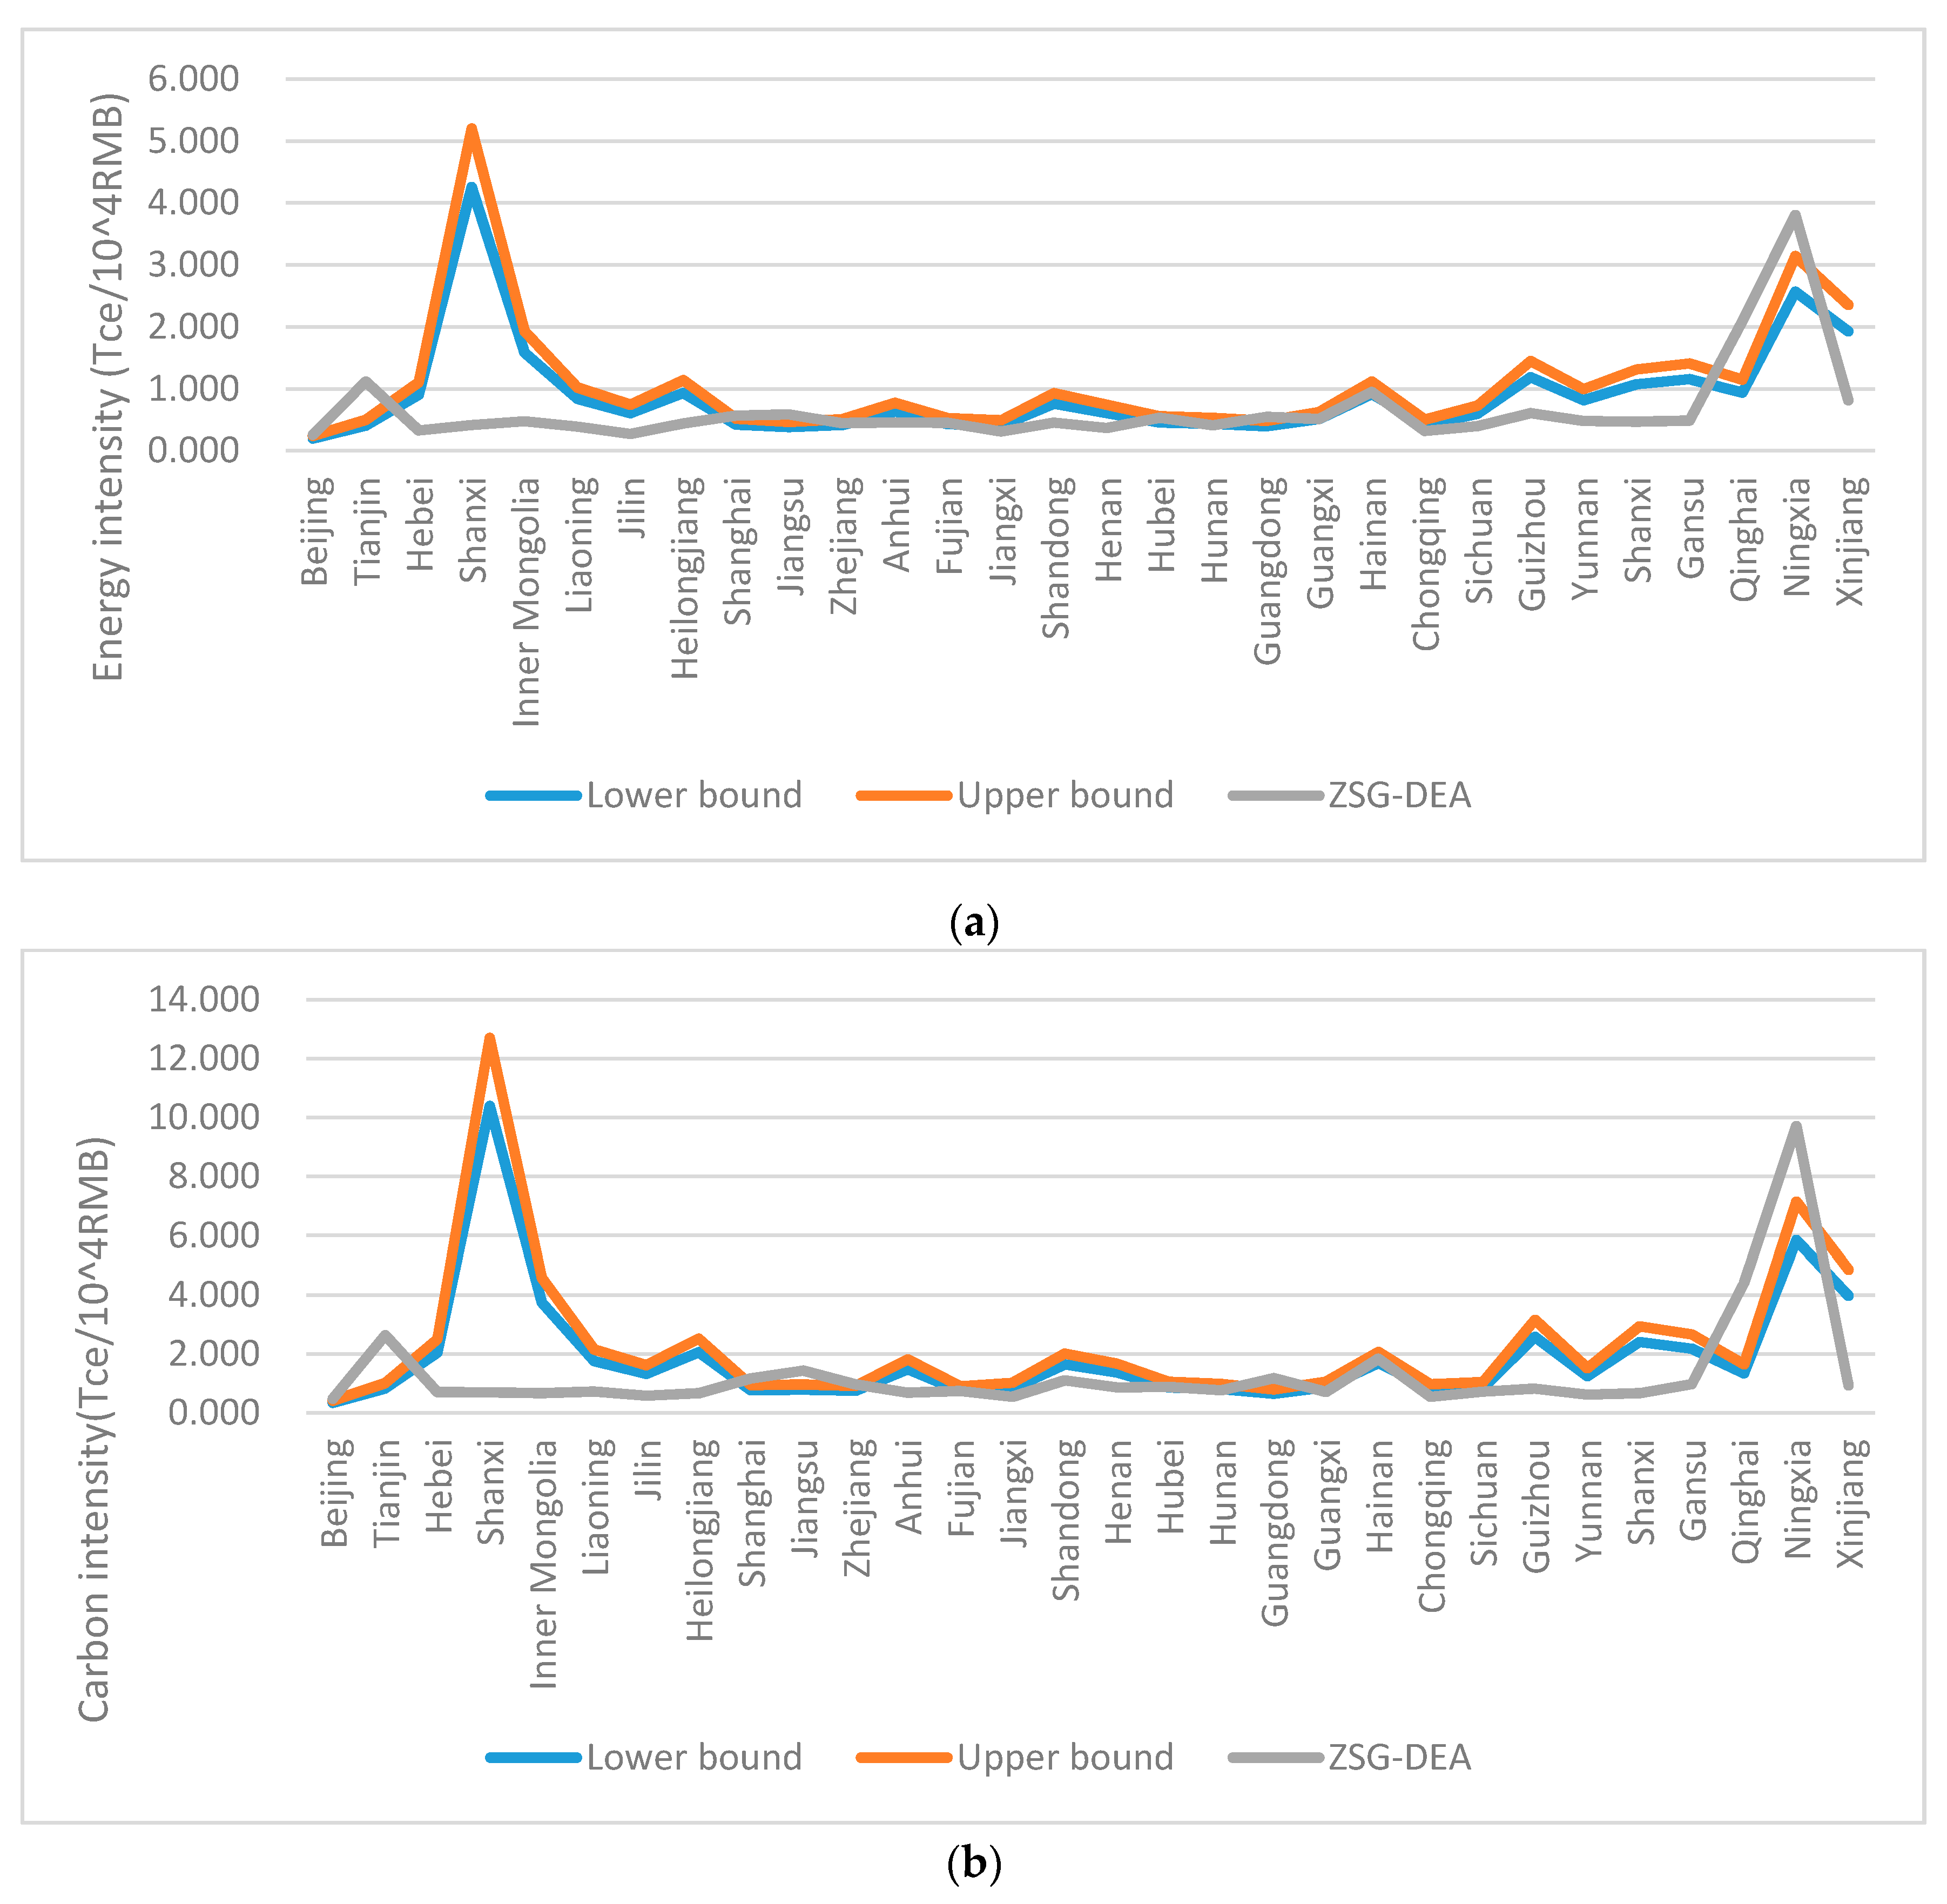
Figure 1a shows the energy intensity of each province after the fourth iteration by the ZSG-DEA model. It is observed that the energy intensity in some provinces are inconsistent with administrative energy intensity reduction targets. The energy intensity in Beijing, Tianjin, Shanghai, Jiangsu, Guangdong, Qinghai, and Ningxia are higher than the upper boundary of administrative targets. Both the initial and adjusted energy efficiencies of these regions are at the frontier, therefore the restriction of energy consumption can be looser to maximize the energy efficiency. There is another reason to ease the energy consumption restraints in Beijing, Shanghai, Jiangsu, and Guangdong provinces. These provinces are at a relatively high economic level in China, whose industrial structures have already been upgraded, and the production process tends to be environmentally-friendly. The main source of energy consumption in these provinces gradually shifted from traditional heavy industries to some new kind of industries or tertiary industry, like big data centers, modern logistics, intelligent manufacturing, and new-energy automobiles. Therefore, appropriately relaxing the constraints of energy in these provinces will greatly promote the development of new industries, which can play a leading role to drive the national economic and social development. Qinghai and Ningxia should also ease limits on energy. The eco-environment in Qinghai and Ningxia have been at the forefront of China, and their unique geographical environment has made the agriculture and animal husbandry industries the main pillars of the economy. However, their industrialization levels are relatively low. The process of industrialization and urbanization in these regions causes the demand of infrastructure construction and other industrial development to drive a massive expansion of energy, resulting in a substantial increase of energy consumption. Additionally, relaxing energy constraints is conducive to developing agricultural products processing industry and forming the ‘material–process–sale’ chain of agricultural products, which can benefit sustainable economic development in these provinces.
Figure 1a also shows that 22 provinces—especially Shanxi, Inner Mongolia, and Xinjiang—have higher restrictions than administrative goals. The energy intensities of these provinces are obviously lower than the lower bound of administrative goals. The northeast area provinces are characterized as high energy consumers and have high emissions, as well as being behind in environmental processing technology. Nowadays, energy consumption in this area should be strictly controlled and inversely force the governments and high energy consumption enterprises to enhance the utilization efficiency of coal and further adopt non-coal energies. The lower cost of coal in Shanxi and other resource-abundant provinces results in huge energy consumption, and single energy structure. These regions should rapidly eliminate the excess production capacity of coal mining and steel and coal chemical industries, and dedicate themselves to reshaping the industrial structure. Other regions like Guizhou and Guangxi, where the production technologies are backward, and economic production efficiencies are low, should focus on updating technology, and transforming the economic development model from being resources-devoted to innovation-driven. Gansu and Inner Mongolia, which have relative abundant non-coal energies, should make a rational exploitation and comprehensive use of wind energy, solar energy, hydropower, and other clean energy. Meanwhile, distributed energy supplying systems should be established to satisfy the energy demand. Sichuan and Yunnan have many surplus hydropower resources. Effectively utilizing abandoned water is a realistic choice to support the regional economy. Xinjiang and other western regions should seize the opportunity of “The Belt and Road” [
28] to promote energy efficiency and reduce energy intensity by strengthening cooperation with the Middle East in the use of petroleum and other energy.
Figure 1b shows carbon emission intensity in most provinces are inconsistent with the “13th GHG Control” objectives, wherein the emission-reduction targets are set from 12% to 20.5%. The trend of this figure is similar to that in
Figure 1a. The seven provinces with higher energy intensities than the administrative targets, will also have higher carbon intensity than that proposed in “13th GHG Control”; otherwise, provinces which have lower carbon intensity constraints than the national objectives, should implement stricter energy consumption control according to ZSG-DEA results.
3.3. Optimal Energy Structure
The sum of energy consumption is obtained based on the data in 2015 of each province and the predicted increments in the “The 13th GHG Control”, in this paper. The value equals 5.15 billion Tce and is slightly higher than the national anticipated target of 5 billion Tce. Following the adjustment, the coal share and non-fossil fuels share at national levels account for 56% and 15%, respectively, both satisfying the national obligatory goals. The proportion of natural gas is 9.3%, close to the national anticipated target. Thus, it is concluded that the optimizing result has basically achieved national targets.
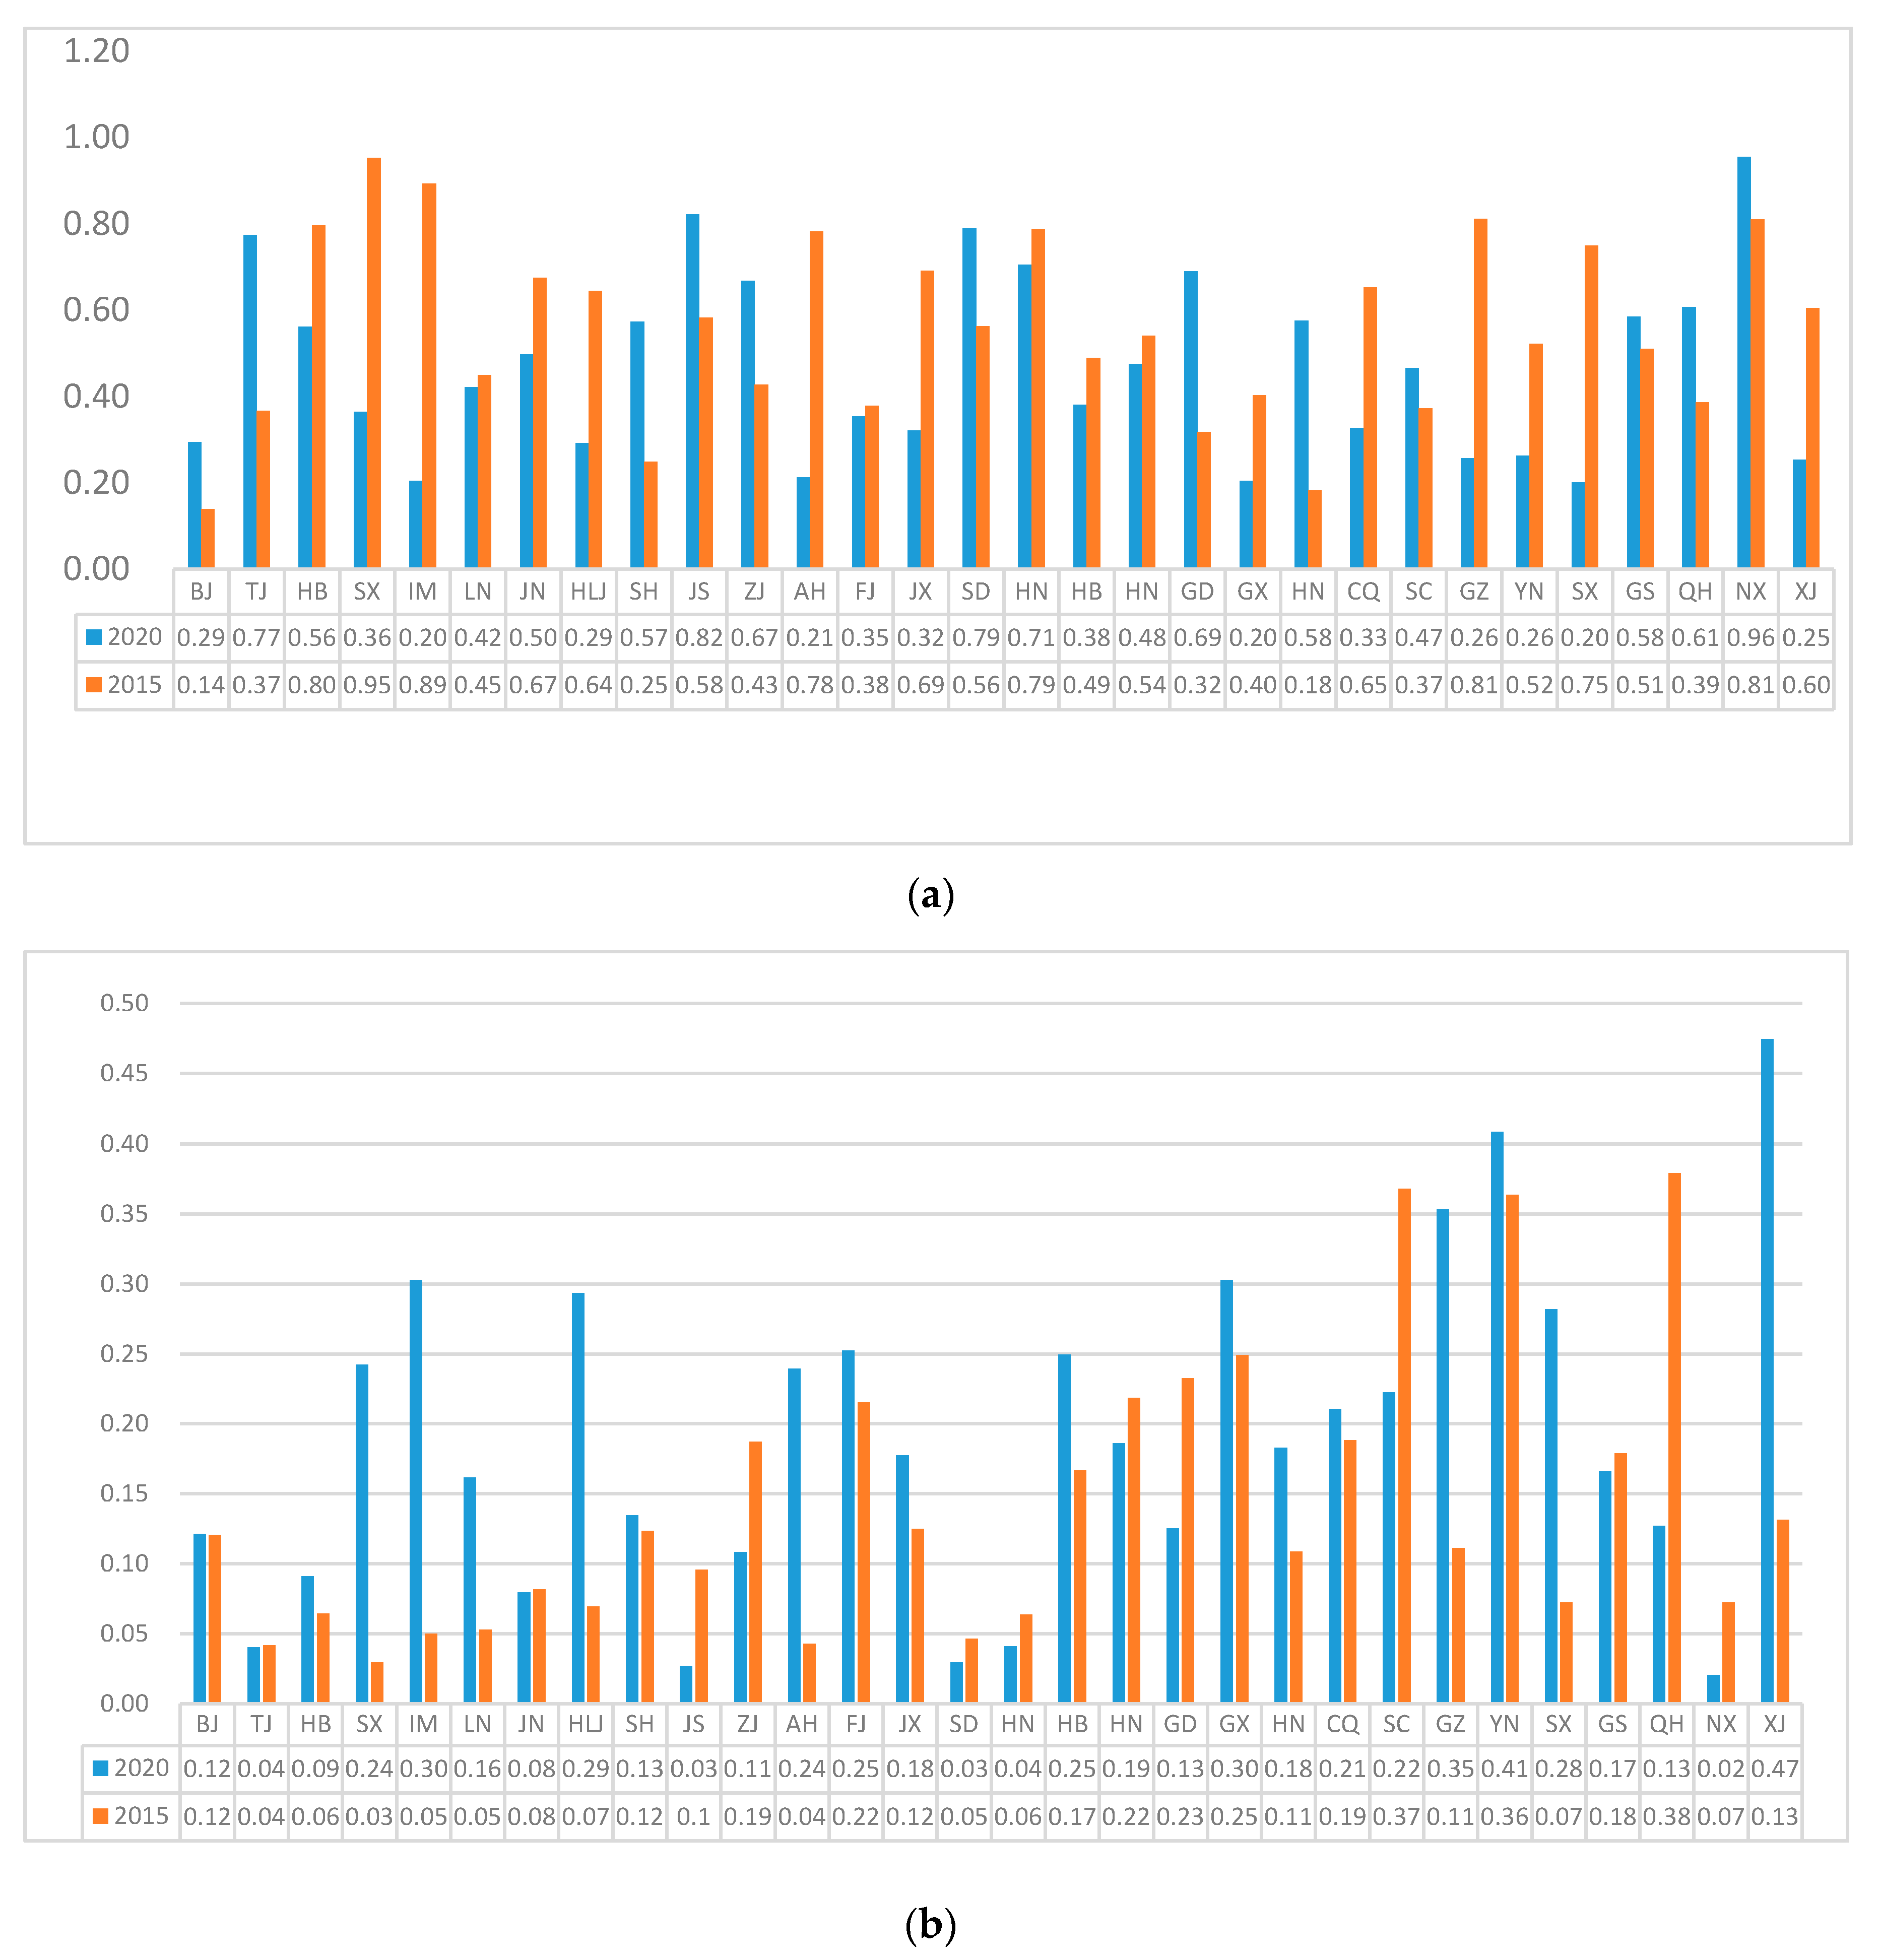
Figure 2a,b show the proportions of coal and non-fossil fuels in primary energy consumption in 2015 and is projected for 2020 after the ZSG-DEA adjustment. The results show that in 2020, there will be 12 provinces whose coal consumption occupy a dominant position in the primary energy consumption (over 50%). Natural gas accounted for more than 15% in 11 provinces, as non-fossil fuels accounted for more than 20% in 13 provinces. These results indicate that the energy structure of most provinces is developing toward diversification and low carbonization, but the coal-dominated status will not change in 2020.
Table A1 shows the allocation results of each energy consumption for each province.
4. Discussion
To realize national energy consumption control and energy structure optimization, this paper builds a weighted ZSG-DEA model which, theoretically, provides more insights on resource allocation, and potentially solves the practical energy problems. It shows that the results after the adjustment basically can achieve the national goals.
The allocation mechanism proposed by the local governments mainly considers the local economic level of the underdeveloped provinces that are allowed to relax the constraints of energy. This allocation mechanism is feasible in the short term, whereas it will inevitably lead to a certain degree of efficiency loss. The energy efficiency allocation method based on the zero-sum game theory is more in line with the requirements of sustainable development and energy revolution, from the perspective of long-term economic development. Therefore, this paper suggests a mixture of the economic-oriented and efficiency-oriented methods can be utilized in the formulation of specific energy saving targets for each province. The two indicators can be regarded as the upper and lower bonds to form a feasible interval, for example. Hereby, the local governments can distinguish anticipated and obligatory indicators to restrict energy consumption and evaluate the provincial energy efficiency within the scope. It can not only release the pressure on energy saving for underdeveloped provinces in the short term, but gradually approach the Pareto optimality for all provinces, and finally, achieve the long-term goal of China’s energy structure optimization.
This paper provides the framework for resource allocation and energy structure optimization, and future studies are expected to emphasize the following aspects: due to the difficulties in data collection, this paper does not distinguish the specific types of non-fossil fuels. However, the energy reserves, mining costs, utilization, and pollution level are much different among wind energy, solar energy, water energy, and other non-fuel energy. Future studies can subdivide non-fossil fuels to put forward more specific results and corresponding recommendations. Additionally, for Shanxi, Hebei and other provinces with high energy saving targets, there are some difficulties in the practical implementation. It is worth noting that the energy allocation in this paper is an initial allocation mechanism based on energy efficiency. How to redistribute the energy consumption quota by national energy taxation, regional subsidies, or trade in the energy conservation and carbon trading markets can be discussed in future studies. However, it may be emphasized that it is realistic and necessary to improve the energy efficiency in these underdeveloped and high energy consumption regions.


