Article

Planning Emergency Shelters for Urban Disaster Resilience: An Integrated Location-Allocation Modeling Approach

1
Sino-US Global Logistics Institute, Shanghai Jiao Tong University, Shanghai 200030, China
2
School of Management, Shanghai University, Shanghai 200444, China
3
School of Administrative Studies, York University, Toronto, ON M3J 1P3, Canada
4
China Institute for Urban Governance, Shanghai Jiao Tong University, Shanghai 200030, China
5
Antai College of Economics & Management, Shanghai Jiao Tong University, Shanghai 200030, China
*
Author to whom correspondence should be addressed.
Sustainability 2017, 9(11), 2098; https://doi.org/10.3390/su9112098
Submission received: 24 September 2017 / Revised: 8 November 2017 / Accepted: 14 November 2017 / Published: 15 November 2017
(This article belongs to the Section Sustainable Urban and Rural Development)

Abstract

:
In recent years, extreme natural hazards threaten cities more than ever due to contemporary society’s high vulnerability in cities. Hence, local governments need to implement risk mitigation and disaster operation management to enhance disaster resilience in cities. Transforming existing open spaces within cities into emergency shelters is an effective method of providing essential life support and an agent of recovery in the wake of disasters. Emergency shelters planning must identify suitable locations for shelters and reasonably allocate evacuees to those shelters. In this paper, we first consider both the buildings’ post-disaster condition and the human choice factor that affect evacuees’ decision, and propose a forecasting method to estimate the time-varying shelter demand. Then we formulate an integrated location-allocation model that is used sequentially: an emergency shelter location model to satisfy the time-varying shelter demand in a given urban area with a goal of minimizing the total setup cost of locating the shelters and an allocation model that allocates the evacuees to shelters with a goal of minimizing their total evacuation distance. We also develop an efficient algorithm to solve the model. Finally, we propose an emergency shelters planning based on a case study of Shanghai, China.

1. Introduction

Cities with a high population and building density have a greater safety risk during earthquakes, hurricanes, tsunamis, and other natural disasters. A sudden disaster can cause overwhelming economic losses, affect a large population and create serious environmental damage; so urban planners need to develop measures to diminish the possible impact of these disasters. The role of efficient disaster operations management in enhancing urban disaster resilience has received increasing interest from both researchers and practitioners.
Various studies have examined different stages (mitigation, preparedness, response, recovery) of disaster operations management [1,2]. An indispensable part of the preparedness phase is determining the location of emergency shelters, which serve two primary functions: provide temporary residences where survivors can avoid secondary damage such as fires and diseases, and allow first responders to efficiently perform rescue operations. After the 2010 Haiti earthquake, an estimated three million people were affected and had to be displaced to safe places, about one-third of whom became homeless. Lacking available shelters, victims had to live on streets. Under such circumstances, their health and safety cannot be guaranteed because of the high risk of secondary damage. However, after the 2011 Tohoku earthquake, more than 2000 shelters were established rapidly, providing some 166,000 evacuees with a safe place to stay during post-disaster recovery. Moreover, the victims in shelters also retain a sense of dignity and emotional security even when their houses have been destroyed in an earthquake. Although there are significant differences in social and economic levels between Haiti and Japan, emergency shelters planning needs to be integrated into urban resilience planning to reduce vulnerability.
The first step towards urban resilience planning is to ensure that affected people are evacuated quickly to safe assembly points and shelters in the wake of disasters. To ensure an efficient disaster recovery, shelters’ locations and evacuees’ allocations must be strategically planned. In the present study, we develop a location-allocation model based on community-level units. By accounting for time-varying shelter demand, we are able to determine a set of emergency shelters that minimizes the total construction cost and allocates evacuees to shelters while minimizing the total evacuation distance. The problem of allocating evacuees to designated emergency shelters in large urban areas is challenging, thus, we develop an efficient algorithm to solve a real-world application of the allocation problem based on a case from Shanghai.
Our paper offers three main contributions. First, we develop a method that considers building damage and lifeline utility function loss to estimate time-varying shelter demand in a large urban area. Second, we propose an integrated location-allocation model that incorporates an estimation method to plan emergency shelters for urban disaster resilience. We reduce the set up cost of emergency shelters by identifying optimal locations. This ensures sustainable development of urban resilience planning, because disaster mitigation fund is always limited in reality. Third, we develop a novel algorithm based on the cross-entropy method, integrated with a local search mechanism, to efficiently solve the integrated location-allocation model.
The remainder of this paper is organized as follows. In Section 2, we review the literature related to this research. In Section 3, we formulate the model. Section 4 discusses the algorithm based on the cross-entropy method and a local search scheme. Section 5 presents the results of a case study of Shanghai’s central areas and provides further discussion. Section 6 concludes the paper with a summary of the results and proposals for future research.

2. Literature Review

Planning emergency shelters in advance is an effective approach to mitigate the damage caused by natural disasters. This section starts with an overview of concepts of urban resilience introduced by previous studies. Subsequently, researches that estimate post-disaster shelter demand are reviewed to provide the data basis for the problem formulation. Finally, earlier studies on shelter location problems are classified into qualitative methods which study important principles for locating emergency shelters such as building codes and design norms, and quantitative methods which use optimization techniques and mathematical models to satisfy given objectives.

2.1. Urban Resilience

When unprecedented urbanization is taking place in our planet, cities continue to grow with great uncertainty and vulnerability. The term “resilience” has become an increasingly favored concept in academic community to describe urban areas’ ability to cope with disaster. It originates from the Latin word resilio or resilire, meaning “to bounce back” [3]. While the definition of urban resilience varies with the background of researches, the United Nations International Strategy for Disaster Reduction (UNISDR) provides a comprehensive definition. It considers resilience as the capacity of a system, community or society potentially exposed to hazards to adapt, by resisting or changing in order to reach and maintain an acceptable level of functioning and structure. The UNISDR also launched the Making Cities Resilient Campaign: My City is Getting Ready! in 2010 in recognition of the increasing vulnerabilities linked to global urbanization and the urgent need for local governments to enhance urban resilience. Meerow et al. [4] review the various definitions of urban resilience found in both resilience theory and urban theory, and identify six conceptual tensions fundamental to urban resilience. Romero-Lankao et al. [5] synthesize the concept of urban sustainability and resilience from theory and practice, and examine the implications of their intersections and differences. Bozza et al. [6] discuss the resilience of urban environments to natural hazards from a civil engineering perspective and seek to quantify urban resilience. Moreover, to make a city resilient, it should be focus on preparedness for future hazards. Given the critical nature of emergency shelter locations in disaster preparedness, determining optimal shelter locations is essential in raising urban resilience.

2.2. Shelter Demand Estimation

Post-disaster shelter demand should be investigated in the preparedness phase so as to determine the size and location of emergency shelters. Because shelter demand is highly uncertain after a disaster, some researchers employ stochastic optimization or a robust optimization model to locate shelters and plan evacuation routes. Kulshrestha et al. [7] utilize an uncertainty set to represent deviation of evacuation demand from the nominal value and propose a robust shelter location model. Verma and Gaukler [8] employ a stochastic programming model to locate disaster response facilities and obtain a cost advantage compared to deterministic models. However, these models do not consider the factors that affect shelter demand and do not reflect spatial and temporal variations in demand. Some researchers consider real factors which affect people’s shelter-seeking behaviour. Yin et al. [9] define a disaster evacuation coefficient based on the percentage of destroyed by an earthquake, and then use a simple formula to estimate the number of people to be evacuated to emergency shelters (e.g., 30 % × the residential population). However, they do not consider that some people with intact houses might still choose to temporarily stay in a shelter for reasons such as lack of water or electricity in their houses. Khazai et al. [10] integrate building habitability and social vulnerability of the affected population rather than only degree of building damage to model demand for emergency shelters, but without considering changes in shelter demand over time. Wang et al. [11] propose a method based on a Japanese Central Disaster Prevention Council (CDPC) report to forecast the varying shelter demand for emergency shelters after a hypothetical earthquake in Shanghai. Their approach considers people’s reactions to building damage and shortage of essential services.

2.3. Shelter Site Location

Many researchers concentrate on identifying design criteria and location principles for emergency shelters. For example, the national standard established by the China Earthquake Administration provides specifications for emergency shelters that will be suitable for use after an earthquake and practical guidance on the construction of such shelters. Johnson [12] proposes a framework for strategic planning that identifies organizational designs and available resources for temporary shelters before the disaster. Liu et al. [13] explore the principles in selecting sites for emergency shelters after the disastrous 2008 Wenchuan earthquake in China. Literature mentioned above also provides valuable insights into selecting proper sites for emergency shelters and establishes some guidelines with which shelter builders must comply in practice, but none of them study how to locate emergency shelters from candidate sites.
Some researchers use facility location models (FLMs) to address the location issue of emergency shelters. FLMs are quantitative models that can be used to select sites to optimize certain selection objectives. There is extensive literature focused on developing optimization models for FLMs [14]. Daskin [15] explains three primary models of FLMs in detail. Two of these models can be used to minimize travel cost (in terms of distance, time, or money): the p-median model which minimizes the total travel cost, and the p-center model which minimizes the maximum travel cost. The third model measures the service level provided by the facilities through a coverage model that defines a critical predefined coverage radius (i.e., the distance within which people can be served by a given facility). Some researchers extend these models into various emergency scenarios. Alçada-Almeida et al. [16] introduce a multi-objective p-median model to identify the number and location of emergency shelters as well as the evacuation routes that evacuees should follow. Huang et al. [17] propose a variation of the p-center model based on the additional assumption that a facility could fail to meet demands that it is supposed to satisfy (e.g., if its capacity is exceeded or its functionality is reduced by damage or other factors), which is likely to happen to many facilities during large-scale emergencies. Murali et al. [18] formulate a special case of the coverage model using a loss function and chance-constraints. The basic FLMs also can be extended to complex optimization models, including models based on bi-level optimization [19,20], hierarchical models [21], and models that account for dynamic environments [22].
Researches as well as policy makers use FLMs to determine optimal locations of emergency shelters and to design allocation schemes. The evacuation distance and the capacity of shelters are crucial in ensuring urban resilience; therefore many studies consider these factors as either constraints that must be satisfied or objectives that should be optimized. Huang et al. [23] develop a fuzzy multi-objective model with travel distance constraints that attempts to maximize coverage. Saadatseresht et al. [24] propose a bi-objective model to minimize the maximum travel distance and avoid violation of a shelter’s capacity. Ng et al. [25] propose a hybrid bi-level model to minimize both the total evacuation time and the individual evacuation time. Kılcı et al. [26] formulate a model which incorporates both the distance and capacity constraints of a shelter. Their model determines the location of shelter areas while taking shelter area utilizations into account. Pérez-Galarce et al. [27] develop an optimization approach that is able to locate and assign refuge centers through enabling buildings to provide shelter, as well as medical and psychological assistance to the victims. However, these papers neglect building cost, which is also an important factor in emergency shelters planning.
To the best of our knowledge, no research combines FLMs with time-varying shelter demand to plan emergency shelters for urban resilience. In this paper, we develop an integrated location-allocation model with time-varying shelter demand estimation that chooses optimal location for shelters and allocates the evacuees to the shelters. In the proposed formulation, the earthquake administration identifies candidate sites for emergency shelters and then develops an allocation scheme to minimize the total evacuation distance traveled by all evacuees, which reduces the risk of evacuees. We apply the proposed model to the central districts of Shanghai, China, to examine its performance after an earthquake.

3. Model Formulation

In this section, we develop an integrated location-allocation model to determine the location of urban emergency shelters and allocate evacuees among the shelters. We firstly analyze the factors that affect the evacuees’ evacuation and propose a calculation method to predict time-varying shelter demand. Then, we use the time-varying demand as an input to locate the emergency shelters with a location model. After the emergency shelters are selected in the location model, we employ an allocation model to assign the shelter demand to these selected shelters while optimizing the total evacuation distance. The corresponding models are detailed in the rest of this section.

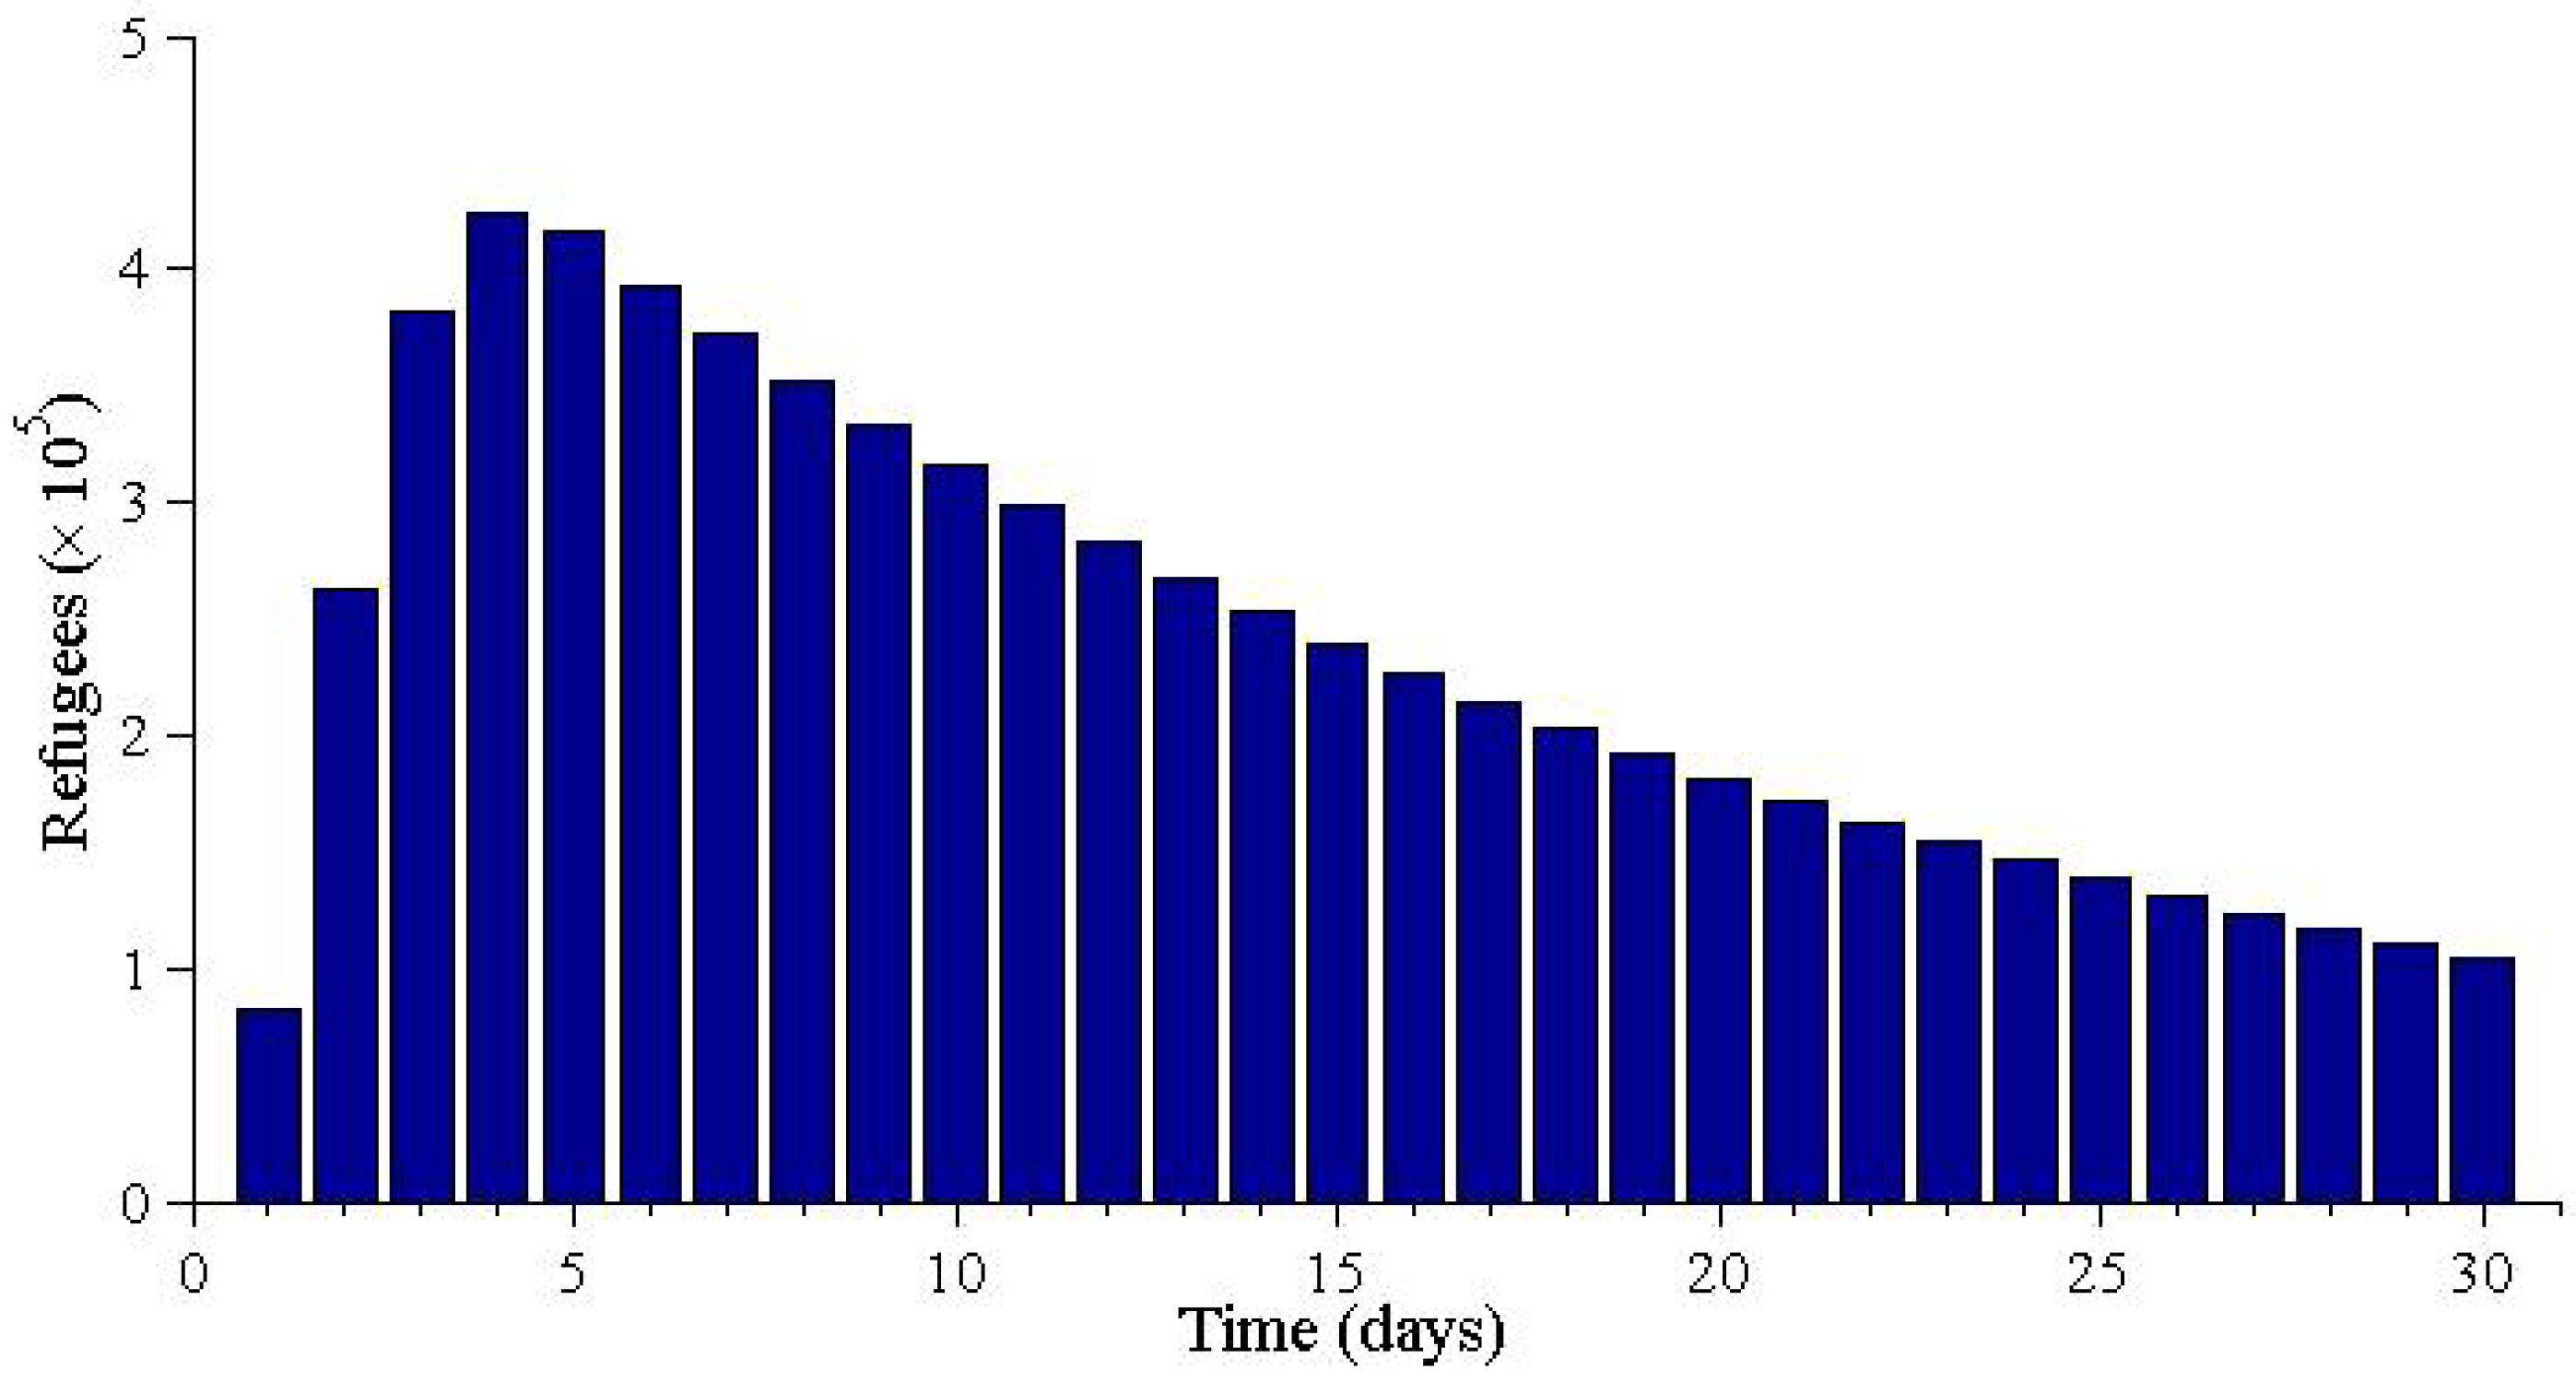
3.1. Time-Varying Shelter Demand

In the preparedness phase, seismic-prone cities need to assess the potential impact of an earthquake on their buildings and infrastructure. Earthquake damage to residential buildings determines demand for shelters; therefore, the estimation of the damage is an important factor in the decision on size and location of shelters. In 2005, the CDPC’s expert examination committee on measures for earthquakes published its study on damage estimation of an earthquake with an epicenter in the Tokyo metropolitan area. The CDPC classifies earthquake evacuees into two types: one with damaged residence, which is not suitable to live in, and the other with intact residence but shortage of essential living services. The CDPC also provides some parameters to calculate the number of people in shelters such as the proportion of evacuees who seek to stay in shelters. Although the CDPC’s study presents the estimation of people in shelters on the first day, the fourth day, and the 30th day after an earthquake, it does not estimate the changing number of people in shelters on each day within one month after an earthquake. Wang et al. [11] further analyze the reasons which cause people to evacuate in an earthquake and use Shanghai’s data such as building materials and essential service supply to give an estimate of evacuees in an earthquake. However, CDPC’s study and Wang et al. [11] do not provide a generalized quantitative formula to estimate the time-varying shelter demand.
In the present study, we present a generalized method to estimate the number of people in shelters on each day after an earthquake occurs. We first analyze the reasons why residents evacuate from their houses. We assume that the residents whose houses are damaged or whose essential services (e.g., clean water, power supply) are insufficient after an earthquake occurs would choose to evacuate. Moreover, we extend the CDPC’s study by considering three main types of evacuees in an earthquake: people whose houses are completely destroyed, partially damaged, and intact without sufficient essential services. “Completely destroyed” means that the house’s structure cannot be repaired and the people who live in it need to be displaced to other safe places. “Partially damaged” means that the house’s structure can be repaired but is unsuitable for living in the short term. “Intact” means that the house’s structure does not need to be repaired, but insufficient essential services render it temporarily uninhabitable. We then assume that a portion of those evacuees choose to stay in shelters because the damage of their houses affects their decision making for shelter-seeking behaviour [28]. The process of determining the time-varying shelter demand is illustrated in Figure 1.
We propose a generalized formula which is based on the assumptions above and Wang et al. [11]’s study to estimate the time-varying shelter demand in one month after an earthquake occurs. It is shown as follows:
D i ( t ) = Δ ( t ) P i φ
Δ ( t ) = h 1 ω 1 + h 2 ω 2 + h 3 ω 3 ( t )
where D i ( t ) represents the time-varying shelter demand associated with community i at time t; Δ ( t ) represents the time-varying proportion; P i represents the population of community i; φ represents the proportion of evacuees who choose an emergency shelter as their destination instead of traveling to the houses of friends or relatives or to hotels outside the affected area; h 1 represents the proportion of the population whose house is completely destroyed, h 2 represents the proportion of the population whose house is partially damaged, h 3 represents the proportion of the population whose house is intact; ω 1 , ω 2 , and ω 3 ( t ) , respectively, represent the corresponding proportions of the three types of population who choose to evacuate to safe places.
We determine ω 1 and ω 2 through the same procedure that is used in Wang et al. [11]’s study on Shanghai, and these parameters are actually affected by the liveability of household or neighbourhood [28]. Because the population whose house is completely destroyed or partially damaged should be evacuated in a short time, we assume ω 1 and ω 2 are not time-varying. In the formula mentioned above, we use ω 3 ( t ) to represent the time-varying evacuation demand of victims with intact houses but shortage of essential services, which will cause variation in the number of the people in shelters. Moreover, we assume that these evacuees leave their houses because of their intolerance of essential service unavailability and that they will gradually return to their houses following the essential services’ recovery. Therefore, we determine ω 3 ( t ) by multiplying the magnitude of essential services shortage and the individual intolerance degree.
In Wang et al. [11]’s observation, the recovery of lifeline infrastructure takes one month, but citizens tolerates one week of essential services shortage at most. Therefore, we assume that shortage slowly decreases over a period of 30 days and intolerance degree increases rapidly within 7 days. According to Sheu and Pan [29], the exponential approach is commonly used to roughly estimate the number of evacuees after disasters, so we simulate the magnitude of the shortage at time t, s h ( t ) and the individual intolerance for the shortage at time t, i n ( t ) as follows:
s h ( t ) = α 1 × e x p ( β 1 t )
i n ( t ) = m i n ( α 2 × e x p ( β 2 / t ) , 1 )
where α 1 , α 2 , β 1 , and β 2 are parameters that can be set according to the actual data from the study area, respectively. Figure 2 shows how these functions vary with time.
In order to prepare for the worst-case scenario, emergency shelters should be built to satisfy maximum time-varying shelter demand to avoid capacity shortage. In our assumption, once the maximum time-varying shelter demand is satisfied, shelter demand at other times during the post-disaster period can also be satisfied. Therefore, we will use the maximum value of time-varying shelter demand as input to the following models.

3.2. The Integrated Location-Allocation Model

Before introducing the location-allocation model of emergency shelters, we make five assumptions:
  • The population of a given community is concentrated at its central point (i.e., we use a “center of mass” approach to calculate travel distances between a community and a shelter).
  • The evacuees follow the government’s recommended paths when they evacuate to an assigned shelter.
  • Evacuees evacuate to an assigned shelters on foot, so the condition of major routes has little effect on the evacuees’ choice of shelters.
  • The physical locations of all candidate shelters are predetermined.
  • All residents of a given community are assigned to only one shelter in order to avoid confusion during evacuation.
Choosing an appropriate emergency shelter location means that evacuees can reach the shelter. Therefore, all feasible solutions should comply with the following two constraints:
  • Distance constraint: To ensure safety, it is necessary for evacuees to reach a nearby shelter within a short time after the disaster. Hence, the distance between each community and its assigned shelter should be within the shelter’s maximum service radius. This is the most important constraint and therefore has higher priority.
  • Capacity constraint: For a shelter to meet the basic needs for living, the number of people in a shelter should not exceed the shelter’s maximum capacity.
The decision-making process for locating shelters is strategic, and it cannot be adjusted easily in the following 5–10 years. However, the decision of allocating evacuees to shelters is more or less tactical or operational, and it depends on the location decision of shelters. Therefore, we propose the integrated location-allocation model sequentially. Let G be a bipartite graph with bipartition ( R , S ) , where R denotes the set of residential communities and S denotes the set of candidate shelters. Let r = | R | be the total number of residential communities and s = | S | be the number of candidate shelters. As described in Section 3.1, the shelter demand in residential community i varies during the period after the earthquake, and this variation is influenced by two factors: the condition of a resident’s house and human choice related to their intolerance towards a lack of services. We use M D i ( t ) to represent the maximum shelter demand from community i during the emergency period. The maximum population that can be held by candidate shelter j in an emergency is denoted by c j . The shortest distance between residential community i and candidate shelter j is represented by l i j . The maximum service distance of an emergency shelter, i.e., the maximum allowable distance between a residential community and its designated shelter, is denoted by L. The cost of building emergency shelter j is f j , which includes the costs of location and construction. We assume that for j S , R j = { i R : l i j L } represents the set of residential communities that can be served by shelter j. Similarly, for i R , let S i = { j S : l i j L } indicate the set of candidate shelters that can be chosen by residential community i.
In reality, disaster risk reduction often does not receive top priority, resulting in local governments reserving only limited financial resources for shelter construction. Thus, minimizing shelters’ construction cost is crucial to the sustainable development of urban shelters planning. After resolving the shelter location problem, authorities can further raise urban resilience by speeding up the evacuation process. Therefore, we minimize the total evacuation distance of people based on a given set of shelters to enhance the resilience of urban shelters planning.
We adopt two kinds of decision variables. One represents whether a candidate site is selected to build a shelter, which is defined as a binary variable y j , and the other represents whether the shelter demand of community i is assigned to candidate shelter j, which is defined as a binary variable x i j . No splitting is allowed in our model, which is a common assumption in facility location theory. For example, neither the Median Problem nor the Uncapacitated Facility Location Problem allows demand splitting. Furthermore, in order to make the evacuees’ evacuation organized and reduce unnecessary confusion about evacuation choice in post-disaster period, all residents of a community should evacuate to the same shelter. These variables are shown as follows:
x i j = 1 ,   if   the   residents   of   community   i   are   assigned   to   candidate   shelter   j . 0 ,   otherwise .
y j = 1 ,   if   candidate   shelter   j   is   selected   as   the   designated   shelter . 0 ,   otherwise .
Consider the following integer program for this location problem:
min j = 1 s f j y j
s . t . j S i x i j = 1 , i = 1 , , r
i R j M D i ( t ) x i j c j y j , j = 1 , , s
x i j y j , i = 1 , , r , j = 1 , , s
x i j { 0 , 1 } , i = 1 , , r , j = 1 , , s
y j { 0 , 1 } , j = 1 , , s
Objective function (7) minimizes the total cost of building emergency shelters. Constraint (8) ensures that the residents of each community must be assigned to exactly one shelter. Constraint (9) states that the total maximum time-varying shelter demand assigned to a selected shelter cannot exceed the shelter’s capacity. Constraint (10) ensures that a community cannot be evacuated to a closed shelter. Constraints (11) and (12) are standard binary integrality constraints.
After shelters are selected from the candidate set S, the allocation strategy recommends evacuation routes to all residents. The location model provided us with an allocation scheme, but the solution that satisfies the coverage constraint might not be optimal in terms of travel distance. For example, in Figure 3, residential community j is allocated to shelter 1 according to the location model, despite shelter 2 being closer to community j. Community k has the opposite allocation result. Therefore, we need a new model to optimize the total evacuation distance.
A transportation model can be formulated to describe this scenario. In this model, the binary variable x i j has the same meaning as in the location model. In the new allocation model, we use S to represent the set of selected shelters and s to represent the cardinality of S :
min i R j S i S M D i ( t ) l i j x i j
s . t . j S i S x i j = 1 , i = 1 , , r
i R j M D i ( t ) x i j c j , j = 1 , , s
x i j { 0 , 1 } , i = 1 , , r , j = 1 , , s
Objective function (13) minimizes the total evacuation distance for the shelter demand. Constraint (14) ensures that the evacuees of each community must be assigned to exactly one shelter. Constraint (15) states that the total time-varying shelter demand assigned to a selected shelter cannot exceed its capacity. Constraint (16) imposes a binary requirement on the variables.

4. Solution Procedure

In the previous section, we propose an integrated location-allocation model for emergency shelters. Finding the optimal location of shelters is non-deterministic polynomial-time hard (NP-hard) from the perspective of computational complexity because the location model becomes a capacitated set covering location problem if all values of f j s are the same. To obtain a good solution, we introduce a heuristic in the section.
The solution procedure for the integrated location-allocation model in this study consists of two major parts. In the first part, under an importance-sampling framework, we assign time-varying shelter demand to shelters and use a local search mechanism to reduce the violation of constraints. After the emergency shelters are located, an evacuation scheme can be proposed based on the solution to the first part. However, this evacuation scheme might not minimize the total evacuation distance for the evacuees in shelters. In the second part, we use a similar local search to improve the solution returned by the first part. In the following subsections, we describe the cross-entropy method and the local search mechanism (based on “insert” and “swap” moves) that are used in both parts of the procedure.

4.1. CE-Based Solution Approach

The cross-entropy (CE) method is proposed by Rubinstein [30] as a way of adaptively estimating the probabilities of rare events in complex stochastic networks. This method has been extended to many other types of problems, including continuous optimization problems and combinatorial optimization problems. It is widely applied to the max-cut problem, the traveling salesman problem, and the capacitated vehicle routing problem. Caserta and Rico [31] use the cross-entropy method to deal with the capacitated facility location problem, and we use a similar methodology to locate the emergency shelters.
Given the cardinality of the set of candidate shelters, s, we can generate s-dimensional binary strings to represent the solution to the location model in which 1 represents an open shelter and 0 represents a closed shelter. Since the Bernoulli distribution has been found effective in the context of binary vectors [31], we generate N binary samples randomly, represented by X 1 , , X N , from a family of Bernoulli probability-density functions, Φ ( · , p ) . At each iteration of the sampling process, the following formula is used to update the stochastic parameters p i ^ :
p i ^ = k = 1 N I { P ( X k ) z } X k i k = 1 N I { P ( X k ) z } , i = 1 , , s ,
where P : x R , x X is a real-valued function that evaluates the performance of the random vector x and I { P ( x ) z } is an indicator function whose value is 1 if the performance value of x is less than or equal to a fixed threshold z and 0 otherwise. In Equation (17), X k i is the i-th component of the random generated solution X k . This formula is iteratively used to generate a sequence of reference parameters { p t } and non-increasing levels { z t } for the estimation of P ( P ( X ) z t ) . At each iteration, the performance function values of X 1 , , X N are sorted in ascending order and the threshold value z t is chosen as the ρ percentile of these values, where 0 < ρ < 1 is a given parameter. The new value of z t is then used to generate a new vector, p t + 1 . The new vector is, in turn, used to draw a sample population under a different distribution function Φ ( x , p t + 1 ) , which will lead to better values of z t + 1 .
The process terminates when the level value z t does not change over a number of iterations or when the vector p t converges to a binary vector. Moreover, we implement a “smoothed” version of the updating rule, as in De Boer et al. [32], in such a way that at each iteration t:
p i t + 1 = α p ^ i t + 1 + ( 1 α ) p i t
typically with 0.7 α 0.9 . The smoothed update prevents the method from converging too fast to a degenerate vector, thereby leading to a more thorough exploration of the search space.
Given a random state X k ( k = 1 , , N ) , drawn beforehand, the location variable y { 0 , 1 } s can be indicated with the induced binary vector, where y takes the same value as X k . Then, let S S be the set of selected shelters, that is, S = { j S : y j = 1 } , where y j is the j-th component of y. To ensure the feasibility of the selected set S , we propose two necessary requirements. First, the overall capacity of the selected shelters must exceed the overall shelter demand. That is, j S c j i R M D i ( t ) . Second, coverage constraint (8) in the location model must be satisfied. That is, i R , j S , such that x i j = 1 . Once the open shelters are decided, the feasibility of the latter constraint can be checked easily through the coverage matrix (a matrix with values equal to either 0 or 1, with 1 representing a community that can be covered by a shelter and 0 representing a community that cannot be covered by that shelter). If an infeasible set is generated based on these two requirements, a quick projection scheme is used to modify the induced binary vector to satisfy the feasibility conditions. The quick procedure selects shelters randomly from the closed shelters until the feasibility check is met, j S c j i R M D i ( t ) , and selects one j such that x i j = 1 . In addition, another requirement should also be met, that is, the total shelter demand assigned to each selected shelter should not be higher than the capacity of that shelter, which will be tackled in the next allocation phase.
After the set of open shelters is determined, the next phase of the algorithm deals with the allocation problem. First, all communities are sorted in increasing order based on how many open shelters can cover them. If there is a tie, they are sorted in descending order based on the shelter demand. We say that the first community in the list is the “top” one and the last one is the “bottom” one. Obviously, the top communities have fewer shelters that cover them. Basically, we place the communities that are harder to allocate on top and those that are easier to allocate at the bottom. In the next step, according to the list generated above, communities are allocated sequentially from top to bottom. For each community, the allocated shelter is the one that covers this community and that has the maximum residual capacity. (Ties are broken by choosing the shelter that is able to cover the smallest number of communities.) The solutions to the location problem and the allocation problem can be easily obtained following this procedure. Obviously, constraint (9) might be violated if some selected shelters are allocated a greater shelter demand than their capacities. In this case, we first use the local search heuristic, which will be introduced in the following subsection, to reduce the violations. In addition, we use a penalty approach to discard solutions with worse performance values at the end of each iteration. At the iteration t, the performance value (with penalty value) of every solution should be compared with level value z t . Then, according to Equation (17), the indicator function (I) values of those solutions incurring performance values greater than z t are zero, therefore would not be used for the future iterations.
To facilitate the penalty approach, we denote the location solution by y and the corresponding allocation obtained by A ( y ) . The set of the communities allocated to open shelter j is denoted by R j . The penalty function associated with open shelter j is defined by:
L j ( y , A ( y ) ) = α · max 0 , i R j M D i ( t ) c j
where L j represents a penalty function, and α is the penalty factor. The performance function associated with the location solution y and the allocation A ( y ) is computed as:
P ( y , A ( y ) ) = j S [ f j + L j ( y , A ( y ) ) ]

4.2. Local Search Heuristic

In Section 4.1, after a set of shelters is generated, a corresponding allocation scheme can be constructed. In the present subsection, we describe the application of a local search (LS) heuristic to improve the allocation solution. At each iteration, we apply two different local search methods to reduce the computational effort. The local search procedure can be described as follows:
  • Calculate the performance value of the initial solution.
    If the initial allocation solution produces the positive penalty, then the performance value of the initial solution is computed using Equation (20).
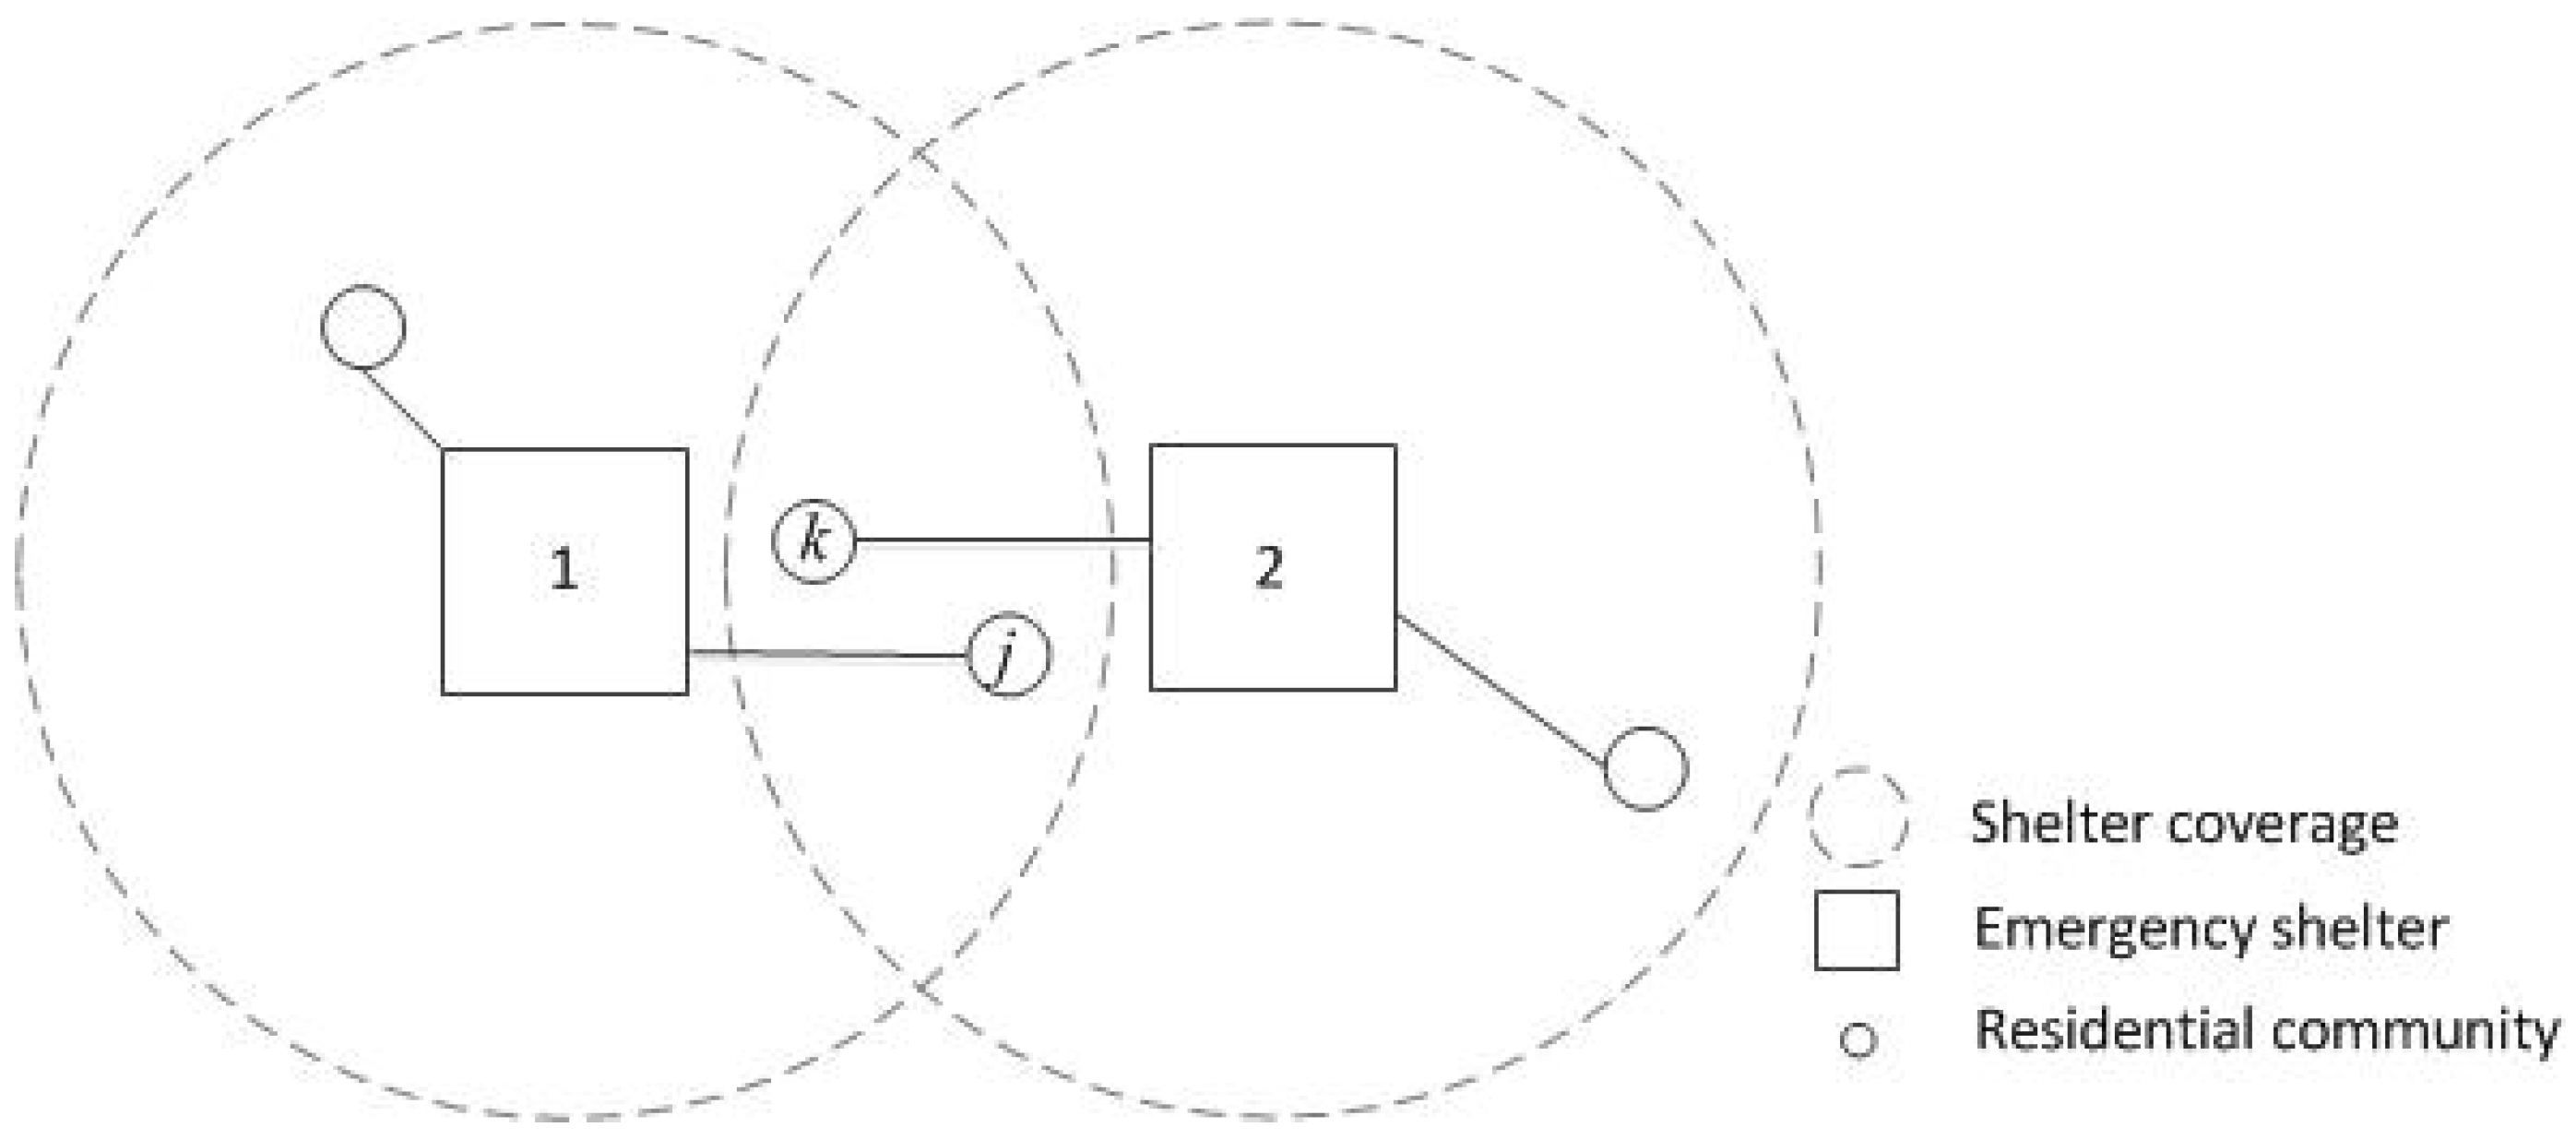
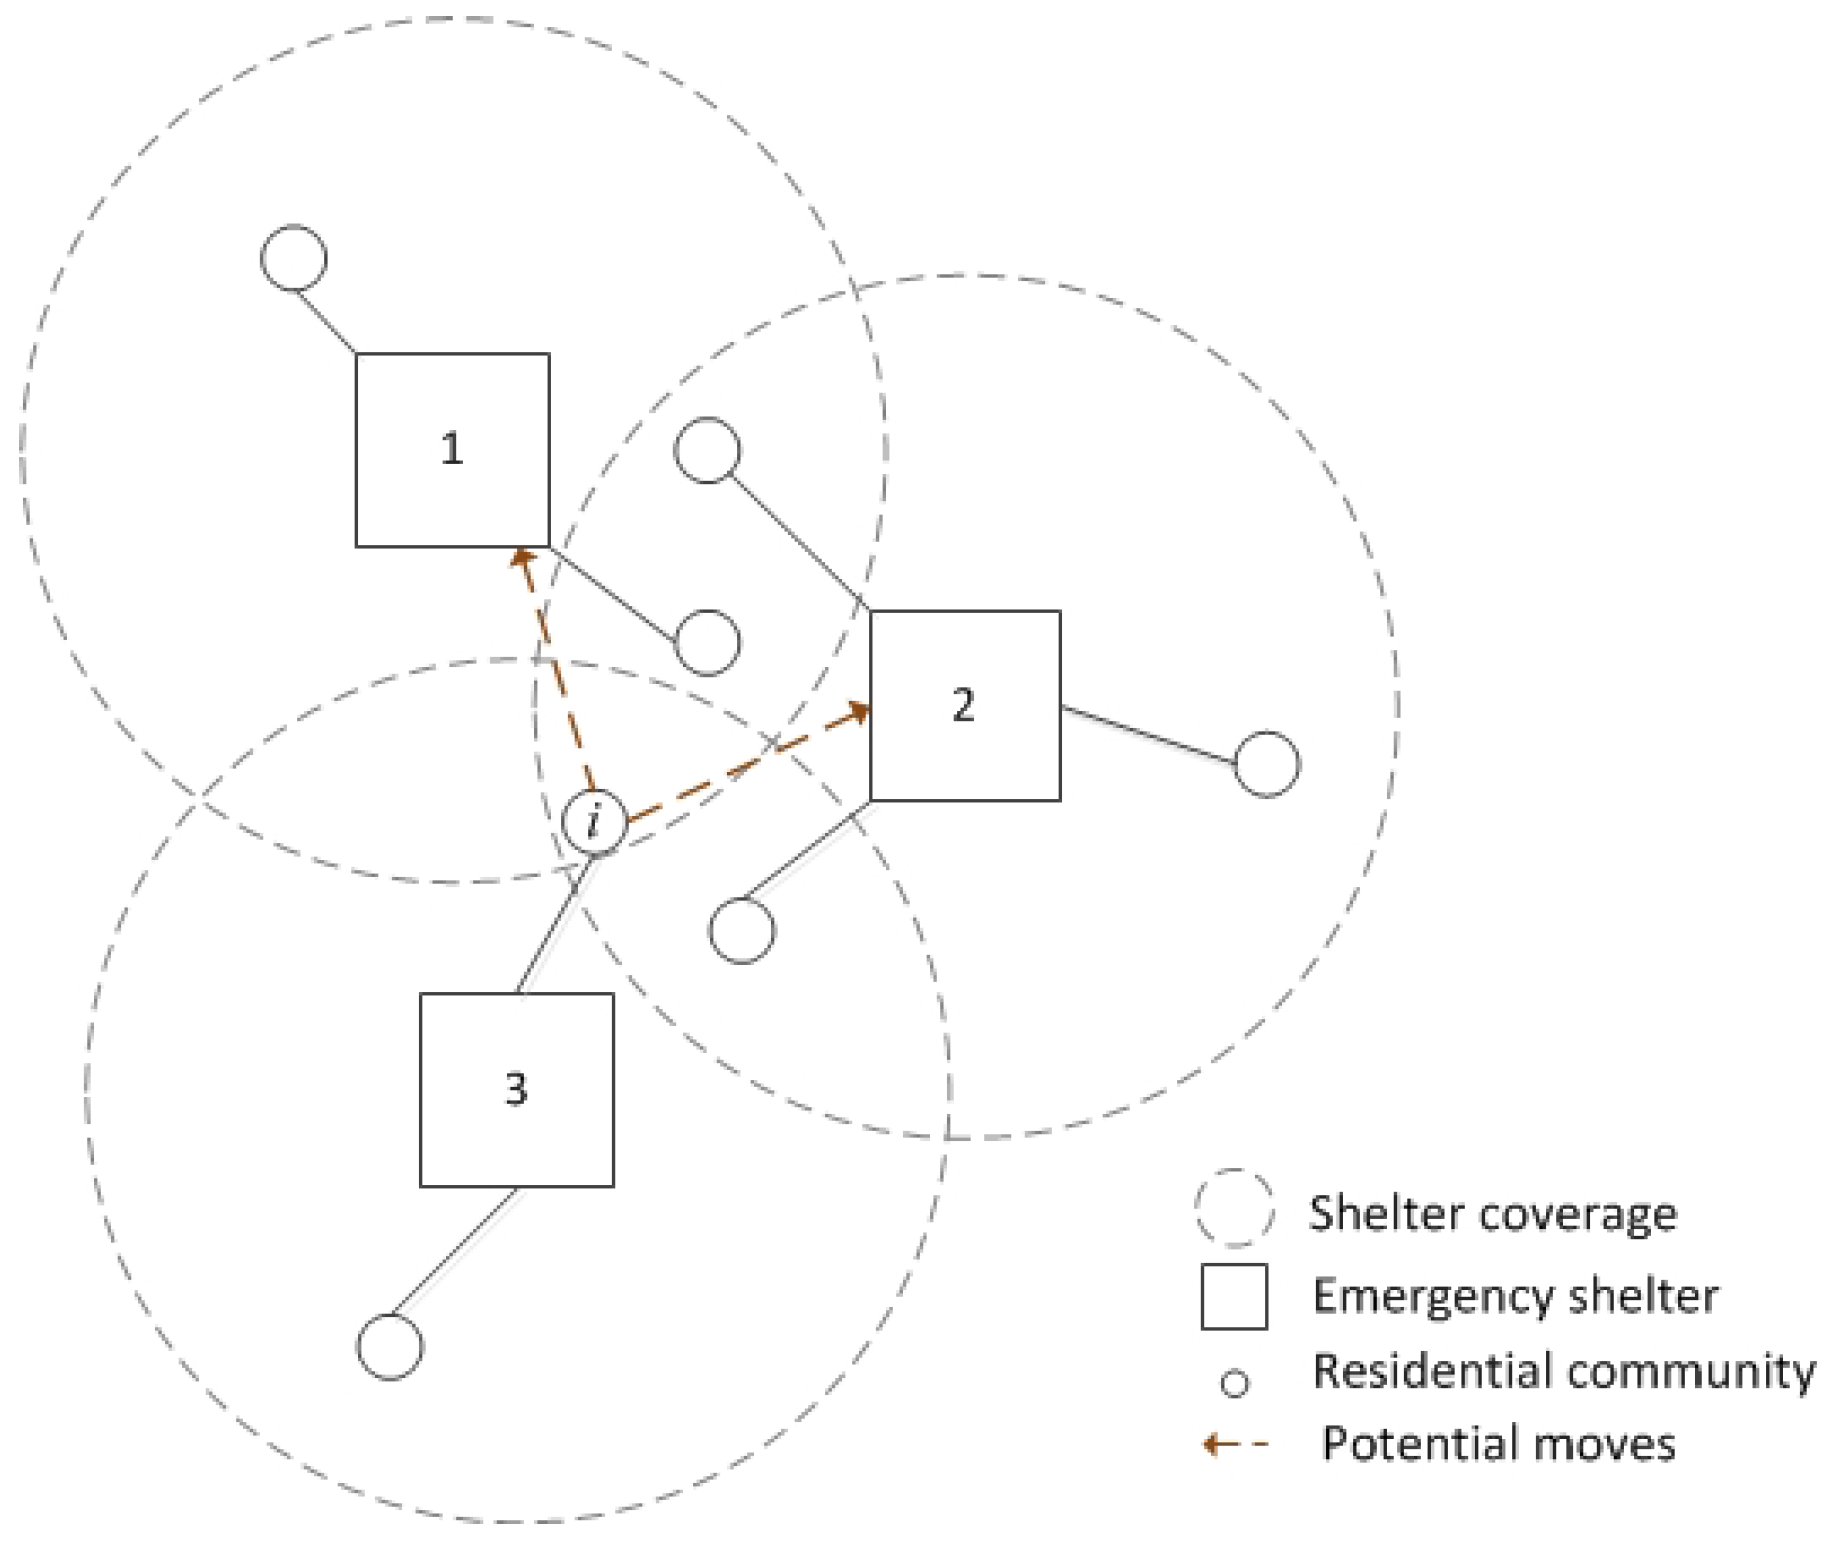
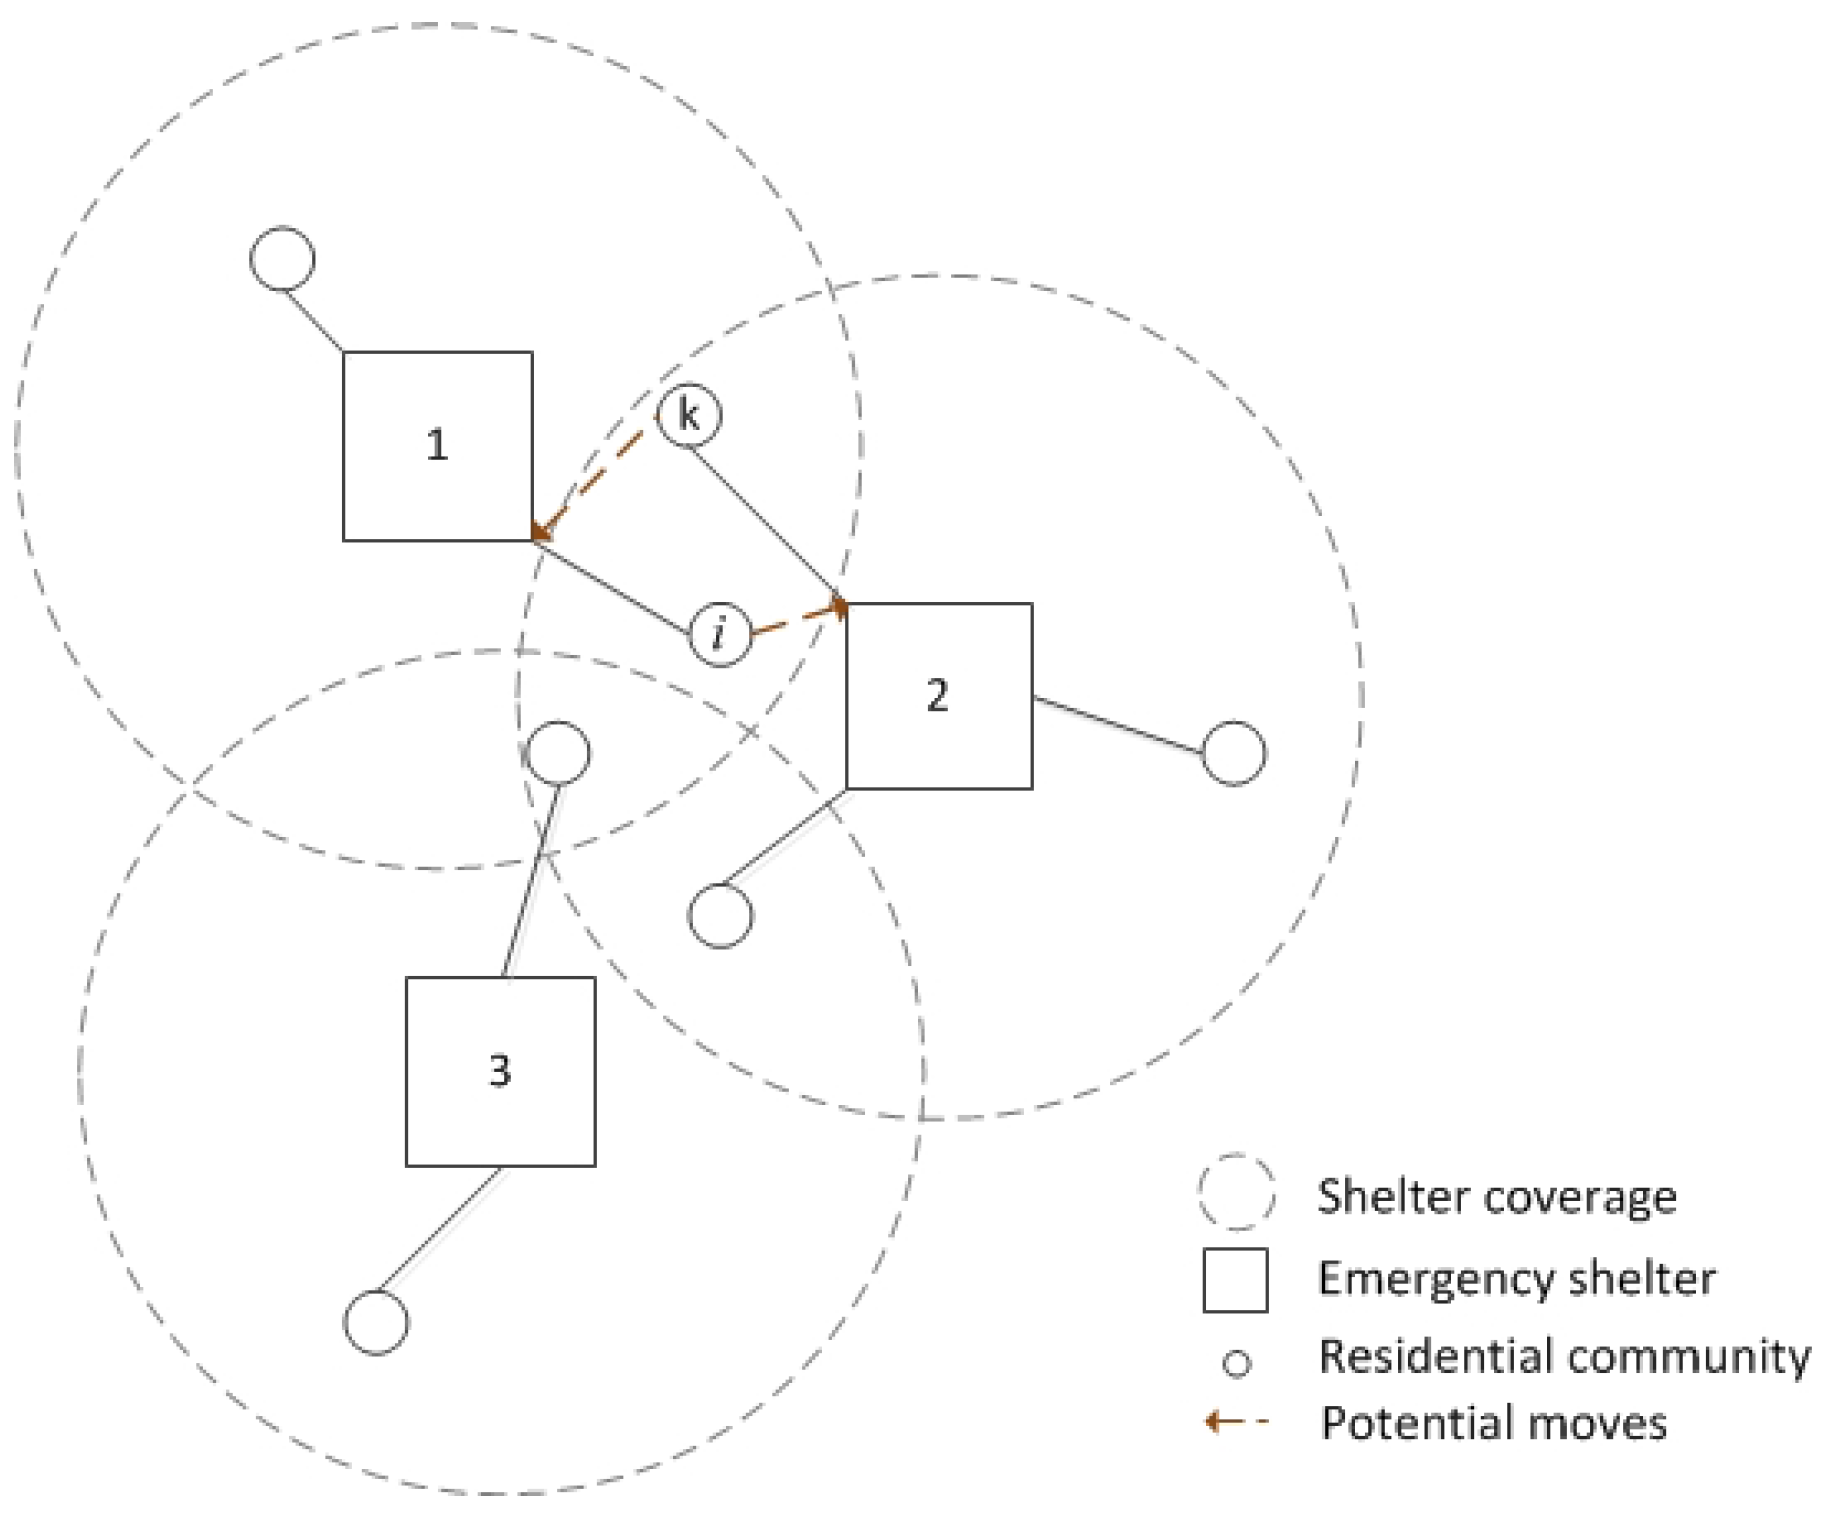
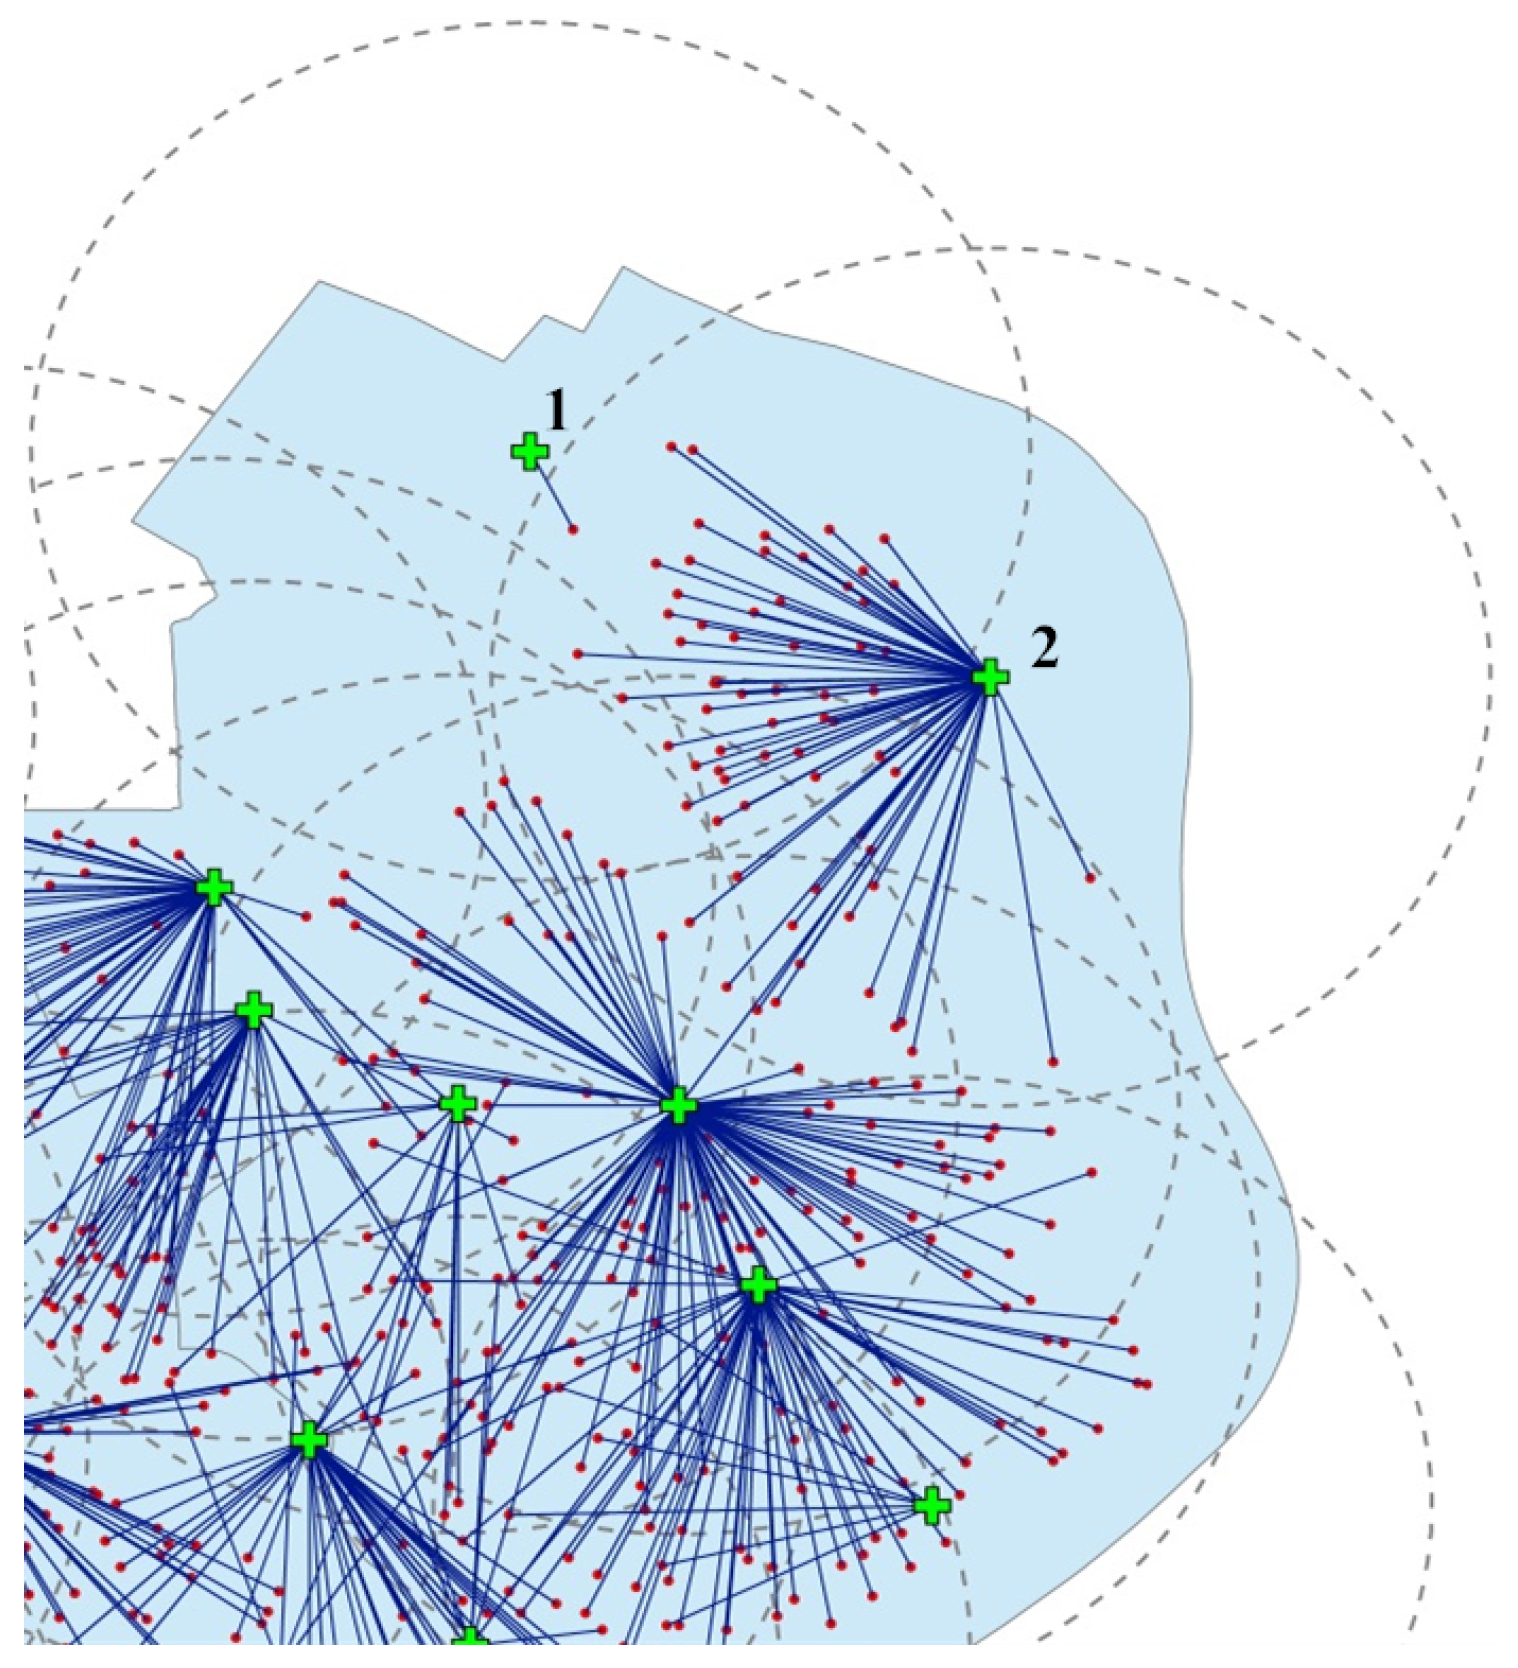
  • Improve the performance of the initial solution.
    Two “greedy” local search approaches (“insert” and “swap”) are applied to improve the initial solution. For each current solution, the entire neighbourhood is exploited. Hence, the best move is the one, over all possible moves, that provides the largest improvement. The insert is performed on the solution, followed by the swap. The insert operation is designed to move a community from one open shelter to another open shelter. As shown in Figure 4, demand i can be reassigned to one of two other shelters. The swap operation is designed to switch shelters for two communities. For example, in Figure 5, community j is assigned to shelter 1 and community k is assigned to shelter 2. After the swap move, communities j and k switch their shelters.
  • Output the allocation solutions.
    Repeat the insert and swap moves in Step 2 until the solution cannot be further improved by the local search.

4.3. Overall Solution Procedure

We call the hybrid cross-entropy method with a local search mechanism a cross-entropy/local-search (CE-LS) algorithm. The overall procedure is described as follows:
  • Initialization.
    (a)
    Set the values of the parameters: N, ρ , α , M a x i t e r (the maximum number of iterations, which usually is no more than 30), and p 0 (a s-dimensions vector is usually equal to ( 1 / 2 ) s ).
    (b)
    Let t = 0 .
  • Generate a sample population Y = { X 1 , , X N B e r n o u l l i ( p t ) } .
  • t = t + 1 , h = 1 .
  • Construct solutions.
    (a)
    Select the shelter location from the candidate sites.
    (b)
    Allocate shelter demand to the selected shelters location.
    (c)
    Apply the local search heuristic to improve the allocation of solutions with a positive penalty value.
    (d)
    h = h + 1 .
  • If h > N , go to Step 6. Otherwise, go to Step 4.
  • Sort Y in ascending order with respect to the performance function value. Select the best ρ N solutions from the sample population.
  • Compute p t + 1 using Equation (18).
  • If t > M a x i t e r , or p t + 1 converges, output the best solution and the corresponding allocation and stop. Otherwise, return to Step 2.

5. Results and Discussion
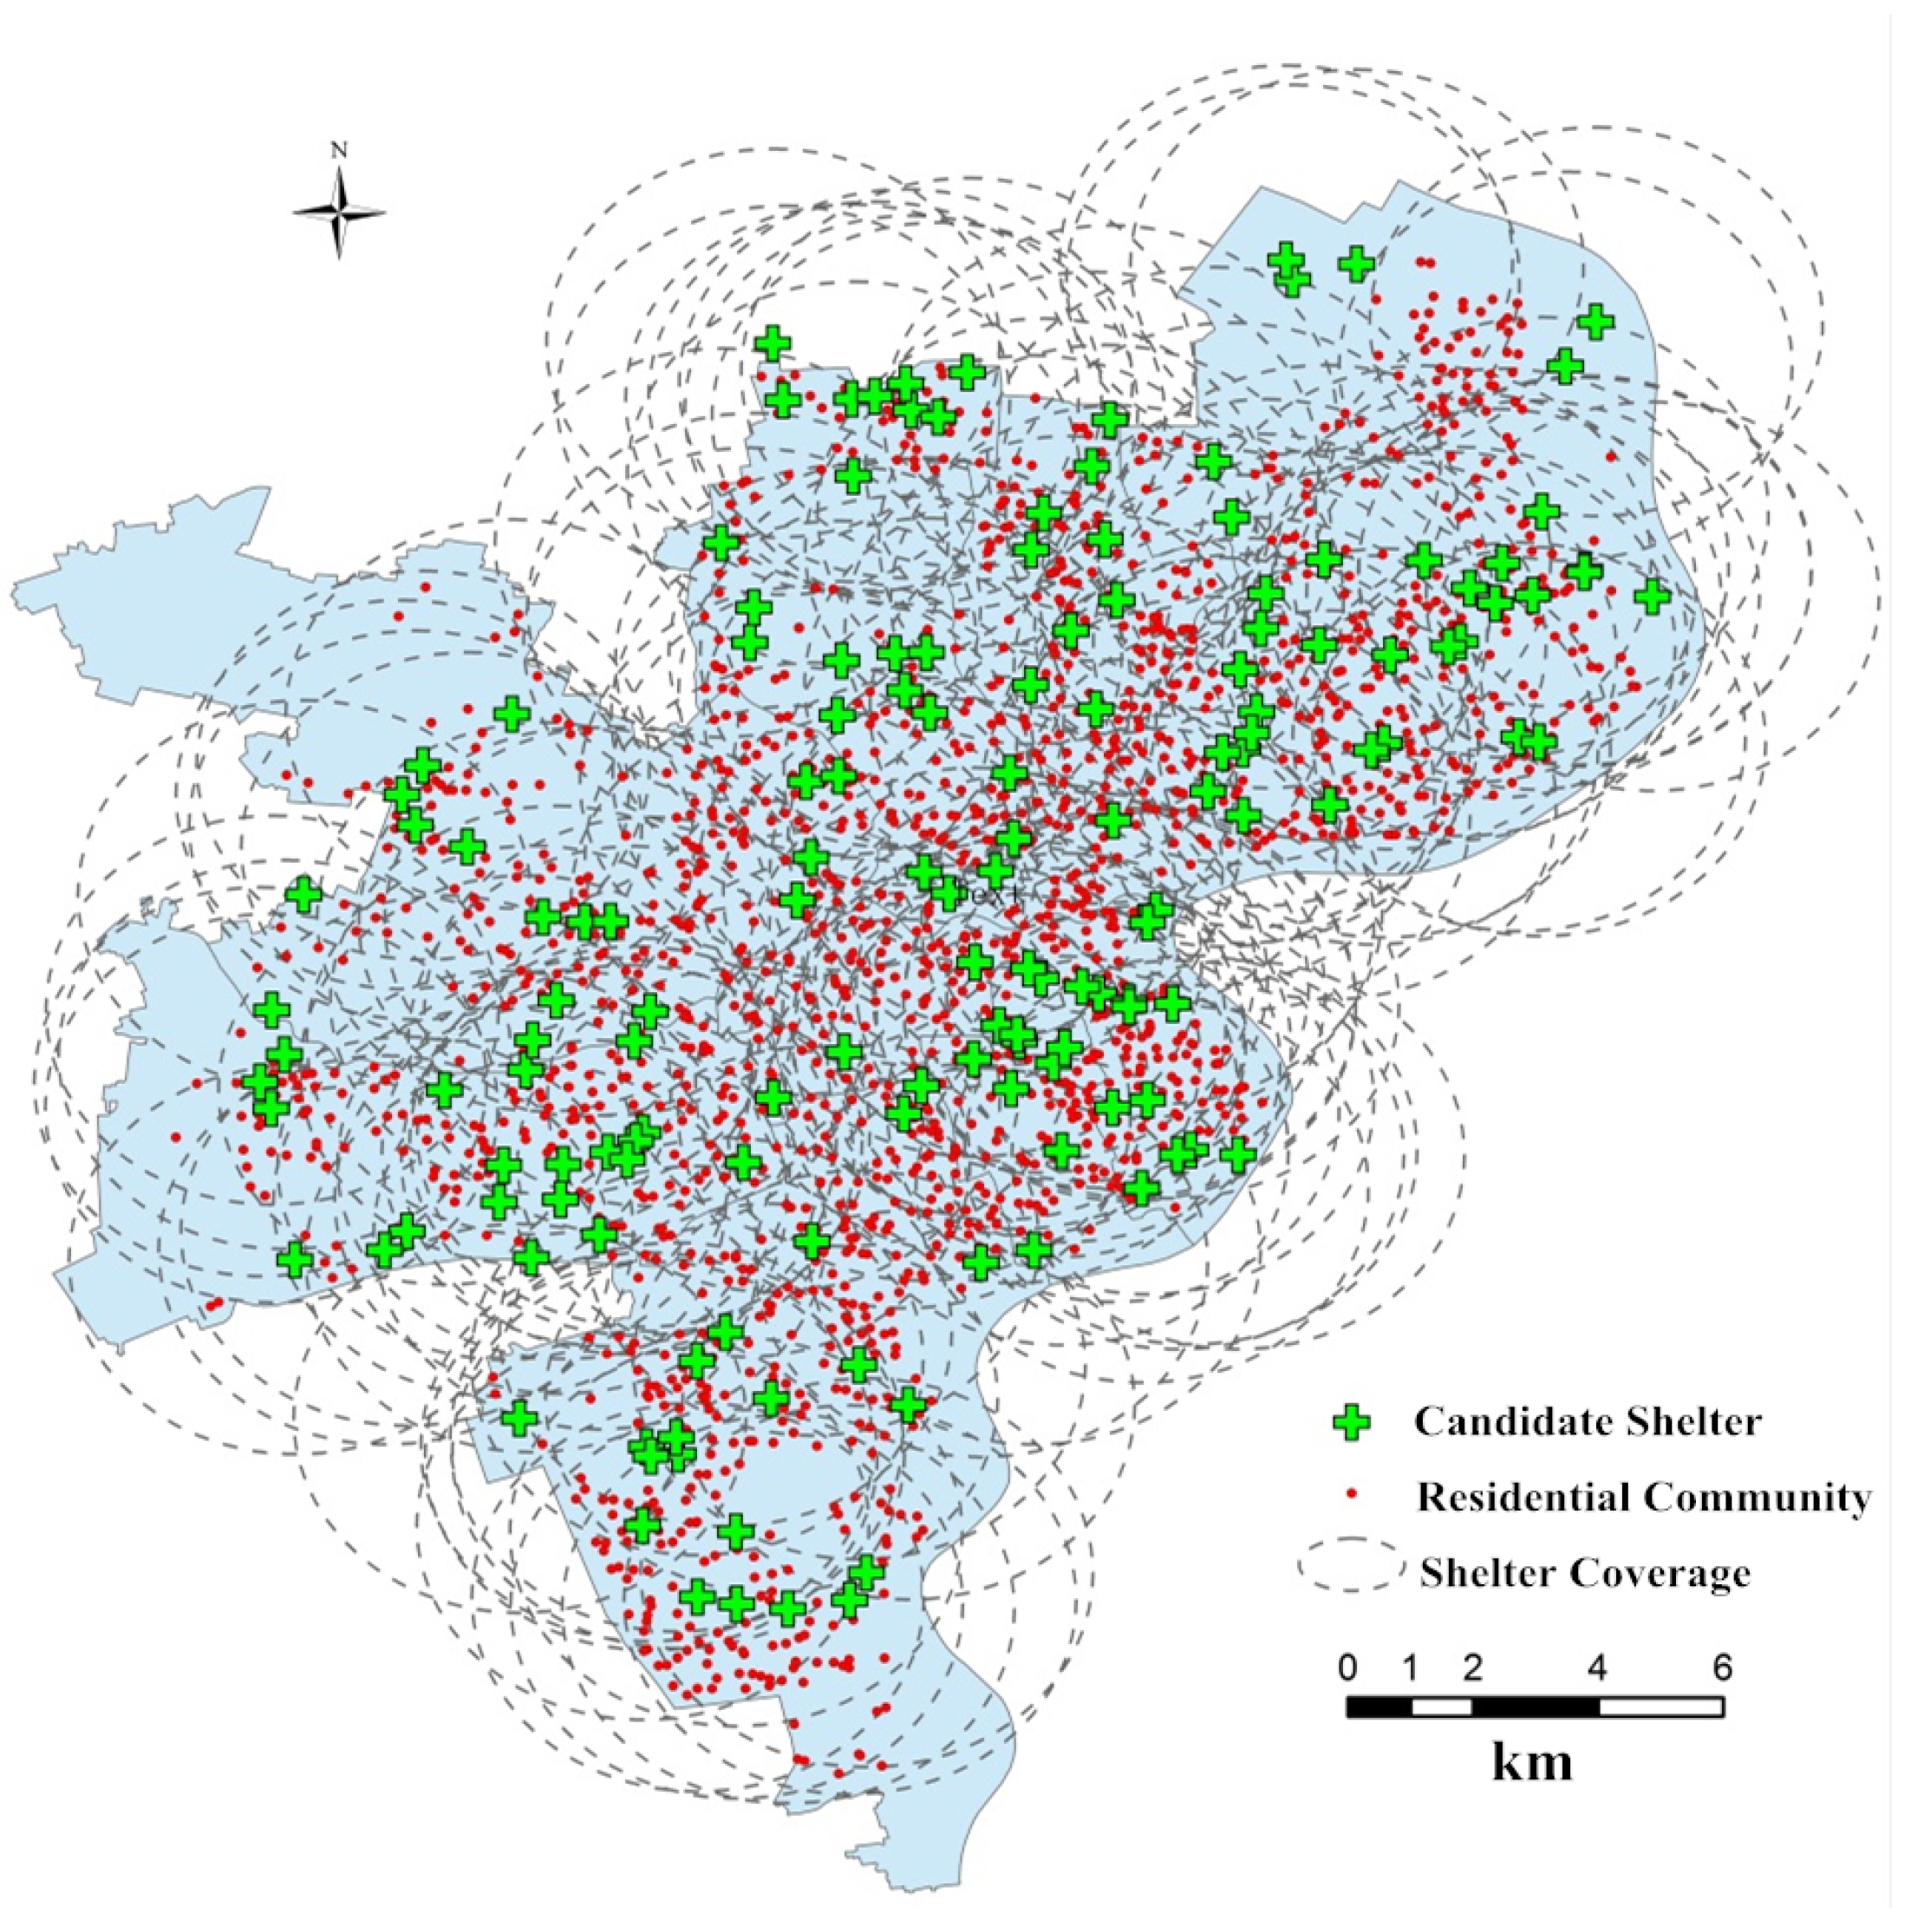
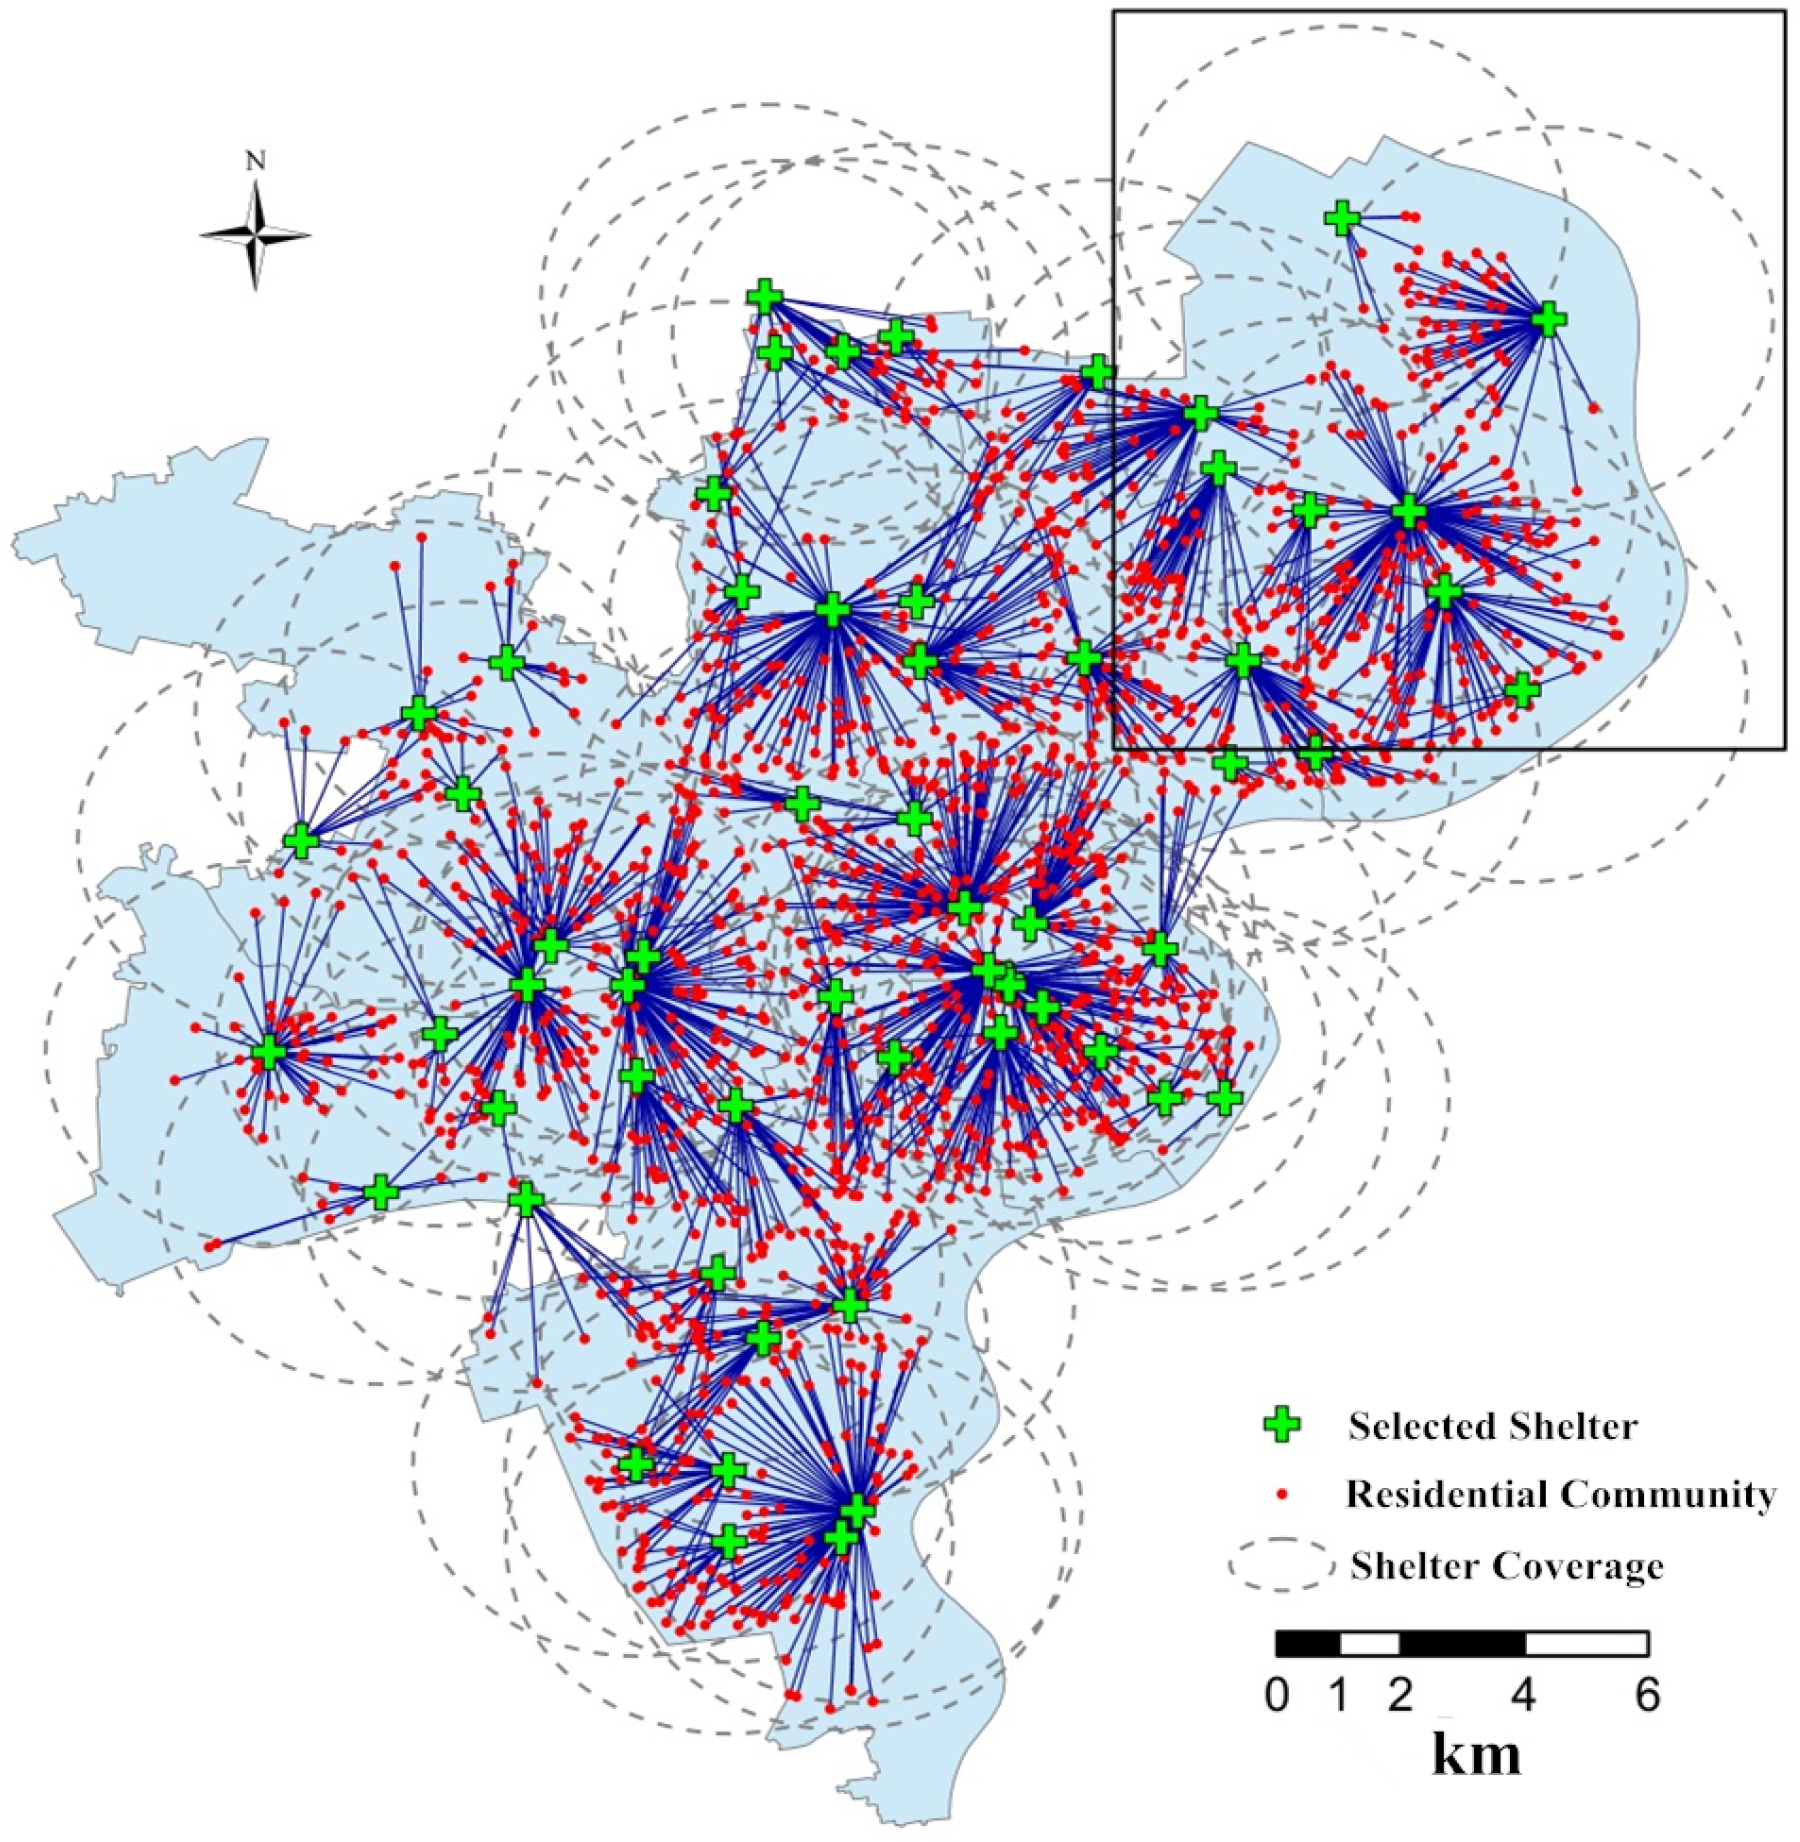
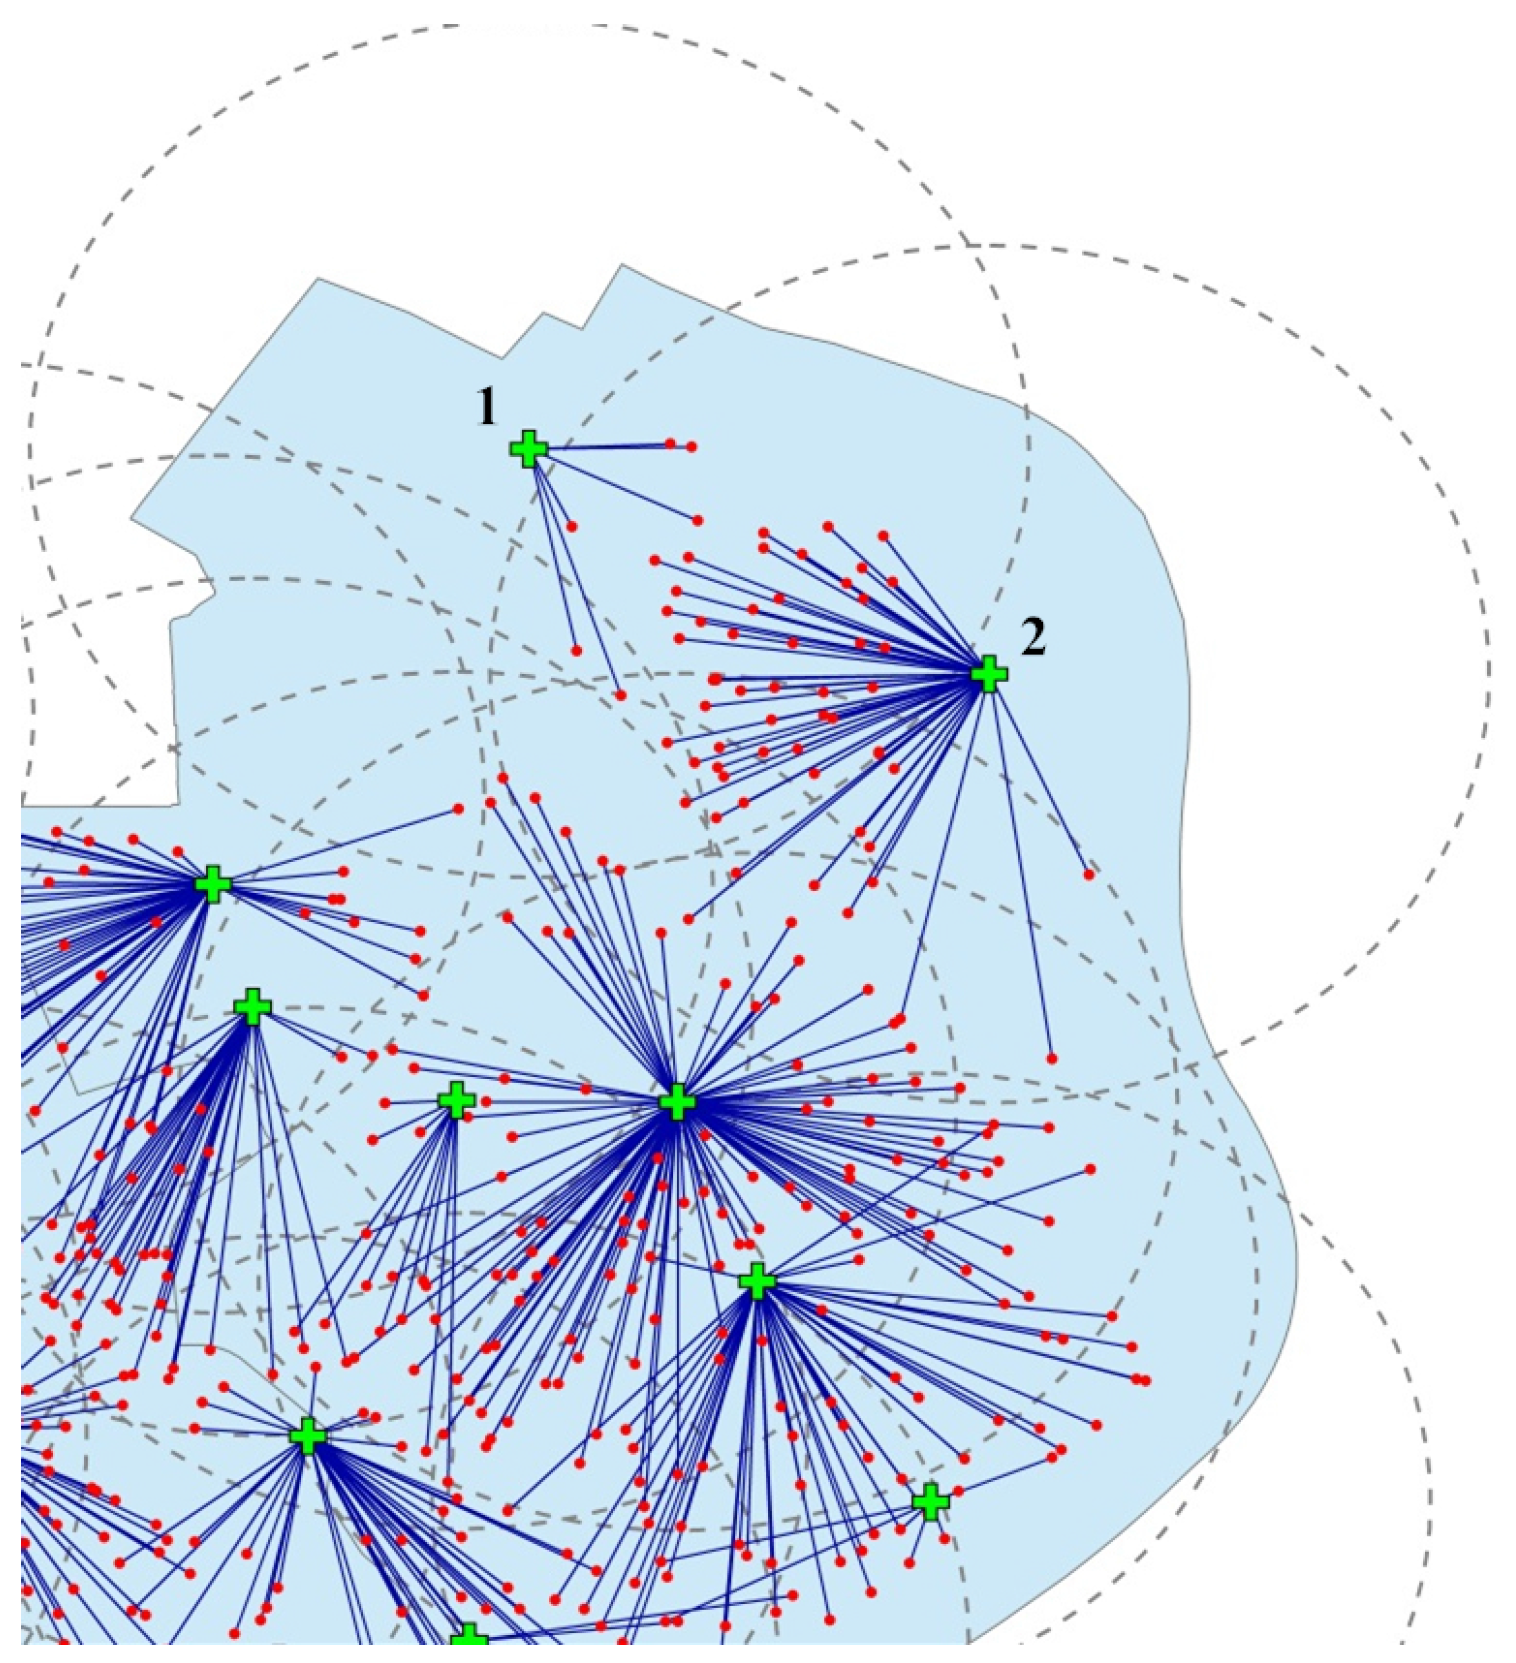
5.1. Study Area

Shanghai, which lies in the Yangtze River Delta of China’s eastern coast, is the largest city in China and a major financial center. It is a densely populated city with a highly developed economy and has a global influence. Although catastrophic earthquakes have rarely occurred, the area surrounding the city includes several faults where earthquakes have occurred. In addition, the city is built on a soft loess foundation that resists earthquakes poorly. If an earthquake occurs, the city will be at high risk of severe damage. Presently, only one long-term emergency shelter has been built in Shanghai, and it can provide refuge for only about 6000 people, which is far short of the predicted demand. Hence, it is necessary to plan and implement additional emergency shelters before an earthquake strikes the region. In the present study, we select central Shanghai, which comprises 8 administrative districts with a total area of 630 km 2 , for the case study. The total population is 11.4 million and the population density is about 18,000 persons/km 2 .

5.2. Data Preprocessing

Open spaces in the study area, such as public parks/green spaces and school playgrounds, can be viewed as candidate location for shelters. However, to avoid secondary damage to evacuees, open spaces with high risk, which are located less than 500 m away from earthquake fault zones or from disaster-prone areas such as gas stations and chemical factories, are excluded from the list of candidate shelters. After excluding these sites, we select a candidate set of 155 low-risk sites for shelters. These candidate sites can be divided into two main types: public parks/green spaces and schools. We use year 2011 data provided by the Shanghai Civil Defense Office to determine construction costs for different types of candidate sites. The corresponding results are shown in Table 1.
The population sizes of the residential communities are extracted from the Economic and Social Development Statistics Yearbook of Shanghai in 2010, and the longitude and latitude of each residential community are obtained using Google Earth. We identify a total of 1722 residential communities. Based on the analysis in Section 3.1, we predict the time-varying shelter demand for each residential community and the maximum shelter demand during the post-disaster period.
We define evacuation routes by digitizing a map of Shanghai’s central city. In version 10.1 of ArcGIS (ESRI, Redlands, USA), we use the actual evacuation routes to calculate the distances between shelters and communities using the OD Cost Matrix function of the Network Analysis module. According to the national norms of China for emergency shelter construction, the coverage radius of a shelter is set to 3 km. Figure 6 shows the resulting distribution of shelters and communities. The radius of coverage for each shelter is also depicted.
Using the data on the first day, the fourth day and the 30th day after an earthquake that is provided by the CDPC’s study, we determine the value of parameters that used in s h ( t ) and i n ( t ) : α 1 = 0.94 , β 1 = 0.15 , α 2 = 2 , β 2 = 3.5 . We use Equation (1) to predict the changing number of the people in shelters for the Xuhui District of Shanghai City in a scenario based on a hypothetical magnitude 7.0 earthquake. The available historical data on building condition and surveys of human evacuation behaviour [11,33] suggest the following parameter values: P = 1137795 , φ = 65 % , h 1 = 7.58 % , h 2 = 12.55 % , h 3 = 79.87 % , ω 1 = 100 % , and ω 2 = 50.3 % ; ω 3 ( t ) can be calculated by multiplying s h ( t ) by i n ( t ) during the post-disaster period. Figure 7 shows the time-varying shelter demand which is simulated based on these parameter values. The shelter demand peaks on fourth day after the earthquake, and decreases thereafter, reaching approximately one-third of the maximum demand after 30 days as the essential services are progressively restored.

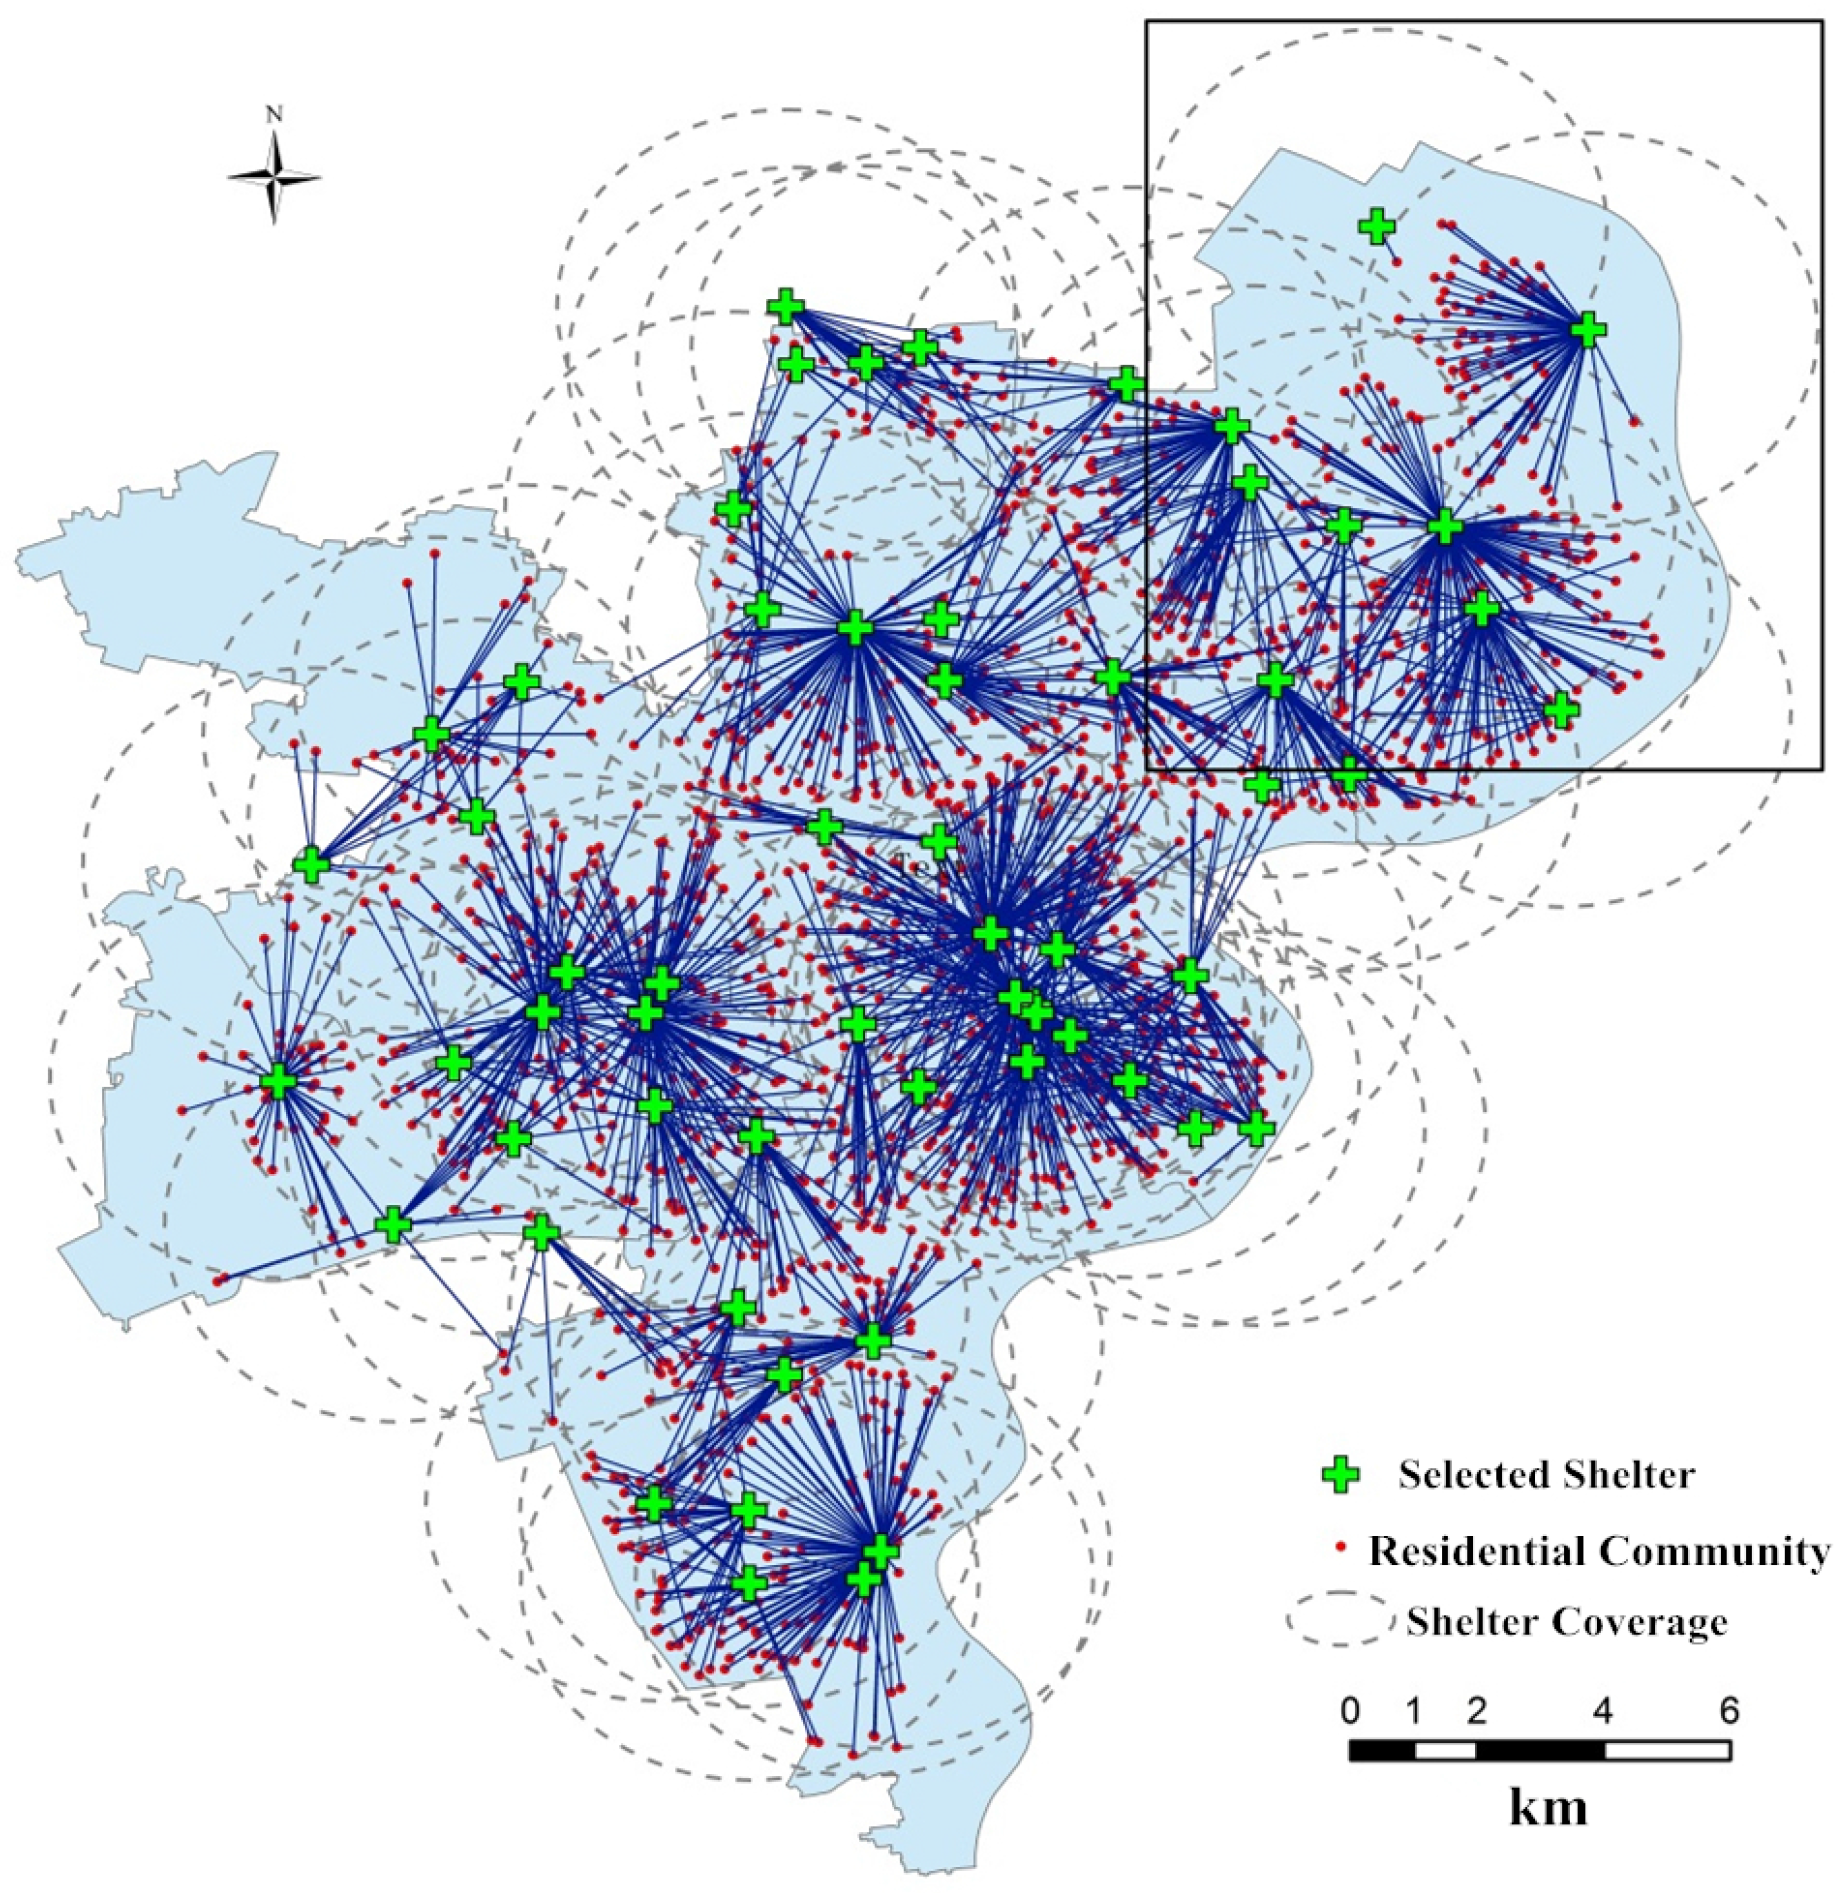
5.3. Results and Analysis

In our case study, we calculate the distance between 1722 residential communities and 155 candidate shelters. To solve the integrated location-allocation problem, we use the CE-LS algorithm to obtain the solutions in this case study. We use the following parameter values: N = 200 , ρ = 0.1 , α = 0.7 , M a x i t e r = 30 , and p 0 = ( 1 / 2 ) 155 (a vector with 155 dimensions). After running for 261 s, the algorithm selects 60 shelters from the candidate shelters, for a total construction cost of 48 million dollars and a total evacuation distance of 3,329,414 km. Figure 8 shows the shelters location and the corresponding evacuees’ allocation. Figure 9 shows details of one part of the study area. It is easy to see that some communities are not assigned to the nearest shelter (e.g., Shelter 1 only covers one residential community and some other communities within its coverage radius are allocated to Shelter 2, which is not the closest choice).
To improve the total evacuation distance for the IDP, we use the local search heuristic in Section 4.2 to optimize the allocation of evacuees (Figure 10). After running less than 10 min, the heuristic results in a total distance of 2,744,479 km, which represents a decrease of about 18 % compared with the original allocation result (3,329,414 km) of location model. The lines connecting the emergency shelters and residential communities are denser in Figure 8 than in Figure 10 because there are more intersections of the lines. This suggests that some residential communities are allocated to closer shelters without violating the capacity constraint. Comparing Figure 9 with the enlarged image in Figure 11 reveals that some residential communities that are originally allocated to Shelter 2 are reassigned to Shelter 1 based on the local search heuristic, which increase the occupancy of Shelter 1 and enables local communities to evacuate to a closer shelter during the post-disaster period.

5.4. Discussion

Setting parameters associated with the integrated location-allocation model is based on the case of Shanghai. However, a relevant sensitivity analysis for parameters should be performed when the model is applied to other cities. In order to implement the sensitivity analysis according to practice in the real world, two kinds of cities will be discussed: cities with low seismic resistance and cities with high seismic resistance. People living in low seismic resistance cities prefer to choose to evacuate after an earthquake occurs, because their houses cannot provide safe places for them to recover. In this scenario, ω 2 will be set higher than 60% and ω 3 ( t ) will be set high at the early time during evacuation period. People living in high seismic resistance cities prefer to stay in their houses after an earthquake occurs, because their houses are functional enough to protect them. In this scenario, ω 2 will be set lower than 40% and ω 3 ( t ) will be set low at the early time during evacuation period. Parameter ω 1 is set to 100% for both types of cities because the completely destroyed houses are considered unsuitable for living. In this paper, we simulate these two kinds of cities based on the data of Shanghai. The corresponding results obtained for different parameter settings are shown in Table 2.
Earthquakes occur irregularly and suddenly, so no one can tell when the next earthquake will strike. Moreover, it is difficult to accurately predict the degree of damage made by an earthquake and evacuees’ behavior under emergency scenarios. Therefore, uncertainties caused by earthquakes must be acknowledged when decision makers determine the locations of shelters and allocations of evacuees. The integrated location-allocation model proposed in this paper cannot tell the whole story about the post-earthquake. We conducted parameter analysis for ω 1 , ω 2 and ω 3 ( t ) to partly deal with uncertainties on the degree of damage caused by earthquakes and evacuees’ behavior. Other uncertainties such as the influence of rumors on human behavior during the period of evacuation can be further studied in future research. The level of uncertainties of our model may affect the solution. For example, once the locations of shelters are decided, they will not be changed for many years. However, the number and distribution of population may change in next few years. In order to reduce the impact of this fluctuation, we can use some forecast methods such as time series analysis based on historical data. The integrated modeling approach is an important reference for decision makers, which can provide a starting point for emergency shelters planning in resilient cities. Local government can use the location model to select the sites of shelters with less total construction cost and use the allocation model to make an evacuation planning with less total evacuation distance for evacuees. The integrated location-allocation model can help decision makers save cost and reduce risk simultaneously.
Some assumptions used in our model may not reflect real-world scenarios. The evacuees may not follow the paths recommended by government during evacuation period. Therefore, government need rehearse residents in preparedness phase when the evacuation routes are determined in urban shelters planning. If a community covers a large area, then the assumption that its population is concentrated at its center might not be appropriate. Of course, large communities can be divided into small sub-communities and the previous assumption can be used in small sub-communities. However, too many small sub-communities make the problem intractable. A trade-off has to be made in this dilemma.
When the CE-LS algorithm developed in this study is employed to tackle large-scale problems, it may encounter some computational limitations. For example, it takes about 10 min to obtain a solution for the case in the central area of Shanghai. However, it takes much longer time to deal with larger scale cases. Moreover, the accuracy of the CE-LS algorithm needs to be discussed since it is not an exact solution method. We find that the gap between the solution obtained by the CE-LS algorithm and the optimal solution obtained by commercial solver ILOG CPLEX is narrow for small and medium-scale problems. Because ILOG CPLEX cannot find optimal solutions to large-scale problems, the accuracy of the CE-LS algorithm needs to be further studied.

6. Conclusions

The main merit of this research lies in introducing a time-varying shelter demand analysis to a location-allocation model for emergency management. Previous researchers treated shelter demand as invariant and only considered the condition of a resident’s house after the disaster. We consider both these conditions and human choices related to intolerance towards a loss of services, and then propose a time-varying shelter demand prediction model on this basis. The model that solves the shelter location problem not only considers both the coverage radius of each shelter and its capacity, but also minimizes the cost of building emergency shelters. Because some residential communities are not allocated to their closest shelters in the location model, we propose an allocation model to reduce the total evacuation distance. The allocation model’s objective is to allocate residential communities to their closest shelters without violating the capacity constraint. The integrated location-allocation model for emergency shelters introduced in this paper reduces the risk for evacuees through determining optimal locations of emergency shelters and thus enhances urban resilience.
The large number of candidate shelters and residential communities in a real-world application renders it impossible to find an optimal solution in a reasonable time using the commercial solvers. Instead, we solve the complicated shelter location-allocation problem with a novel CE-LS algorithm. When applied to the case study of Shanghai’s central districts, the improved allocation decreases the total evacuation distance by 18 % compared to the original allocation scheme in the location model. Therefore, our algorithm is an effective tool for planning the number and location of emergency shelters.
Considering the time-varying shelter demand in the urban emergency shelter planning has distinct policy implications. It cannot only estimate the potential loss that a city might face in an earthquake, but also help the emergency manager to plan emergency shelters based on human behaviour rather than on the structural loss only. Moreover, using the location and allocation models as guidance for the urban emergency shelters planning can help the government save construction costs and enable residents to find shelters quickly. In addition, our hybrid CE-LS algorithm can also be applied to solve other complex geographic optimization problems, such as the allocation of disaster supplies and other problems related to the location of emergency facilities. However, it is important to note that proactive determination of shelters location cannot completely compensate for the unpredictability of human behaviour (e.g., the herd effect) in emergency situations, particularly given that miscommunication inevitably arises during the post-disaster period. Since people have diverse post-disaster needs, it is impossible to satisfy them by emergency shelters only. Other types of emergency facilities (e.g., hospitals, emergency supply warehouses) need to be considered together with emergency shelters to construct an effective emergency system. In the end, these operational details should be further explored in order to lessen potential risks of a natural disaster in a real-world situation.

Acknowledgments

This study is supported by grants from the National Natural Science Foundation of China (Project No. 71373155), the Shanghai Pujiang Program (Project No. 14PJC073) and the Shanghai Technological Innovation Project (Project Nos. 17DZ1203300, 17DZ1203302).

Author Contributions

Laijun Zhao led the research from design of the research question, engagement of institutions and experts for conducting the research; Huiyong Li conducted the primary research and analytical tasks; Rongbing Huang provided valuable research insights into the analysis; Qingmi Hu performed the algorithm experiments; Jiajia Wang and Fei Gao collected and analyzed the data; Huiyong Li and Rongbing Huang wrote the paper; Huiyong Li and Yan Sun revised paper.

Conflicts of Interest

The authors declare no conflict of interest.

References

  1. Altay, N.; Green, W.G., III. OR/MS research in disaster operations management. Eur. J. Oper. Res. 2006, 175, 475–493. [Google Scholar] [CrossRef]
  2. Galindo, G.; Batta, R. Review of recent developments in OR/MS research in disaster operations management. Eur. J. Oper. Res. 2013, 230, 201–211. [Google Scholar] [CrossRef]
  3. Klein, R.J.T.; Nicholls, R.J.; Thomalla, F. Resilience to natural hazards: How useful is this concept? Glob. Environ. Chang. Part B Environ. Hazards 2003, 5, 35–45. [Google Scholar] [CrossRef]
  4. Meerow, S.; Newell, J.P.; Stults, M. Defining urban resilience: A review. Landsc. Urban Plan. 2016, 147, 38–49. [Google Scholar] [CrossRef]
  5. Romero-Lankao, P.; Gnatz, D.M.; Wilhelmi, O.; Hayden, M. Urban Sustainability and Resilience: From Theory to Practice. Sustainability 2016, 8, 1224. [Google Scholar] [CrossRef]
  6. Bozza, A.; Asprone, D.; Fabbrocino, F. Urban Resilience: A Civil Engineering Perspective. Sustainability 2017, 9, 103. [Google Scholar] [CrossRef]
  7. Kulshrestha, A.; Wu, D.; Lou, Y.; Yin, Y. Robust Shelter Locations for Evacuation Planning with Demand Uncertainty. J. Transp. Saf. Secur. 2011, 3, 272–288. [Google Scholar] [CrossRef]
  8. Verma, A.; Gaukler, G.M. Pre-positioning disaster response facilities at safe locations: An evaluation of deterministic and stochastic modeling approaches. Comput. Oper. Res. 2015, 62, 197–209. [Google Scholar] [CrossRef]
  9. Yin, Z.; Li, S.; Zhao, Z.; Yang, S. Earthquake disaster forecast and earthquake disaster rank. China Earthq. 1991, 7, 9–19. (In Chinese) [Google Scholar]
  10. Khazai, B.; Daniell, J.; Franchin, P.; Cavalieri, F.; Vangelsten, B.; Lervolino, L.; Esposito, S. A New Approach to Modeling Post-Earthquake Shelter Demand: Integrating Social Vulnerability in Systemic Seismic Vulnerability Analysis. In Proceedings of the 15th World Conference on Earthquake Engineering, Lisbon, Portugal, 24–28 September 2012; pp. 2105–2115. [Google Scholar]
  11. Wang, J.; Zhao, L.; Wang, K.; Ma, T.; Ni, J. Necessity Analysis and Human Factor Aspect in Building Emergency Shelters for Earthquake Disasters. Ind. Eng. J. 2013, 1, 9–24. (In Chinese) [Google Scholar]
  12. Johnson, C. Strategic planning for post-disaster temporary housing. Disasters 2007, 31, 435–458. [Google Scholar] [CrossRef] [PubMed]
  13. Liu, Q.; Ruan, X.; Shi, P. Selection of emergency shelter sites for seismic disasters in mountainous regions: Lessons from the 2008 Wenchuan Ms 8.0 Earthquake, China. J. Asian Earth Sci. 2011, 40, 926–934. (In Chinese) [Google Scholar] [CrossRef]
  14. Owen, S.H.; Daskin, M.S. Strategic facility location: A review. Eur. J. Oper. Res. 1998, 111, 423–447. [Google Scholar] [CrossRef]
  15. Daskin, M.S. Network and Discrete Location: Models, Algorithms, and Applications; John Wiley & Sons: New York, NY, USA, 1995. [Google Scholar]
  16. Alçada-Almeida, L.; Tralhão, L.; Santos, L.; Coutinho-Rodrigues, J. A Multiobjective Approach to Locate Emergency Shelters and Identify Evacuation Routes in Urban Areas. Geogr. Anal. 2009, 41, 9–29. [Google Scholar] [CrossRef]
  17. Huang, R.; Kim, S.; Menezes, M. Facility location for large-scale emergencies. Ann. Oper. Res. 2010, 181, 271–286. [Google Scholar] [CrossRef]
  18. Murali, P.; Ordóñez, F.; Dessouky, M.M. Facility location under demand uncertainty: Response to a large-scale bio-terror attack. Socio-Econ. Plan. Sci. 2012, 46, 78–87. [Google Scholar] [CrossRef]
  19. Li, A.C.; Nozick, L.; Xu, N.; Davidson, R. Shelter location and transportation planning under hurricane conditions. Transp. Res. Part E Logist. Transp. Rev. 2012, 48, 715–729. [Google Scholar] [CrossRef]
  20. Gutjahr, W.J.; Dzubur, N. Bi-objective bilevel optimization of distribution center locations considering user equilibria. Transp. Res. Part E Logist. Transp. Rev. 2016, 85, 1–22. [Google Scholar] [CrossRef]
  21. Chen, Z.; Chen, X.; Li, Q.; Chen, J. The temporal hierarchy of shelters: A hierarchical location model for earthquake-shelter planning. Int. J. Geogr. Inf. Sci. 2013, 27, 1612–1630. [Google Scholar] [CrossRef]
  22. Paul, J.A.; MacDonald, L. Location and capacity allocations decisions to mitigate the impacts of unexpected disasters. Eur. J. Oper. Res. 2016, 251, 252–263. [Google Scholar] [CrossRef]
  23. Huang, B.; Liu, N.; Chandramouli, M. A GIS supported Ant algorithm for the linear feature covering problem with distance constraints. Decis. Support Syst. 2006, 42, 1063–1075. [Google Scholar] [CrossRef]
  24. Saadatseresht, M.; Mansourian, A.; Taleai, M. Evacuation planning using multiobjective evolutionary optimization approach. Eur. J. Oper. Res. 2009, 198, 305–314. [Google Scholar] [CrossRef]
  25. Ng, M.; Park, J.; Waller, S.T. A Hybrid Bilevel Model for the Optimal Shelter Assignment in Emergency Evacuations. Comput. Aided Civ. Infrastruct. Eng. 2010, 25, 547–556. [Google Scholar] [CrossRef]
  26. Kılcı, F.; Kara, B.Y.; Bozkaya, B. Locating temporary shelter areas after an earthquake: A case for Turkey. Eur. J. Oper. Res. 2015, 243, 323–332. [Google Scholar] [CrossRef]
  27. Pérez-Galarce, F.; Canales, L.J.; Vergara, C.; Candia-Véjar, A. An optimization model for the location of disaster refuges. Socio-Econ. Plan. Sci. 2017, 59, 56–66. [Google Scholar] [CrossRef]
  28. Wright, K.; Johnston, D. Post-earthquake sheltering needs: How loss of structures and services affects decision making for evacuation. In Proceedings of the 2010 New Zealand Society for Earthquake Engineering Conference, Wellington, New Zealand, 26–28 March 2010; pp. 21–23. [Google Scholar]
  29. Sheu, J.B.; Pan, C. A method for designing centralized emergency supply network to respond to large-scale natural disasters. Transp. Res. Part B Methodol. 2014, 67, 284–305. [Google Scholar] [CrossRef]
  30. Rubinstein, R. The Cross-Entropy Method for Combinatorial and Continuous Optimization. Methodol. Comput. Appl. Probab. 1999, 1, 127–190. [Google Scholar] [CrossRef]
  31. Caserta, M.; Rico, E.Q. A Cross Entropy-Based Metaheuristic Algorithm for Large-Scale Capacitated Facility Location Problems. J. Oper. Res. Soc. 2009, 60, 1439–1448. [Google Scholar] [CrossRef]
  32. De Boer, P.T.; Kroese, D.; Mannor, S.; Rubinstein, R. A Tutorial on the Cross-Entropy Method. Ann. Oper. Res. 2005, 134, 19–67. [Google Scholar] [CrossRef]
  33. Gismondi, M.; Huisman, O. Spatio-temporal behaviour after an earthquake: A case study of Kawaguchi town, Japan. Disaster Prev. Manag. Int. J. 2012, 21, 370–385. [Google Scholar] [CrossRef]
Figure 1. Calculation process for determining the time-varying shelter demand.
Sustainability 09 02098 g001
Figure 2. Illustration of how the magnitude of the shortage of essential services, s h ( t ) , the intolerance degree, i n ( t ) , and the proportion of the people with an intact house who choose to evacuate outside their houses, ω 3 ( t ) , vary with time.
Sustainability 09 02098 g002
Figure 3. Communities might not be allocated to their closest shelters in the original location model.
Sustainability 09 02098 g003
Figure 4. Illustration of the insert move.
Sustainability 09 02098 g004
Figure 5. Illustration of the swap move.
Sustainability 09 02098 g005
Figure 6. Distribution map of candidate shelters, their radius of coverage, and the residential communities.
Sustainability 09 02098 g006
Figure 7. Changes in the number of shelter demand after a hypothetical earthquake in Shanghai’s Xuhui District.
Sustainability 09 02098 g007
Figure 8. Map of the shelters location and of the allocation of shelter demand based on the radius of coverage of the shelters. Figure 9 provides an enlarged view of the area within the black rectangle.
Sustainability 09 02098 g008
Figure 9. Enlarged view of the area within the black rectangle in Figure 8.
Sustainability 09 02098 g009
Figure 10. Map of shelters location and the optimal allocation of residential communities based on the local-search algorithm. Figure 11 shows an enlargement of the area within the black rectangle.
Sustainability 09 02098 g010
Figure 11. Enlargement of the area within the black rectangle in Figure 10.
Sustainability 09 02098 g011
Table 1. Construction cost for different types of emergency shelter candidate sites.
TypeCapacity ( × 10 3 Persons)Setup Cost ( × 10 5 USD)
Public parks/green spaces≤106.7
(10, 30]8.3
(30, 50]10
≥5013
Schools≤53.3
(5, 15]5
(15, 20]6.7
≥208.3
Table 2. Results of different parameter settings for two types of cities.
Type ω 1 ω 2 ω 3 ( t ) Construtction Cost ( × 10 6 USD)Evacuation Distance (km)
Low seismic resistance 100 % 60 % α 1 = 0.85553,246,485
α 2 = 2.5
β 1 = 0.2
β 2 = 4
  High
  seismic
  resistance
100 % 40 % α 1 = 0.95392,384,532
α 2 = 1.5
β 1 = 0.1
β 2 = 3

