Article

Using Microsimulation to Evaluate Safety and Operational Implications of Newer Roundabout Layouts for European Road Networks

1
Faculty of Engineering and Architecture, University of Enna Kore, Viale delle Olimpiadi, 94100 Enna, Italy
2
Department of Civil Engineering, Ryerson University, 350 Victoria Street, Toronto, ON M5B2K3, Canada
*
Author to whom correspondence should be addressed.
Sustainability 2017, 9(11), 2084; https://doi.org/10.3390/su9112084
Submission received: 8 September 2017 / Revised: 23 October 2017 / Accepted: 3 November 2017 / Published: 13 November 2017

Abstract

:
“Standard” roundabouts, for example those designed in some European countries, can often be characterized by low levels of safety or capacity and a high degree of sustainability. Given the proliferation of newer layouts, it is of interest to explore whether design practices could be improved by capitalizing on the experience gained internationally. Operational aspects of some of these designs have been explored previously, but there is a need to compare both the operational and safety performance of new designs to that of standard roundabouts. The objective of this paper is to evaluate the safety and operational implications of various potential alternatives to the standard roundabouts that proliferate in Europe and elsewhere. Microsimulation is used to simulate traffic operations at roundabout layout alternatives at the same levels of volume to capacity (V/C) ratio and also with the same traffic flow. Operational performance measures include the common level of service parameters, while measures of safety are based initially on time to collision (TTC) values. Threshold values of TTC were then applied in defining conflicts that are used for crash-based safety evaluation by applying crash-conflict models estimated in published research. Interesting insights were revealed, suggesting that the newer layouts should be considered where warranted by cost-benefit considerations.

1. Introduction

In the last decade, new roundabout types of great practical interest from a sustainability perspective have been designed or proposed to overcome some of the problems related to average speed, level of service, conflict points, and crashes that arise with standard roundabouts. The alternatives of interest for this paper are turbo roundabouts, flower roundabouts, and target roundabouts. Such intersections offer potential safety benefits and, under certain traffic conditions, have been shown to provide higher capacity and better operation than equivalent standard roundabouts.
The objective of this paper is to evaluate the safety and operational implications of various potential alternatives to standard roundabout layouts that proliferate in Italy and elsewhere. Building on previous research where the issue of alternative roundabouts was investigated [1,2], microsimulation is used to simulate traffic operations at roundabouts with standard and newer layouts at various levels of traffic volume. Performance measures include emissions and level of service, as well as measures of safety, including conflicts and speeds, both estimated from trajectories generated in the microsimulation. Microscopic traffic simulation has the potential to provide a safe and flexible test environment for the a priori estimation of traffic safety and performance effects brought about by new and alternative designs and other safety-influencing factors that are related to the roadway, road-users, and vehicles.

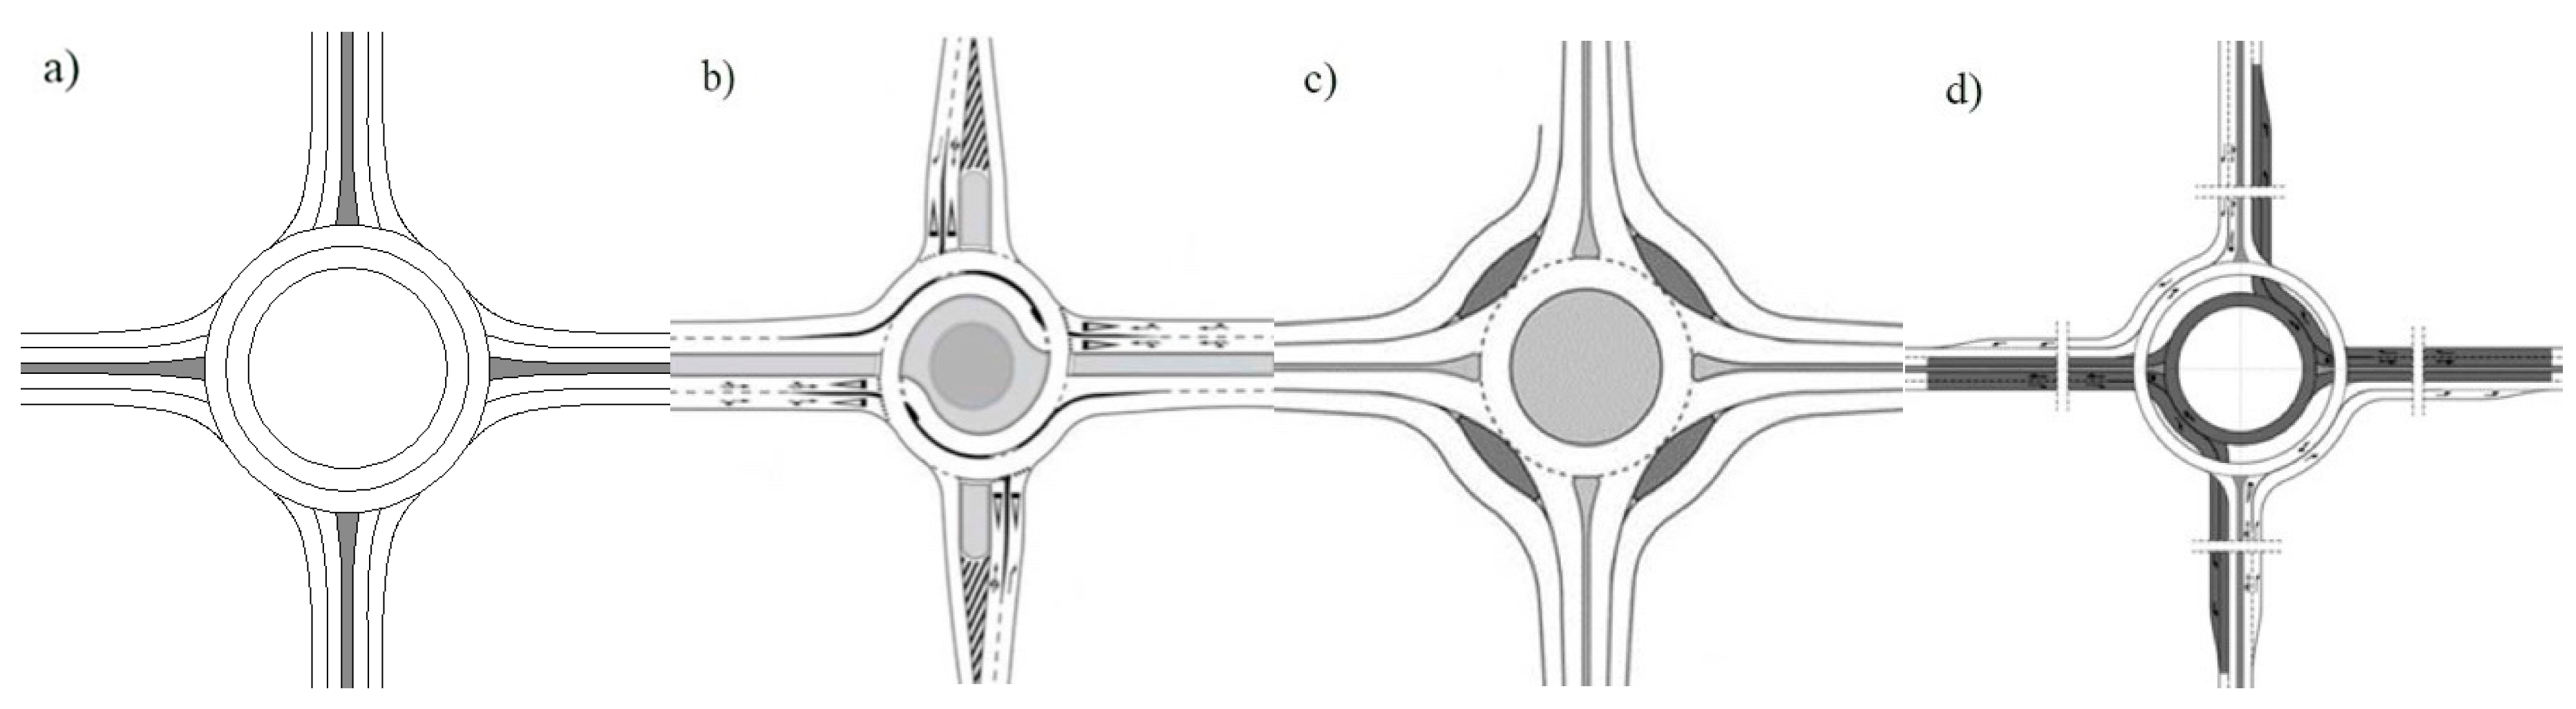
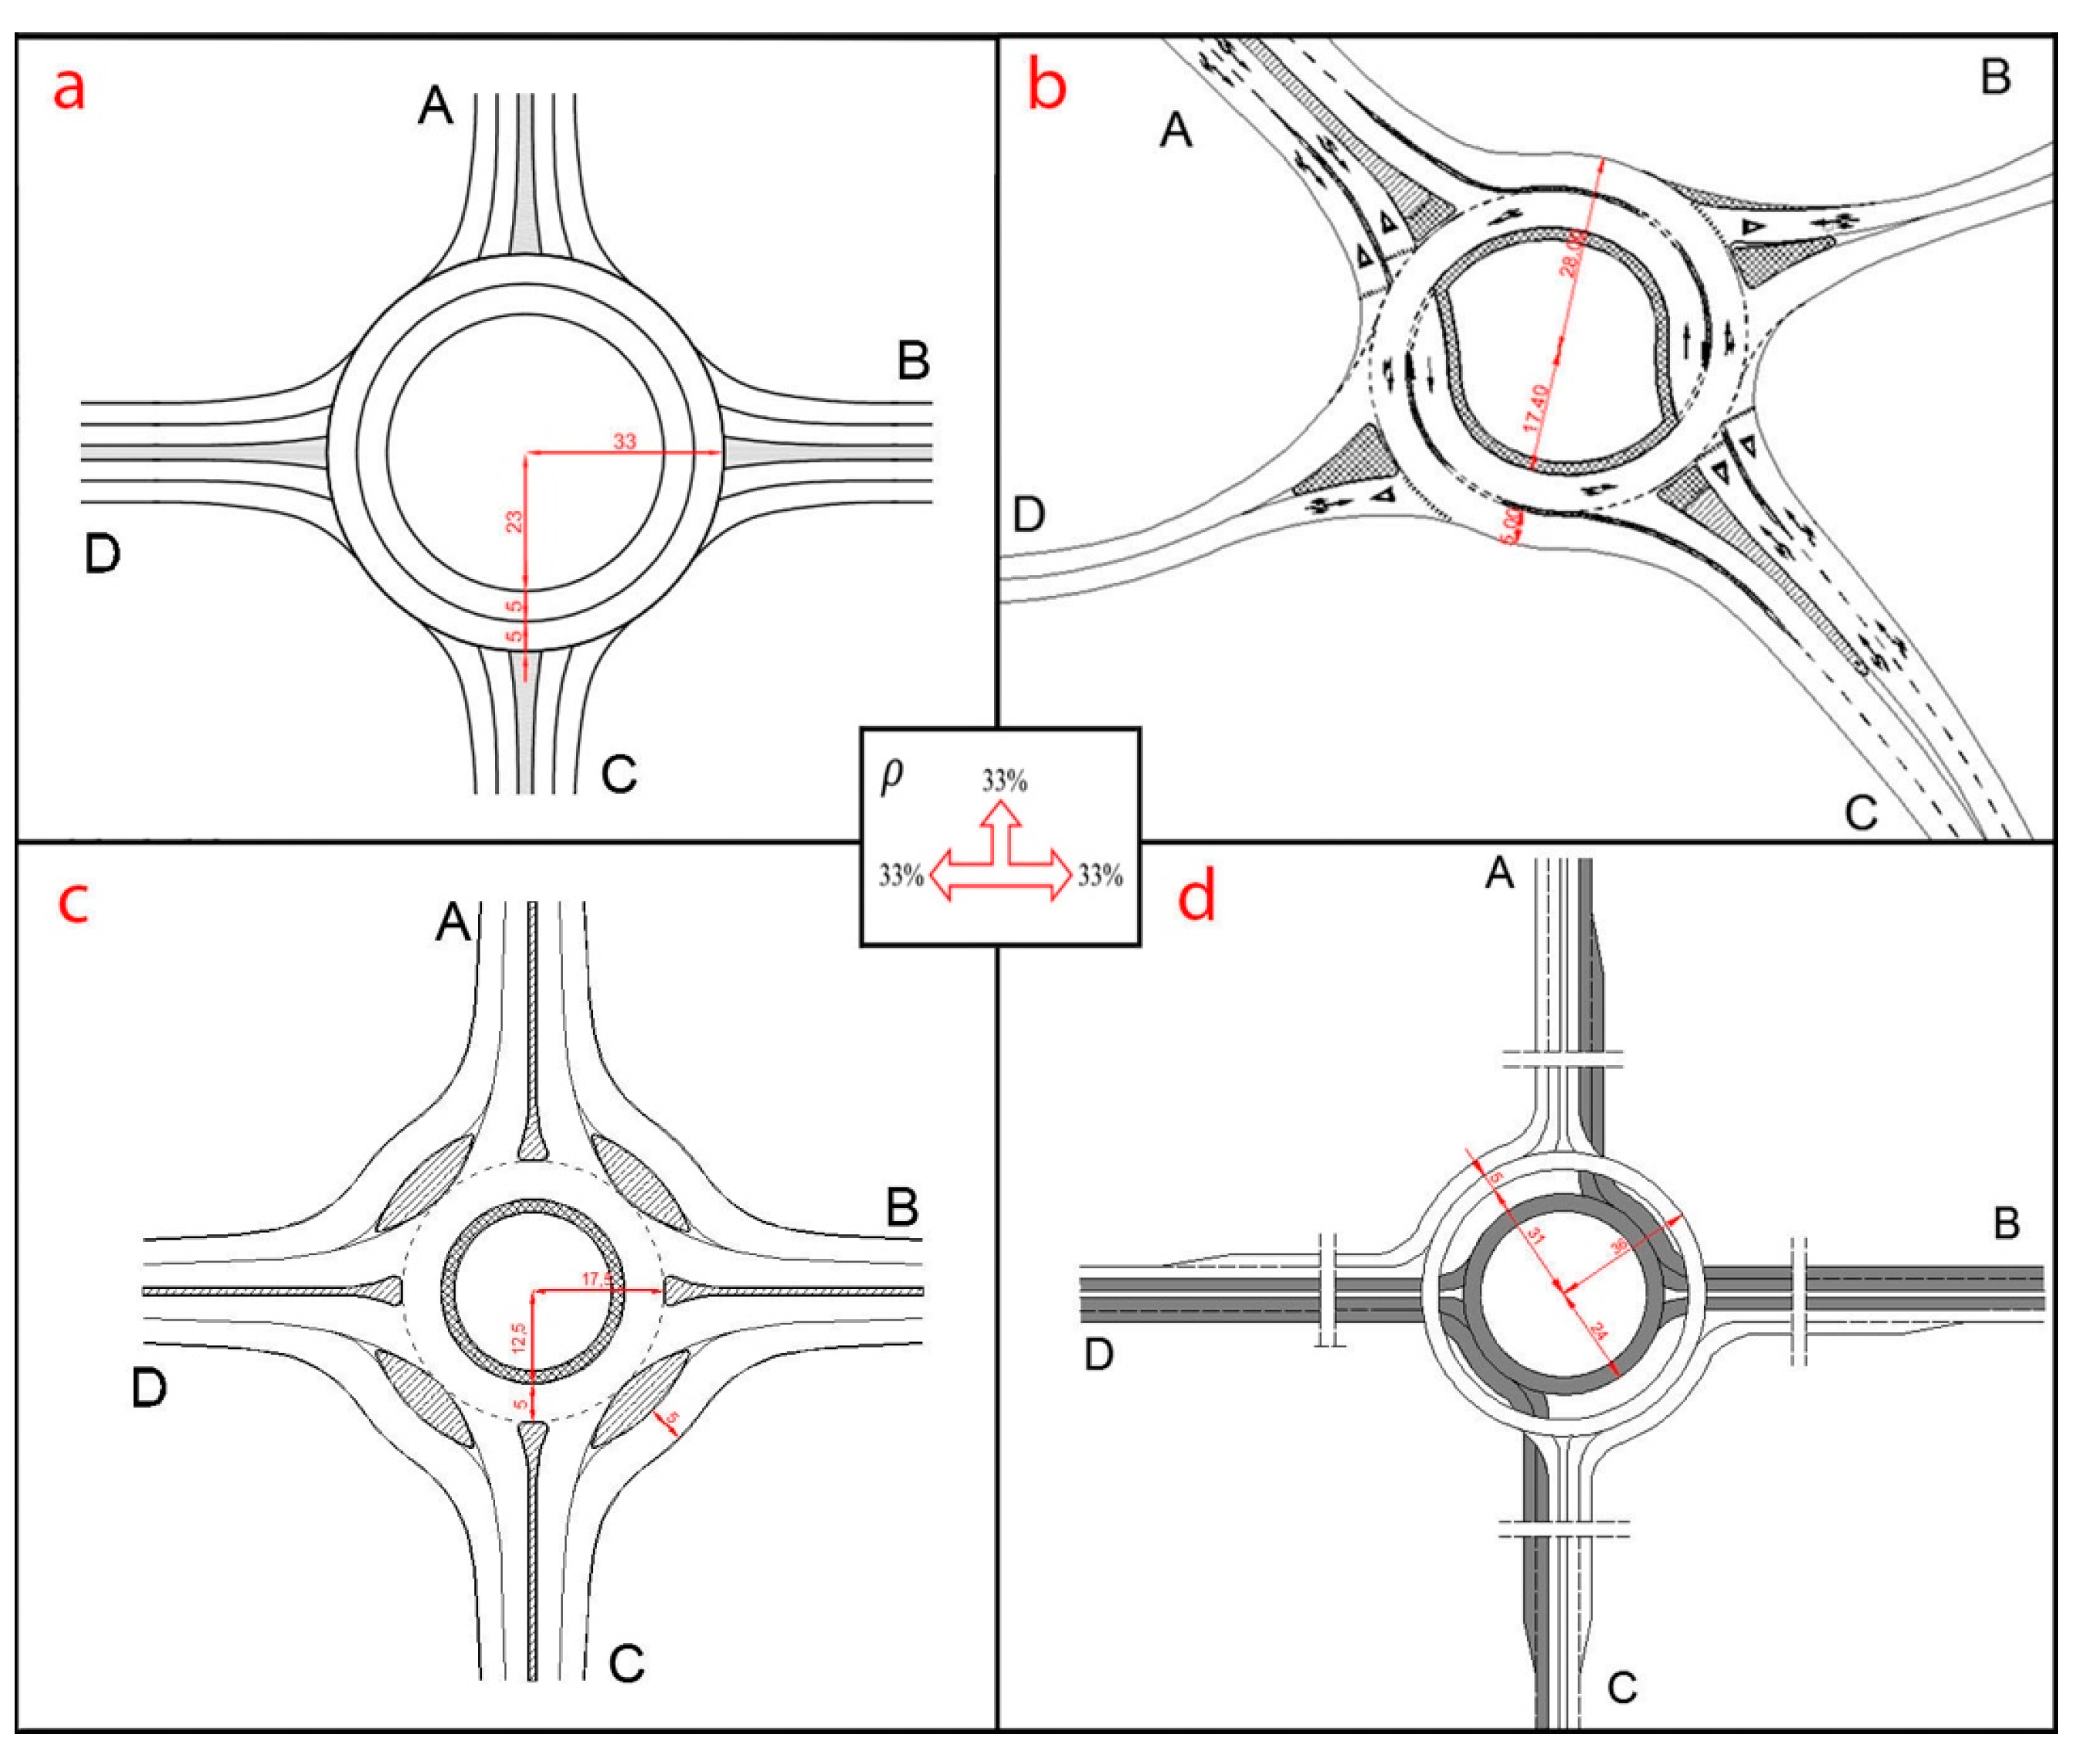
Description of Standard and Alternative Roundabouts Evaluated

The standard multilane roundabout (Figure 1a) is an efficient solution to cope with variable traffic demand. Additional entry and circulatory lanes increase capacity, but they also increase safety problems that are mainly related to improper driver behavior at the entrance, circulatory, and exit zones, and to the consequent weaving maneuvers within the circle. Previous studies on two-lane roundabouts confirmed such improper behavior as being common practice, resulting in conflicts and increased likelihood of crashes [3]. The first standard roundabout was built in Europe during the 20th century. After that, this typology of roundabout, thanks to the increase in the level of service and safety, has spread very quickly around the world.
A turbo roundabout is an innovative and potentially more sustainable arrangement of a two-lane roundabout, where certain directional flows are separated or run alongside physically separated lanes (Figure 1b). These roundabouts aim to overcome such problems as two-lane roundabouts being too small and the inner circulatory lanes not being comfortable for younger and senior drivers because they feel insecure when changing lanes on a circulatory carriageway [2]. In a turbo roundabout, the traffic flows in separate paths even before actual entry into the roundabout, then occupies separate lanes throughout the roundabout, and also separate paths when exiting the roundabout. The physical separation of traffic lanes is only interrupted at places of entry into the inner circulatory carriageway. Since weaving on the roundabout is no longer possible, drivers should be assisted by clear signposting and lane marking. A special form of arrow-marking has been developed for turbo roundabouts, which ensures clearer lane selection. The first turbo roundabouts were installed in 2000 in the Netherlands. Since then, countries such as Poland, Germany, Finland, Norway, Slovenia, Denmark, Lithuania, and Czech Republic have adopted this solution.
The roundabout with “depressed” lanes for right-hand turners—known as the flower roundabout—has been proposed as a solution for achieving a higher level of traffic safety than existing two-lane roundabouts. One of the basic characteristics of the flower roundabout is the same as for the turbo roundabout—physically separated traffic lanes within the circulatory carriageway [4]. The other main characteristic of the flower roundabout is that all right-hand turners have their own separated lanes, known as bypasses (Figure 1c). This means that the inner circulatory carriageway is only used by vehicles that drive straight through the roundabout at 180° and turn for three quarters of a circle (270°), or turn in a full circle (360°). By physically separating the right-hand turning traffic flow, a one-lane roundabout is obtained, whereby (unlike the turbo roundabout) there are no crossing conflict spots; however, unlike the case at the “standard” two-lane roundabout, there are also no weaving conflict spots. One vehicle transfers from the circulatory carriageway (within the curve) to the road section before the roundabout (usually a straight line), which is a safer solution from the traffic safety point of view. In effect, driving through a flower roundabout is not unlike like doing so at “standard” two-lane roundabouts, but this roundabout type “forgives errors”, that is, if a driver mistakenly stays in the left lane at the entrance, it still allows them to turn right at the next exit [2]. Finally, perhaps the best characteristic of the flower roundabout is that it can be implemented within the existing “standard” two-lane roundabout, as evidenced in Figure 1.
A target roundabout is a dual one-lane roundabout on two levels with right-turn bypasses [5,6] and is designed as a dual one-lane roundabout with different outer diameters, located on two levels (Figure 1d), with all right-hand turners on both roundabouts having their own separate right-turn bypass lanes. The dual one-lane roundabout on two levels allows driving from all directions to all directions, and it “forgives errors”, i.e., a driver who mistakenly stays at the entrance to the left-hand lane can turn right at the next exit (as opposed to the case for a turbo roundabout). By physically separating the right-turn traffic flow, dual one-lane roundabouts are characterized by no crossing conflict spots (unlike standard two-lane or turbo roundabouts), and no weaving conflict spots (unlike standard two-lane roundabouts). As for the turbo and flower roundabouts, when moving from the circulatory carriageway on to the road section, any possible weaving conflict spots are in front of a roundabout, which can improve traffic safety.
The target unconventional roundabout has had few, if any implementations anywhere in the world to our knowledge; therefore, it is only possible to evaluate it with a microsimulation model at the moment, a process that, admittedly, is not without limitations.

2. Methodology and Evaluation Approach

The evaluation was based on the simulation of traffic operating at roundabouts with alternative design layouts. A major advantage related to the use of simulation is the possibility to ‘tailor’ a model to meet the specific criteria of an existing real-world traffic situation and to incorporate those factors that have been identified as having a direct or indirect influence on traffic safety in estimating the influence on proximal indicators. These factors, which are especially relevant to the current study, include the exact geometric layout of the traffic site and the precise representation of traffic flows, including turning movements, through origin-destination matrices.
In short, simulation modeling allows the effects of various safety and operations-influencing measures to be preliminarily tested in a safe off-line environment in the early stages of research, development, and design [7]. That advantage is of especial relevance to this study, in which many different geometrical layouts for the same kind of intersection—a roundabout—are addressed in terms of safety and operational measures. More specifically, some geometrical layouts (flower and target roundabouts) are very recent or just theoretic, and it is not possible to perform an observational evaluation by collecting crash and operational data.
The microsimulation software tool VISSIM (Version 5.30) [8] was used to simulate operations at the roundabouts. This software can be used to generate all types of outputs simultaneously (safety, traffic performance, and capacity, allowing a more complete and comprehensive picture of the combined effects in making comparisons of various roundabout design scenarios.
The VISSIM output included vehicle trajectory files that were then imported into the Surrogate Safety Assessment Model—SSAM [9], a software application designed to perform analyses of vehicle trajectory data output from microscopic traffic simulation models to derive proximal measures such as conflicts, based on thresholds for either time to collision (TTC) or post encroachment time (PET). The estimated conflicts were then applied in crash-conflict models for roundabouts developed in other research to compare the roundabout designs on the basis of expected crashes.
The approach of using proximal safety indicators such as conflicts has been suggested as an alternative to the use of crash data, especially where the facility being evaluated does not exist, and thus does not have a crash record. For example, Sayed and Zein [10] used traffic conflict safety indicator measures from unsignalized intersections to establish conflict frequency and severity measures in the form of an Intersection Conflict Index that could be used to compare the relative safety of different unsignalized intersections. Another key advantage (and prerequisite) of such proximal safety indicators is that they occur considerably more frequently than crashes, an advantage that is especially applicable to roundabouts. This suggests the possibility of using significantly shorter study periods to establish statistically reliable results.

2.1. Microsimulation Inputs
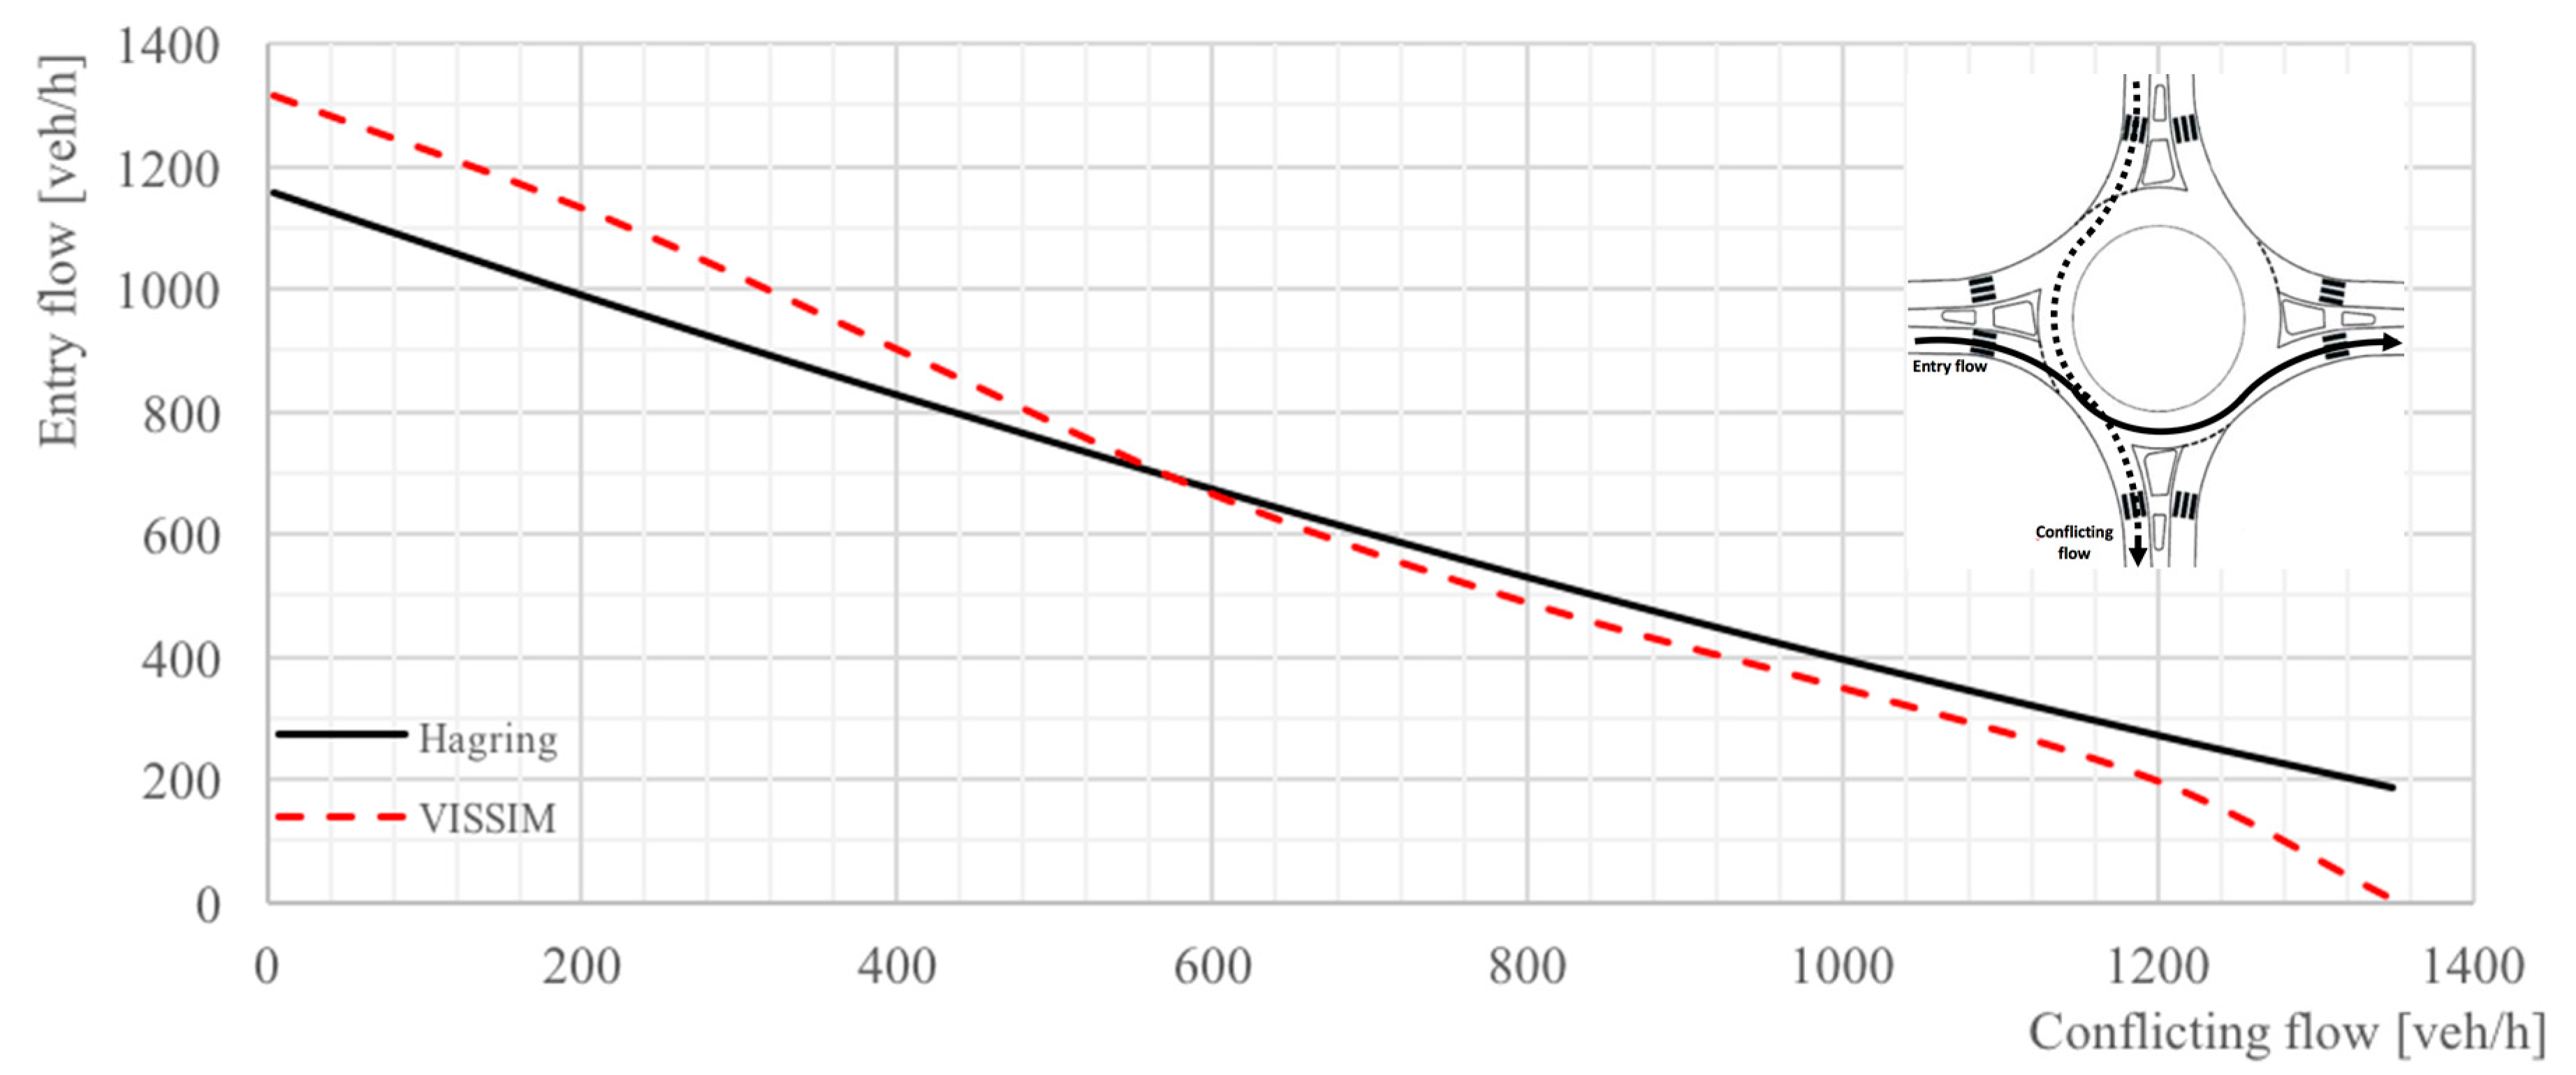
The maximum entry capacity for each roundabout scheme was defined as the entry flow corresponding to a volume to capacity (V/C) ratio of 0.8 to study the performance in an unsaturated traffic condition. The outputs were then normalized (per 1000 entering vehicles) for comparative evaluation. This comparison is problematic for safety performance, given the non-linear relationship between safety outcomes and traffic flow that is well established in the literature. To resolve this issue, safety performance of the roundabouts (as well as other measures for completeness) was also compared at a common entry flow of 2200 vph, representing approximately 80% of the lowest of the four effective entry capacities. These capacities are linked to the geometric layouts, specifically, number of lanes and outer diameter. The geometric parameters and capacities assumed for the evaluation are summarized in Table 1. A large number of traffic simulations were run by considering a balanced traffic distribution matrix ρ, as depicted in Figure 2, which also depicts the assumed geometric layouts.
The simulations were run on a standard four-arm double-lane roundabout with a ring external diameter of 66 m, internal diameter of 46 m, and a ring lane width of 5 m for each lane (Figure 2a). Each arm of the intersection has four lanes (two for each direction). Its capacity is taken as 3950 veh/h (Table 1), with the simulations run at entry flows of 3160 veh/h, representing 80% of its capacity.
The four-arm turbo roundabout (Figure 2b) has four lanes (two for each direction) in the main direction (A–C) and two lanes (one for each direction) in the other direction, and has not just one radius, but eight radii. The simulated roundabout has an average external diameter of the ring of 56 m, and an internal average diameter of 36 m, and each ring’s lane width is 5 m (Figure 2b). The turbo roundabout capacity is taken as 3725 veh/h (Table 1), with the initial simulations run with 2980 veh/h, representing 80% of its capacity. It is useful to remember that the choice of the turbo roundabout also depends on the predominant direction of the main traffic flow. In effect, the predominant direction of the main traffic flow is a criterion for the choice of the turbo roundabout [1].
The simulated flower roundabout is composed of a four-arm one-lane roundabout with a ring external diameter of 35 m, a ring internal diameter of 25 m, and a ring lane width of 5 m (Figure 2c), as well as four bypasses for right turn maneuvers. Each arm of the intersection has four lanes (two for each direction). Its capacity is taken as 4600 veh/h (See Table 1), with the initial simulations run at 3680 veh/h, representing 80% of its capacity.
The simulated target roundabout is composed of two four-arm one-lane roundabouts. The upper roundabout, the larger of the two, has a ring external diameter of 72 m, a ring internal diameter of 62 m, and a ring lane width of 5 m; the lower roundabout has a ring external diameter of 48 m, a ring internal diameter of 38 m, and a ring lane width of 5 m. There are also two bypasses for right turn maneuvers from both directions A to D and C to B (Figure 2d). Each arm has five lanes in the main direction (A–C) and four lanes in the other direction (B–D). Its capacity is taken as 5500 veh/h (Table 1), with the initial simulations run at 4400 veh/h, representing 80% of its capacity.

2.2. Calibration

Several studies have emphasized the importance of the calibration and validation process that allows microsimulation tools to provide reliable output. Thus, estimated traffic flow data for the analyzed intersections were used to calibrate microsimulation model parameters to try to reach reliable and realistic outputs, in terms of functional and safety performance measures. Through this approach, the simulation data can reflect the values estimated by meta-analytical models in the literature. To this end, it was decided to calibrate the Wiedemann 74 car-following model [11] used by PTV VISSIM software (version 6) in order to reliably and realistically simulate vehicle traffic within unconventional roundabouts.
The meta-analytic model used was able to estimate the instantaneous circulating traffic flow entering from the entry arm (e.g., west), depending on the conflicting traffic flow entering from upstream arm (e.g., north), as shown in Figure 3. That model is the general one created by Hagring [12,13], which uses Equation (1) to determine the capacity of the arm to vary with the conflicting flow, Qc. Specifically, the parameters Tc = critical headway (s), Tf = follow-up headway (s), and Δ = the minimum headway of major traffic flow (s) used in Equation (1) were estimated by Giuffrè et al. [14]:
C e = Q c × ( 1 Δ × Q c 3600 ) × e [ Q c 3600 × ( T c Δ ) ] 1 e [ Q c 3600 × T f ]   = [ veh h ]
In order to calibrate the VISSIM car-following model, an origin/destination (O/D)matrix was selected whereby there are two traffic flows for the directions west-east and north-south. The west-east traffic flow is fixed in such a way that the arm is always at its maximum capacity, while the north-south traffic flow is varied from a Qc equal to 0 veh/h to a Qc equal to 1400 veh/h with steps of about 200 veh/h.
Starting the simulation with the VISSIM software, the dashed curve in the Figure 3 was obtained, from which it is possible to extrapolate the black curve obtained from the application of Equation (1). The car-following model was considered to be satisfactorily calibrated when the two curves overlap. To further explore the model's validity, the Geoffrey E. Havers (GEH) statistic index (2) was used as the criterion for accepting the template. This index is a global indicator widely used for the validation of traffic simulation models, especially when only aggregate values such as traffic flow counts in time-based detection stations and input capacity are available [15]. The GEH index value is the average over n—it was considered equal to 8—simulations of the index for each simulation i, as follows:
GEH i = 2 ( M C ) 2 ( M + C ) ;   GEH = i = 1 n G E H i n
where M is the hourly traffic volume from the traffic model and C is the hourly traffic count.
Table 2 provides some interpretations of these values with respect to the calibration.
The calibration task was approached by changing the VISSIM parameter set for the “Driving Behavior Parameter Set\Following”. Specifically, the optimal combination obtained by the calibration process is:
-
Look ahead distance: maximum of 105 m instead of the default value equal to 250 m;
-
Look back distance: set to 30 m longer than the default value equal to 250 m;
-
Temporary lack of attention: duration 1 s; probability 8%;
-
Flagging smooth close-up behavior;
-
Average standstill distance: set value equal to 5.00 instead of the default value equal to 2.00;
-
Additive part of safety distance: set value equal to 3.6 instead of the default value equal to 2.00;
-
Multiple of safety distance: set value equal to 2.00 instead of the default value equal to 3.00.
Using the Wiedemann 74 car-following model calibrated with the above parameters, the values of GEH reported in Table 3 were obtained.
Finally, the calibration parameters for “Lane change” and “Lateral” were taken from the research conducted by Shahdah et al. [16].

3. Results

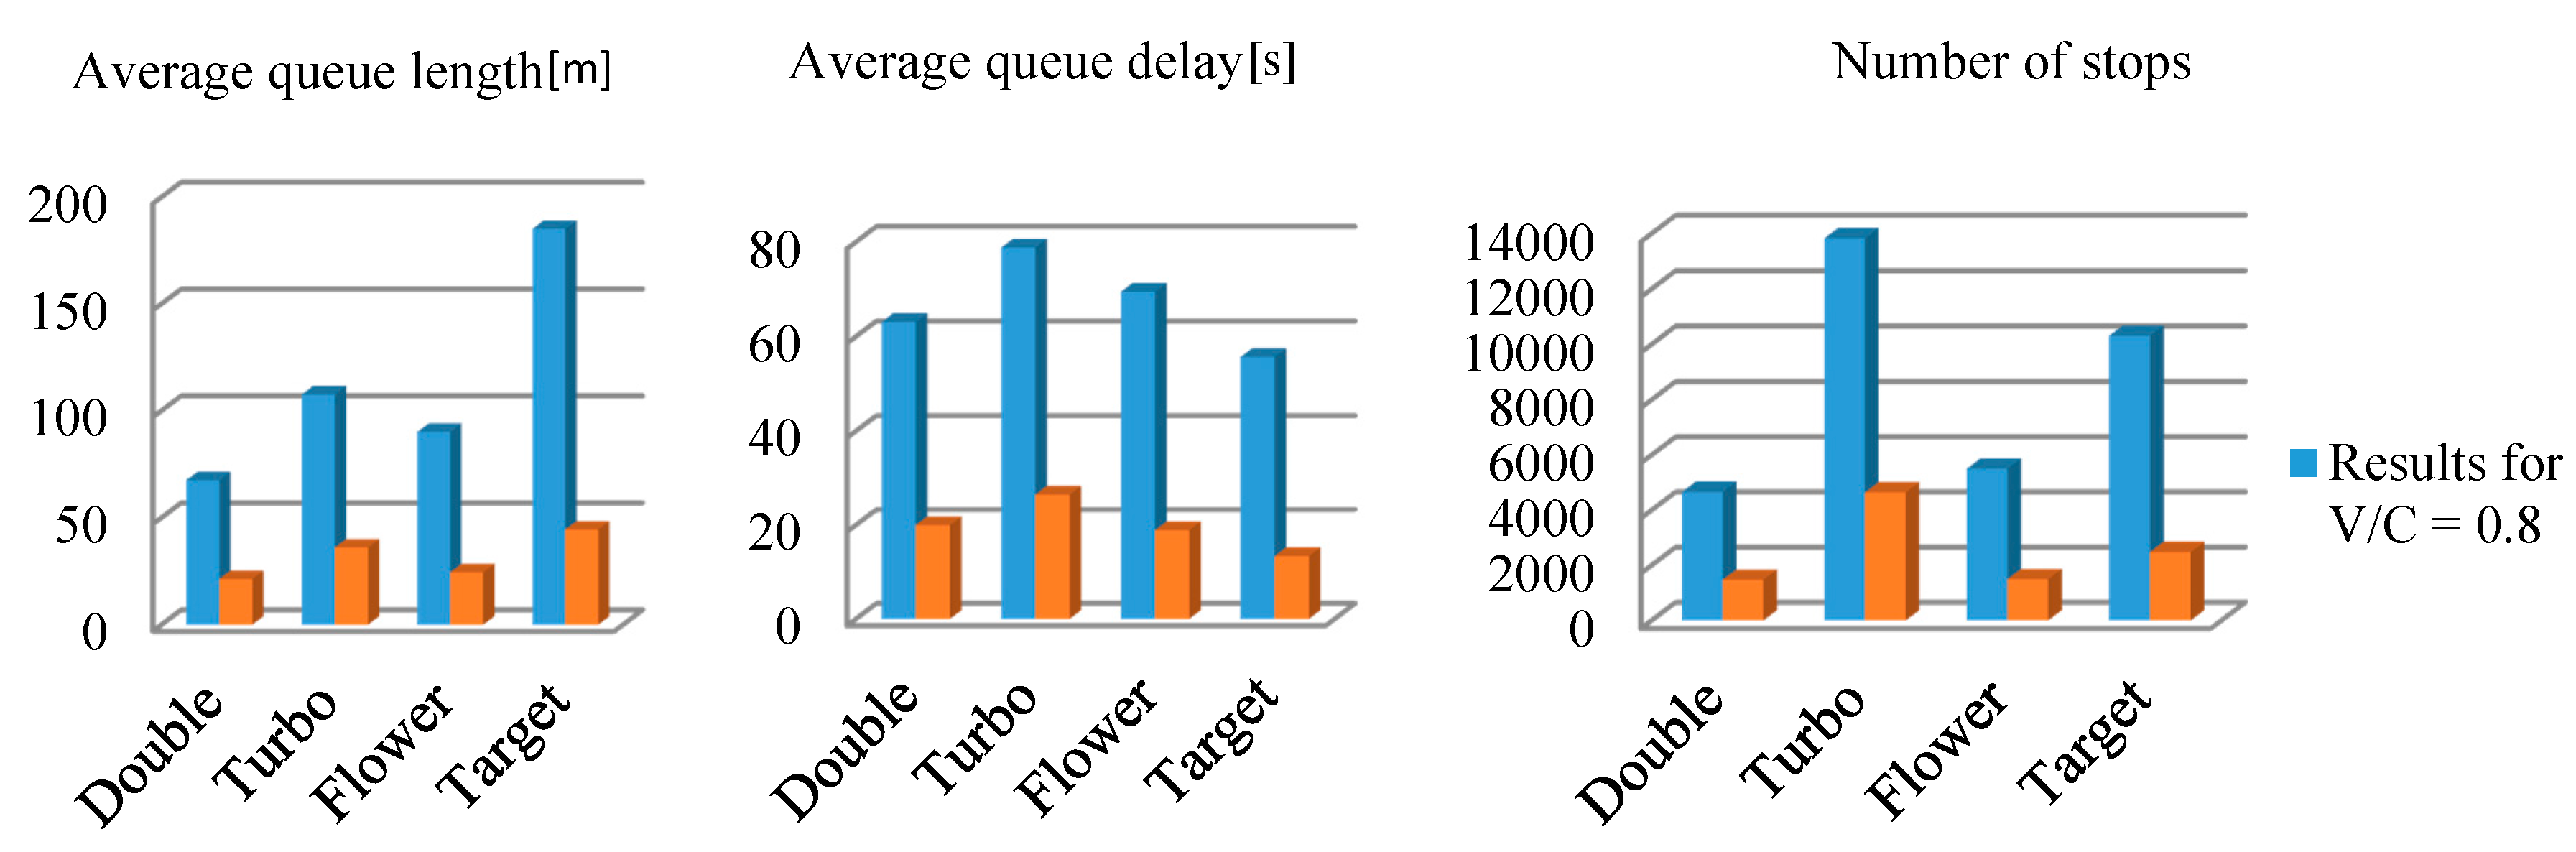
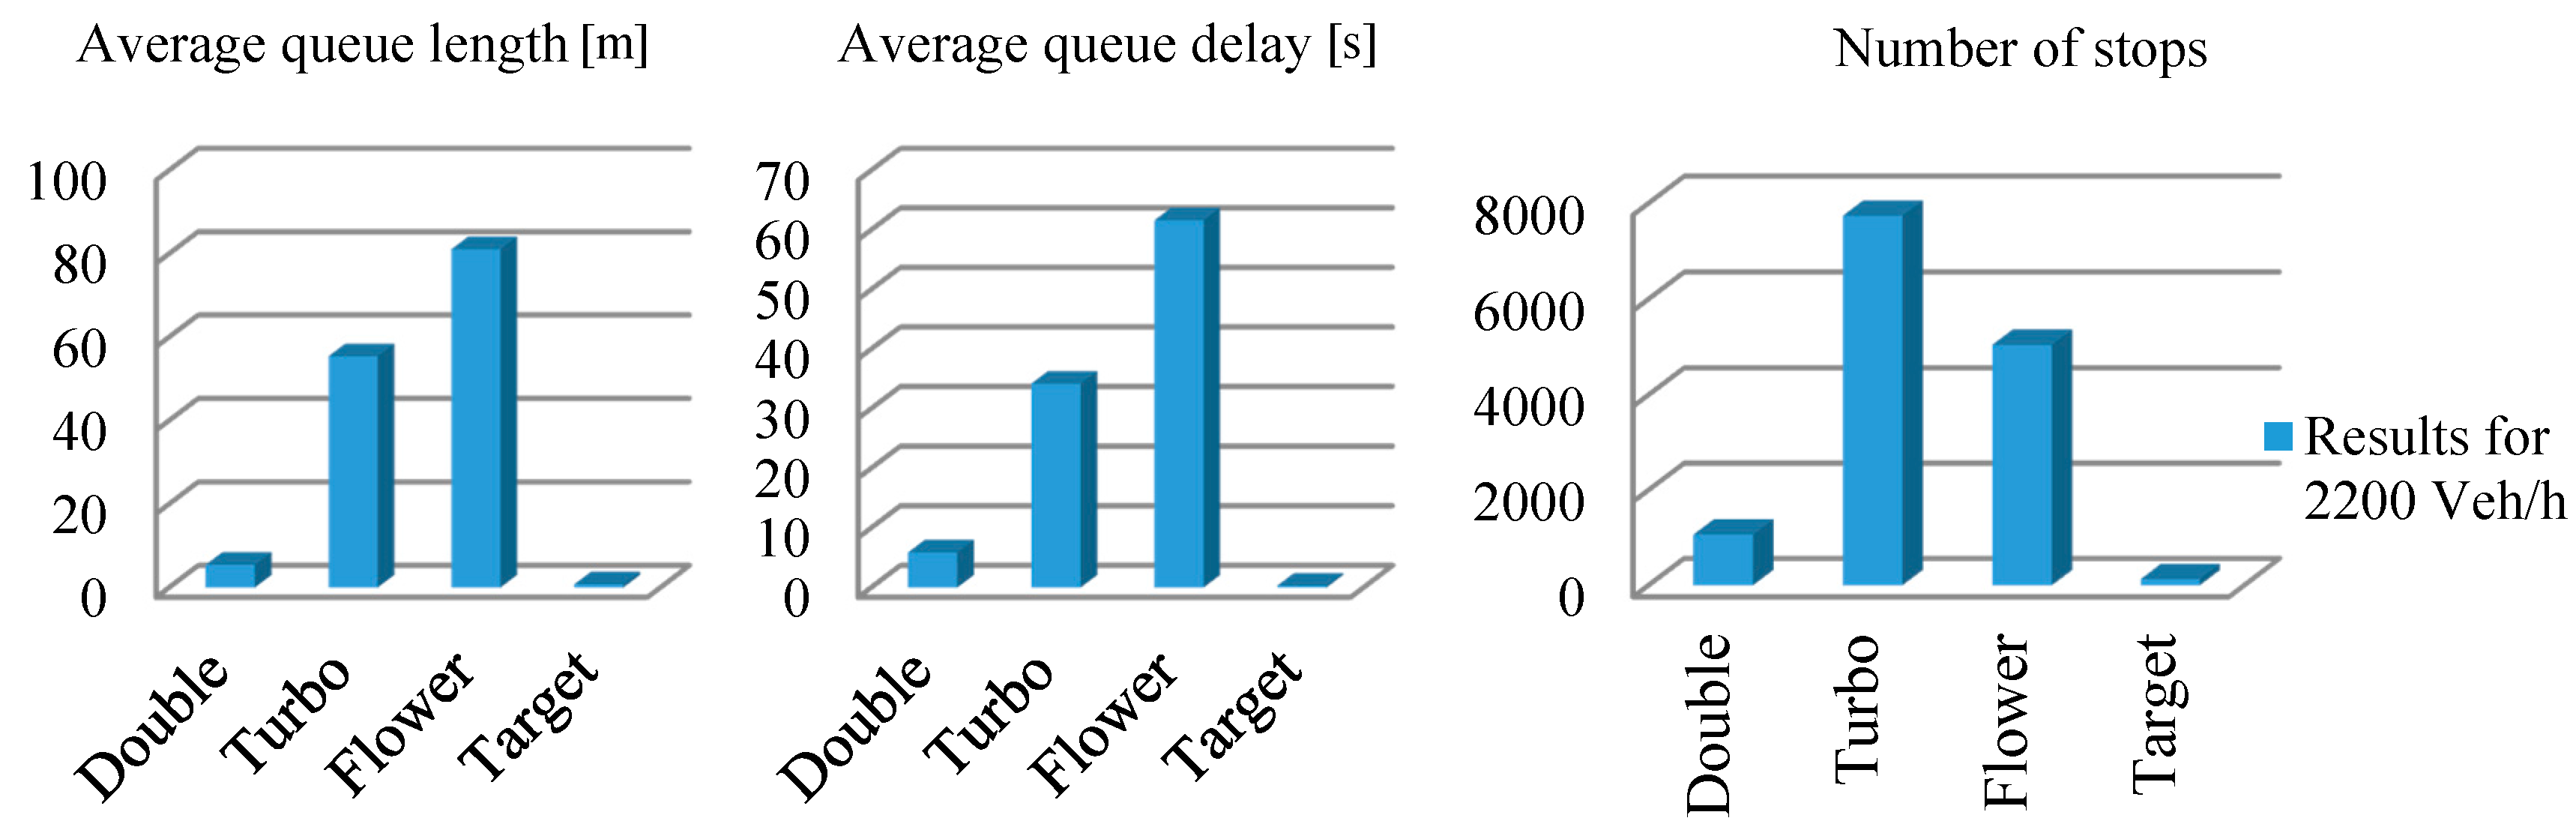
3.1. Operational Performance Measures

Figure 4 shows the comparison of absolute and normalized operational performance measures for different roundabout layouts for entry flows at 80% of capacity. It can be seen that the target roundabout has the highest absolute and normalized values (per 1000 entering vehicles).
Figure 4 shows also that the turbo roundabout has the largest values of average queue delay and number of stops for both 80% of the capacity and 1000 vehicle entry flow levels. On balance, considering the three performance measures as a whole, the double lane roundabout seems best for both 80% of the capacity and 1000 vehicle entry flow levels. These results seem reasonable because the choice to upgrade the roundabout design from the traditional to the unconventional ones is often linked to high traffic flow observed for the actual (traditional) design solution.
Figure 5 shows the comparison of absolute performance measures for different roundabout layouts for entry flows of 2200 veh/h. In terms of queue length and queue delay, the turbo roundabout and flower roundabout do not perform as well as the double-lane roundabout. Of course, this may be a result of the specific O/D matrix selected. At the same time, from the comparison shown in Figure 5, the target roundabout performs the best for all measures, contrary to the results for flows of 80% of capacity. This is because the target roundabout would be an overdesign for this traffic demand and therefore unlikely be a cost-effective design compared to the traditional one.

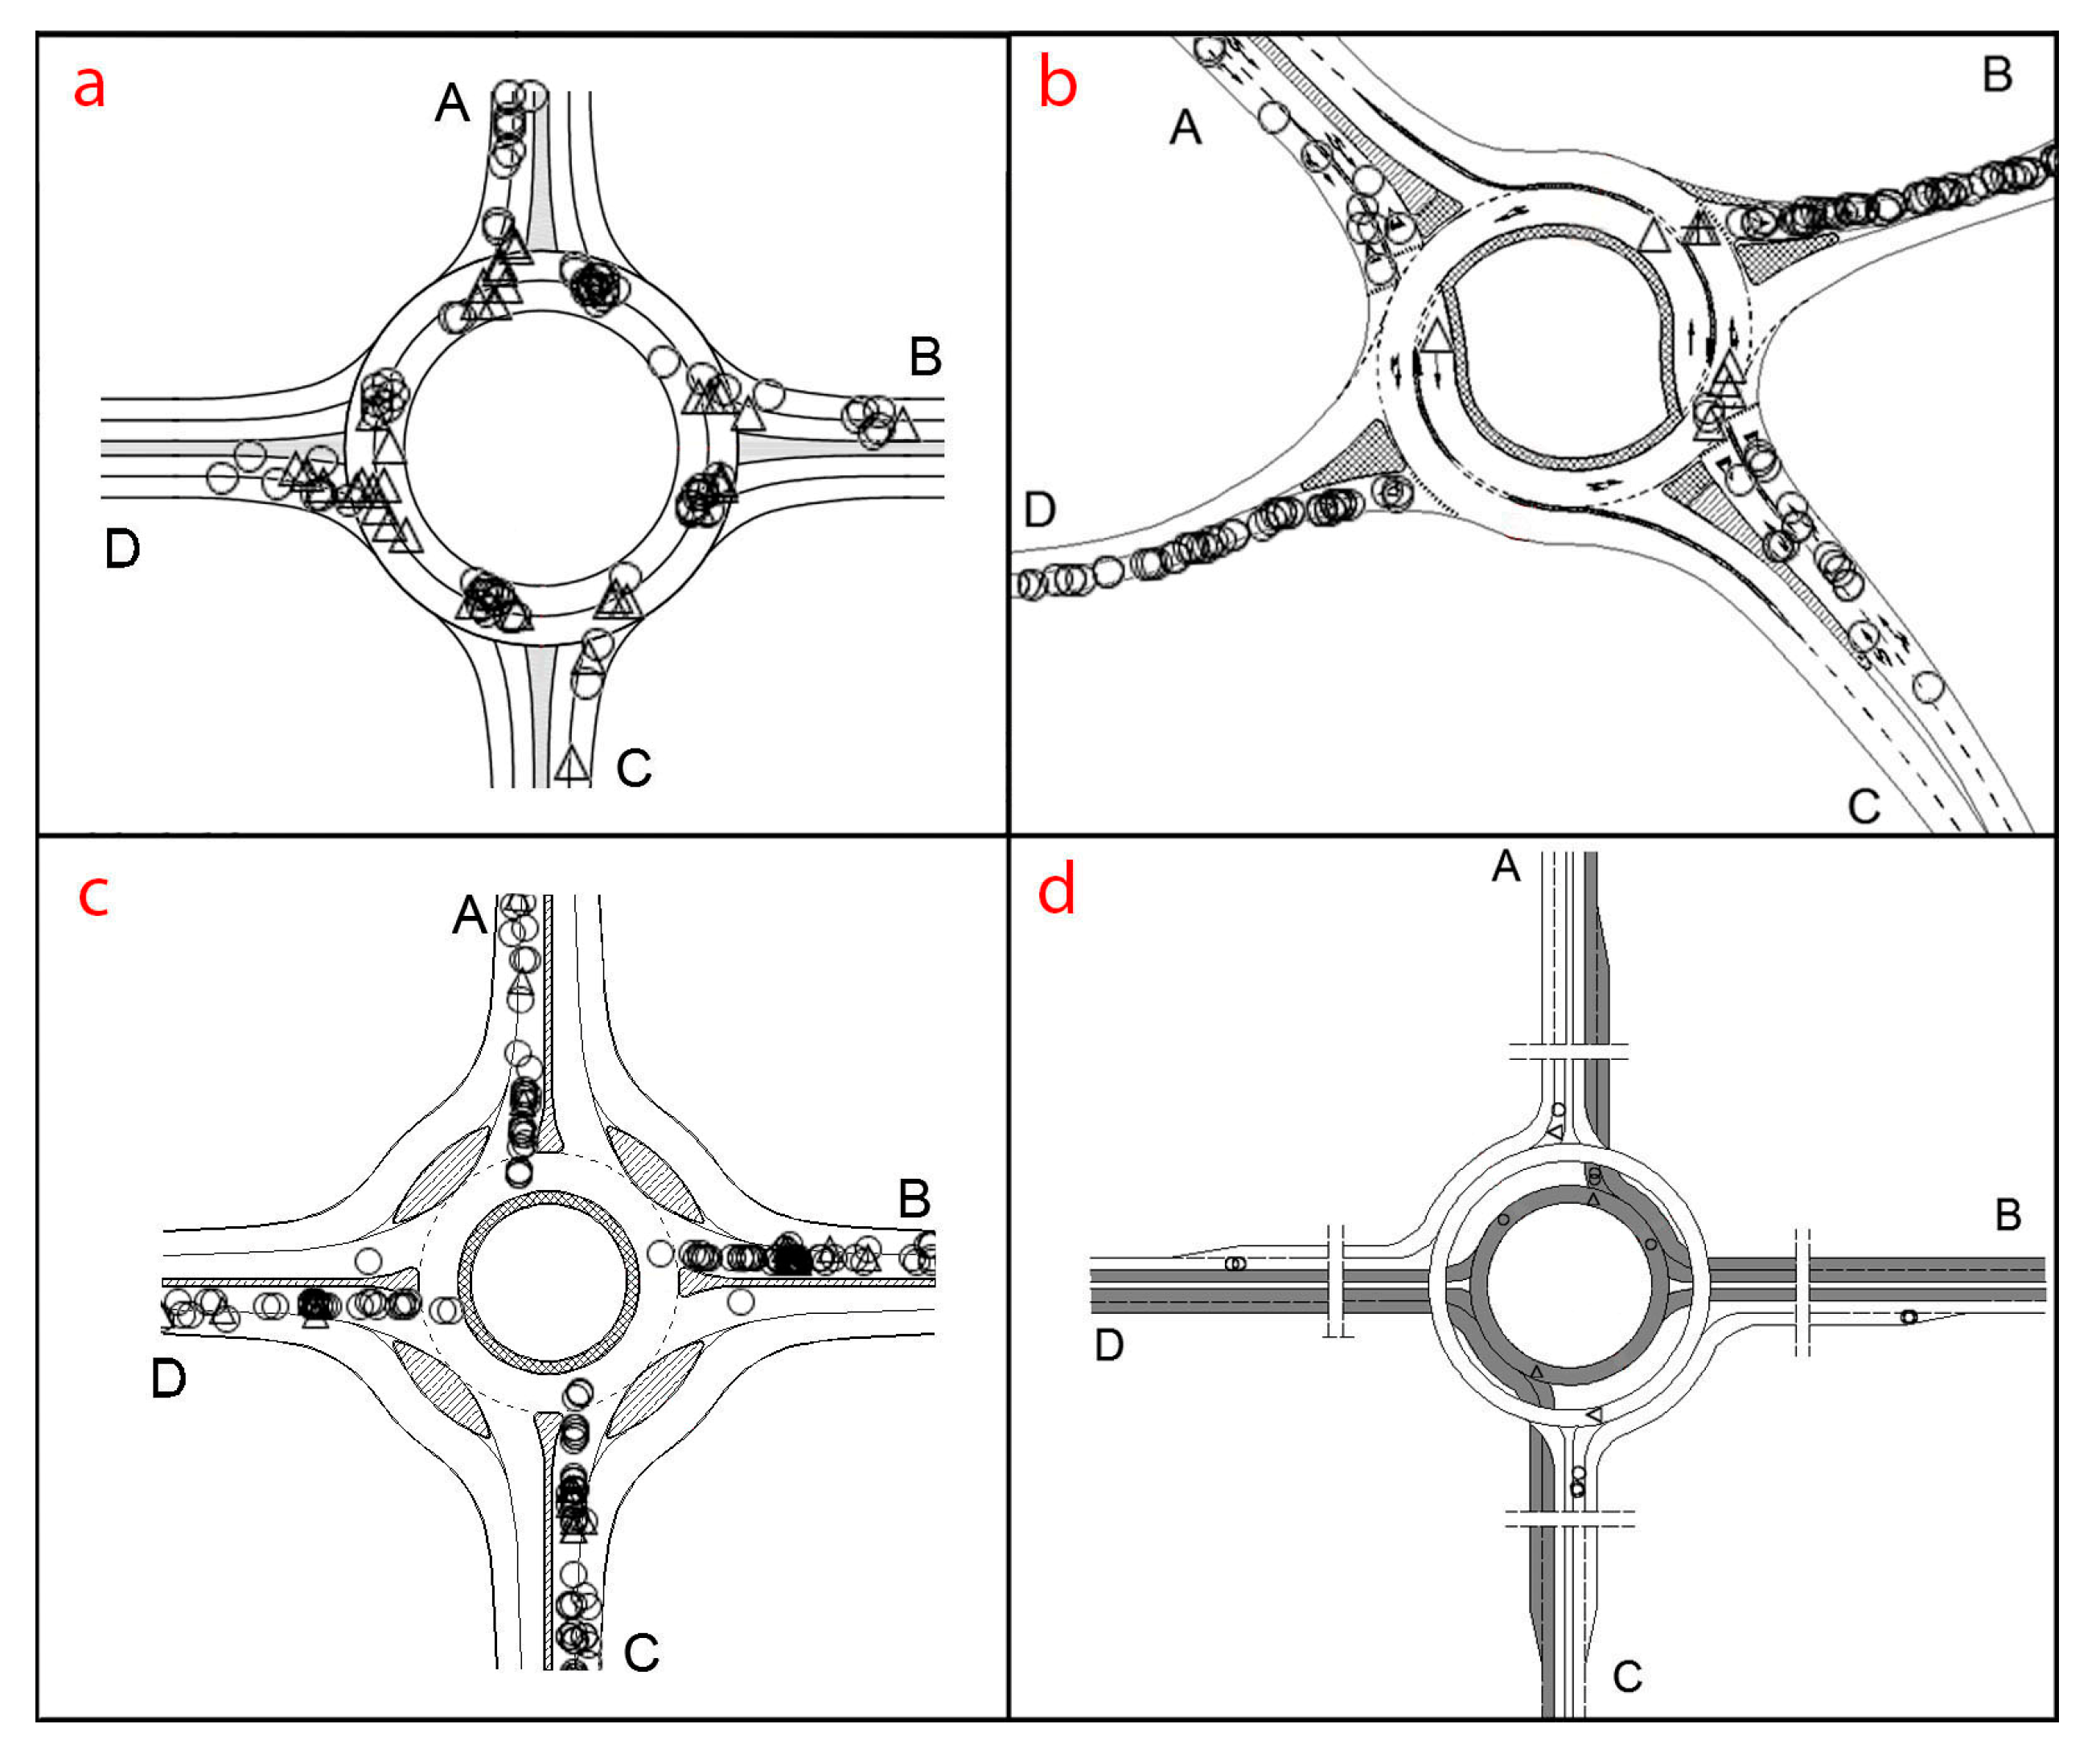
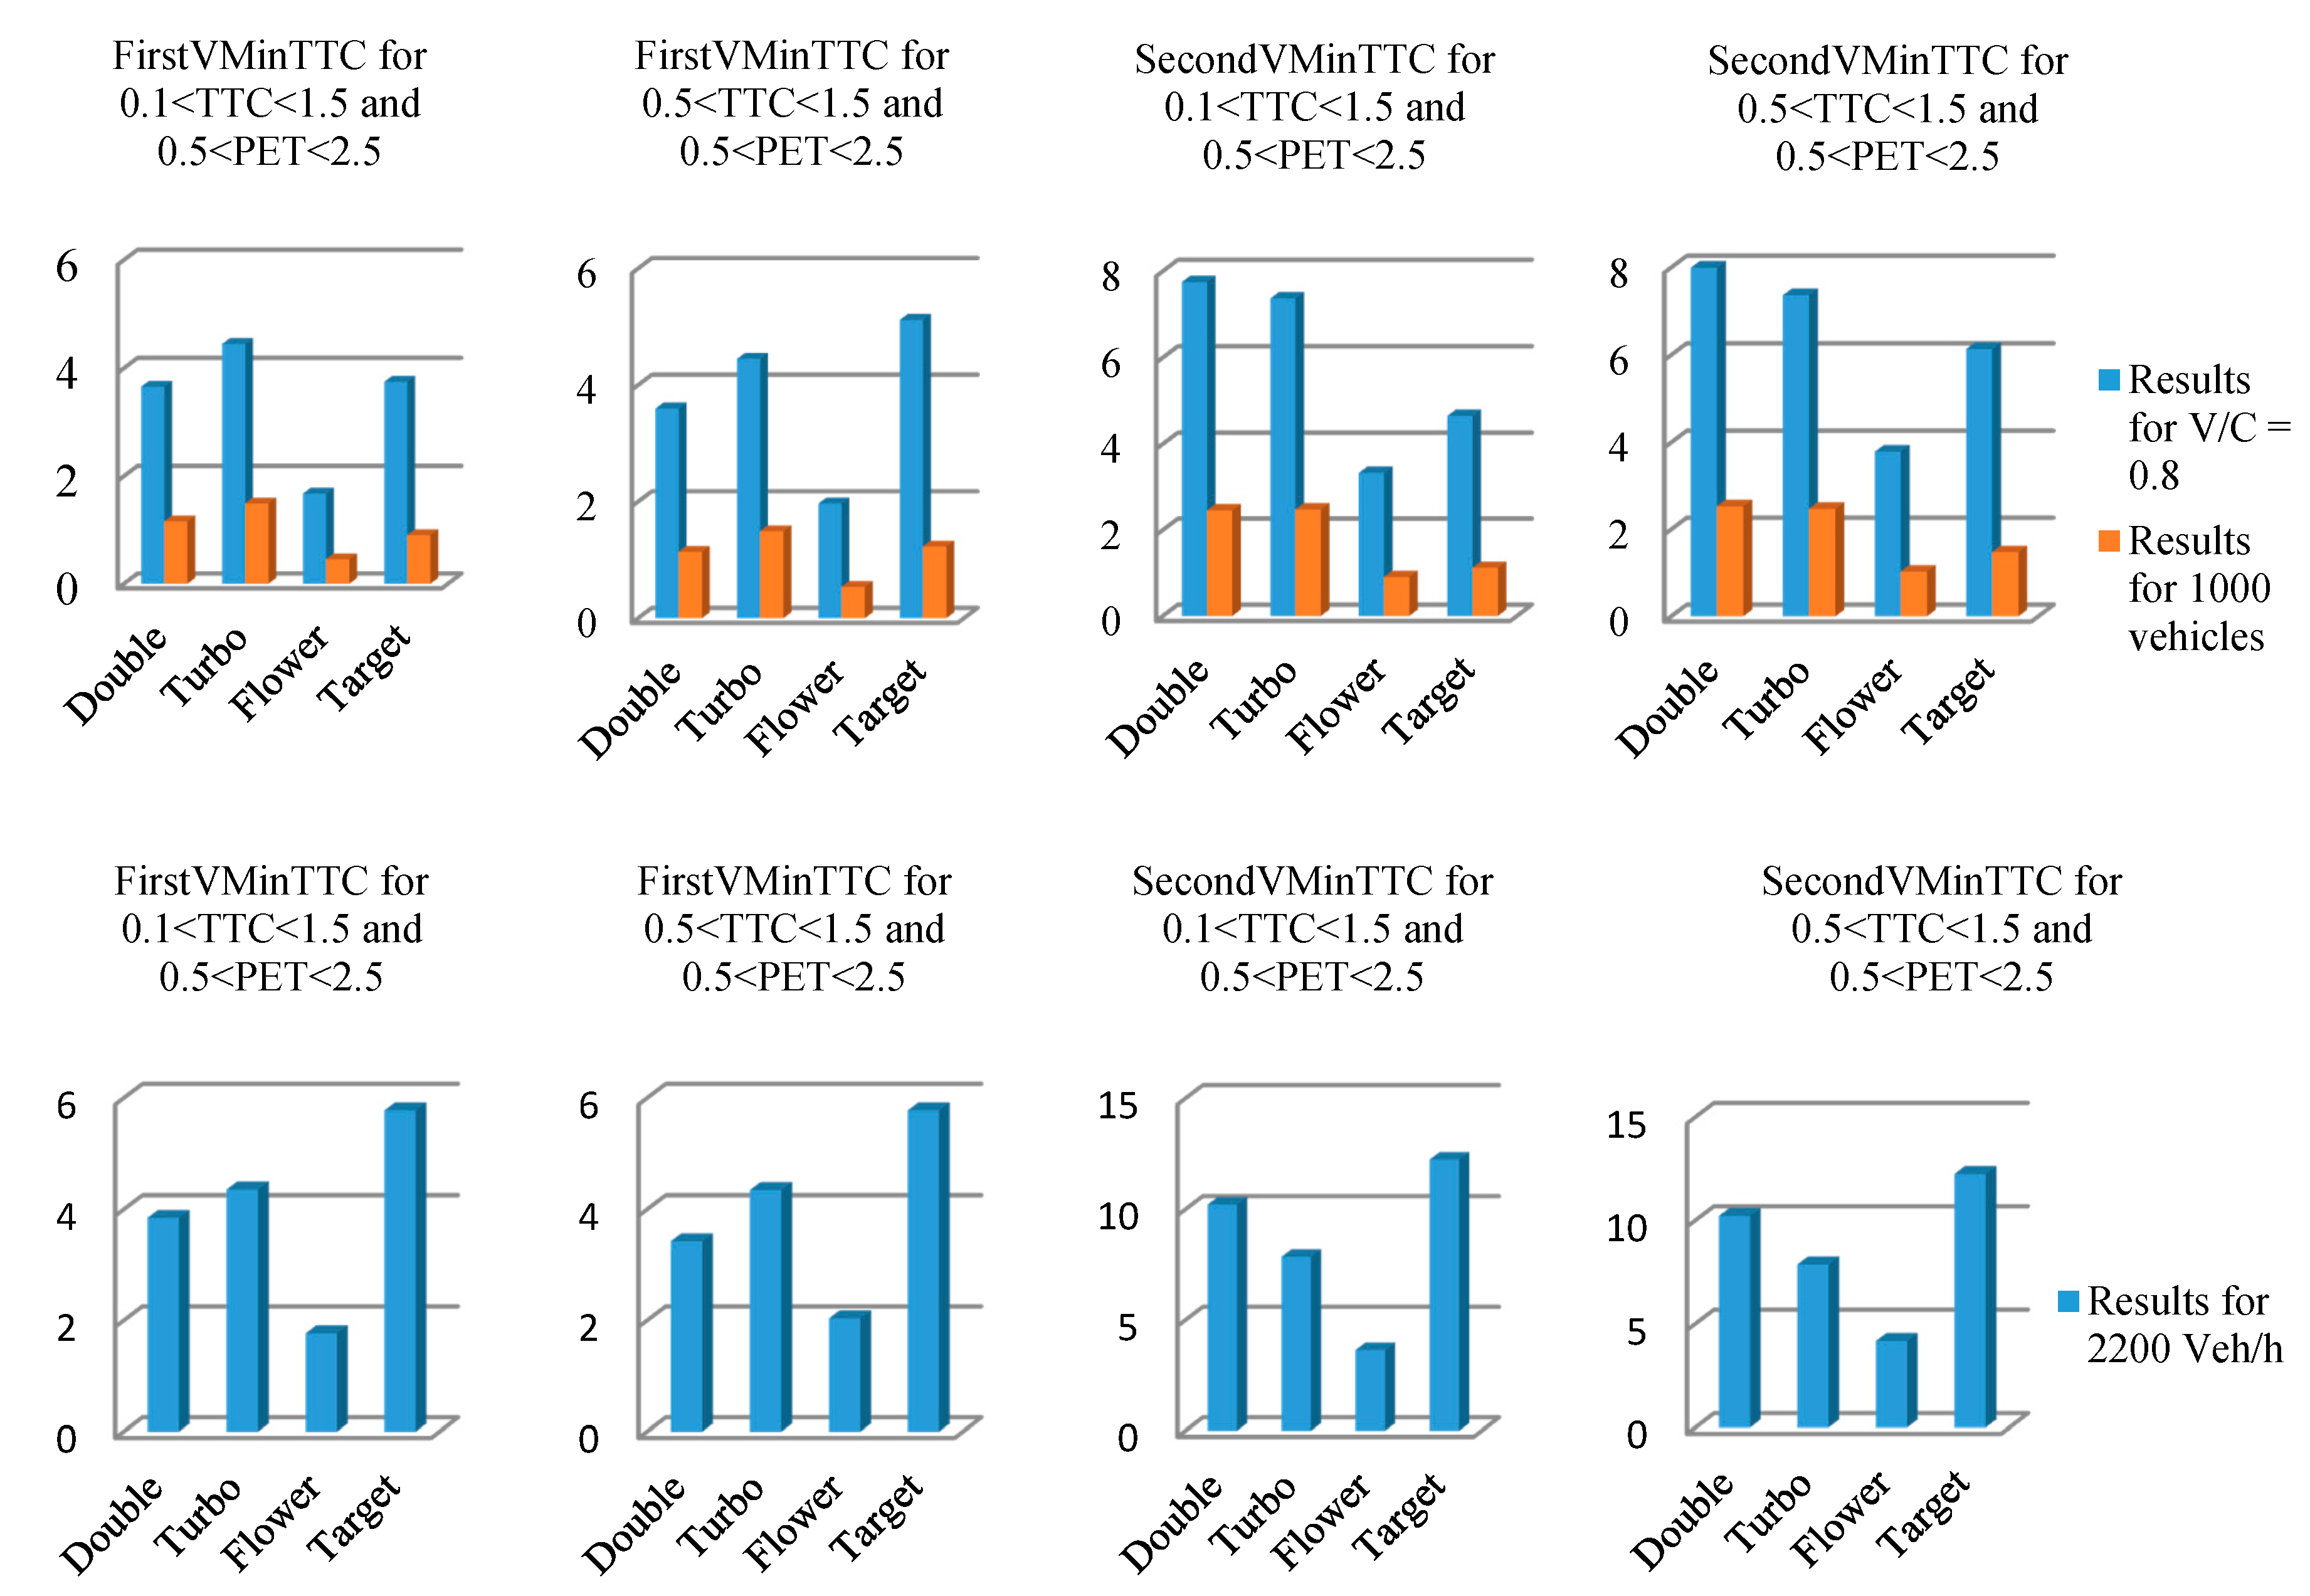
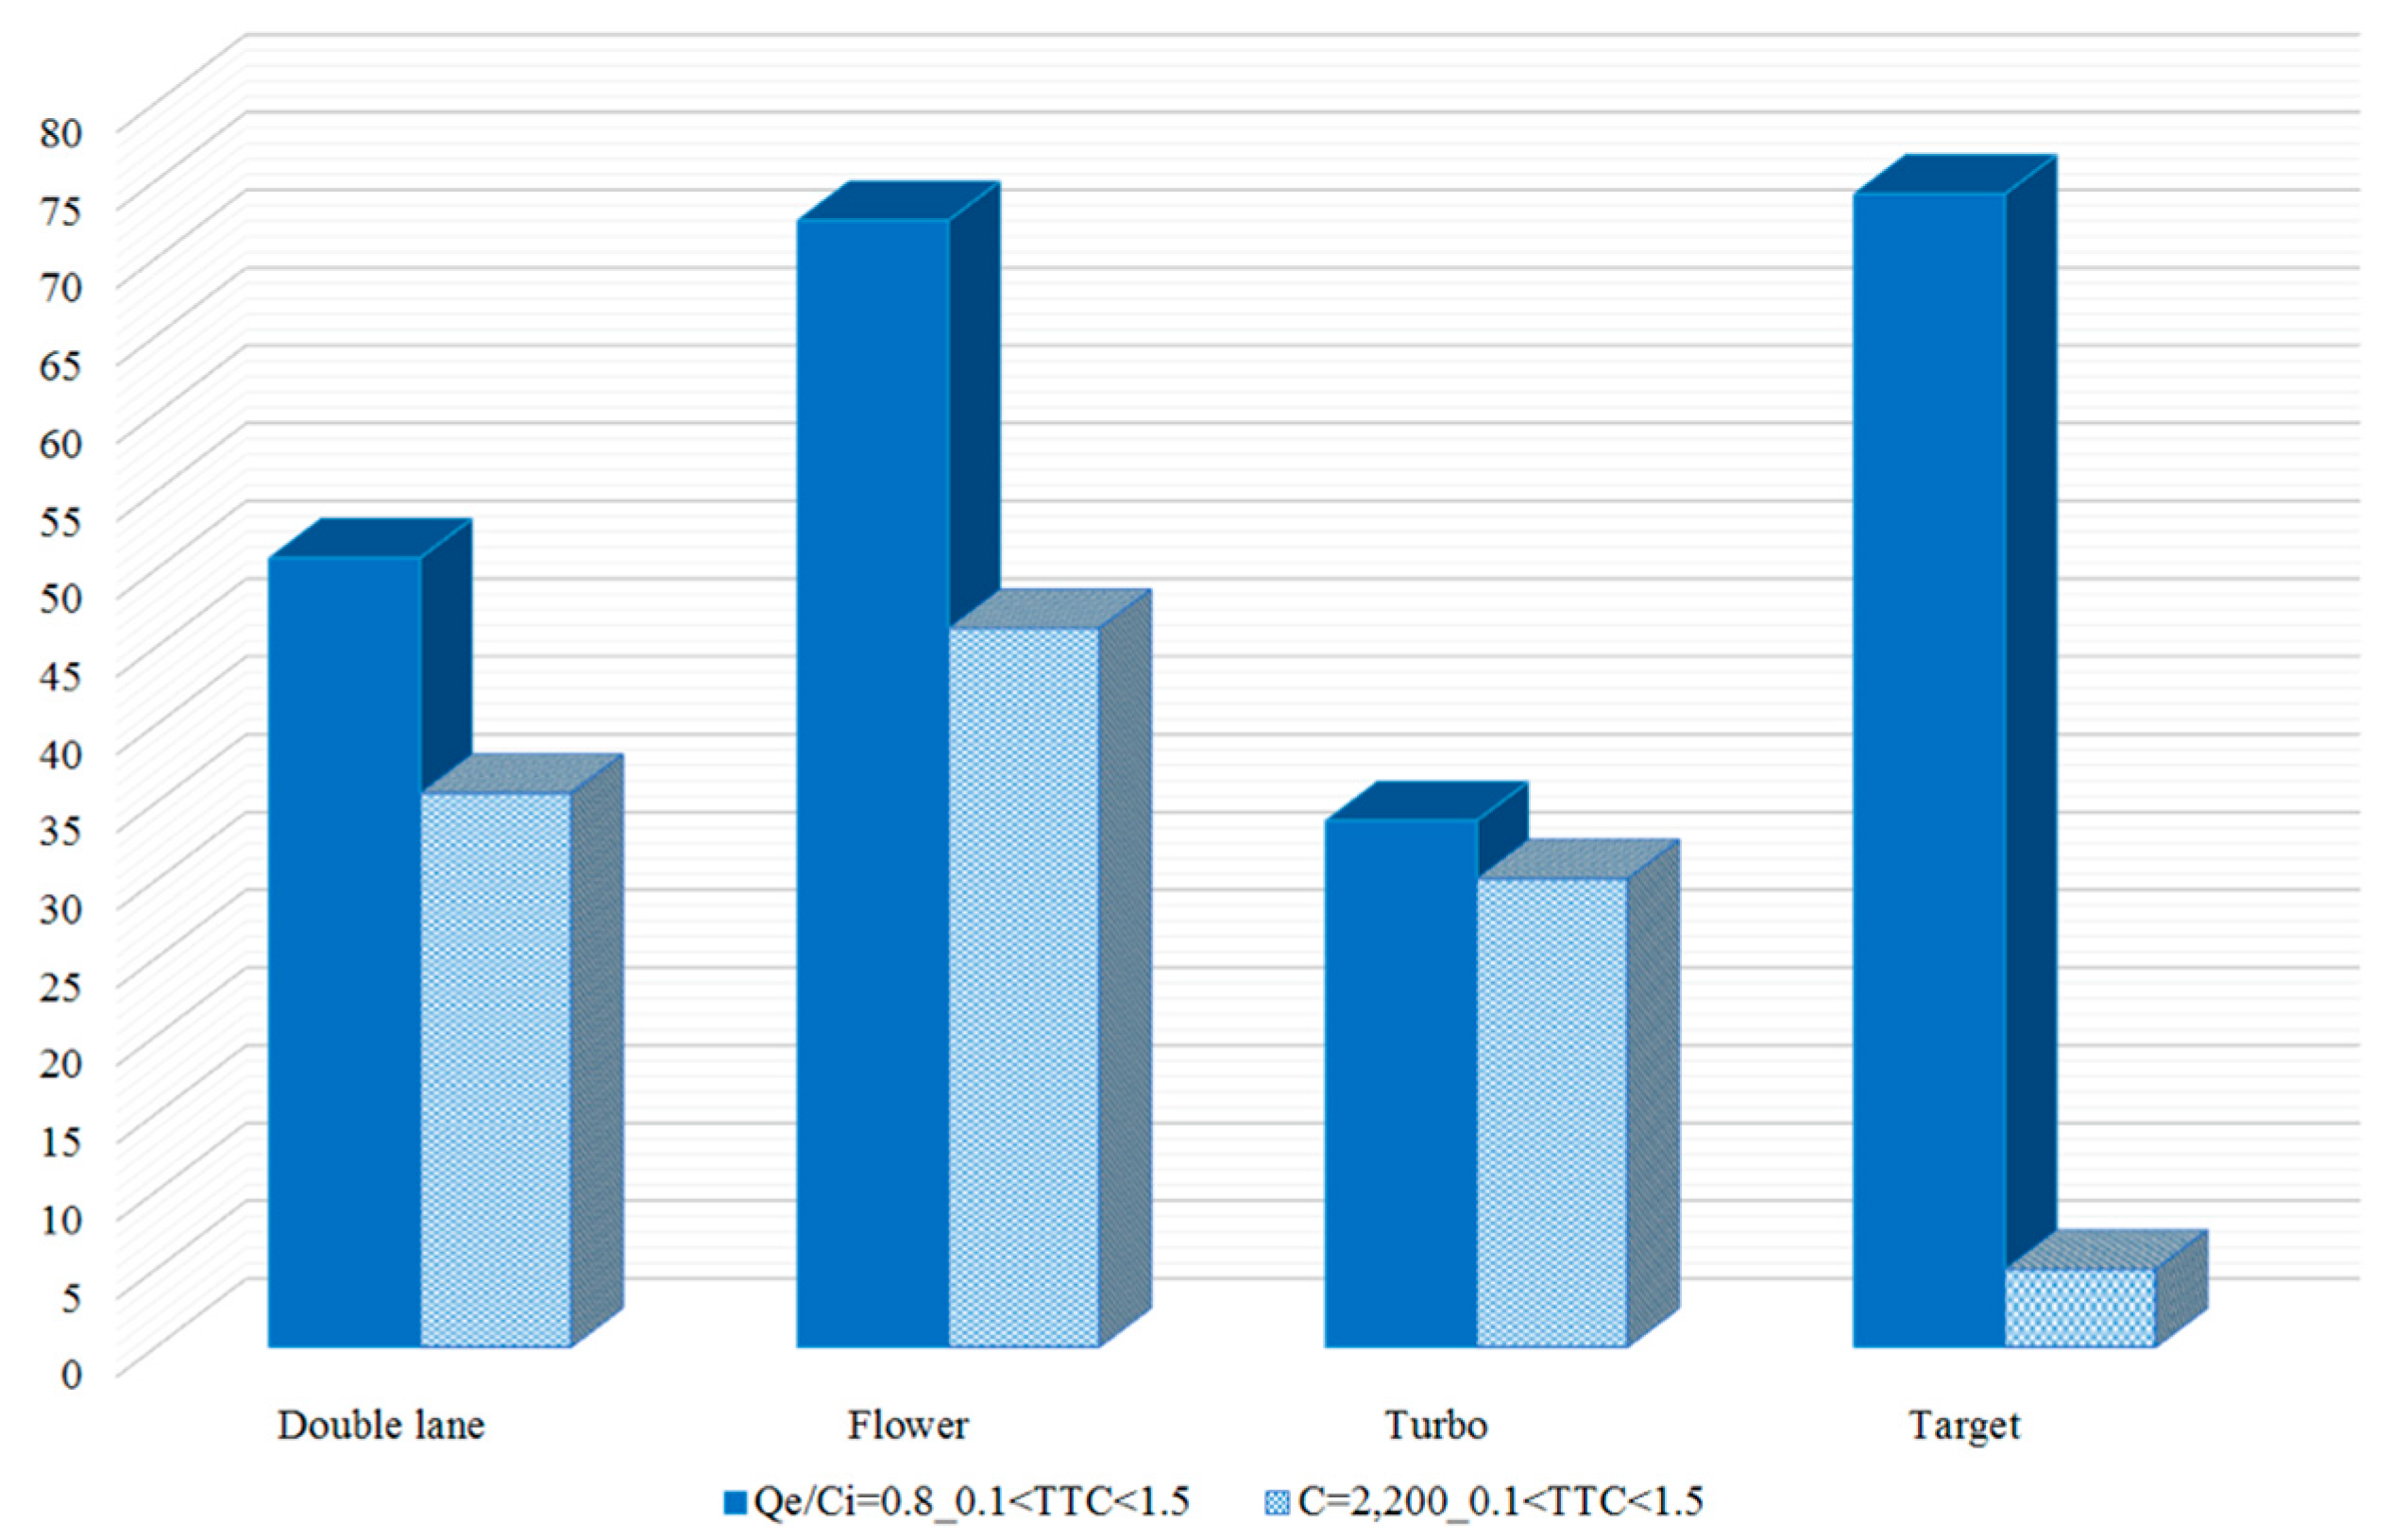
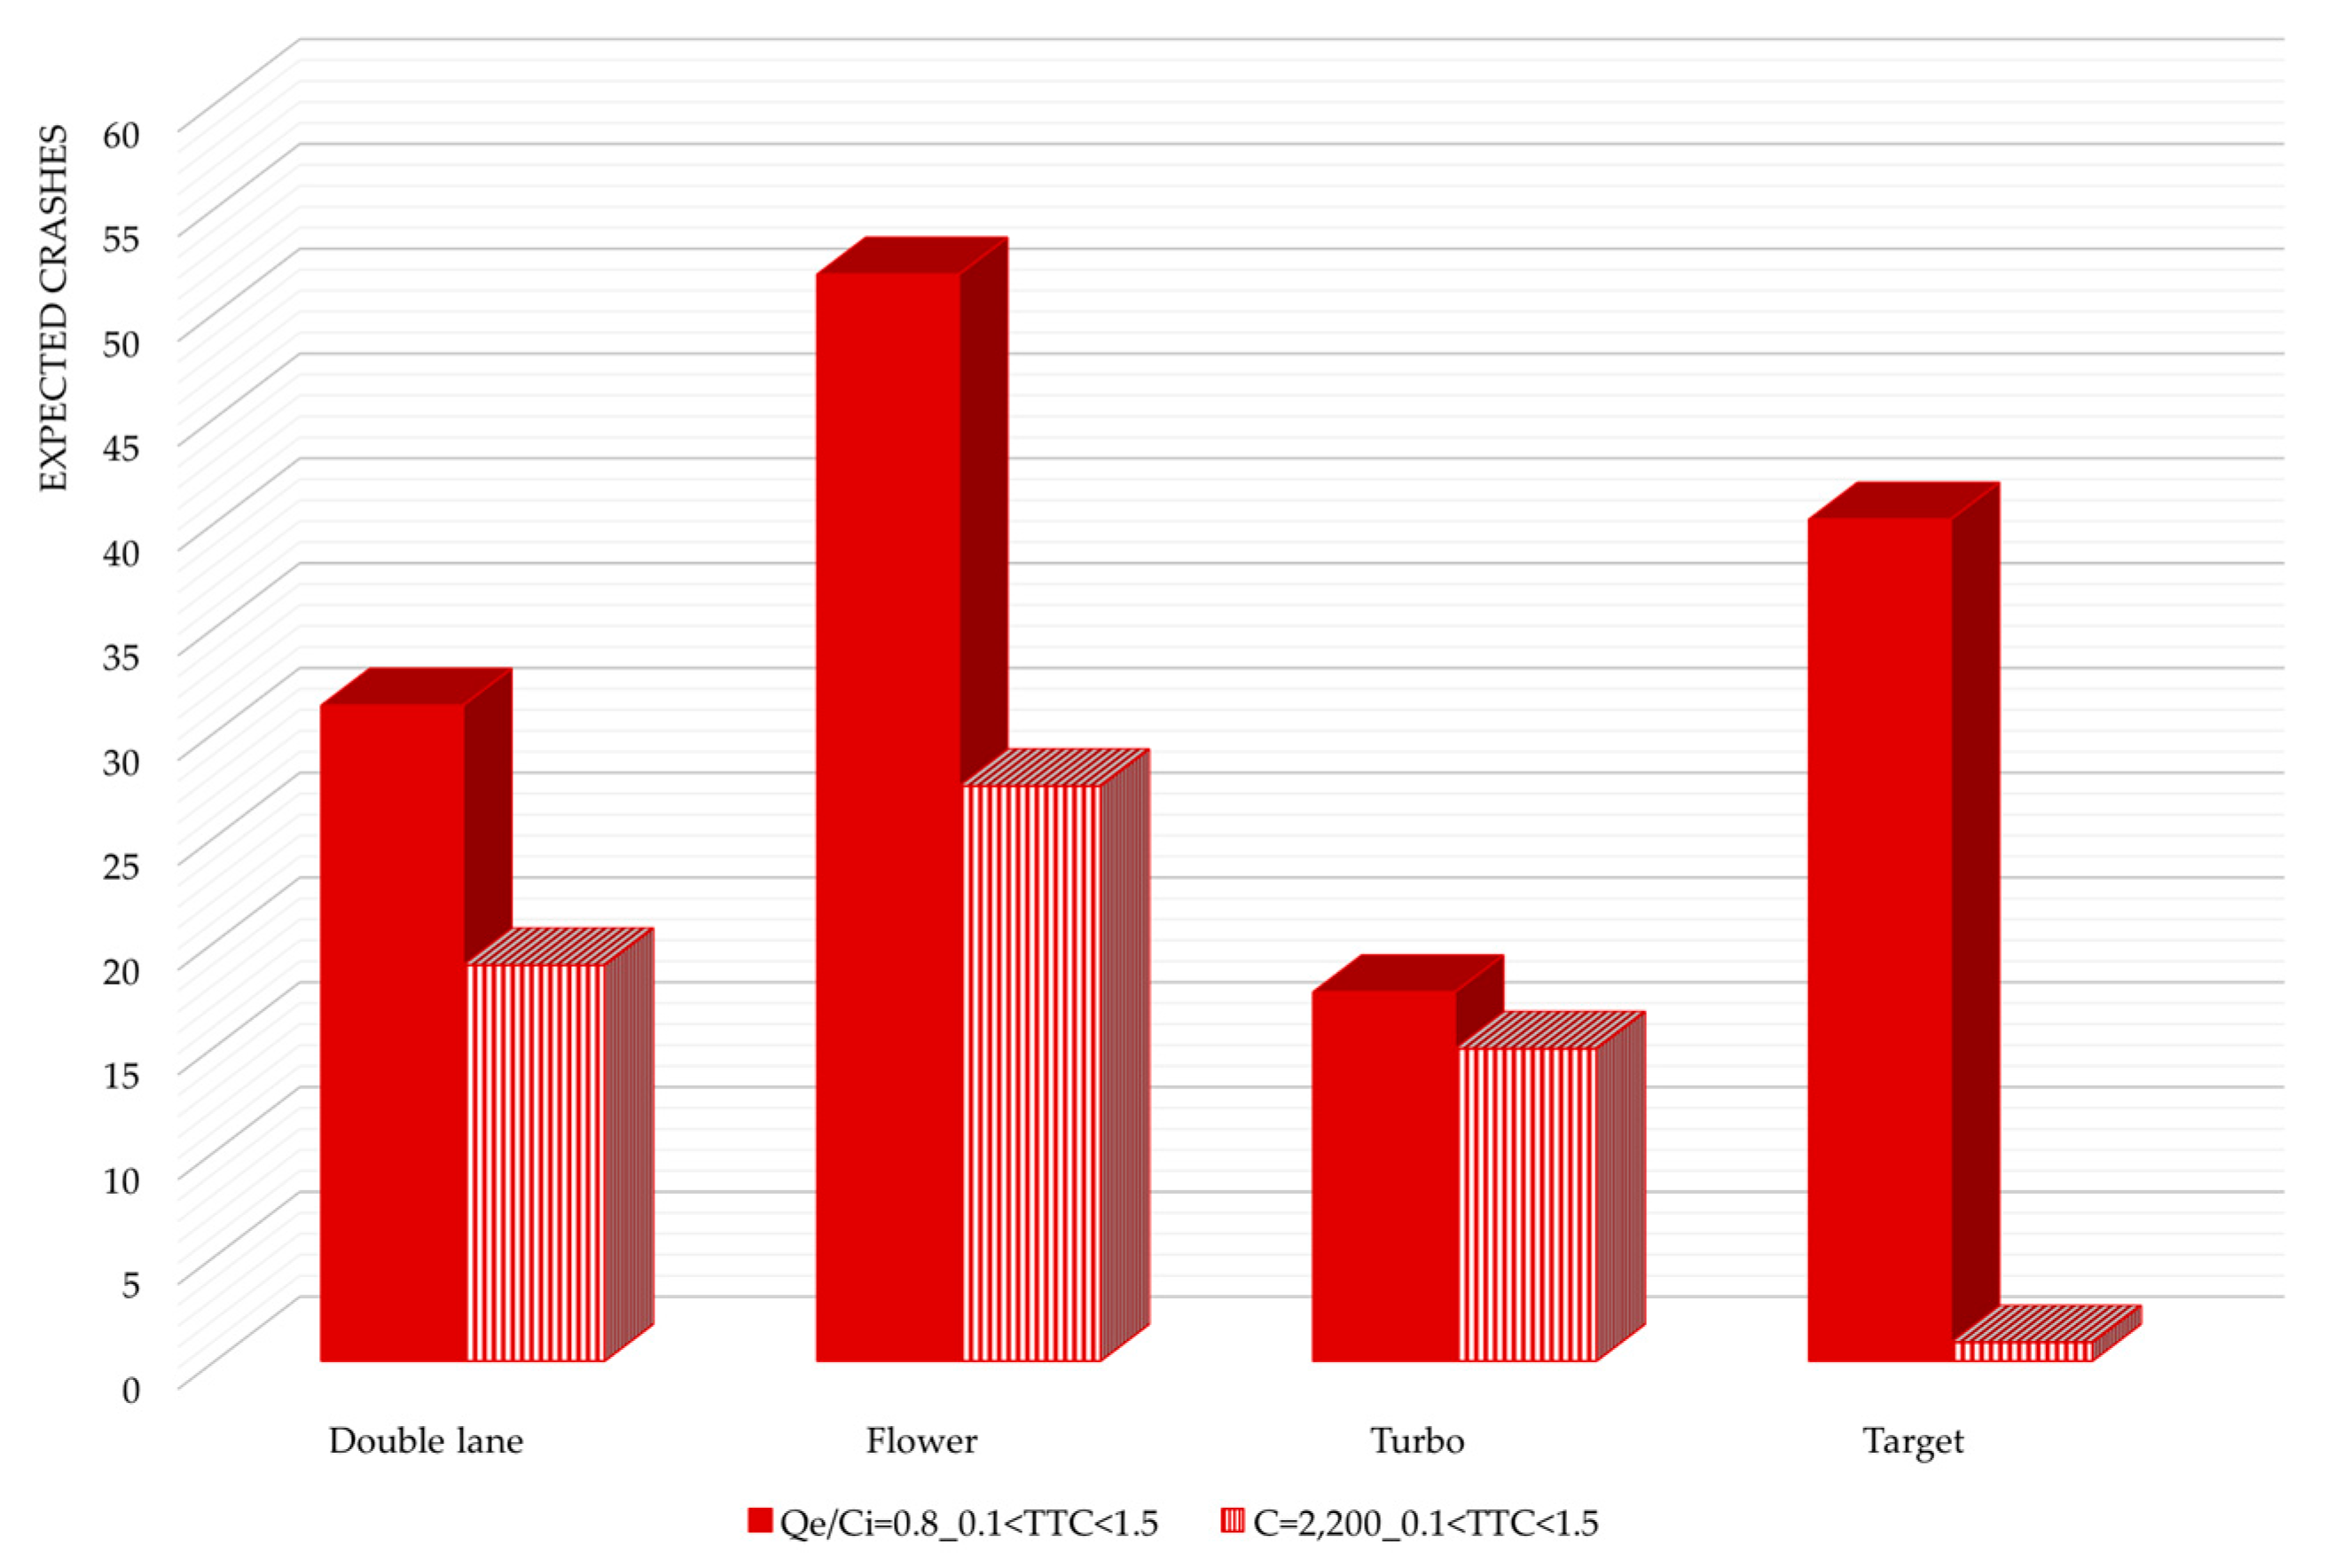
3.2. Safety Performance Measures

As mentioned earlier, these measures were derived using SSAM with the vehicle trajectory files from the VISSIM microsimulation. The time to collision (TTC) is a safety indicator based on an objective measure of speed and distance for conflicting road users in relation to a common conflict point [17]. The post encroachment time (PET) is a safety indicator that represents a measure [18] of the elapsed time between the departure of an encroaching vehicle and the actual arrival of a trailing vehicle at the same location. TTC and PET are both indicators of collision propensity, with smaller minimum values during a conflict event indicating a higher probability of, or nearness to a collision [19]. For TTC, the analysis was conducted with conflicts specified as both 0.1 s < TTC <1.5 s. For the PET indicator, conflicts were specified as 0.5 s < PET < 2.5 s. Among the data associated with each conflict is a MinTTC variable, which is the simulation time where the minimum TTC value for that conflict was observed [20]. That variable was used to filter out all conflicts that occurred during the simulation time.
Three comparative safety evaluations were conducted based on different measures:
-
The First V and Second V MinTTC value, i.e., the speed of the first and second vehicles at MinTTC, for entry flows of 0.8 V/C (absolute and normalized per 1000 vehicles) and for 2200 veh/h;
-
The estimated conflicts from SSAM. This is done for entry flows of 0.8 V/C (absolute and normalized per 1000 vehicles) and for 2200 veh/h;
-
Estimated crashes based on applying estimated conflicts (for entry flows of 0.8 V/C and for 2200 veh/h) in crash-conflict models;
Figure 6 shows that the First V MinTTC value, i.e., the speed of the first vehicle at MinTTC, is almost the same for the double lane, the turbo, and the target roundabouts, but is lower in the flower roundabout. A similar trend was obtained for Second V MinTTC (Figure 6), i.e., the speed of the second vehicle at MinTTC, for which the flower roundabout again has the lowest average value.
Figure 7 shows a comparison of the estimated conflicts for entry flows of 0.8 V/C and entering flows of 2200. The best performance is achieved by the turbo roundabout layout when the entering flow is equal to 0.8 V/C. The flower roundabout and the target roundabout have essentially the same level of potential conflicts when the entering flow is equal to 0.8 V/C, likely a result of the higher traffic volume at these layouts (3680 veh/h for the flower and 4400 veh/h for the target roundabouts). On the other hand, for the same entering flow of 2200 veh/h, the turbo roundabout is the best solution among the three at-grade layouts, while the target roundabout’s apparent superiority is likely due to the considerable overdesign for this traffic volume level, as noted earlier.
In Figure 8, it is possible to see that the pattern in the conflict path or density is quite different among the roundabout designs evaluated for the given traffic (2200 veh/h). The double-lane roundabout concentrates the conflicts along the ring; the flower roundabout concentrates the conflicts both along the arms and the ring; the turbo roundabout shows the most conflicts along the arm. Finally, the target roundabout shows very few conflict events.
For the comparison of estimated crashes, the crash-conflict models developed by Saulino et al. [21] for roundabouts were used. These models were as follows:
PHC AAS = e α × PHV β 1
CRA = e α × PHC AAS β 1 × YEARS
The conflict prediction models, which are reproduced in Table 4, contain the peak hour volume (PHV), and considers the peak hour conflicts simulated (PHCAAS) in Equation (3) before estimating crashes (CRA) with Equation (4), whose parameters are also shown in Table 4.
The results of the comparison are depicted in Figure 9, which reflects the results based on conflicts, showing that the turbo roundabout had the best safety performance for the at-grade roundabouts, and the flower roundabout had the worst.
At first glance, it would seem counterintuitive that the flower roundabout, with separated right turns, has the worst safety results based on conflicts. However, the flower roundabout performance in terms of safety could depend on the O/D matrix selected as well as the traffic flow considered. For example, the matrix considered was not focused on right-turn maneuvers, so just 33% of the movements were right turns, in contrast to the 66% of movements that were either left turn or through. In addition, for the hourly traffic flow considered, it is possible that some types of conflicts such as rear-end could proliferate. Thus, for the O/D matrix considered when the simulated traffic flow was equal to 80% of capacity, the flower roundabout was the worse layout, but the relative safety performance improved for a traffic flow of 2200 veh/h, in that the flower roundabout had a larger improvement in safety performance (in terms of percent reduction in conflicts) than the double lane or turbo roundabouts.

4. Summary and Further Research

For this research, microsimulation was used to simulate traffic operations at roundabouts with standard and newer layouts at various levels of traffic volume. Performance measures were obtained, including measures of safety that were based on conflicts estimated from trajectories generated in the microsimulation.
Regarding operational performance measures, the target roundabout has the largest queue length when traffic volume is 80% of its capacity. On the other hand, normalized for 1000 vehicles entering, the target and the turbo roundabout values have similar queue lengths. The maximum value of average queue delay was obtained in the turbo roundabout, which also has the highest number of stops for both 80% of the capacity and 1000 vehicle entry flow levels. The comparison of the roundabouts at the same entry flow level (2200 veh/h) produces different results. In that case, for the O/D matrix considered, the flower roundabout has the largest queue length as well as queue delay. The target roundabout seems best at this demand level, unlike the case for operation at 80% of capacity, but this benefit must be considered in the light of the cost of construction, since the target roundabout is likely overdesigned and therefore not cost-beneficial for lower traffic demands. On balance, considering the three performance measures as a whole, the double lane roundabout seems best for both 80% of the capacity and 1000 vehicle entry flow levels.
Regarding safety performance measures, for both predicted conflicts and expected crashes, the highest values pertained to the flower roundabout and the lowest values for the target roundabout when the entering traffic is equal to 2200 veh/h. As was the case for the operational benefits, this advantage of the target roundabout is unlikely to be cost-beneficial, since it is overdesigned for this lower traffic demand. Considering the less expensive at-grade roundabouts—double lane, flower, and turbo—the best safety performance is attained by the turbo roundabout both for entry flows of 0.8 V/C and 2200 veh/h.
The research is on-going. In the near future, the layouts would be evaluated at different traffic volume levels given the promise of the comparative evaluation approach presented in this paper. In addition, the designs will be evaluated in the presence of automated vehicles at various penetration levels by applying behavioral parameters in VISSIM that have been proposed in recent and on-going research by others.

Supplementary Materials

Supplementary File 1

Author Contributions

Tullio Giuffrè provided the framework for the research program and the methodological approach. He defined the operational inputs for simulations, developed the simulation parameter calibration approach and, finally, reviewed the study findings. Salvatore Trubia and Antonino Canale performed the traffic simulations by Vissim and then the conflict analysis by SSAM. Bhagwant Persaud provided oversight for the crash prediction evaluation and high level editorial review of the paper.

Conflicts of Interest

The authors declare no conflict of interest.

References

  1. Tollazzi, T. Alternative Types of Roundabouts; Springer: New York, NY, USA, 2015. [Google Scholar]
  2. Tollazzi, T.; Mauro, R.; Guerrieri, M.; Renčelj, M. Comparative Analysis of Four New Alternative Types of Roundabouts: “Turbo”, “Flower”, “Target” and “Four-Flyover” Roundabout. Period. Polytech. Civ. Eng. 2016, 60, 51–60. [Google Scholar] [CrossRef]
  3. Higle, J.L.; Witowski, J.M. Bayesian Identification of Hazardous Locations Transportation Research Record; TRB; National Research Council: Washington, DC, USA, 1988; pp. 24–31. [Google Scholar]
  4. Giuffre, O.; Grana, A.; Giuffre, T.; Marino, S.; Marino, R. Flower roundabouts and double-lane roundabouts: A comparative performance analysis. Arch. Civ. Eng. 2014, 60, 349–365. [Google Scholar] [CrossRef]
  5. Tollazzi, T.; Jovanovic, G.; Rencelj, M. New type of roundabout: Dual one-lane roundabouts on two levels with right-hand turning bypasses—‘‘Target roundabout’’. Promet-Traffic Transp. 2013, 25, 475–481. [Google Scholar] [CrossRef]
  6. Tollazzi, T.; Tesoriere, G.; Guerrieri, M.; Campisi, T. Environmental, functional and economic criteria for comparing “target roundabouts” with one or two-level roundabout intersections. Transp. Res. Part D 2015, 34, 330–344. [Google Scholar] [CrossRef]
  7. Archer, J.; Kosonen, I. The Potential of Micro-Simulation Modelling in Relation to Traffic Safety Assessment. In Proceedings of the ESS Conference 2000, Hamburg, Germany, 28–30 September 2000. [Google Scholar]
  8. VISSIM 5.30 User Manual—PTV Planug Transport Verkehr AG; Manufacture: Karlsruhe, Germany, 2011; Available online: https://www.et.byu.edu/ msaito/CE662MS /Labs/VISSIM_530_e.pdf (assessed on 12 November 2017).
  9. Gettman, D.; Pu, L.; Sayed, T.; Shelby, S. Surrogate Safety Assessment Model and Validation: Final Report; Report No. FHWA-HRT-08-051; Turner-Fairbank Highway Research Center: McLean, VA, USA; Federal Highway Administration: Washington, DC, USA, June 2008.
  10. Sayed, T.; Zein, S. Traffic conflict standards for intersections. Transp. Plan. Technol. 1999, 22, 309–323. [Google Scholar] [CrossRef]
  11. Erfan, A. Investigation of Automated Vehicle e Ects on Driver’s Behavior and Tra c Performance; Linköpings Universitet: Linköping, Sweden, March 2016. [Google Scholar]
  12. Hagring, O. A further generalization of tanner’s formula. Transp. Res. Part B Methodol. 1998, 32, 423–429. [Google Scholar] [CrossRef]
  13. Hagring, O. Derivation of Capacity Equation for Roundabout Entry with Mixed Circulating and Exiting Flows. Transp. Res. Rec. J. Transp. Res. Board 2000, 1, 91–99. [Google Scholar] [CrossRef]
  14. Giuffrè, O.; Granà, A.; Tumminello, M.L. Exploring the uncertainty in capacity estimation at roundabouts. Eur. Transp. Res. Rev. 2017, 9, 18. [Google Scholar] [CrossRef]
  15. Feldman, O. The GEH measure and quality of the highway assignment models. In Proceedings of the European Transport Conference, Glasgow, UK, 8–10 October 2012. [Google Scholar]
  16. Shahdah, U.E. Integrating Observational and Microscopic Simulation Model for Traffic Safety Analysis. Master’s Thesis, University of Waterloo, Waterloo, ON, Canada, 2014. [Google Scholar]
  17. Hyden, C. The Development of a Method for Traffic Safety Evaluation: The Swedish Traffic Conflicts Technique; University of Lund, Lund Institute of Technology Department of Traffic Planning and Engineering: Scania, Sweden, 1987. [Google Scholar]
  18. Shelby, S.G. Delta-V as a Measure of Traffic Conflict Severity. In Proceedings of the 90th Annual Meeting of the Transportation Research Board Compendium of Papers, Washington, DC, USA, 23–27 January 2011. [Google Scholar]
  19. Chin, H.C.; Quek, S.T. Measurement of Traffic Conflicts. Saf. Sci. 1997, 26, 169–185. [Google Scholar] [CrossRef]
  20. Souleyrette, R.; Hochstein, J. Development of a Conflict Analysis Methodology Using SSAM; Final Report; Center for Transportation Research and Education, Iowa State University: Ames, IA, USA, August 2012. [Google Scholar]
  21. Saulino, G.; Persaud, B.; Bassani, M. Calibration and application of crash prediction models for safety assessment of roundabouts based on simulated conflicts. In Proceedings of the 94th Transportation Research Board (TRB) Annual Meeting, Washington, DC, USA, 11–15 January 2015. [Google Scholar]
Figure 1. Typical layouts of roundabouts evaluated (a) Standard; (b) Turbo; (c) Flower; (d) Target.
Sustainability 09 02084 g001
Figure 2. Matrix (ρ) of traffic distribution and assumed roundabout layouts: (a) double-lane roundabout; (b) turbo roundabout; (c) flower roundabout; (d) target roundabout.
Sustainability 09 02084 g002
Figure 3. Calibration curve for double lane roundabout: VISSIM vs Hagring model.
Sustainability 09 02084 g003
Figure 4. Comparison of absolute and normalized operational performance measures for different roundabout layouts for entry flows of 0.8 of capacity (V/C = 0.8).
Sustainability 09 02084 g004
Figure 5. Comparison of operational performance measures for different roundabout layouts for entry flows of 2200 veh/h.
Sustainability 09 02084 g005
Figure 6. Comparison of First and Second V MinTTC for different roundabout layouts for entry flows of 0.8 V/C, for 1000 veh/h and for 2200 veh/h.
Sustainability 09 02084 g006
Figure 7. Predicted conflicts by Surrogate Safety Assessment Model (SSAM) for each roundabout at C = 2200 veh/h and Q = 0.8 V/C.
Sustainability 09 02084 g007
Figure 8. Conflict maps for each roundabout design at C = 2200 veh/h: (+) Crossing; (Δ) Lane change; (O) Rear end. (a) Double-lane roundabout; (b) Turbo-roundabout; (c) Flower roundabout; (d) Target roundabout.
Sustainability 09 02084 g008
Figure 9. Estimated crashes for each roundabout design starting from Surrogate Safety Assessment Model (SSAM) simulation considering 0.1 < TTC < 1.5.
Sustainability 09 02084 g009
Table 1. Geometric parameters and capacities of roundabouts evaluated.
Roundabout TypeN° of LanesCapacity (veh/h)Outer Diameter (m)
RangeEffectiveRangeEffective
Double lane2200–4000316040–7066
Turbo2200–4600298040–7056
Flower2200–550036804–7055
Target2280–65004400>7072
Table 2. Interpretation of GEHi (Geoffrey E. Havers) and GEH values.
GEHiGEHInterpretation
GEHi < 5GEH > 85%Acceptable value
5 < GEHi < 1085% < GEH < 70%Probable error in model development or wrong data
GEHi > 10GEH < 70%High probability of error in pattern development or wrong data
Table 3. GEH results obtained from simulation.
Roundabout TypeN° of LanesGEH (%)
Right LaneLeft Lane
Double lane287.5100
Turbo287.587.5
Flower 287.587.5
Target 287.587.5
Table 4. Conflict prediction and expected prediction models used for the comparison.
ParameterEquation (3)Equation (4)
Estimatep-ValueEstimatep-Value
α−6.287<0.0001−0.78240.0378
β11.3577<0.00010.68280.0003
β2----
AIC (Akaike information criterion)191.8165.5
MPB (Mean prediction bias)0.303−0.026
MAD (Mean absolute deviation)6.531.26
MSE (mean squared error)156.73.62

