Abstract
Land development and redevelopment (LDR) is essential to economic growth and the advancement of urbanization in urban China. Moreover, various factors affect LDR. Based on an investigation, during 2003–2016, which involves 420 parcels within a 2-km section of the Nandu River, Haikou city, this paper employs a logistic model, so as to judge the impact of LDR on these parcels, and then with an improved hedonic model, it sets out to explore the LDR influencing factors. Specifically, the results show that the impact mechanism of LDR in China is different from countries where economy is the main influencing force. Moreover, China’s urban land development results from the cooperation and competition between local government and enterprises, with a particular focus on multiple political and economic factors. Hence, the paper innovatively incorporates quantifiable political and property factors that significantly influence the results. Finally, the paper tries to explain the variance from macro-level government and micro-level enterprises perspectives. In conclusion, China’s land development requires cooperation among the government and enterprises, in order to improve the economic, social, and environmental benefits of land use.
1. Introduction
Land and people are the foundation of every nation, while in urban areas, rapid economic and social development is exerting sustained pressure on land demand [1]. China has recently experienced rapid urbanization, and the availability of land to boost China’s economy has two main features, namely the production and the foundation of urban development. In general, the recent sustained growth and sharp increase of China’s economy do not necessarily result from the privatization of production, but the thorough reform of the planned economic distribution mechanism. North [2] believes that institutional changes determine social evolution and are key to understanding historical changes. Since the three-decade reform and opening-up of China, its land use system has changed. Land has transformed from being free to charged; non-negotiable and open-ended land use rights have also been converted into negotiable and time-limited tenures. As a part of production, land starts to play a role in social wealth distribution. In the 1990s, under GDP-led performance appraisal, local governments actively developed land, providing infrastructure to change “raw land”. Also, by means of public land bidding, transfers, and auctions, enterprises were allowed to carry out more intense land development. Land has changed from a traditional resource to a capital, becoming the largest assets of local governments. By monopolizing land, local governments receive large amounts of revenues during land development and transfer [3]. However, there exists an eternal conflict between humankind and land. Demands for any form of land use are invariably greater than land supply [4], and with the accelerated development of urbanization, urban land resources are becoming increasingly scarce. As a result, one of the most effective solutions is to reuse land and accommodate changing demands [5]. Facing the transformation of new land development to the stock land redevelopment, land redevelopment has drawn much attention. The government and private enterprises work together to revitalize and optimize stocked land, playing the most important and powerful roles in LDR.
LDR is influenced by many factors. With multiple stakeholders, governments, and enterprises are concerned about different factors and economic interest [6]. Dennis R. Capozza & Robert W. Helsley [7] studied the impact of incremental urban expansion on the prices of urban and agricultural land. They pointed out that the rural communes were entitled to the rights of land development, resulting in increasing land prices and costs of the urban fringes. Besides, it showcases the current incremental land development in China. For the Chinese local governments, on the one hand, with the rapid expansion of the cities and increased awareness of rural residents’ rights to protect their properties, the low-cost incremental expansion development model is challenged by surging development costs. On the other hand, with the development of the urban economy, the commercial value of urban areas has soared. Therefore, in most of the cities during this new period, land development models of “incremental expansion” and “stock optimization” co-exist. Under this new dual development systems, the analysis of land development and redevelopment is particularly important.
Research into economic factors of LDR has gradually improved with time. Pollakowski, Henry O. [8] believed that the impact of location, neighborhood, and other individual factors on urban land prices were verified early in the land hedonic price model, and he found from research in Cincinnati, United States, the combination of these factors could explain 83% of urban land price changes. William Alonso [9] revealed the scarcity and location value of land on the basis of Von Thünen model. To sum up, land use involves various production resources, indicating location has a profound economic significance. Whether it is agricultural, industrial, or residential land, if a premium location is decided upon, not only can we reduce production costs, but also enjoy multiple high-quality resources, obtaining greater economic benefits. Haider & Miller [10] pointed out that as the business center gathers, a variety of high quality resources, the closer the land is to the Central Business District (CBD), the higher the land price will be, which in turn increases potential land exploitation. They concluded that the distances to the arterial roads and downtowns (city centers) have a significant impact on land prices. Cheshire, P & Sheppard, S [11], David, R. & Keith Ihlanfeldt [12] concluded convenient traffic conditions have a positive impact on the growth of land prices, while the negative effects of traffic, such as noise and high crime rates, may also reduce the potentials of land development and utilization. Newer studies for example from the Netherlands [13], Sweden [14], or Korea [15] confirm the decrease of property value due to traffic noise; however, the reductions are not unique Neighborhood factors can enhance the value of land parcels, thereby enhancing the possibility of land development and redevelopment. Jud & Watts [16] showed that good public schools nearby will enhance the possibility of land development. Haurin, D.R. & Brasington, D., David M. Brasington & Diane Hite [17,18] suggested that school quality is complementary to environmental quality. For urban policies, a large number of empirical studies have focused on the impact of urban planning, urban land use mechanisms and other political factors of land prices. Brueckner, Jan. K., Green. R.K., Anil, Rupasingha, and Stephan, J. Goetz [19,20,21] all found that urban planning, urban growth control, and other political factors increase land use efficiency, which also increases land prices and affects the possibility of the development and redevelopment of parcels. Li. M. M&, Brown, H.J. [22] and other scholars [23,24] found that if the government had a constant public investment in one region, the land prices in that area increased, and the possibility of development and utilization also increased accordingly. However, in China, the government has absolute control over land and in addition to economic aspects, political factors have a significant impact on land development. Land in China can be divided into two main categories: state owned and collective land owned by farmers. The dual ownership of land in China means that the land is owned by the state or is collectively owned by famers, which includes urban and rural collectives. Whether it be incremental land development or stock land redevelopment, all land is closely characterized by these two types. The original ownership of land is the basis from which the government and private enterprises select for development and investment. Therefore, the government often focuses on urban planning, transportation, natural resources, constant investment, and land reserved on the basis of the type of tenure. As for enterprises, they not only need to consider risk control, profit guarantee and operability of land development according to the type of tenure, but also take into account the external economic situation and the government’s macro-economic regulation on the social economy. In order to calculate their internal resources, determine if the financing channels are free and whether the cost of the project is within the estimated scope. The Government and enterprises have different emphases on the factors influencing the land development and redevelopment. On the basis of the most primitive property rights of land, the government and enterprises make continuous investment and development of different lands, and finally, the results of LDR are shown in Figure 1. The results show that government behavior and political factors are one of the main reasons for land development.
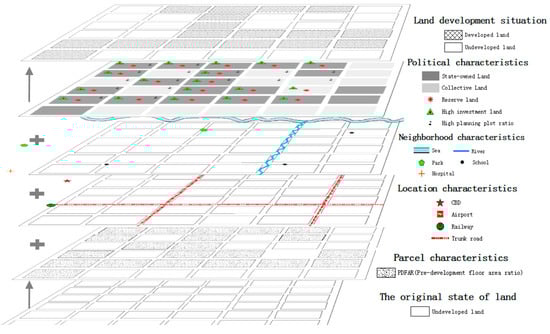
Figure 1.
Land development and redevelopment pattern under different factors.
2. Research Design
In this paper, we use the two-element logistic regression model to characterize the influence factors of urban sprawl and identify key impacts. The common regression models include linear regression, variant linear regression, and logistic regression, which are widely used in the research of influencing factors and mechanisms of urban development [25]. When compared with linear regression and variant linear regression, the application of logistic regression in the socio-economic field is more advantageous. In fact, the logistic regression model was used to evaluate the possibility of one land type being converted to another type by constructing the correlation between the various influencing factors and various types of land. The dependent variable is the development and redevelopment possibility of Haikou along the Nandu River, and two levels of qualitative variables are developed (= 1) and not developed (= 0). However, for a complex socio-economic system and the factors influencing the development of cities, often conventional assumptions cannot be made. These factors are composed of continuous variables and categorical variables. Logistic regression can express these variables and construct regression models [26]. The basic expression of the logistic regression model is as follows:
In this formula, P represents the probability of land development and redevelopment, and xi represents the factors influencing land development. β0, β1, …, βn are for regression coefficients whose values represent the contribution of each argument to the dependent variable p, using the weighted least squares, or Newton Raphson method, to solve each regression coefficient. A linear expression can be obtained by changing the Formula (1).
Then p is:
In the logistic regression model, the dependent variable can be a nonlinear function of the independent variable. The probability p value will change with y and further characterize the significance of the independent variable.
2.1. An Improved Hedonic Model for Land Development & Redevelopment
A hedonic price model is used to construct the factor system that influences urban land development and redevelopment. The main reason for the development and redevelopment of land is its value, while the measurement of land value usually adopts the hedonic model. The traditional hedonic model is mainly based on the construction of the real estate market. The standard hedonic price function for the sale of a building is given by the following equation [27]:
where P represents the sales price of an existing building, Xi represents the building characteristic at number i, Yj represents the location characteristic at number j, Zk represents the neighborhood characteristic at number k, U1 represents other variables that have an influence on the sales price, and f(*) denotes the idiographic function.
P = f(Xi, Yj, Zk, U1)
In China, government factors play an extremely important role in the land development and redevelopment market. This paper, based on the traditional feature price model, adds the quantitative political and property rights factors as an improved characteristic price model to analyze the development of typical cities in China. Let Y represent the land value. This paper puts forward an assumption that the parcel characteristics (X1i), location characteristics (X2i), neighborhood characteristics (X3i), and political characteristics (X4i) are the determinants of land value. This paper denotes the number of the variable in the context of each aspect and U2 represents other variables that have an influence on the land value. The land value equation is given by:
Y = f(X1i, X2i, X3i, X4i, U2)
2.2. Selection and Description of Independent Variables
- Parcel characteristicsThe characteristics of parcels generally meant physical elements, meaning the pre-development floor area ration (FAR). These attributes will not disturbed by external factors. There were no buildings or structures before the original parcels were developed, and the FAR was zero. However, most urban land has already been developed in the process of urbanization in China but the efficiency of use and economic benefits are low. There is also much unused land that is not developed after gaining approval and most housing amenities are not able to meet the needs of urban residents today. With the concept of land use intensification [28] and sustainable development based on urban smart growth that attempt to balance growth while fulfilling economic, social, and environmental needs [29,30], a large amount of urban stock land has been redeveloped. Thus, the concept of pre-development FAR was realized. If there are large structures or buildings on the original parcels, the pre-development FAR will be high, and the demolition of the original structures will be hampered to some extent. That directly results in a greater difficulty of redevelopment of the parcels. Based on the reasons above, this paper chooses pre-development FAR as the main feature variables of parcels.
- Location characteristicsThe influence of location characteristics on urban land prices is obvious. In most studies, location factors are divided into two groups, fixed location attributes [31,32] and location-related attributes [33]. Bhattacharjee, A. et al. [34] considered the second categories as spatial dependence, and spatial dependence may be caused by different kinds of spatial spill-over effects. The fixed location attributes are quantitative influence factors from the standpoint of the whole city, mainly referring to the influence degree of downtown areas. The location-related attributes mainly refer to the quantitative index of accessibility, which is focused on public transport facilities and arterial traffic. Alonso [9] uses normative analysis to prove that the degree of influence of downtown has an important impact on urban land prices which decrease with the distance from downtown. That means there is a negative gradient of urban land price. Some scholars have explained that land value is the result of mutual balance between central economic value, flowing cost, and neighborhood advantage, and pointed out the need for good planning activities and a balanced process of transformation in the city, to avoid social inequality and to promote the sustainable development of the city [35]. Urban main traffic and public transport facilities determine the accessibility of transportation, which is a “positive capitalization” of urban land prices. Proximity to urban rail transit can increase the accessibility of residents to downtown and promote employment opportunities in other parts of the city, as well as increasing land prices [11]. Therefore, this paper chooses the distance of the land parcel to the CBD, arterial traffic, airport, and railway as the specific variables of location characteristics.
- Neighborhood characteristicsLinneman’s [36] studies indicate that 15%–50% of land price changes are caused by neighborhood factors, which thus attract more LDR activities. Natural conditions of land parcels, such as near coastline or river, are the characteristics of advanced project development. Paul Cheshire & Stephen Sheppard [10] and Geoghegan, J. [37] thought that open spaces often lead to the possibility of development because of its pleasant features. Haikou has unique island scenery and a good ecological environment, and can be actively developed with leisure vacation, health care, shopping, travelling, and other tourism services, which will bring great opportunities for LDR.For man-made facilities, school, hospital, and park are important factors of neighborhood characteristics. Kain & Ouigley [38] and Walden [39] compared the relationships between the quality of different schools and urban land prices. The studies of Jae-Young Son showed that hospitals have a positive impact on urban land prices. As for studies related to parks, Richardson, H.W. Vipond. J. & Furbey. R. A. [40] found that land prices near parks were higher. Therefore, this paper chooses the sea, rivers, schools, hospitals and parks as important variables in the neighborhood characteristics.
- Political characteristicsPolitical characteristics are the main means for the government to control the depth and distance of urban development in temporal and spatial dimensions. On the issue of the property attributions, the first development of land ownership belongs to the government. However, the core of land redevelopment is the reconstruction of land development rights, which allows property to transform land exploitation from a lower-yield to a higher-efficiency, or to enhance land-use intensity for more revenue. When it comes to the distribution of this revenue from land development, some people think that the development rights of collective land should still be owned by the farmers. Whereas, other people think that the right of land redevelopment belongs to the government, even though this dampens the enthusiasm of the former land users, leading finally to a negative impact on economic growth and reduced potential for land reutilization. According to the Concentric Zone Theory put forward by American sociologist E.W. Burges, the urban land function zoning model around the downtown of a city is an outward expanding concentric circle, which leads to different land values of different areas. The farther away the land parcel is from the downtown area, the poorer the land use is, and then the lower the rent and land value. Liu et al. [41] used ArcGIS spatial analysis and regression models to study the effect of development intensity factors and validated the spatial distribution of land use gradient, and has shown a strong distance decline law and the characteristic of centripetal. The Chinese government often takes the city center as the origin, divides the land according to the specific circumstances of each parcel, and stipulates the benchmark land price. That is, the closer to the central area, the greater the possibility of LDR. The government always uses its own benchmark land price as a means to control land. The FAR is also a key index of the government’s urban control planning, which uses the significance of society, economy and environment, and influences LDR. Generally speaking, when the land price unit is constant, the FAR is larger, the land use intensity is greater and the revenue for developers is higher. Rosen [42] and Anderson [43] proposed that the public capital that is provided by the government’s early fixed assets investment constituted the external environment characteristics of land, and the hedonic model was used to verify the feasibility of this model. The impact of land reserves on the land development market should be considered from the equilibrium system of land supply and demand. Land supply in the early stages of land reservation decreases, which leads to a rise of market demand. Then, land prices are promoted to rise to a certain extent, which improves the probability of LDR. The land reserve has a stabilizing effect on land prices in the long run. Developers use formal bidding, auction, or selling procedures to obtain the land. Some land parcels with superior location and price rising potential will lead to regional competition, thus promoting local land development. Therefore, this paper chooses the pre-development land property rights, benchmark land price, social investment in fixed assets, land reserves, and planning FAR as the key political characteristic variables.
In summary, explanatory variables can be divided into four categories: parcel characteristics, location characteristics, neighborhood characteristics, and political characteristics. The independent variables selected in this article are shown in Table 1.

Table 1.
Key factors influencing the land development and redevelopment.
The parcel characteristics include the pre-development FAR. The regression coefficient of pre-development FAR is expected to be negative. Location characteristics include the distance from land parcel to the CBD, arterial traffic, airports, and railways. This paper assumes that the closer the public transport infrastructure is to the specific land parcel, the more likely it is to be developed and redeveloped, so that the expected regression coefficient is negative. Neighborhood characteristics include the distance from the parcel to seas, rivers, schools, hospitals, and parks (regression coefficients are all expected to be negative). For political characteristics, since the government expects to use the resources that can be controlled for the planning of the city to guide the development and redevelopment of land, it is considered that the land property rights, benchmark land price, the planning FAR, the social investment in fixed assets, and the land reserve situation coefficient are positively correlated with the development of the land. Meanwhile, the state-owned land and urban collective land are expected to be more significant than rural collective land. The assignment and definition descriptions of the specific variables and the expected values are shown in Table 2.
Table 2.
Descriptive statistics of the dependent variables.
We chooses a typical Chinese rapid development city, Haikou, as the case study. Based on the development and redevelopment situation of 420 blocks along the Nandu River of Haikou, the key factors of its exploitation and utilization are studied. Based on the improved hedonic price model, the influencing factors are divided into four parts, including parcel characteristics, location characteristics, neighborhood characteristics, and political characteristics. On the basis of the above analysis, some institutional factors such as quantifiable political factors and property rights factors are added, and different hypotheses in the previous literature are tested. The framework of this paper is shown in Figure 2.
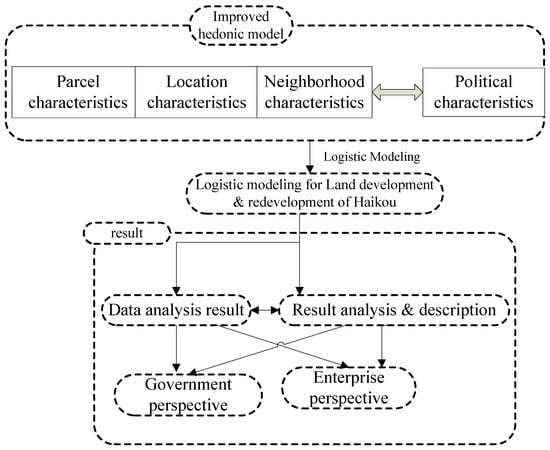
Figure 2.
Framework of this paper.
3. Data and Analysis
3.1. Study Area Selection
Hainan province has a unique island culture. Haikou is the capital of Hainan province and the youngest capital city in China, and its urban development is in a high-speed state. The urbanization rate of Haikou was increased from 57% in 2004 to 80% in 2016 (from the Haikou Statistical Yearbook 2004–2016), and experienced a rapid urbanization project. In the process of urbanization, urban main area expands rapidly, and urban population proportion keeps rising. At the same time, the Haikou government has seized the opportunity to build an international tourism island and vigorously developed the tourism industry to promote urban development. However, there are more than 290 villages in the main city of Haikou, living in nearly 510,000 people. There are serious contradictions in the internal dualistic structure of the city. Therefore, the selected 420 coastal areas along the river are also the fastest growing areas in Haikou. There is a certain proportion of villages within the study area. All of these provide a strong basis for the study of urban LDR in China.
3.2. Data
Our research area is a two-kilometer-wide area of Haikou along both sides of the Nandu River, and across six areas: Haidian Island, Meilan District, Qiongshan District, Xinbu Island, Jiangdong District (along the river), and the town of Lingshan. The total area is approximately 36.39 km2. From 2003 to 2016, there were 239 parcels developed and redeveloped. The basic structural characteristic data of all of these parcels are derived from the Haikou Statistical Yearbook, the Haikou Overall Plan, Haikou Bureau of Land and Resources, and other government departments in Haikou. These structural characteristic data include urban master planning, regional planning, block coordinates, reserve situation, planning FAR, pre-development land property rights, the social investment in fixed assets, and benchmark land price. This research also uses geographic information systems (GIS) and The Haikou City Master Plan (2011–2020). The final sample consists of 420 parcels with a specific address and basic information as shown in Table 3. The sample parcels are located in six districts along both sides of the Nandu River, as shown in Figure 3.
Table 3.
The six regional basic situation of the Nandu River on both sides.
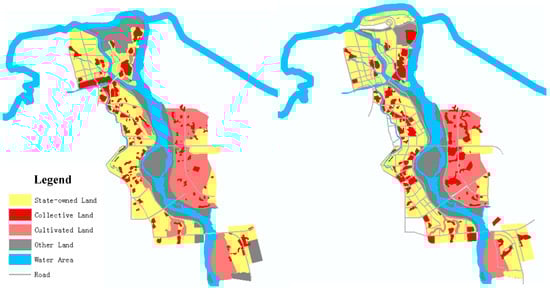
Figure 3.
The land property right change of Haikou (2003–2016).
3.3. Data Analysis Results
Several types of data pre-processing and logistic regression analysis were conducted and the regression model results are shown in Table 4. According to the results, Overall Percentage represents the overall simulation accuracy and if the value is higher than 80%, the better the effect of the logistic regression model. In this paper, the Overall Percentage value is 87.9%. If the p value is less than 0.01, which means the results are significance. According to the regression result, the p value is 0.005. The estimator is significant. It can be seen that the overall simulation accuracy is high, and the model fits the sample data well. The coefficients and their significance are stable in several operations, which reflect the scientific nature and credibility of the model.
Table 4.
Estimation results of the model for land development and redevelopment.
3.4. Results Analysis
The mechanism of LDR in Chinese cities is the combination of policy and economic orientation, which is the result of mutual cooperation and competition between government and enterprises. The status of land development and redevelopment in the research area as shown in Figure 4. Therefore, this article explains the variables from the two different standpoints of the government and enterprises. For the government, it focuses on analyzing the factors that affect land development from a macro perspective. In the selection of LDR, the first consideration is given to the transport resources, natural resources, and the economic condition of the developed blocks. As for enterprises, they usually focus on economic revenue and the long-term development by themselves, and more attention is paid to the feasibility of the project and the economy of the enterprise. It shows that the land development mechanism of the government + enterprises is the main driving force for urban development. From the perspective of government and enterprises, the four types of factors in the improved hedonic model are analyzed separately.
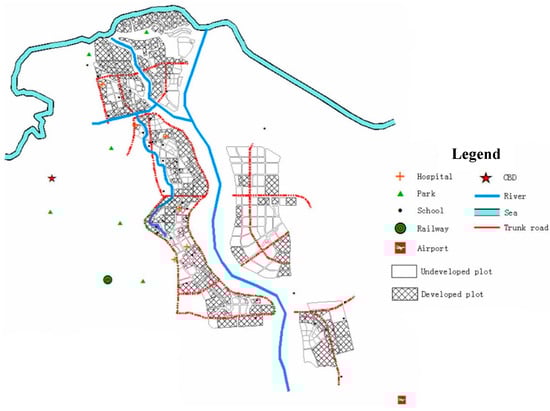
Figure 4.
The land development & redevelopment result of the Nandu River on both sides, Haikou.
3.4.1. For the Government
- Parcel characteristicsAs expected, the regression coefficient of the pre-development FAR is negative. That means that the higher the pre-development FAR, the more difficult it is for the land to be developed and redeveloped. Land demand is a kind of derived demand. Because Haikou is a seaside city with tropical characteristics, the development of its tourism led to a rapid development of the real estate industry. High housing prices led to high land prices and a high demand for land [44,45]. Now, the land supply is a “double-track” system, which means that the first is the government’s administrative allocation and paid transfer in the primary land market, and the second is the supply of the stock land. Many countries and cities promoted FAR to achieve an efficient use of land. For example, in Singapore, the provision of FAR is generally 1.6–2.3, while in Japan it is stipulated between 1 and 4, and in Hong Kong it is between 6 and 10. Many experiences show that an appropriately high FAR will not only create economic benefits, but also alleviates the shortage of land. Major stock land in Haikou is inefficient and low FAR, between 0–2. Some of this FAR is more than 2, which represents the original concentration of urban village agglomeration land. The government wants a balanced development of urban areas and efficient use of urban villages near the city center, will be affected by the original inhabitants and developers and other pressure. Therefore, the higher pre-development FAR, the lower the probability of land development.
- Location characteristics and Neighborhood characteristicsBoth the Disttrunkroad and the Distrailway are negatively correlated with the dependent variable, which embodies the idea that public transport, the government’s extremely advantageous resource, not only optimizes the convenience of traffic for urban residents, but also results in industry accumulating in the planning area. This contributes to the overall development of the city and regional economic growth. Since 2003, Haikou has vigorously developed the traffic system that matches the city’s spatial layout, constructing urban arterial roads and at the same time, while taking into account the existing important roads to open up the whole city. In the sample area, several main roads have been built, such as Guoxing Road and Binjiang Avenue. Main Roads, as a part of the transport network, provide opportunities to increase land prices [10]. The Haikou Railway Station, which has the most radiating networks to the sample area, is an important transportation hub connecting the old parts of the town with the new. This not only achieves the functions of an urban light rail network, but is also included in the East-ring railway planning. The coastline is the most important natural resource for Haikou. The regression coefficient of DISTSEA is the same as what was expected. It shows that the closer the proximity of the land parcel to the sea, the more easily it can be developed. Based on the needs of the island inhabitants to improve their living conditions and the tourism requirements of visiting non-residents, the government has made full use of the sea resource and constructed infrastructures for the coastline, thus speeding up the development and redevelopment of land.
- Political characteristicsSIFA (the social investment in fixed assets), the positive regression coefficient, which shows that the government’s urban investment is an important factor of land development and redevelopment. According to the data provided by the government, this paper divides SIFA into three different groups according to the degree of social investment in fixed assets by government during 2003 to 2016. SIFA has a gradient effect on LDR based on the lowest fixed investment from the government. The more fixed investment the government has, the higher the possibility of LDR. SIFA can improve the infrastructure, public service facilities, and environment of the specific land parcel by building rainwater drainage, sewerage, power and gas works, public traffic systems, and residential and recreational facilities. At the same time, it promotes the industrial agglomeration in the neighborhood and takes full advantage of the combined effect caused by economies of scale [46]. Because of the different needs of city planning, the government has different prophase investment elements in different parcels of land, which has made a solid foundation for the structural adjustment of urban space and the determination of land use, thus greatly improving the probability of LDR according to different plan attributes.
In this model, the positive coefficients of land reserve situation are the most significant, meaning that if the land is reserved by the government, it will be easy to develop and redevelop. The target for implementation of the land reserve system in all of the countries is to reduce speculative behavior and control the rapid rise in land prices. Some scholars believe that land reserves cannot reduce land prices, but may be counterproductive [47]. The nature of land reserves determines its intrinsic driving force for promoting land prices, and establishes the market-oriented distribution order of land elements, forming the tender, auction, and transfer system to raise the market entry threshold and breaking the regional restriction of real estate development enterprises. Because of its unique natural and geographical environment, Haikou has ceased the opportunity of development and introduced many high-quality real estate enterprises with strong capital to enter the market, and consequently combined the land directly with the capital. Due to the entry of strong capital, the parcels were developed and redeveloped in rapid succession.
3.4.2. For the Enterprise
- Parcel characteristicsThe government’s urban planning often expects all regions of the city to develop evenly. Therefore, for the cost of demolition of the land which has a large amount of original old buildings, the government will often transfer it to the enterprise to bear. For the enterprise, the pursuit of profit is preferred. Due to the gradual improvement of law and the improvement of residents’ consciousness of safeguarding their rights, the parcels with higher volume rate before the renewal will lead to the obstruction of urban housing demolition. The obstruction of urban housing demolition is an important factor that leads to the redevelopment and utilization of the land cannot be carried out smoothly, which leads to waste of land resources. There are many specific reasons for the obstruction of demolition: not unified the minimum standard of compensation, relocation difficulties, demolition, reconstruction, resettlement, requires a lot of cost, income redistribution of property demolition problems, and so on. In some old urban districts with better location conditions, the problem of demolition obstruction is particularly serious. Therefore, the pre-development FAR is a very important indicator of enterprises.
- Location characteristics and Neighborhood characteristicsEnterprises in the choice of land development will focus on the selection of location characteristics and neighborhood characteristics. Generally, the more advantageous resources of the land is more easily favored by enterprises, and enterprises has a stronger desire and driving force to promote LDR. The results of this study show that the main roads and railway stations are the most important factors for enterprises to profit growth. The strong resources, such as the sea, are the focus of competition among the major enterprises. However, contrary to the expectation, the DISTCBD regression coefficient shows that the enterprise has different consideration on the influence of the city center on the surrounding region’s land. Given their own costs and profits, companies will show cautious thinking and systematic cost-budgeting for parcels that are closer to downtown, which land costs rise, echoing the political factors behind them.
- Political characteristicsLand Property Rights are classified as categorical variables, taking rural collective land as the contrast. The regression coefficient of land property right (1) represents a significant level of state-owned land relative to rural collective land. Land property rights (2) represents the significance of the urban built collective land relative to the rural collective land. State-owned land mainly includes the highly efficient constructed land, idle land, and inefficient constructed land. Among them, the idle land and inefficient constructed land belong within the category of stock land. The result of the regression shows that the coefficients of state-owned land relative to all collective land are positive and significant. The main reason is due to the efficient and intensive plan and use of the stock land by Haikou government. In 2007, the stock construction land in Haikou that had been revitalized and reintroduced into the market was an important source of the whole year’s land supply (as shown in Table 5). Haikou carried out two large-scale disposals of idle land since 2013. Governments at all levels have carried out a comprehensive clean-up of state-owned construction land that was originally supplied by means of transfer, assignment, and lease. Governments have also carried out a remediation of unused and inefficient state-owned lands. They have invested a lot of effort to activate the stock land and reclaim the unused land. The unused land has been put onto the land market again and has become an effective supplement to the raw land market.
Table 5. Land use situation during 2007 in Haikou.
The insignificant nature of land property rights (2) indicates that neither the urban collective land nor the rural collective land is the primary choice for development and redevelopment. Here, they both are referred to as collective land. With the increasing shortage of land resources, there are many reasons for inefficient uses of storage and space resources in collective land. Because of the poor foresight of the government’s early urban planning, the lack of power in the village land acquisition, and the lack of land control, the majority of urban villages have spread. The difference of the architectural form of the house and land location results in villages near the city centers increasing building floors to expand the scale of construction, while the suburban villages increase the scale of construction by expansion in both the horizontal and vertical planes. Later, land in a prime location was used for the development of real estate, but some of them are not developed because of the high cost of relocation and compensation. For the villages with unfavorable locations that are far from downtown, the use of urban and rural mixed land provides opportunities for spatial expansion and urbanization of suburban villages. As for the rural collective land, farmers can change farmland into rural homesteads, which offsets the loss caused by land expropriation, housing demolition and incremental expansion of land. But the spatial scope of land has shifted, resulting in a sharp decrease in cultivated land area. Changes in collective land use are shown in Figure 5.
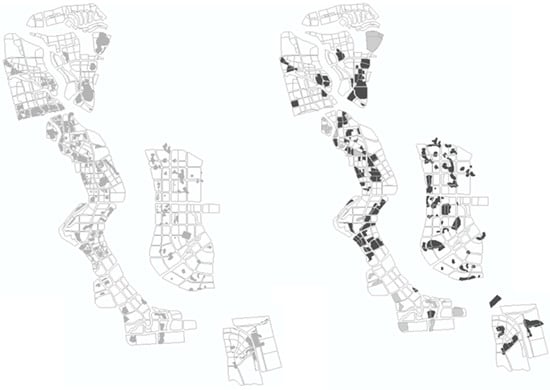
Figure 5.
The collective land use changes in Haikou from 2003 to 2016 (Darker patches represent an increase in the number of building floors compares with light patches).
Benchmark land price and planning FAR are all contrary to expectations, which shows the prudence of enterprises’ acquiring land from the angle of economic benefit. For the land that is closer to the city center, its intensity, use of income, scarcity, and planning FAR are higher. For the most of real estate development enterprises in China, project financing is the financing of a particular project in which a lender is satisfied to look initially to the cash flows and earnings of the project as the source of funds from which a loan will be repaid and to the assets of the economic unit as collateral for the loan [48]. If the land price is high, then the fund will be used to purchase land, and it will be occupied for a quite long time with the financing cost. Enterprises that consider their own economic benefits and risk control are often really cautious of the parcels that are close to the city center and have a high planning FAR. Enterprises should take sufficient consideration of costs and future markets. To sum up, enterprises tend to maintain a cautious attitude towards land with higher benchmark land price and higher planning FAR.
4. Conclusions
With the new stage of China’s urbanization, the land development pattern in China has changed. Because of rising visible and invisible costs in land development and redevelopment, urban development has changed from simple incremental expansion to the parallel development model of incremental land development and stock land redevelopment. The influencing factors of urban LDR are mainly composed of four characteristics: parcel characteristics, location characteristics, neighborhood characteristics, and political characteristics. Within these characteristics, the government features are particularly important in the LDR market in China. Through political process and government decision-making, the government can intervene and control the pattern of LDR, in order to overcome the weakness of market operations and to achieve the balance of land resource distribution as far as possible. The government system dominated by policy intervention and the enterprise system dominated by interest will often cause a divergence of views and conflicts of interest because of differing concerns.
The initial stage of China’s urbanization development, the government’s expropriation of land in accordance with the general government documents of land expropriation procedures. At the same time, because of the low awareness of the residents’ rights, the compensation fee of the original inhabitants is also compensated according to the lower standard of the document, so the cost of taking land in the initial stage is lower, and other factors that affect the urban development are obvious except for the political factors. With the improvement of the education level and living standard of the residents, the residents’ awareness of safeguarding rights has increased, which leads to a substantial increase in the cost of demolition and the city expands difficulty to enlarge. LDR mechanism of Government + enterprise has gradually become dominant land development mechanism. China’s current LDR situation has changed. If a parcel has the characteristics of low LDR difficulty and a low updating cost, then the parcel is more easily developed and redeveloped. Therefore, due to parameter changes, some of the less qualified parcels cannot be developed; many urban villages with unfavorable development conditions, high development costs, and large property disputes are shelved. The uneven development of land parcel leads to the pattern of patch development in the city, and to a series of problems, such as urban public service support, traffic support, and social contradiction. However, China’s current land development mechanism, with combined participation from both government and enterprises, will only lead to this uneven development of urban scale. Urban planners can draw on the shortcomings of the above development pattern to avoid the uneven urban development and irrational allocation of resources, thus promoting the sustainable development of the city.
Acknowledgments
This work is supported by the Fundamental Research Funds for the Central Universities (106112015CDJSK03XK11).
Author Contributions
For author contributions, Tao Zhou, Rui Zhao designed the study. Rui Zhao collected and analyzed the data. Tao Zhou controlled quality assurance. Yulin Zhou analyzes and combs the whole article’s logic.
Conflicts of Interest
The authors declare no conflict of interest.
References
- Addae-Dapaah, K. Utilization of urban residential land: A case study of Singapore. Cities 1999, 16, 93–101. [Google Scholar] [CrossRef]
- North, D.C. Institutions, Institutional Change and Economic Performance; Cambridge University Press: New York, NY, USA, 1990. [Google Scholar]
- Cai, M. Land for welfare in China. Land Use Policy 2016, 55, 1–12. [Google Scholar] [CrossRef]
- Ozcan, H.; Cetin, M.; Diker, K. Monitoring and assessment of land use status by GIS. Environ. Monit. Assess. 2003, 87, 33–45. [Google Scholar] [CrossRef] [PubMed]
- Wang, H.; Shen, Q.; Tang, B.-S.; Skitmore, M. An Integrated Approach to Supporting Land-Use Decision in Site Redevelopment for Urban Renewal in Hong Kong. Habitat Int. 2013, 38, 70–80. [Google Scholar] [CrossRef]
- Lai, Y.; Peng, Y.; Li, B.; Lin, Y. Industrial land development in urban villages in China: A property rights perspective. Habitat Int. 2014, 41, 185–194. [Google Scholar] [CrossRef]
- Capozza, D.R.; Helsley, R.W. The Stochastic City. J. Urban Econ. 1990, 28, 187–203. [Google Scholar] [CrossRef]
- Pollakowski, H.O. Data Sources for Measuring House Price Changes. J. Hous. Res. 1995, 6, 377–387. [Google Scholar]
- Alonso, W. Location and Land Use: Towards a General Theory of Land Rent; Harvard University Press: Cambridge, MA, USA, 1964. [Google Scholar]
- Haider, M.; Miller, E. Effects of transportation infrastructure and locational elements on residential real estate values: Application of spatial autoregressive techniques. Transp. Res. Rec. 2000, 1722, 1–8. [Google Scholar] [CrossRef]
- Cheshire, P.; Sheppard, S. On the Price of Land and the Value of Amenities. Economica 1995, 62, 247–267. [Google Scholar] [CrossRef]
- Bowes, D.R.; Ihlanfeldt, K.R. Identifying the Impacts of Rail Transit Stations on Residential Property Values. J. Econ. 2001, 50, 1–25. [Google Scholar] [CrossRef]
- Levkovich, O.; Rouwendal, J.; van Marwijk, R. The effects of highway development on housing prices. Transportation 2016, 43, 379–405. [Google Scholar] [CrossRef]
- Andersson, H.; Jonsson, L.; Ögren, M. Property Prices and Exposure to Multiple Noise Sours: Hedonic Regression with Road and Railway noise. Environ. Resour. Econ. 2010, 45, 73–89. [Google Scholar] [CrossRef]
- Kim, K.S.; Park, S.J.; Kweon, Y.J. Highway traffic noise effects on land price in an urban area. Transp. Res. 2007, 12, 275–280. [Google Scholar] [CrossRef]
- Jud, G.D.; Watts, J.M. A further Note on Schools and Housing Values. AREUEA J. 1985, 13, 425–462. [Google Scholar] [CrossRef]
- Haurin, D.R.; Brasington, D. School quality and real house prices: Inter-and intrametropolitan effects. J. Hous. Econ. 1996, 5, 351–368. [Google Scholar] [CrossRef]
- Brasington, D.M.; Hite, D. Demand for environmental quality: A spatial hedonic analysis. Reg. Sci. Urban Econ. 2005, 35, 57–82. [Google Scholar] [CrossRef]
- Brueckner, J.K. Strategic Control of Growth in a System of Cities. J. Public Econ. 1995, 57, 393–416. [Google Scholar] [CrossRef]
- Green, R.K. Land Use Regulation and the Price of Housing in a Suburban Wisconsin County. J. Hous. Econ. 1999, 8, 144–159. [Google Scholar] [CrossRef]
- Rupasingha, A.; Goetz, S.J. Land Use Research: Scientific Publications from 1986 to the Present. Land Use Res. 2001, 8, 2–10. [Google Scholar]
- Li, M.M.; Brown, H.J. Micro-neighborhood externalities and hedonic housing prices. Land Econ. 1980, 2, 125–141. [Google Scholar] [CrossRef]
- Tang, P.; Shi, X.; Qu, F. Local government competition and land financial strategies. Resour. Sci. 2014, 4, 005. [Google Scholar]
- Li, L.H.; Wong, S.K.; Cheung, K.S. Land supply and housing prices in Hong Kong: The political economy of urban land policy. Environ. Plan. C Gov. Policy 2016, 34, 981–998. [Google Scholar] [CrossRef]
- López, E.; Bocco, G.; Mendoza, M.; Duhau, E. Predicting land cover and land use change in the urban fringe. A case in Morelia city, Mexico. Landsc. Urban Plan. 2001, 55, 271–285. [Google Scholar] [CrossRef]
- Cheng, J.; Masser, I. Urban growth pattern modeling: A case study of Wuhan city, China. Landsc. Urban Plan. 2003, 62, 199–217. [Google Scholar] [CrossRef]
- Sirmans, G.S.; Macpherson, D.A. The composition of hedonic pricing models. J. Real Estate Lit. 2005, 13, 3–41. [Google Scholar]
- Lindenmayer, D.B.; Cunningham, S.A.; Young, A.G. Land Use Intensification: Effects on Agriculture, Biodiversity and Ecological Processes; CSIRO Publishing: Collingwood, Australia, 2012. [Google Scholar]
- Tjallingii, S.P. Ecology on the edge: Landscape and ecology between town and country. Landsc. Urban Plan. 2000, 48, 103–119. [Google Scholar] [CrossRef]
- Gillham, O. The Limitless City: A Primer on the Urban Sprawl Debate; Island Press: Washington, DC, USA, 2002. [Google Scholar]
- Follain, J.R.; Jimenez, E. Estimating the demand for housing characteristics. Reg. Sci. Urban Econ. 1985, 15, 77–107. [Google Scholar] [CrossRef]
- Orford, S. Valuing location in an urban housing market. In Proceedings of the 3rd International Conference on Geo-Computation, University of Bristol, Bristol, UK, 17–19 September 1988. [Google Scholar]
- Dubin, R.A.; Sung, C.H. Specification of hedonic regressions: Non-nested tests on measures of neighborhood quality. J. Urban Econ. 1990, 27, 97–110. [Google Scholar] [CrossRef]
- Bhattacharjee, A.; Castro, E.A.; Marques, J.L. Spatial interactions in hedonic pricing models: The urban housing market of Aveiro, Portugal. Spat. Econ. Anal. 2012, 7, 133–167. [Google Scholar]
- Manganelli, B.; Murgante, B. The Dynamics of Urban Land Rent in Italian Regional Capital Cities. Land 2017, 6, 54. [Google Scholar] [CrossRef]
- Linneman, P. Some empirical results on the nature of the hedonic price function for the urban housing market. J. Urban Econ. 1980, 8, 47–68. [Google Scholar] [CrossRef]
- Geoghegan, J. The Value of Open Spaces in Residential Land Use. Land Use Policy 2002, 19, 91–98. [Google Scholar] [CrossRef]
- Kain, J.F.; Quigley, J.N. Evaluating the quality of residential environment. Environ. Plan. 1970, 2, 23–32. [Google Scholar] [CrossRef]
- Walden, M.L. Magnet Schools and the Differential Impact of School Quality on Residential Property Values. J. Real Estate Res. 1990, 5, 221–230. [Google Scholar]
- Richardson, H.W.; Vipond, J.; Furbey, R.A. Determinants of urban house prices. Urban Stud. 1974, 11, 189–199. [Google Scholar] [CrossRef]
- Liu, M.H.; Wang, Y.X.; Dai, Z.Z.; Li, Q.Y. GIS-Based Urban Land Development Intensity Impact Factors Analysis; Springer: Berlin/Heidelberg, Germany, 2012; Volume 7530, pp. 341–348. [Google Scholar]
- Rosen, S. Hedonic Prices and Implicit Markets: Product Differentiation in Pure Competition. J. Political Econ. 1974, 82, 34–55. [Google Scholar] [CrossRef]
- Anderson, J.E. On testing the Convexity of Hedonic Price Functions. J. Urban Econ. 1985, 18, 334–337. [Google Scholar] [CrossRef]
- Altuzarra, A.; Esteban, M. Land prices and housing prices: The case of Spain. J. Hous. Built Environ. 2011, 26, 397–409. [Google Scholar] [CrossRef]
- Ooi, J.; Lee, S. Price discovery between residential land and housing markets. J. Hous. Res. 2006, 15, 95–112. [Google Scholar]
- Guo, H.M.; Jiang, M.Q.; Lu, J.; Sun, J.; Wang, J. Urban Spatial Economics; Economic Science Press: Beijing, China, 2002. [Google Scholar]
- Carr, J.; Smith, L.B. Public land banking and price of land. Land Econ. 1975, 51, 316–330. [Google Scholar] [CrossRef]
- Pan, J.N.; Huang, J.T.; Chiang, T.F. Empirical study of the local government deficit, land finance and real estate markets in China. China Econ. Rev. 2015, 32, 57–67. [Google Scholar] [CrossRef]


© 2017 by the authors. Licensee MDPI, Basel, Switzerland. This article is an open access article distributed under the terms and conditions of the Creative Commons Attribution (CC BY) license (http://creativecommons.org/licenses/by/4.0/).