Article

Value Assessment of Artificial Wetland Derived from Mining Subsided Lake: A Case Study of Jiuli Lake Wetland in Xuzhou

1
School of Geographic and Oceanographic Sciences, Nanjing University, Nanjing 210023, China
2
Xuzhou Environmental Supervision Detachment, Xuzhou 221018, China
3
Bureau of Land and Resources of Xuzhou, Xuzhou 221018, China
4
ASEAN Research Center, Guizhou University, Guiyang 550025, China
5
Institute of Geographic Sciences and Natural Resources Research, Chinese Academy of Sciences, Beijing 100101, China
6
Key Laboratory of Regional Sustainable Development Modeling, Chinese Academy of Sciences, Beijing 100101, China
*
Authors to whom correspondence should be addressed.
Sustainability 2017, 9(10), 1860; https://doi.org/10.3390/su9101860
Submission received: 4 September 2017 / Revised: 6 October 2017 / Accepted: 13 October 2017 / Published: 20 October 2017

Abstract

:
Mining subsided lakes are major obstacles for ecological restoration and resource reuse in mining regions. Transforming mining subsided lakes into artificial wetlands is an ecological restoration approach that has been attempted in China in recent years, but a value assessment of the approach still needs systematic research. This paper considers Jiuli Lake wetland, an artificial wetland derived from restoration of a mining subsided lake in plain area, as a case study. A value assessment model for the artificial wetland was established based on cost–benefit analysis by means of field monitoring, social surveys, GIS geostatistics, raster calculation methods, etc. Empirical analysis and calculations were performed on the case study region. The following conclusions were drawn: (1) after ecological restoration, ecosystem services of Jiuli Lake wetland which has become a national level wetland park yield positive values; (2) the improved environment of the Jiuli Lake wetland has a spillover effect on the price of surrounding land, resulting in land price appreciation; (3) using GIS geostatistics and raster calculation methods, the impact range, strength, and value of the spillover effect can be explicitly measured; (4) through the establishment of a value assessment model of the artificial wetland, incomes of the ecological restoration was found to be sufficient to cover the implementation costs, which provides a research foundation for economic feasibility of ecological restoration of mining subsided lakes.

1. Introduction

Due to a high proportion of underground mining, coal mining in China has caused serious land surface subsidence problems [1]. According to statistics, mining of every 1 × 10⁴ t coal in China results in 0.3 hm2 surface subsidence [2]. In regions with a high ground-water level, such as Jiangsu Province, Shandong Province, Anhui Province, etc., more than 50% of subsidence areas exhibited water accumulation [3]. For example, in Xuzhou city, Jiangsu Province, 0.5 × 10⁴ hm2 of subsidence areas are either perennial or seasonal waterlogged area, the average water depth is 3–3.5 m, and the deepest part is 7 m [4], which makes land reclamation infeasible. In recent years, the approach of artificial wetland parks with a focus on landscape modification based on local conditions has been a strategy used to restore the ecosystems of China’s mining areas [5,6,7,8,9]. With relatively mature ecological restoration technologies currently available [10], the success of these ecological restoration projects depends primarily on whether the value performance after restoration can offset the capital investment to implement the project, which determines the project’s economic feasibility. Thus, conducting value assessments for artificial wetlands derived from mining subsided lakes has important practical and theoretical significance for the implementation of ecological restoration projects.
Converting a mining subsided lake to an artificial wetland through ecological restoration significantly improves its wetland ecosystem and thus provides wetland ecosystem service as positive economic impacts. In this regard, Clarkson et al. considered that wetlands contribute provisioning, regulating, habitat, and cultural services which include water-quality improvement, flood abatement, biodiversity, etc. [11]. He et al. combined geospatial data and economic analysis to determine a monetary value for wetland ecosystem goods and services (EGSs) in the watersheds of the Yamaska and Bécancour Rivers (Quebec, city, Canada) [12]. Peh et al., who studied costs and benefits of a long-term initiative to convert drained, intensively farmed arable land to a wetland habitat mosaic in Cambridgeshire, UK, concluded that there was a substantial gain to society as a whole from the land-use conversion [13].
Transformed into a wetland park, the artificial wetland forms a graceful regional eco-environmental landscape after ecological restoration. Then, spillover effects are further generated in surrounding areas, such as increasing land value. Considering impact of environmental landscape on land prices, Hui et al. investigated the spatial spillover effects of urban landscape views in Guangzhou city via spatial econometric analysis and suggested that people in Central Business District are willing to pay an extra premium for enjoying a better environment [14]. In England, Gibbons et al. made a nationwide study of the value of proximity to a large number of natural amenities and revealed that gardens, green space and areas of water within the census ward all attract a considerable positive price premium [15].
However, current research on value assessments of artificial wetlands are mainly focused on the value of ecological services, and not enough attention has been paid to the spillover effects and the costs of the ecological restoration [16,17]. This study uses environmental economic theory, Geographic Information System (GIS) raster calculations, and geostatistics methods to conduct value assessments for artificial wetlands derived from mining subsided lakes. The assessment is based on in-depth consider of the lake’s value potential and ecological restoration costs. This research provides a basis for assessing the economic feasibility of ecological restoration for mining subsided lakes, and provides theoretical support for the reuse of mining resources.

2. Study Area and Methodology

2.1. Study Area

Jiuli Lake is a subsided lake located in the northwest mining area of Xuzhou City. The government started an ecological restoration project of Jiuli Lake from 2007 to 2013. At the end of 2013, Jiuli Lake was constructed as a national ecological wetland park with body area of 3.5 km2 and total area of 11.56 km2. The study area is located in high groundwater table plain area of east China with geographic coordinates of 117°4′14″–117°8′6″ E, 34°18′55″–34°21′8″ N. The location and image map of the area can be seen in Figure 1.

2.2. Methods

The value assessment of an artificial wetland derived from mining subsided lake is essentially a cost–benefit analysis problem [18]. Considering that ecosystem services value (ESV) represents a collective sum of utilitarian and non-utilitarian values from the artificial wetland ecosystem [19], we use it as the primary indicator for measuring the benefits of the artificial wetland. The spillover effect resulted from the ecological restoration of the artificial wetland is also included as a type of benefit in our analysis. Based on GIS geostatistics and raster calculation methods, this paper is primarily concerned with the spillover effect on land prices. Considering that the ecological restoration project is implemented year by year, we converted all benefits and costs into the same period to obtain the value level of the artificial wetland. The framework for the research is illustrated in Figure 2.
Based on the above framework on value assessment, the following assessment model is proposed:
P = Δ E S V ( 1 + r ) t / 2 + Δ S E ( 1 + r ) t / 2 C i ( 1 + r ) t / 2
In Equation (1), P is the value of the artificial wetland (unit: 10,000 RMB); ∆ESV is the appreciation of ecosystem services value after the ecological restoration (unit: 10,000 RMB); ∆SE is the spillover effect of the artificial wetland, which mainly considers the appreciation of surrounding land prices (unit: 10,000 RMB); Ci consists of the different types of costs of the ecological restoration; r is the social discount rate, defined as 8% based on “Economic Evaluation Methods and Parameters for Construction Project (Third Edition)”; and t is the duration from start to finish of the ecological restoration project (unit: year). Assuming all profits and costs are evenly distributed for the duration of the project, the corresponding time for discount is t/2. Based on the analysis above, when calculating the value of the artificial wetland, the key emphasis should be on the quantification of the appreciation of the ecosystem services value, spillover effect, and various restoration costs separately.

3. Results

3.1. Measurement on the Appreciation of the Jiuli Lake Wetland Ecosystem Services Value

3.1.1. Classification and Value Measurements of the Ecosystem Services

(1) Classification of the ecosystem services. After the ecological restoration, Jiuli Lake was converted to a wetland park, with its ecosystem structure significantly altered. Based on survey data, Jiuli lake wetland ecosystem consists of six different types of ecosystems, as shown in Table 1.
Based on relevant research on ecosystem services classifications [20,21], and considering the particularity of the research objects, ecosystem services of Jiuli Lake wetland were divided into three major categories: lifestyle and production-related material supply, life support and maintenance, and spiritual enjoyment. The evaluation index system of ecosystem services was established, as shown in Table 2.
(2) The measurement approach of ecosystem services value. The value of each ecosystem service in Jiuli Lake wetland was measured according to the following model:
E S V i = A i × V C i
In Equation (2), ESVi is the value of the ith ecosystem service, Ai is the area of the ith ecosystem type in the study area, and VCi is the ecological value coefficient, i.e., the value of the ecosystem service per unit area for the ith ecosystem type measured in monetary terms (in units of 10,000 RMB).
In this paper, the recreation value of Jiuli Lake is calculated by both use value and non-use value. The travel costs method is used to calculate the use value measured by calculating customer surplus [22,23],
C S = i n 0 T C * f ( T C i ) d ( T C i )
In Equation (3), CS is the total customer surplus (use value of recreation); n is the number of departure zones; TCi* is the marginal cost of travel in the ith departure zone; and f(TCi*) is the function of number of visitors and travel expense in the ith departure zone.
The conditional value method is used to calculate non-use values that calculated by arithmetic mean of WTP (willing to pay) × tourist volume of the scenery × ratio of WTP [24].
Based on previous research [25,26,27], the following methods were used to measure the value of ecosystem services of Jiuli Lake wetland, as shown in Table 3.
(3) Measurement of the appreciation. The appreciation of the ecosystem services value (∆ESV) of Jiuli Lake wetland can be further defined as the value increase for each ecosystem service after the ecological restoration, as measured by the following proposed equation:
Δ E S V = i = 1 9 ( E S V i t 1 E S V i t 2 )
In Equation (4), E S V i t 1 is the value of the ith ecosystem service after the ecological restoration, and E S V i t 2 is the value of the ith ecosystem service before the ecological restoration. The appreciation is measured for a total of nine ecosystem services.

3.1.2. Value Assessment and Appreciation of Ecosystem Services of Jiuli Lake Wetland

Based on the land utilization data of Jiuli Lake wetland in 2007 and 2013 provided by Xuzhou Land and Resources Bureau, the land area of various ecosystem types were counted (Table 4).
Questionnaire surveys were performed to assess the use-value with a period of one year in 2014, divided into two groups corresponding to slack season and busy season, and were randomly sampled. Tourist information from Xuzhou City and the surrounding 15 regions were surveyed and collected, with 712 questionnaires issued during the year, of which 653 valid responses were received. In assessing the non-use value, the permanent resident population in Xuzhou City at the end of 2013 was selected as the total evaluation population. The size of the sample was determined to be 800 by the Scheaffer equation [28]. In total, 788 questionnaires were received, among which 731 were valid. After the investigation year in 2014, a one-year time interval was selected to perform a second validation survey to verify the reliability of the result.
The measurement results for the value of the nine ecosystem services in 2007 and 2013 were summarized, and the appreciation of ecosystem the services value after ecological restoration of Jiuli Lake wetland was calculated. The results are shown in Table 5.
It can be observed from the data in Table 5 that the ecosystem services value of Jiuli Lake wetland appreciated significantly in 2013 compared to 2007, with a value increase of 1670.2343 million RMB, in which the greatest value increase is most significant for the revealing and releasing of recreational value.

3.2. Measuring the Spillover Effect of Jiuli Lake Wetland

Ecological restoration substantially improves the microenvironment of the mining subsided lake areas, which led to spillover effects. The most evident spillover effect is increasing surrounding land prices [29,30]. This study quantifies the spillover effect by measuring the value appreciation of the land price after ecological restoration.

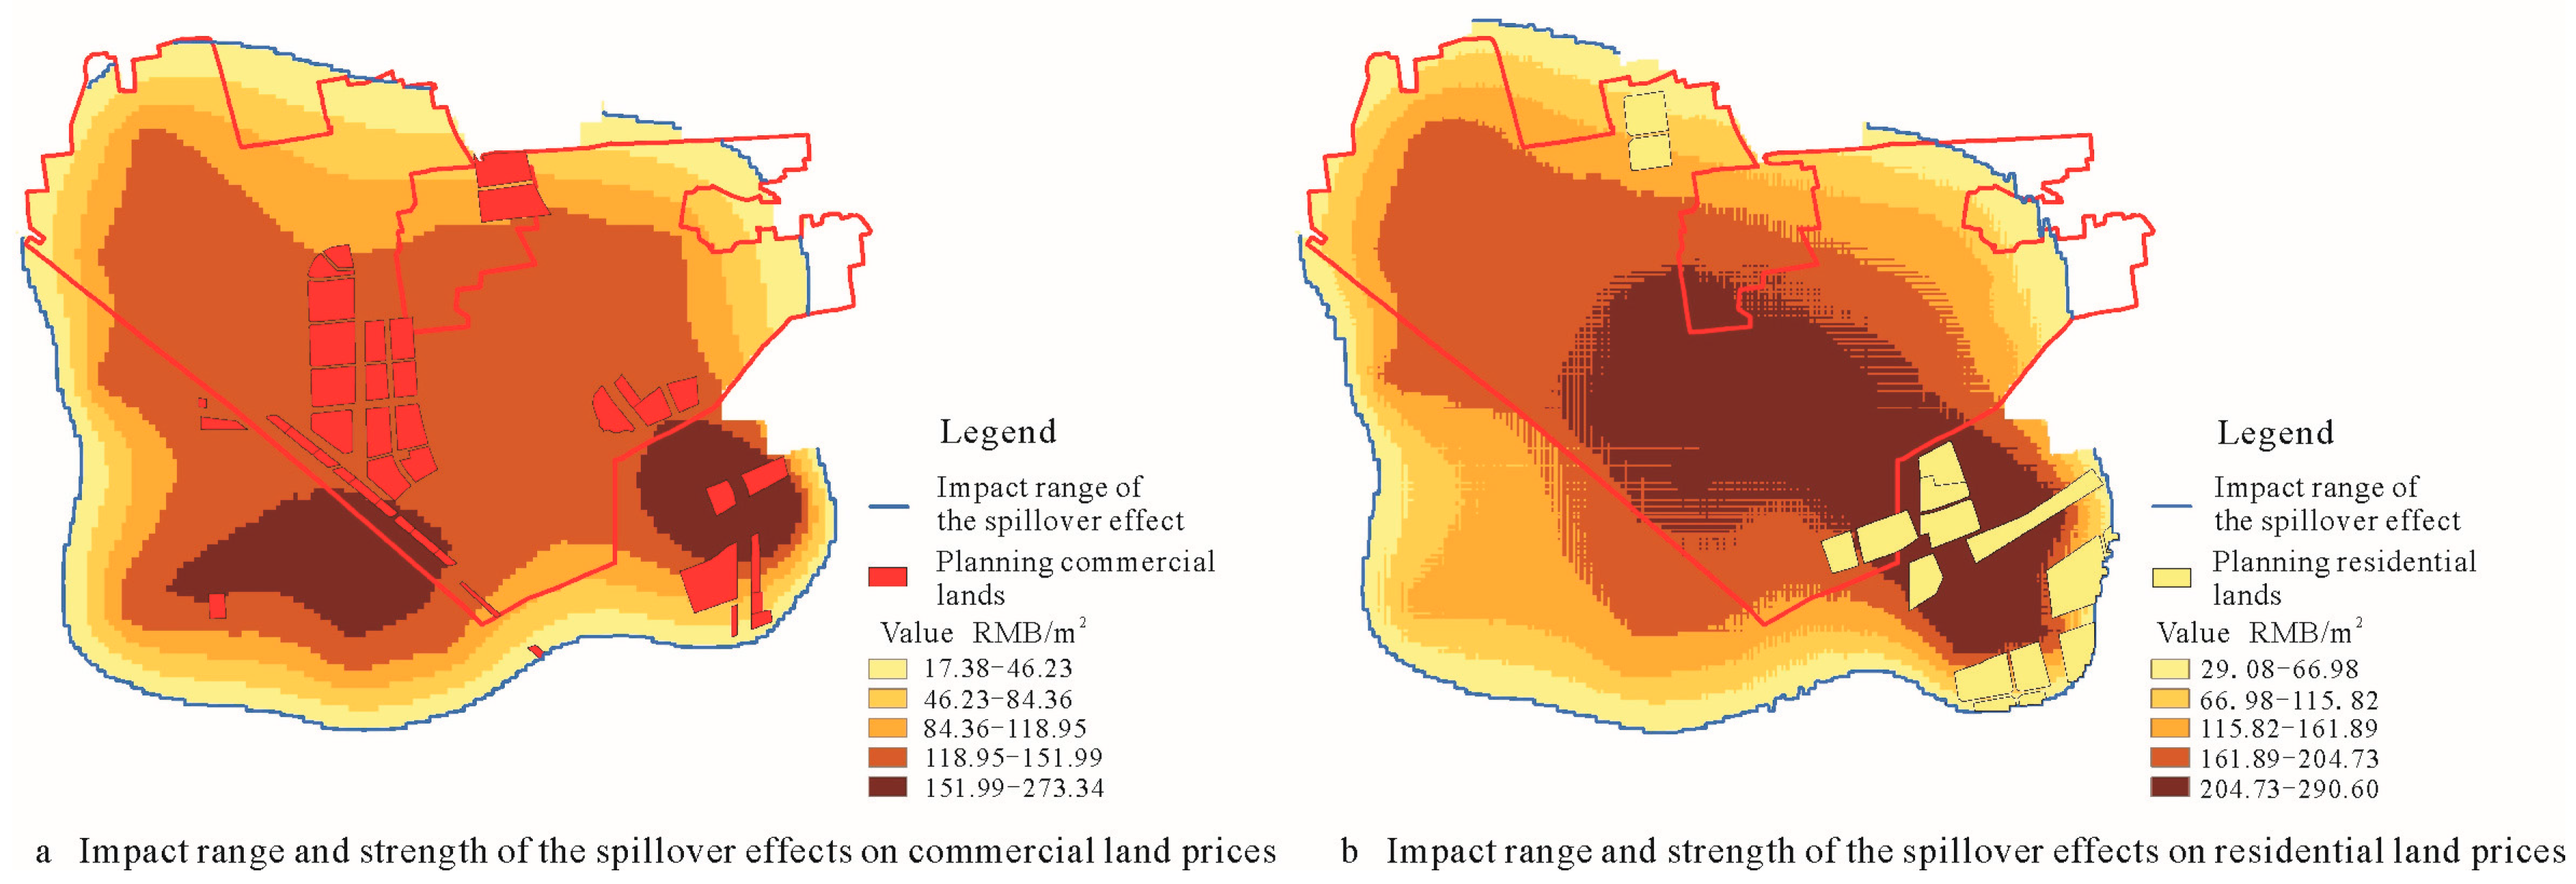
3.2.1. Measurement Approaches of the Spillover Effect on the Land Price

Land price appreciation is result of multiple factors. To measure independently the spillover effect on the regional land price by the artificial wetland, it is necessary to remove the natural land price growth factors. Circumstances at the time of restoration made it such that no major projects or factors could have influenced the land price in the study area except for the ecological restoration project, and this paper examined the spillover effect on land price using the following approaches. First, the average appreciation of the land price in the study area was measured before and after the ecological restoration, which showed the general changes in price. Second, the appreciation of land price surrounding the mining subsided lake before and after the ecological restoration project was measured and calculated to analyze the specific changes in price. Third, regions where the land price appreciation exceeded the average appreciation were identified. These regions were treated as the impact range of the spillover effect. Finally, the impact strength of the spillover effect was calculated by subtracting the average appreciation from the land price appreciation in the identified impact range. The specific values of the spillover effect were then calculated by using the raster calculation method. The measurement approach of the spillover effect is shown in Figure 3.
In Figure 3, if we suppose that the average land price appreciation is 30%, then the impacted area range of the spillover effect is the area with more than 30% land price appreciation. After subtracting the 30% average land price appreciation from the land price appreciation in the region, the impact strength of the spillover effect is obtained. The value of the spillover effect can be obtained using the grid calculation method.

3.2.2. Measuring the Value of the Spillover Effect

Prior research has shown that commercial and residential land prices are much more sensitive to improvements in ecological environment when compared to the price of industrial land [31,32,33,34]. Therefore, in this paper, the spillover effect of Jiuli Lake wetland was measured by the value appreciation of commercial and residential land. Field research showed that, during the study period from 2007 to 2013, no other major projects (such as construction of primary schools, hospitals or commercial centres) had significant impact on land price appreciation in the region except for the implementation of the ecological restoration project of Jiuli Lake.
Price samples were collected in the study area for 53 commercial and 74 residential lands in 2007, and 57 commercial and 81 residential lands in 2013 (data from Xuzhou land price dynamic monitoring sample survey). The reference assessment dates of the land price samples were 31 December 2007 and 31 December 2013, respectively. A nonparametric test using single sample k-s method showed that the land price of the samples corresponded to a normal distribution. Spatial auto-correlation analysis using Moran’s I index was used to verify the result [35,36]. The results showed that the data samples complied with a normal distribution and had spatially positive correlation, and the quality of the data satisfied the follow-up analysis. Based on the cross validation method, this paper used the interpolation verification function of the ArcGIS10.1 geostatistical module to generate interpolated estimation data using the optimal Kriging spatial interpolation model. The structure of variance function was tested and analyzed by the fitting parameters of GS+ geostatistics software. Based on this method, spatial interpolation analysis of the commercial and residential land price samples in 2007 and 2013 was performed in the study area. To ensure that the internal land quality and the external land price among grids were heterogeneous to accurately perform comparative analysis, we referred to the urban land grading raster method to determine the unit size of the raster dataset [37,38,39,40]. The land price surface obtained by interpolation was output as a raster file (Figure 4).
Based on the curved surfaces of residential and commercial land prices in the study area in 2007 and 2013, we applied the following equation to perform the raster calculation:
Δ L V i = ( L V i 2013 L V i 2007 1 ) × 100
In Equation (5), ∆LV is the average appreciation of land price in the study area, LV2013 is the land price level in 2013, LV2007 is the land price level in 2007, and i = 1, 2 corresponds to commercial and residential land prices, respectively. The average appreciation of residential and commercial land price in the study area from 2007 to 2013 were 23.29% and 29.22%, respectively.
Based on the raster calculation results of land price appreciation, contour analysis was performed, as shown in Figure 5.
In Figure 5, it can be observed that regions closer to Jiuli Lake wetland showed higher commercial and residential land price appreciation, and that the appreciation was significantly higher than the average land price appreciation in the study area. This indicated that the ecological restoration project in Jiuli Lake wetland did have a significant impact on the land price in its surrounding area, i.e., it generated a spillover effect of land value appreciation. By stripping away the average appreciation of commercial and residential land prices in the study area, areas with land price appreciation greater than the average appreciation were identified. These results showed that the impact ranges for the Jiuli Lake restoration spillover effect for commercial and residential land were 20.76 km2 and 21.07 km2, respectively. The results are shown in Figure 6.
After identification of the spillover effect range for land value appreciation around Jiuli Lake wetland, we applied the raster calculation method to remove the average land value appreciation of the region from the land value appreciation inside the affected range, in order to determine the impact strength of the spillover effect in land value appreciation (RMB/m2). At the same time, we applied spatial superposition analysis between the city planning layout of Xuzhou “Urban master planning of Xuzhou (2007–2020)” (revised in 2014)) and the impact range to determine the amount of commercial and residential land use in the affected region. The following equation was used to perform the raster calculation to determine the spillover effect of land value appreciation in Jiuli Lake wetland:
Δ S E = [ L V i j 2013 L V i j 2007 ( 1 + i r i ) ] × L V i j 2007 × S i j
In Equation (6), ∆SE is the value of the spillover effect of land value appreciation from the cological restoration; L V i j 2013 is the value of the jth land block with the ith land usage in 2013 within the affected range; i = 1, 2, corresponding to commercial and residential land value, respectively; L V i j 2007 is the value of the jth land block with the ith land usage in 2007 within the affected range; iri is the average value appreciation of land with the ith land usage over the area that included the study area; and Sij is the area of the jth land block with the ith land usage within the affected region. Using the method described above, the impact strength of the spillover effect in land value appreciation and the amount of commercial and residential land use in the affected range in Jiuli Lake wetland were determined, as shown in Figure 7.
From the analysis result in Figure 7 obtained using the raster calculation method, the average impact strengths of the spillover effect on commercial and residential land use were 135.76 RMB/m2 and 182.39 RMB/m2, respectively. The area of commercial and residential land use within the spillover effect range of Jiuli Lake wetland was 148.98 hm2 and 112.43 hm2, respectively. It can then be calculated that the added value to commercial and residential land use from the spillover effect was 202.2564 million RMB and 205.0709 million RMB, respectively. The total value added by the spillover effect (∆SE) was 407.3273 million RMB.

3.3. Measurement of the Cost of the Ecological Restoration Project

The ecological restoration project of Jiuli Lake wetland involved land clearing and resettlement of residents, land rearrangement, and environmental restoration. Therefore, the cost of the ecological restoration project was divided into three components: the cost of land clearing and resettlement compensation, the cost of land rearrangement, and the cost of environmental restoration.

3.3.1. The Costs of Land Clearing and Resettlement Compensation

Due to the different resettlement compensation standards between farmland and state-owned land, the cost of compensation for clearing and resettlement was further divided into the acquisition cost of collectively-owned land and the acquisition cost of state-owned land. The acquisition cost of collectively-owned land, including compensation for expropriated land and above-ground buildings, reclamation fees for cultivated land, management fees for expropriation, etc. [41,42,43]. All costs were calculated according to the relevant national standards and regulations, and local regulations [44,45,46]. The acquisition cost of state-owned land included compensation for buildings and building attachments, compensation for land and other miscellaneous costs (for instance, relocation costs, transit costs, and temporary resettlement subsidies) [47]. All these costs were determined by land price evaluation based on the market.

3.3.2. The Cost of Land Rearrangement

The cost of land rearrangement included the cost of land leveling and the cost of infrastructure facilities and its supporting utility systems, including the cost of land leveling in the project area and the cost of the supporting infrastructure for construction facilities such as roads, water supply, power supply, storm sewer system, sewage system, etc. The pricing scheme was determined by the project cost.

3.3.3. The Cost of Environmental Restoration

The cost of environmental restoration included the cost of the environmental water treatment project, the cost of the solid waste treatment project (treatment aimed at scientifically classifying, collecting, storing, and processing solid wastes in order to rationally recycle solid waste and reduce the impacts of waste disposal on the environment) [48,49], the cost of the waste gas treatment project in the mining area (treatment aimed at controlling coal dust pollution generated from coal mining, transportation, storage, and processing, as well as SO2 and dust generated from power production and coal processing) [50,51], and the cost of projects for water and soil conservation, landscape reconstruction, and recovery of the river ecosystem [52]. The pricing scheme was determined by the project cost.
Based on field surveys and data collected from government agencies including the Xuzhou Bureau of Land and Resources, the Urban and Rural Bureau of Construction, the Bureau of Environmental Protection and the Jiuli Lake National Wetland Park Management Office, the cost of the above items was calculated and summarized. The resulting total cost of the project was RMB 1,742,674,300. The detailed result is shown in Table 6.

3.4. Value Assessment of Jiuli Lake Wetland

As the ecological restoration project was implemented steadily from 2007 to 2013, and Jiuli Lake Park was also opened to the public year by year, the appreciation of ecosystem service value (∆ESV) and the spillover effect (∆SE) can be realized gradually during the project implementation, and the cost of ecological restoration can be treated as a constant input too. Thus, the time scale of converting these two benefits was set to t/2, or 3.5 years, and the cost could also be converted with a time scale of t/2, or 3.5 years. Based on the previously established value assessment model for the artificial wetland, taking the measurement result of benefit and cost into Equation (1), the following results were obtained:
P = Δ E S V ( 1 + r ) t / 2 + Δ S E ( 1 + r ) t / 2 + C i ( 1 + r ) t / 2 = 167023 . 43 ( 1 + 0 . 08 ) 3 . 5 + 40732 . 73 ( 1 + 0 . 08 ) 3 . 5 + 174267 . 43 ( 1 + 0 . 08 ) 3 . 5 = 25580 . 88
According to the empirical analysis, the value (P) of Jiuli Lake wetland is 255,808,800 RMB, which shows that the benefit of the Jiuli Lake ecological restoration project not only covered the cost of implementation, but also resulted in a relatively large surplus. This proves that implementation of the ecological restoration project can bring significant positive economic benefits.

4. Conclusions and Discussion

This paper describes a case study performed on an artificial wetland derived from mining subsided lake in a plain region, Xuzhou Jiuli Lake wetland. Based on the principles of cost–benefit analysis, a value assessment model was constructed to assess the value of the artificial wetland after ecological restoration. With the Methods of GIS geostatistics and raster calculation, the various benefits and costs of ecological restoration of the mining subsided lake were measured separately. The main conclusions are as follows: (1) After transformed a national wetland park through ecological restoration, ecosystem services of Jiuli Lake wetland have created positive values. The most significant increase of value is in the revealing and releasing of its recreational value. (2) Artificial wetland derived from mining subsided lake has a spillover effect on the land price in surrounding areas leading to land price appreciation, with the effect most prominent on commercial and residential land prices. (3) With GIS geostatistics and raster calculation methods, the spillover effect on commercial and residential land can be distinctively measured. The impact range of the spillover effect of the study area was calculated at 20.76 km2 and 21.07 km2 for commercial and residential land, respectively. The impact strengths of the spillover effect on commercial and residential land were calculated at 135.76 RMB/m2 and 182.39 RMB/m2, respectively. The total value of the spillover effect (∆SE) is 407,327,300 RMB. (4) Through establishing a value assessment model for the artificial wetland derived from mining subsided lake, the value and cost of the ecological restoration of Jiuli Lake wetland were categorized and calculated. The results showed that the benefit of the ecological restoration project in the study area more than covered the cost. The ecological restoration generated economic positive externality. This could provide a research basis for economic feasibility studies on ecological restoration of mining subsided lakes.
Due to the complexity and specificity of the research objective, this study still needs further improvements in the following areas: By measuring the spillover effects, the value may be higher because of some reasonable factors. Considering that the average land price within the study region involves high land price of the artificial wetland itself, the impact of the artificial wetland itself on the average land price should be removed too. Furthermore, this paper only analyzed Jiuli Lake wetland area empirically, thus the results of the case study have some limited theoretical and practical significance for ecological restoration and treatment of mining subsided lakes in high groundwater table plain areas.
Follow-up studies will address the above problems to improve the theory and practice of ecological restoration and value assessment of mining areas.

Acknowledgments

This study was primarily funded by the Major Program of the Natural Science Foundation of China (41590842), and National Natural Science of China (41771181).

Author Contributions

Laijian Wang, Lachun Wang and Haiyang Cui conceived and designed the research; Pengcheng Yin performed the data collection; Laijian Wang, Zhenbo Wang and Haiyang Cui analyzed the data and wrote the paper; and Laijian Wang, Zhenbo Wang reviewed the paper and made several comments and suggestions for revision.

Conflicts of Interest

The authors declare no conflict of interest.

References

  1. Hu, Z.-Q.; Xiao, W.; Wang, P.-J.; Zhao, Y.-L. Concurrent mining and reclamation for underground coal mining. J. China Coal Soc. 2013, 38, 301–307. [Google Scholar]
  2. Chen, L.-Q.; Guo, D.-Z.; Xu, S.-K.; Li, J.-M.; Zhang, Y.-Z. A study on state and comprehensive control ways of subsided land of Yanzhou coal mining area in China. J. Nat. Resour. 2002, 17, 504–508. [Google Scholar]
  3. Xiao, W.; Hu, Z.-Q.; Fu, Y.-H. Zoning of land reclamation in coal mining area and new progresses for the past 10 years. Int. J. Coal Sci. Technol. 2014, 11, 177–183. [Google Scholar] [CrossRef]
  4. Lin, Z.-S.; Wang, G.-X. Remediation of Subsided Land and Creation of Artificial wetland in Mining Area—A case of Remediation of Subsided Land in Xuzhou Mining Area. J. Natl. Resour. 2005, 20, 790–795. [Google Scholar]
  5. Zhang, Q.-X.; Wang, F.; Wang, R.-S. Research Progress of Ecological Restoration for Wetlands in Coal Mine Areas. Procedia Environ. Sci. 2011, 10, 1933–1938. [Google Scholar] [CrossRef]
  6. Hu, Z.; Fu, Y.; Xiao, W.; Zhao, Y.; Wei, T. Ecological restoration plan for abandoned underground coal mine site in Eastern China. Int. J. Min. Reclam. Environ. 2015, 29, 316–330. [Google Scholar] [CrossRef]
  7. Guo, A.; Tang, X.; Li, X.; Xu, Y. The change of Tangshan Nanhu city Wetland Landscape based on multi-level classification method. In Proceedings of the International Conference on Computer Research & Development, Shanghai, China, 11–13 March 2011; Volume 2, pp. 440–443. [Google Scholar]
  8. Xie, K.; Zhang, Y.-Q.; Yi, Q.-T.; Yan, J.-P. Optimal resource utilization and ecological restoration of aquatic zones in the coal mining subsidence areas of the Huaibei Plain in Anhui Province, China. Desalination Water Treat. 2013, 51, 4019–4027. [Google Scholar] [CrossRef]
  9. Li, X.F.; Wang, J.M.; Wu, K.N. Restoration of water system in coalmine subsided area with higher level of underground water—Taking Jiawang mining area of Xuzhou as an example in China. Adv. Mater. Res. 2012, 518, 4227–4232. [Google Scholar] [CrossRef]
  10. Zedler, J.B. Progress in wetland restoration ecology. Trends Ecol. Evol. 2000, 15, 402–407. [Google Scholar] [CrossRef]
  11. Clarkson, B.R.; Ausseil, A.G.E.; Gerbeaux, P. Wetland ecosystem services. In Ecosystem Services in New Zealand: Conditions and Trends; Manaaki Whenua Press: Lincoln, New Zealand, 2013; pp. 192–202. [Google Scholar]
  12. He, J.; Moffette, F.; Fournier, R.; Revéret, J.P.; Théau, J.; Dupras, J.; Varin, M. Meta-analysis for the transfer of economic benefits of ecosystem services provided by wetlands within two watersheds in Quebec, Canada. Wetl. Ecol. Manag. 2015, 23, 707–725. [Google Scholar] [CrossRef]
  13. Peh, K.S.H.; Balmford, A.; Field, R.H.; Lamb, A.; Birch, J.C.; Bradbury, R.B.; Sedgwick, I. Benefits and costs of ecological restoration: Rapid assessment of changing ecosystem service values at a UK wetland. Ecol. Evol. 2014, 4, 3875–3886. [Google Scholar] [CrossRef] [PubMed] [Green Version]
  14. Hui, E.C.; Liang, C. Spatial spillover effect of urban landscape views on property price. Appl. Geogr. 2016, 72, 26–35. [Google Scholar] [CrossRef]
  15. Gibbons, S.; Mourato, S.; Resende, G.M. The amenity value of English nature: A hedonic price approach. Environ. Resour. Econ. 2014, 57, 175–196. [Google Scholar] [CrossRef] [Green Version]
  16. Liang, M.Z.; Liu, Z.H. Leisure and recreation value of urban artificial wetland scenic area: Taking Nansha wetland park of Guangzhou city for example. Urban Problems. 2014, 7, 8. [Google Scholar]
  17. Ragkos, A.; Psychoudakis, A.; Christofi, A.; Theodoridis, A. Using a functional approach to wetland valuation: The case of Zazari–Cheimaditida. Reg. Environ. Chang. 2006, 6, 193–200. [Google Scholar] [CrossRef]
  18. Dubgaard, A. Cost-benefit analysis of wetland restoration. J. Water Land Dev. 2004, 8, 87–102. [Google Scholar]
  19. Costanza, R.; Chichakly, K.; Dale, V.; Farber, S.; Finnigan, D.; Grigg, K.; Magnuszewski, P. Simulation games that integrate research, entertainment, and learning around ecosystem services. Ecosyst. Serv. 2014, 10, 195–201. [Google Scholar] [CrossRef]
  20. Millennium Ecosystem Assessment Board. Ecosystems and Human Well-Being: Health Synthesis; World Resources Institute: Washington, DC, USA, 2005. [Google Scholar]
  21. The Economics of Ecosystems and Biodiversity (TEEB). The Economics of Ecosystems and Biodiversity: Ecological and Economic Foundations; Earthscan: London, UK; Washington, DC, USA, 2010. [Google Scholar]
  22. Armbrecht, J. Use value of cultural experiences: A comparison of contingent valuation and travel cost. Tour. Manag. 2014, 42, 141–148. [Google Scholar] [CrossRef]
  23. Thapa, A.K. Recreational Demand for Fewa Lake: An Application of Travel Cost Method. Econ. Lit. 2016, 11, 54–59. [Google Scholar] [CrossRef]
  24. Wei, Q.; Tong, L.; Gondwe, J.; Lv, X.; Tong, W.; Liu, Y. Non-use value trends analysis of wetland ecosystem in the Sanjiang Plain, Northeast China. Wetl. Ecol. Manag. 2015, 23, 347–355. [Google Scholar] [CrossRef]
  25. Xie, G.; Cao, S.; Xiao, Y.; Pei, X.; Bai, Y.; Li, W.; Min, Q. Ecosystem Service Evaluation. In Contemporary Ecology Research in China; Springer: Berlin/Heidelberg, Germany, 2015; pp. 133–177. [Google Scholar]
  26. Seppelt, R.; Dormann, C.F.; Eppink, F.V.; Lautenbach, S.; Schmidt, S. A quantitative review of ecosystem service studies: Approaches, shortcomings and the road ahead. J. Appl. Ecol. 2011, 48, 630–636. [Google Scholar] [CrossRef]
  27. De Groot, R.S.; Wilson, M.A.; Boumans, R.M.J. A typology for the classification, description and valuation of ecosystem functions, goods and services. Ecol. Econ. 2002, 41, 393–408. [Google Scholar] [CrossRef]
  28. Chen, Z.; Zhang, A.; Song, M.; Zhang, Z. Measuring external costs of rural–urban land conversion: An empirical study in Wuhan, China. Acta Ecol. Sin. 2016, 36, 30–35. [Google Scholar] [CrossRef]
  29. Yun, R.-W.; Zhang, S.-L.; Ruan, B.-J.; Xu, Z.-J. Review of Researches on Land Price Change Law Based on Urban Ecological Landscape. Resour. Dev. Mark. 2009, 25, 524–527. [Google Scholar]
  30. Zhang, Y. Study on Spillover Effect of the Construction of Urban Green Space on Residential Land Value; China University of Mining and Technology: Xuzhou, China, 2014. [Google Scholar]
  31. Gao, J.-L.; Chen, J.-L.; Su, X. Influencing factors of land price in Nanjing Proper during 2001–2010. Prog. Geogr. 2014, 33, 211–221. [Google Scholar]
  32. Building test training research center. Land Valuation Methods; China Building Industry Press: Beijing, China, 2013. [Google Scholar]
  33. Zhou, G. The Micro Factors and Empirical Reserch on Urban Land Prices; Zhejiang University: Hangzhou, China, 2004. [Google Scholar]
  34. Panduro, T.E.; Veie, K.L. Classification and Valuation of Urban Green Spaces—A Hedonic House Price Valuation. Landsc. Urban Plan. 2013, 120, 119–128. [Google Scholar] [CrossRef]
  35. Gutjahr, A. Geostatistics for Sampling Designs and Analysis; ACS Symposium Series; American Chemical Society: Washington, DC, USA, 1991. [Google Scholar]
  36. Wong, W.S.D.; Lee, J. Statistical Analysis of Geographic Information with ArcView GIS and ArcGIS; Wiley: Hoboken, NJ, USA, 2005. [Google Scholar]
  37. Wu, Z.; Han, K. Research on Urban Land Grading Based on ArcGIS. Surv. Mapp. Geol. Miner. Resour. 2013, 4, 1. [Google Scholar]
  38. Wang, N. Study on the Urban Land Price Model; China University of Geosciences: Beijing, China, 2009. [Google Scholar]
  39. Ord, K.; Cliff, A.D. The Comparison of Means When Samples Consist of Spatially Autocorrelated Observations. Environ. Plan. A 1975, 7, 725–734. [Google Scholar]
  40. Chang, K. Introduction to Geographic Information Systems; McGraw-Hill Higher Education: Boston, MA, USA, 2006. [Google Scholar]
  41. Chen, G.S.; Tian, L. Research on Compensation Issues of Urban Resettlement in China. Adv. Appl. Econ. Bus. Dev. 2011, 209, 395–401. [Google Scholar]
  42. Qu, S.; Heerink, N.; Xia, Y. Farmers’ satisfaction with compensation for farmland expropriation in China—Evidence from micro-level data. In Proceedings of the 2015 Conference on International Association of Agricultural Economists, Milan, Italy, 9–14 August 2015. [Google Scholar]
  43. Tang, Y.; Mason, R.J.; Wang, Y. Governments’ functions in the process of integrated consolidation and allocation of rural–urban construction land in China. J. Rural Stud. 2015, 42, 43–51. [Google Scholar] [CrossRef]
  44. Zou, X.; Oskam, A.J. New compensation standard for land expropriation in China. China World Econ. 2007, 15, 107–120. [Google Scholar] [CrossRef]
  45. State Council of the PRC. Regulations on the Levy and Compensation of houses on State Owned Land [R/OL]. Available online: http://www.gov.cn/flfg/2011-01/21/content_1791480.htm (accessed on 21 January 2011).
  46. The Standing Committee of Jiangsu Provincial People’s Congress. Regulations of Jiangsu Municipality on the Administration of Urban Housing Units [R/OL]. Available online: http://www.jsrd.gov.cn/zyfb/sjfg/200812/t20081231_1748.shtml (accessed on 23 October 2002).
  47. The Standing Committee of Jiangsu Provincial People’s Congress. Regulations of Xuzhou City on the Reclamation of Coal Mining Subsidence Land [R/OL]. Available online: http://www.xz.gov.cn/zgxz/zwgk/20041229/008003001_ffeaa5db-5837-4a11-9c1d-8b88b043cac4.htm (accessed on 3 November 2002).
  48. White, P.; Dranke, M.; Hindle, P. Integrated Solid Waste Management: A Lifecycle Inventory; Springer Science & Business Media: Berlin, Germany, 2012. [Google Scholar]
  49. Li, W.B.; Yao, J.; Tao, P.P.; Hu, H.; Fang, C.R.; Shen, D.S. An innovative combined on-site process for the remote rural solid waste treatment–A pilot scale case study in China. Bioresour. Technol. 2011, 102, 4117–4123. [Google Scholar] [CrossRef] [PubMed]
  50. Haibin, L.; Zhenling, L. Recycling utilization patterns of coal mining waste in China. Resour. Conserv. Recycl. 2010, 54, 1331–1340. [Google Scholar] [CrossRef]
  51. Wu, S.; Chang, X.; Tan, G. Research on the Efficiency Difference and Influencing Factors of Waste Gas Treatment by China’s Environmental Protection Investment—Based on the Panel Data of 29 Provinces and Cities. Stat. Educ. 2010, 5, 16–23. [Google Scholar]
  52. Zhengfu, B.I.A.N.; Inyang, H.I.; Daniels, J.L.; Frank, O.T.T.O.; Struthers, S. Environmental issues from coal mining and their solutions. Min. Sci. Technol. 2010, 20, 215–223. [Google Scholar]
Figure 1. Location and image map of the study area.
Sustainability 09 01860 g001
Figure 2. The framework of value evaluation route of the artificial wetland.
Sustainability 09 01860 g002
Figure 3. The diagram of the spillover effect measurement of the artificial wetland.
Sustainability 09 01860 g003
Figure 4. Commercial, residential land prices surfaces in 2007 and 2013.
Sustainability 09 01860 g004
Figure 5. Contours of commercial and residential land prices appreciation from 2007 to 2013.
Sustainability 09 01860 g005
Figure 6. Impact range of the spillover effect on commercial and residential land prices.
Sustainability 09 01860 g006
Figure 7. Impact strength and range of the spillover effect on land value.
Sustainability 09 01860 g007
Table 1. Ecosystem structure of Jiuli Lake wetland.
Ecosystem TypeEcosystem Structure
FarmlandAgricultural land, including land for food crops and cash crops
Aquacultural landFish ponds, etc.
WoodlandWoodland and orchards, etc.
WatersRivers, lakes, ditches, etc.
TownshipsTowns, village residential, industrial lands, roads, etc.
WetlandSwamps, wetland in parks, etc.
Table 2. The evaluation index system of ecosystem services.
Ecosystem TypeFarmlandAquacultural LandWoodlandWatersTownshipsWetland
Ecosystem Service
Lifestyle and production related material supplyMaterial production
Life support and maintenanceClimate regulation
Moisture regulation
Environmental cleanup
Soil formation and conservation
Biodiversity maintenance
Nutrient cycling
Spiritual enjoymentCultural diversity
Leisure and travel
Table 3. Measurement methods of ecosystem services of Jiuli Lake wetland.
Ecosystem ServiceMethod
Lifestyle and production related material supplyMaterial productionMarket value method
Life support and maintenanceClimate regulationCarbon tax and afforestation costs
Moisture regulationAlternative engineering method
Environmental cleanupAlternative cost method
Soil formation and conservationOpportunity cost method
Biodiversity maintenanceRecovery and protection costs
Nutrient cyclingAlternative cost method
Spiritual enjoymentCultural diversityConditional value method
Leisure and travelTravel cost method and Conditional value method
Table 4. Land area occupied by different ecosystem types at Jiuli Lake wetland in 2007 and 2013 (unit: hm2).
Ecosystem TypeFarmlandAquacultural LandWoodlandWatersTownshipWetland
Year
2007134.9857.2610.49171.701111.382.39
201358.1242.1710.68215.20841.123.19
Table 5. The appreciation of the ecosystem services value of Jiuli Lake wetland (unit: 10,000 RMB).
Year20072013Value Appreciation
Ecosystem Service
Material production948.81940.25−8.56
Climate regulation206.53127.11−79.42
Moisture regulation16.4619.292.83
Environment cleanup17.7023.305.60
Soil formation and conservation0.180.190.01
Nutrient cycling0.130.150.02
Biodiversity maintenance12.928.86−4.06
Cultural diversity3.514.681.17
Recreation0 *167,105.84167,105.84
Total1206.24168,229.67167,023.43
* The ecological environment of Jiuli Lake was relatively poor before the ecological restoration; therefore, its recreational value was stated to be zero.
Table 6. Summary of ecological restoration costs of Jiuli Lake wetland.
ItemCost TypeUnit: Ten Thousand RMB
Land clearing and Compensation costCollective land acquisition costCompensation for land expropriation (not including attachment)5576.29
Compensation for above-ground attachments182.84
Compensation for above-ground structures1584.65
Cultivated land reclamation cost247.62
Expropriation management cost293.64
Compensation for above-ground buildings5891.13
Above-ground structures652.78
State-owned land reserves acquisition costCompensation for construction land without subsidence46,327.82
Compensation for construction land with subsidence15,766.66
Compensation for agricultural land and unused land20,679.46
Relocation cost, transition cost and temporary resettlement subsidies58.75
Loss due to suspended economic operations428
Loss due to equipment relocation820
Land assessment cost7.27
Field survey cost16.54
Land rearrangement cost Land leveling cost5450.45
Supporting infrastructure cost56,777.83
Environment remediation cost Water treatment cost1650
Solid waste treatment cost3565
Waste gas treatment cost1770
Ecological restoration project cost6520.7
The Ecological restoration project costTotal174,267.43

