Article

Effect of Topping Trees on Biomass and Nitrogen Removal in the Thinning of Norway Spruce Stands

1
Institute of Forest Engineering, University of Natural Resources and Life Sciences, Peter-Jordan-Str. 82/3, 1190 Vienna, Austria
2
Institute of Silviculture, University of Natural Resources and Life Sciences, Vienna, Peter-Jordan-Str. 82/3, 1190 Vienna, Austria
*
Author to whom correspondence should be addressed.
Sustainability 2017, 9(10), 1856; https://doi.org/10.3390/su9101856
Submission received: 14 September 2017 / Revised: 6 October 2017 / Accepted: 9 October 2017 / Published: 17 October 2017
(This article belongs to the Section Sustainable Engineering and Science)

Abstract

:
In Central Europe, full-tree (FT) harvesting is an increasingly common harvesting method in steep terrain harvesting due to the increased use of highly economical processor tower yarders. In conventional FT harvesting, nutrient removal from harvest sites is substantially higher than in cut-to-length (CTL) harvesting due to the extraction of nutrient-rich branches and foliage. One strategy to reduce the adverse impact of FT harvesting is to cut off the tops of felled trees prior to extraction (topping). The purpose of this study was to assess the effect of implementing topping treatments in FT harvesting on biomass and nutrient removal. The effect of conventional FT harvesting on the amount of logging residues left on the site was assessed in three different Norway spruce (Picea abies)-dominated stands following cable yarding operations by collecting logging residues from the forest floor. The additional effect of topping trees on the amount of logging residues was assessed by using biomass models. These models were created based on the data of 25 sample trees, which were felled and sampled destructively within the stands. The results show that conventional FT harvesting considerably increases nutrient removal in comparison to CTL, but still do not remove all nutrients from the sites. After conventional FT harvesting, 5–18% of the nutrients remained on the sites. Topping trees at a diameter of 8 cm substantially increased the amount of remaining nutrients to 30–34%.

1. Introduction

In Central Europe, full-tree (FT) harvesting, which involves the removal of most of the nutrient-rich components of a tree from the harvesting site, has become more common in steep terrain harvesting. The main reason for the popularity of FT cable yarding is the development of so-called “processor tower yarders” in the late 1970s, which are equipped with boom-mounted processors. The use of these yarders resulted in cost-savings of about 40% for FT harvesting [1]. Today, processor tower yarders working with FT harvesting represent the state-of-the-art technology in steep terrain harvesting [1] and have largely replaced motor-manual cut-to-length (CTL) systems, where trees are delimbed and crosscut with chainsaws within the forest stands.
Another reason for the increased use of FT harvesting was the steadily growing interest in producing bioenergy from renewable resources [2]. In FT cable yarding operations, whole trees are extracted from the stand to the forest road. After processing the trees, branches and tree-tops are stacked in piles. Close to the forest road, these piles are easily accessible for follow-up machines, like chippers or grinders. As a result, the procurement costs of this material for further use is reduced because material collection and piling in the field is not necessary.
However, with the development and increased use of FT harvesting in the 1960s and 1970s, many researchers have already raised concerns over long-term site productivity effects of FT harvesting [3,4]. Since then, numerous studies on effects of FT harvesting, relative to those of CTL and tree-length (TL) harvesting methods, have been established. In particular, there have been numerous reports about the effect of different harvesting methods and treatments on tree growth (e.g., [5,6,7]). The majority of these studies concluded that FT harvesting can result in growth losses after thinning operations [5,6,8], and also negatively impacts seedling growth after regeneration felling [9]. In most of the studies it was assumed that nutrient removal from the forest site was the main reason for growth reduction [5,6].
Nevertheless, there is still uncertainty about the magnitude and durability of the effects of FT harvesting [10] since there are no available results on site productivity over multiple rotation periods. Consequently, some studies assessed the sustainability of forest sites based on nutrient balance calculations [11,12]. Nutrient budgets are calculated as the difference between inputs (e.g., deposition, weathering) and outputs (e.g., leaching, harvesting) over a specified time span. As such, nutrient balance calculations can be used as a means to identify nutrient depletion before it actually occurs. Thus, nutrient budgets can act as a useful basis to support forest decision-making processes [13]. However, conclusions from studies evaluating FT harvesting effects on nutrient budgets often assume that FT harvesting leads to a complete removal of all logging residues from the forest site [5,14], which results in a systematic overestimation of biomass and nutrient removal and unnecessarily exacerbates negative perceptions about FT harvesting. Several studies have already shown that it is not possible to remove all biomass from a site during harvesting operations [15,16,17,18]. Branches, foliage, and sometimes even parts of the stem break off during the different steps of harvesting operations: Firstly, branches break off during the falling of a cut tree since its branches are interlocked with branches of neighboring trees. Secondly, branch breakage occurs at the time when the tree hits the ground. Finally, tree parts break off during extraction when the trees are extracted to the landing.
Briedis et al. [15] found that 15% of the entire harvested material (45% of energy wood) remained on site after FT harvesting using a feller buncher and grapple skidder. Kizha and Han [18] found similar amounts of logging residues after a ground based and a cable yarded FT operation in California (U.S.), where 30% and 40% of the forest residues remained on site, respectively. Studies of Hytönen and Moilanan [16] have recently shown similar results in the thinning of Scots pine in Finland, where 32–66% of the harvest-generated residue material remained on site. However, the amount of biomass that remains on sites after harvesting operations may vary greatly from site to site, since the quantity of biomass removal depends not only on the harvesting method, but also to a decisive extent on factors like harvesting system, developmental stage of the stand, harvesting season, and tree species [14].
Nevertheless, at some sites, the amount of logging residues in FT harvesting might not be enough to ensure sustainability. Thus, there is a significant need for harvesting methods that increase the amount of logging residues in the forest in the most economical matter. One way to achieve this aim when using FT harvesting is to cut-off the tree-tops of felled trees within the stand before extraction. This procedure is commonly known as “topping”. Tree-tops of conifers mainly consist of needles and fine branches, which contain a high proportion of a tree’s nutrients [19,20,21] and are, thus, particularly important to a site’s fertility. For instance, nutrient analysis of Kreutzer [4] on Norway spruce trees demonstrated that nitrogen concentrations of branches and needles are 12–21 times higher than of wood fibers. In accordance, nutrient models of Krapfenbauer [22] of a 100-year-old Norway spruce stand demonstrated that approx. 70% of the nitrogen is located in the crown biomass (branches and needles) of the trees.
Detailed nutrient analyses of Lick [20] further showed that needles in the upper part of the tree crown generally contain 15–20% higher nutrient concentrations than needles in the lower part of the crown. Considering this, topping trees seems to be an effective way to decrease the amount of nutrient removal during harvesting operations, since the tops of the trees contain the highest nutrient concentrations [20]. Nevertheless, topping trees represents an additional work task for the chainsaw operator and may also slightly decrease the productivity of the yarding system [23].
There are few studies on the amount of logging residues produced by using FT cable yarding. Little is known about the effect of topping trees at different topping diameters on the remaining biomass at different developmental stages of Norway spruce dominated stands. The objective of this study was to examine the impacts of different topping diameters both (i) on the amount of logging residues and (ii) the amount of nutrients, with a focus on nitrogen, remaining on the forest sites in first and second thinning stands after cable yarding.

2. Materials and Methods

2.1. Study Area

The study area is located in Central Austria, approximately 120 km southwest of Vienna (48°11′ N, 16°22′ E) and 30 km north of Graz (47°04′ N, 15°26′ E). This region is characterized by a subcontinental climate with a mean annual precipitation of 870 mm and a mean annual temperature of 7.9 °C. Average minimum temperatures in January range from −7 °C to 0 °C and average maximum temperatures in July range from 12 °C to 24 °C. The dominant soil type is brown soil. Humus form is mull and the thickness of the forest litter layer at the study sites varied between 1 cm and 3 cm, indicating medium turnover rates and moderate accumulation of nutrients.

2.2. Stand Characteristics

The study was carried out in three Norway spruce (Picea abies)-dominated stands (Table 1). All three stands are located close to one another (within a radius of 1 km) and are part of the same forest district. The stands differed from each other both by their age and pre-treatment:
Stand 1 represents a 58-year-old stand that had been thinned commercially at an age of 32 years. There was a strong need for a second thinning in order to increase stand stability and quality. The other two stands are much younger and were in need to be thinned commercially for the first time. In contrast to stand 3, stand 2 had been pre-commercially thinned in the thicket life stage.

2.3. Estimation of Logging Residues after Conventional FT-Cable Yarding

2.3.1. Harvesting Operations

At all three sites, FT cable yarding operations were performed by the same crew using a truck-mounted “Wanderfalke” tower yarder, extracting partially-suspended whole trees uphill to the forest road. No job rotation was practiced during the study time. The trees were felled motor-manually by a worker equipped with a chainsaw. The faller always started working at the lowest part of the stand and continued working uphill. Almost all trees were felled downhill, directional to the cable corridor in order to facilitate the extraction of trees and to reduce stand damage on residual trees. A second worker connected several trees to single loads, which were attached to the mainline and extracted uphill to the forest road by a slack-pulling carriage. At the roadside, a boom-mounted processor head delimbed and bucked the trees.

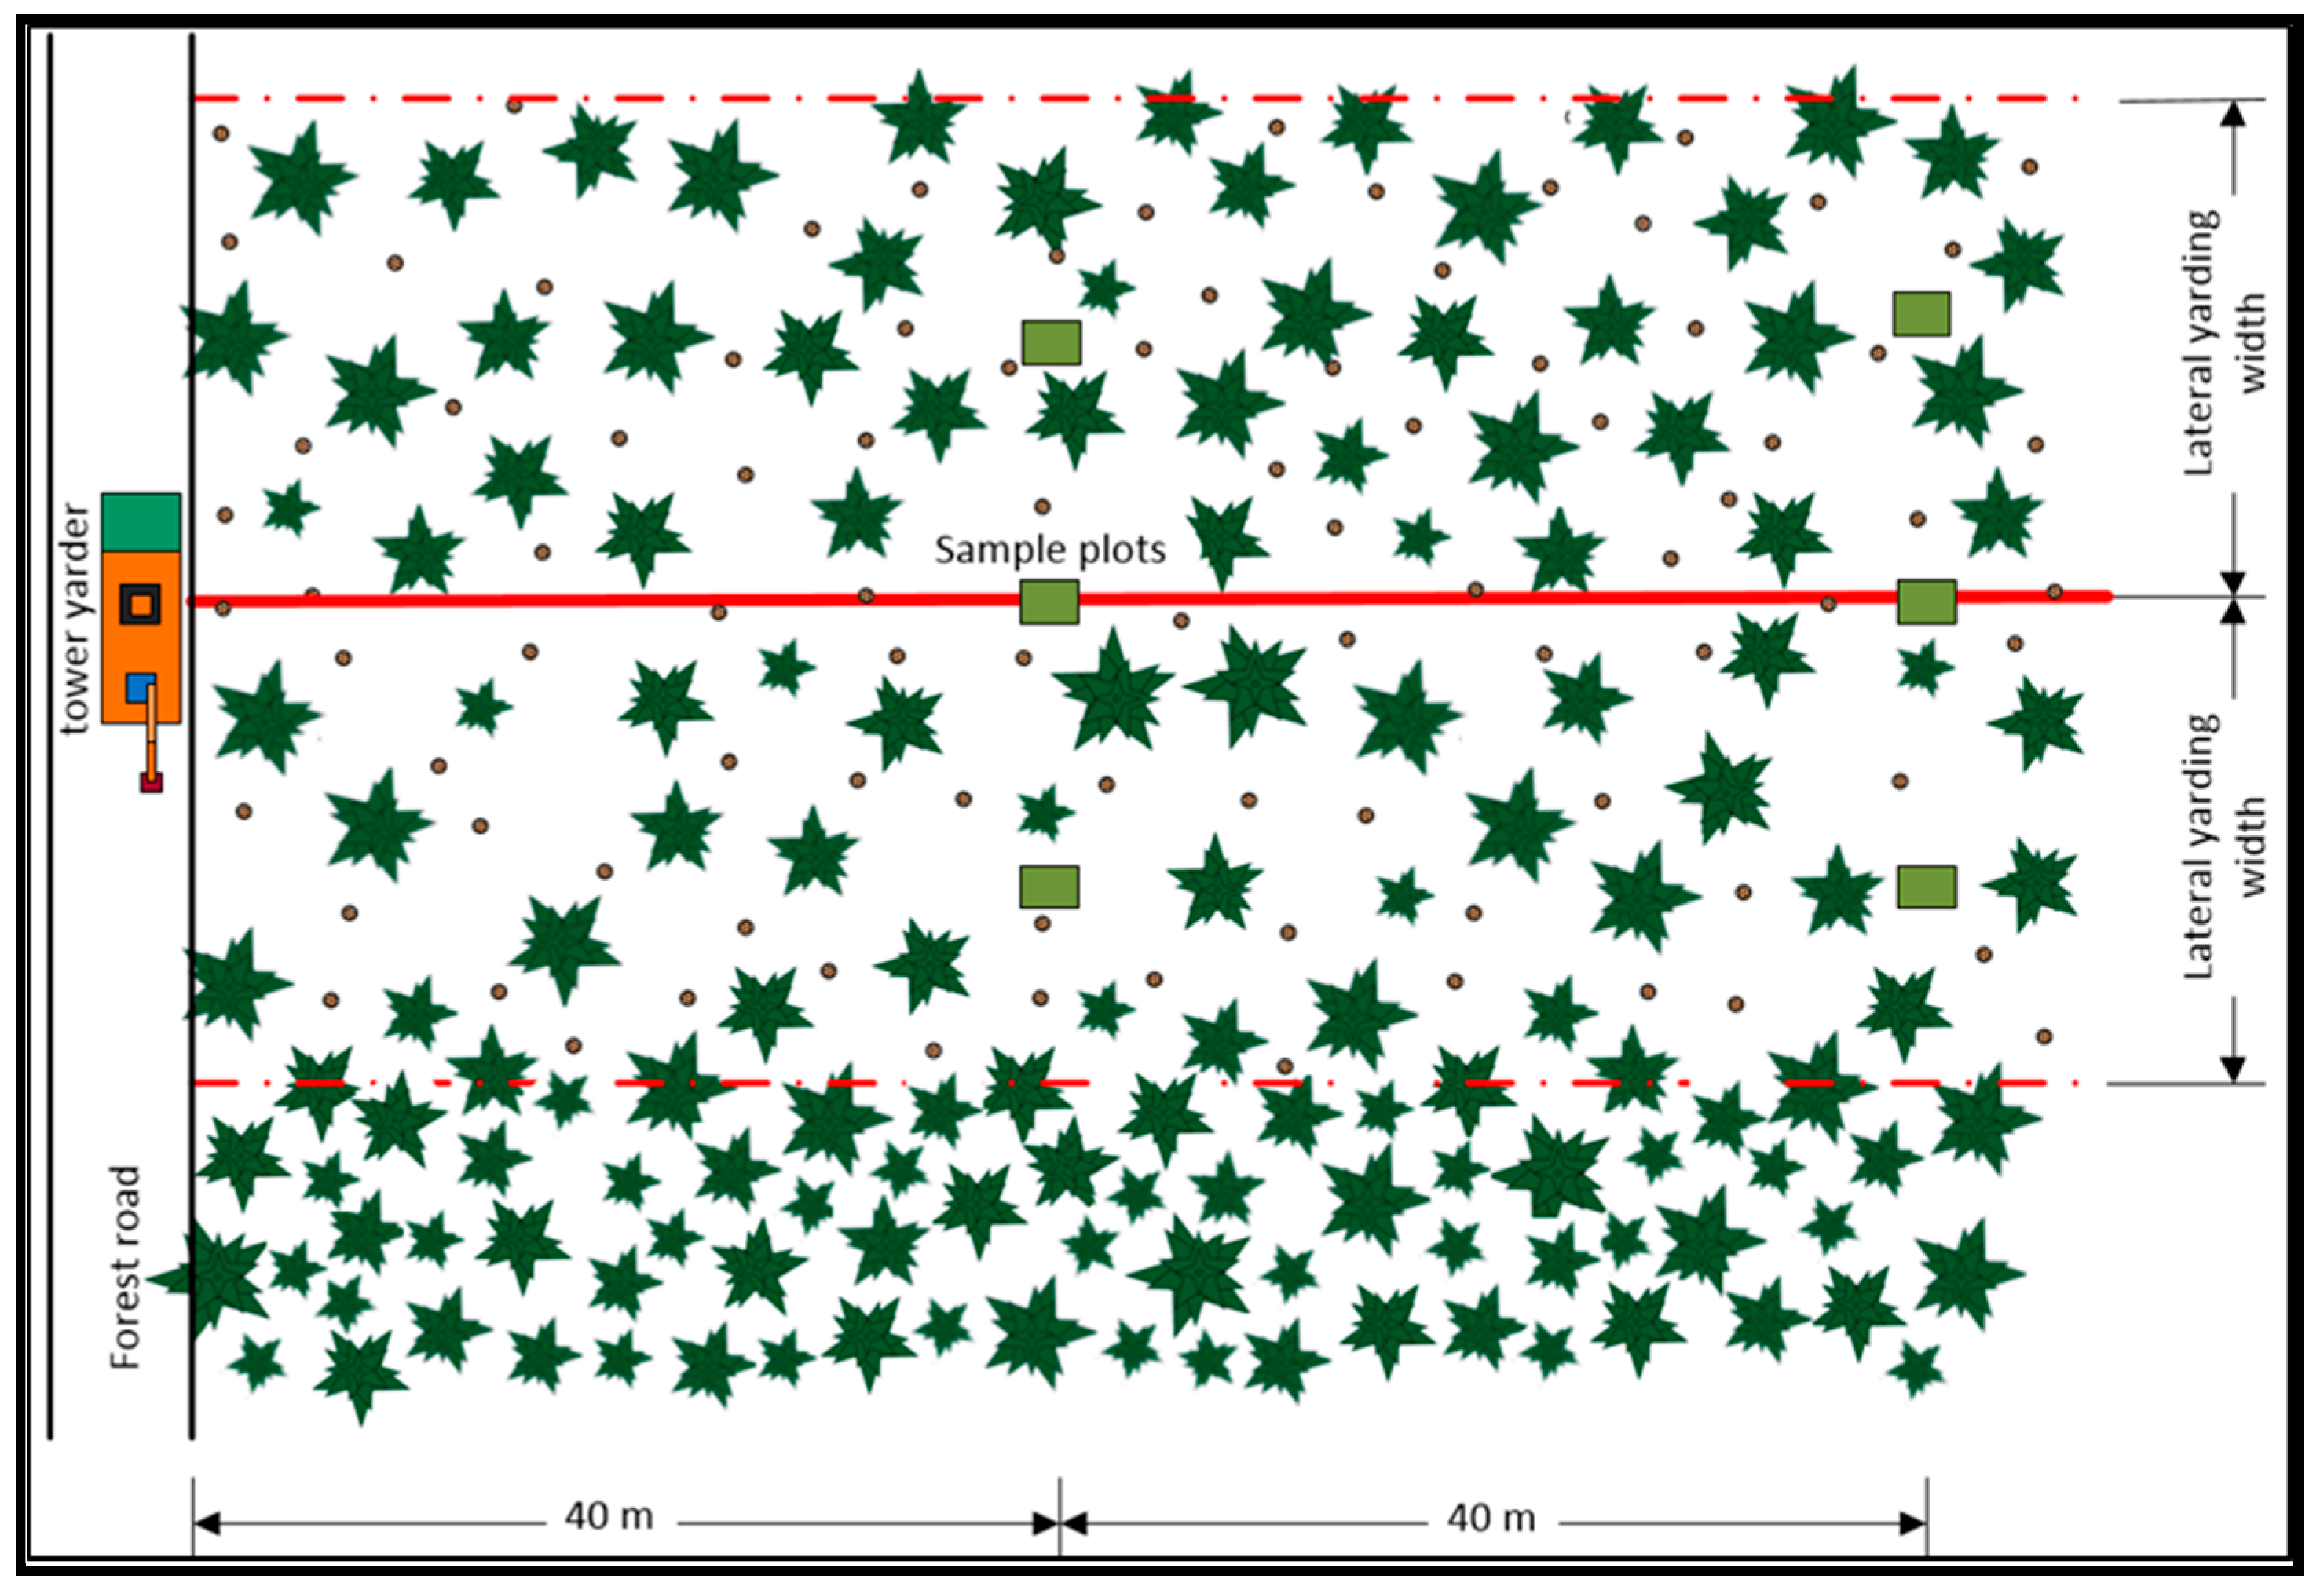
2.3.2. Estimation of Logging Residues

The estimation of the amount of logging residues was carried out directly after each yarding operation. The amount of logging residues left on the sites was assessed by collecting and weighing the material from 4 m² sample plots (2 m × 2 m), which were selected systematically (Figure 1): The plots were positioned every 40 m along the axis of the cable line; one plot located in the center of the cable corridor and two located laterally on each side of the corridor. Material, which extended beyond the edges of the sample plots, were cut at the border. The sample plots beneath the cable line represent the area of the cable corridor, assuming a corridor width of 3 m. The sample plots on the surrounding harvesting area represent the harvested area between the cable corridors, assuming a lateral yarding width of 15 m. In total, 24, 33, and 15 plots were located in the stands 1, 2, and 3, respectively. At each plot, live branches and needles were collected by hand and weighed in the forest stands using small big-bags (ca. 0.20 m³) attached to a digital hanging scale with an accuracy of 0.1 g.
During the study time, there was hardly any understory vegetation due to the high stand densities prior the harvesting operations, which facilitated the identification of fresh, green needles and branches. Nevertheless, although collecting needles and live branches was somewhat easy, it was impossible to differ between dead branches of shortly felled trees and branches that were present prior the harvesting operation. Hence, we used data from literature [20] to estimate the biomass of dead branches, which broke during felling and extraction.
After weighing the logging residues of a plot, sub-samples were collected randomly to determine moisture content, the proportion of needles and the extent of contamination with stones or soil. Contamination was determined by using screening (particles smaller than 0.5 mm were regarded as soil) and sedimentation analyses (fast-sinking particles were regarded as stones).

2.4. Estimation of Total-Tree and Tree-Top Biomass

2.4.1. Stand Inventory

Prior to the harvesting operations, all trees of each study site were recorded according to DBH (diameter at 1.30 m above ground) and tree species. The associated tree and crown heights were measured randomly using a sample of at least 20 heights per stand in order to calculate species and site-specific height curves.

2.4.2. Felled-Tree Sampling

Across all diameter classes, eight to nine trees per stand, which were intended to be removed within the thinning operation, were chosen as sample trees (Table 2). Once the trees were felled, their basal diameter, DBH, total height and height to crown base were measured. Afterwards, each sample tree was cross-cut at the crown base and at stem diameters of 14, 8, 7, 6, and 4 cm (measured without bark). The mass of the components (stem wood, dead branches, live branches) were measured separately for each section using a big-bag attached to a digital hanging scale accurate to 0.1 g. Additionally, one live and one dead branch from the middle of each section were selected for laboratory analysis according to the following procedure: at each section, the length of all branches were measured. The branch, whose length was closest to the average length of the branches of a certain section, was chosen as a sample branch.
In total, a maximum of six of each, live and dead branches were selected per tree. Furthermore, stem disks were taken from the stem base and at stem diameters of 7 cm and 3 cm (measured without bark), which were subsequently divided into bark and debarked stem wood. The total moisture content of all samples (live branches, dead branches, bark, stem wood) was determined by drying them in an oven at 105 °C according to EN14774-2 (2009). During drying, most of the needles dropped off the live branches, which facilitated separating the needles from the branches afterwards. Ratios between fresh weight and dry weight of the samples were used to estimate their moisture content (MC) according to following Equation (1):
MC (%)=100 × (m1 − m2)/m1
where m1 is the mass of the sample before drying and m2 is the mass of the sample after drying.

2.4.3. Tree Biomass Equations

Linear mixed effects models (LMMs) were used to estimate the aboveground biomass of each tree component (needles, live branches, dead branches, bark, and wood). Model forms for estimating tree-level biomass components contained tree DBH, total height (H), crown ratio (CR), and the relative basal area of larger trees (relBAL) as predictor variables. The variable “stand” was used as a random effect. The CR was calculated by dividing the live crown length of a tree by the total tree height. The BAL of a given subject tree is the sum of the basal area of all trees which are larger in DBH than the subject tree. To compare the social rank of trees of different stands, the relative basal area of larger trees (relBAL) was calculated for each tree (Equation (2)):
relBALh,j = BALh,j/BAj
where relBALhj is the relative basal area of larger trees of tree h in stand j; BALhj is the basal area of all trees larger than tree h in stand j; and BAj is the total basal area of stand j.
In order to homogenize the variance of residuals, a log-linear equation was used (Equation (3)):
ln(Bi,j) = β0 + β1 ln(DBHi) + β2 ln(Hi) + β3 ln(CRi) + β4 ln(relBALi) + µj + εi,j
where Bij is the total biomass of component i in stand j, DBH, H, CR, and relBAL are covariates, β0…4 are model parameters, µ is an independent and identically distributed random variate that corresponds to between-stand variation, and ε is an error term.
For the estimation of the biomass of each component, a three-step process was used to select the best fit model [24]:
First, we determined the optimal structure of random effects by using restricted maximum likelihood estimation (REML) to fit several LMM’s, which included all main effect terms for the covariates. Different specifications of the random effect were tested (random intercept only, random slope only, random intercept, and random slope). Akaike’s information criterion (AIC) was used to identify the best fitting model. The LMM with the lowest AIC or the model with the fewest parameters, when AIC values of the lowest AIC model differed by less than two AIC units, was chosen. As a second step, we defined the ideal structure of the covariates by creating models with different combinations of covariates by using the random effect structure defined in the first step. Maximum likelihood estimation was used to fit the different models. As in step 1, AIC was used to identify the best fit model. As a last step, we fit a final model using REML for the model with the selected random effect structure of step 1 and the covariate structure defined in step 2.
Heteroscedasticity of the residual variances was checked for each model using explorative data analysis. If variance heteroscedasticity of a certain model was assumed, residual variances were modelled as a function of DBH, using several variance functions in R (varFixed, varExp, varPower, varConstPower). The effects of the variance functions were evaluated using AIC.
To predict the biomass of all trees within the stands, the model was transformed back to the original scale, which imposes a prediction bias. Consequently, a correction factor (cf) was used to compensate the downwards bias emerging from transformation:
cfi = ΣBi(predicted)/ΣBi(observed)
where Bi(predicted) are the back-transformed biomass values for component i using Equation (3) and Bi(observed) are the measured biomass values of component i of the sample trees.
The statistical analyses were conducted using the nlme package [25] in R version 3.3.2 [26].

2.4.4. Tree-Top Biomass Equations

The same statistical procedure as described in Section 2.4.3 was used to determine the final model for estimating the biomass of tree-tops at different topping diameters (TD). Following general form was used:
ln(Bi,j,k) = β0 + β1 ln(DBHi) + β2 ln(Hi) + β3 ln(CRi) + β4 ln(relBAL) + β5 ln(TDi) + µj + εi,j,k
where Bijk is the total biomass of component i in stand j at a topping diameter of k cm; DBH, H, CR, relBAL, and TD are covariates, β0…4 are model parameters, u is an independent and identically distributed random variate that corresponds to between-stand variation and ε is an error term.
Equation (5) was used to estimate the biomass of tree-tops for the components bark, wood, needles, and live branches. It was not used to calculate dead branches, due to their rare presence within the tree-tops.

2.5. Estimation of Biomass and Nitrogen Removal

If tree topping strategies are implemented in FT cable yarding, the remaining biomass consists of both:
  • branches and foliage, which break off during felling and extraction (Section 2.3);
  • biomass of tree-tops, which remain after topping the trees at a certain diameter (Section 2.4).
Nitrogen concentrations published by Lick [20] were used to estimate the impact of different topping scenarios on nitrogen removal. Nitrogen removal by using CTL harvesting has been calculated by using Equation (3), assuming that only bark and wood fibers are extracted to the forest road and all other compartments (needles, live and dead branches) remain in the stand.

3. Results

3.1. Logging Residues after Conventional FT Cable Yarding

After conventional FT harvesting, 2300 kg ha−1 to 8400 kg ha−1 of biomass (8–28% of the crown biomass of all felled trees) remained at the study sites (Figure 2). The amount of logging residues was much higher at the second thinning stand (stand 1; 8407 kg ha−1) than at the two first thinning stands.
Especially at the second thinning stand, tree breakage—which mainly occurred when the felled trees hit the ground—turned out to be an important factor, which considerably increased the amount of logging residues from 4626 kg ha−1 up to 8397 kg ha−1. Approximately 42% of the tree-tops broke off during the harvesting operation at an average diameter of 9.8 ± 3.7 cm. In contrast, tree breakage occurred less frequently at the first thinning stands. Only 1.6% and 16.6% of the trees broke at stands 2 and 3 at an average stem diameter of 5.0 ± 1.8 cm and 6.5 ± 3.3 cm, respectively.
At the first thinning stands, small, non-merchantable trees and bushes, which were felled to facilitate reaching the trees selected for removal, were left behind to keep system productivity high. Especially at stand 3, a large number of small trees (227 trees with an average DBH of 8.1 cm) was left behind at the forest site, which led to a significant increase of the remaining biomass from 949 kg ha−1 to 3450 kg ha−1.

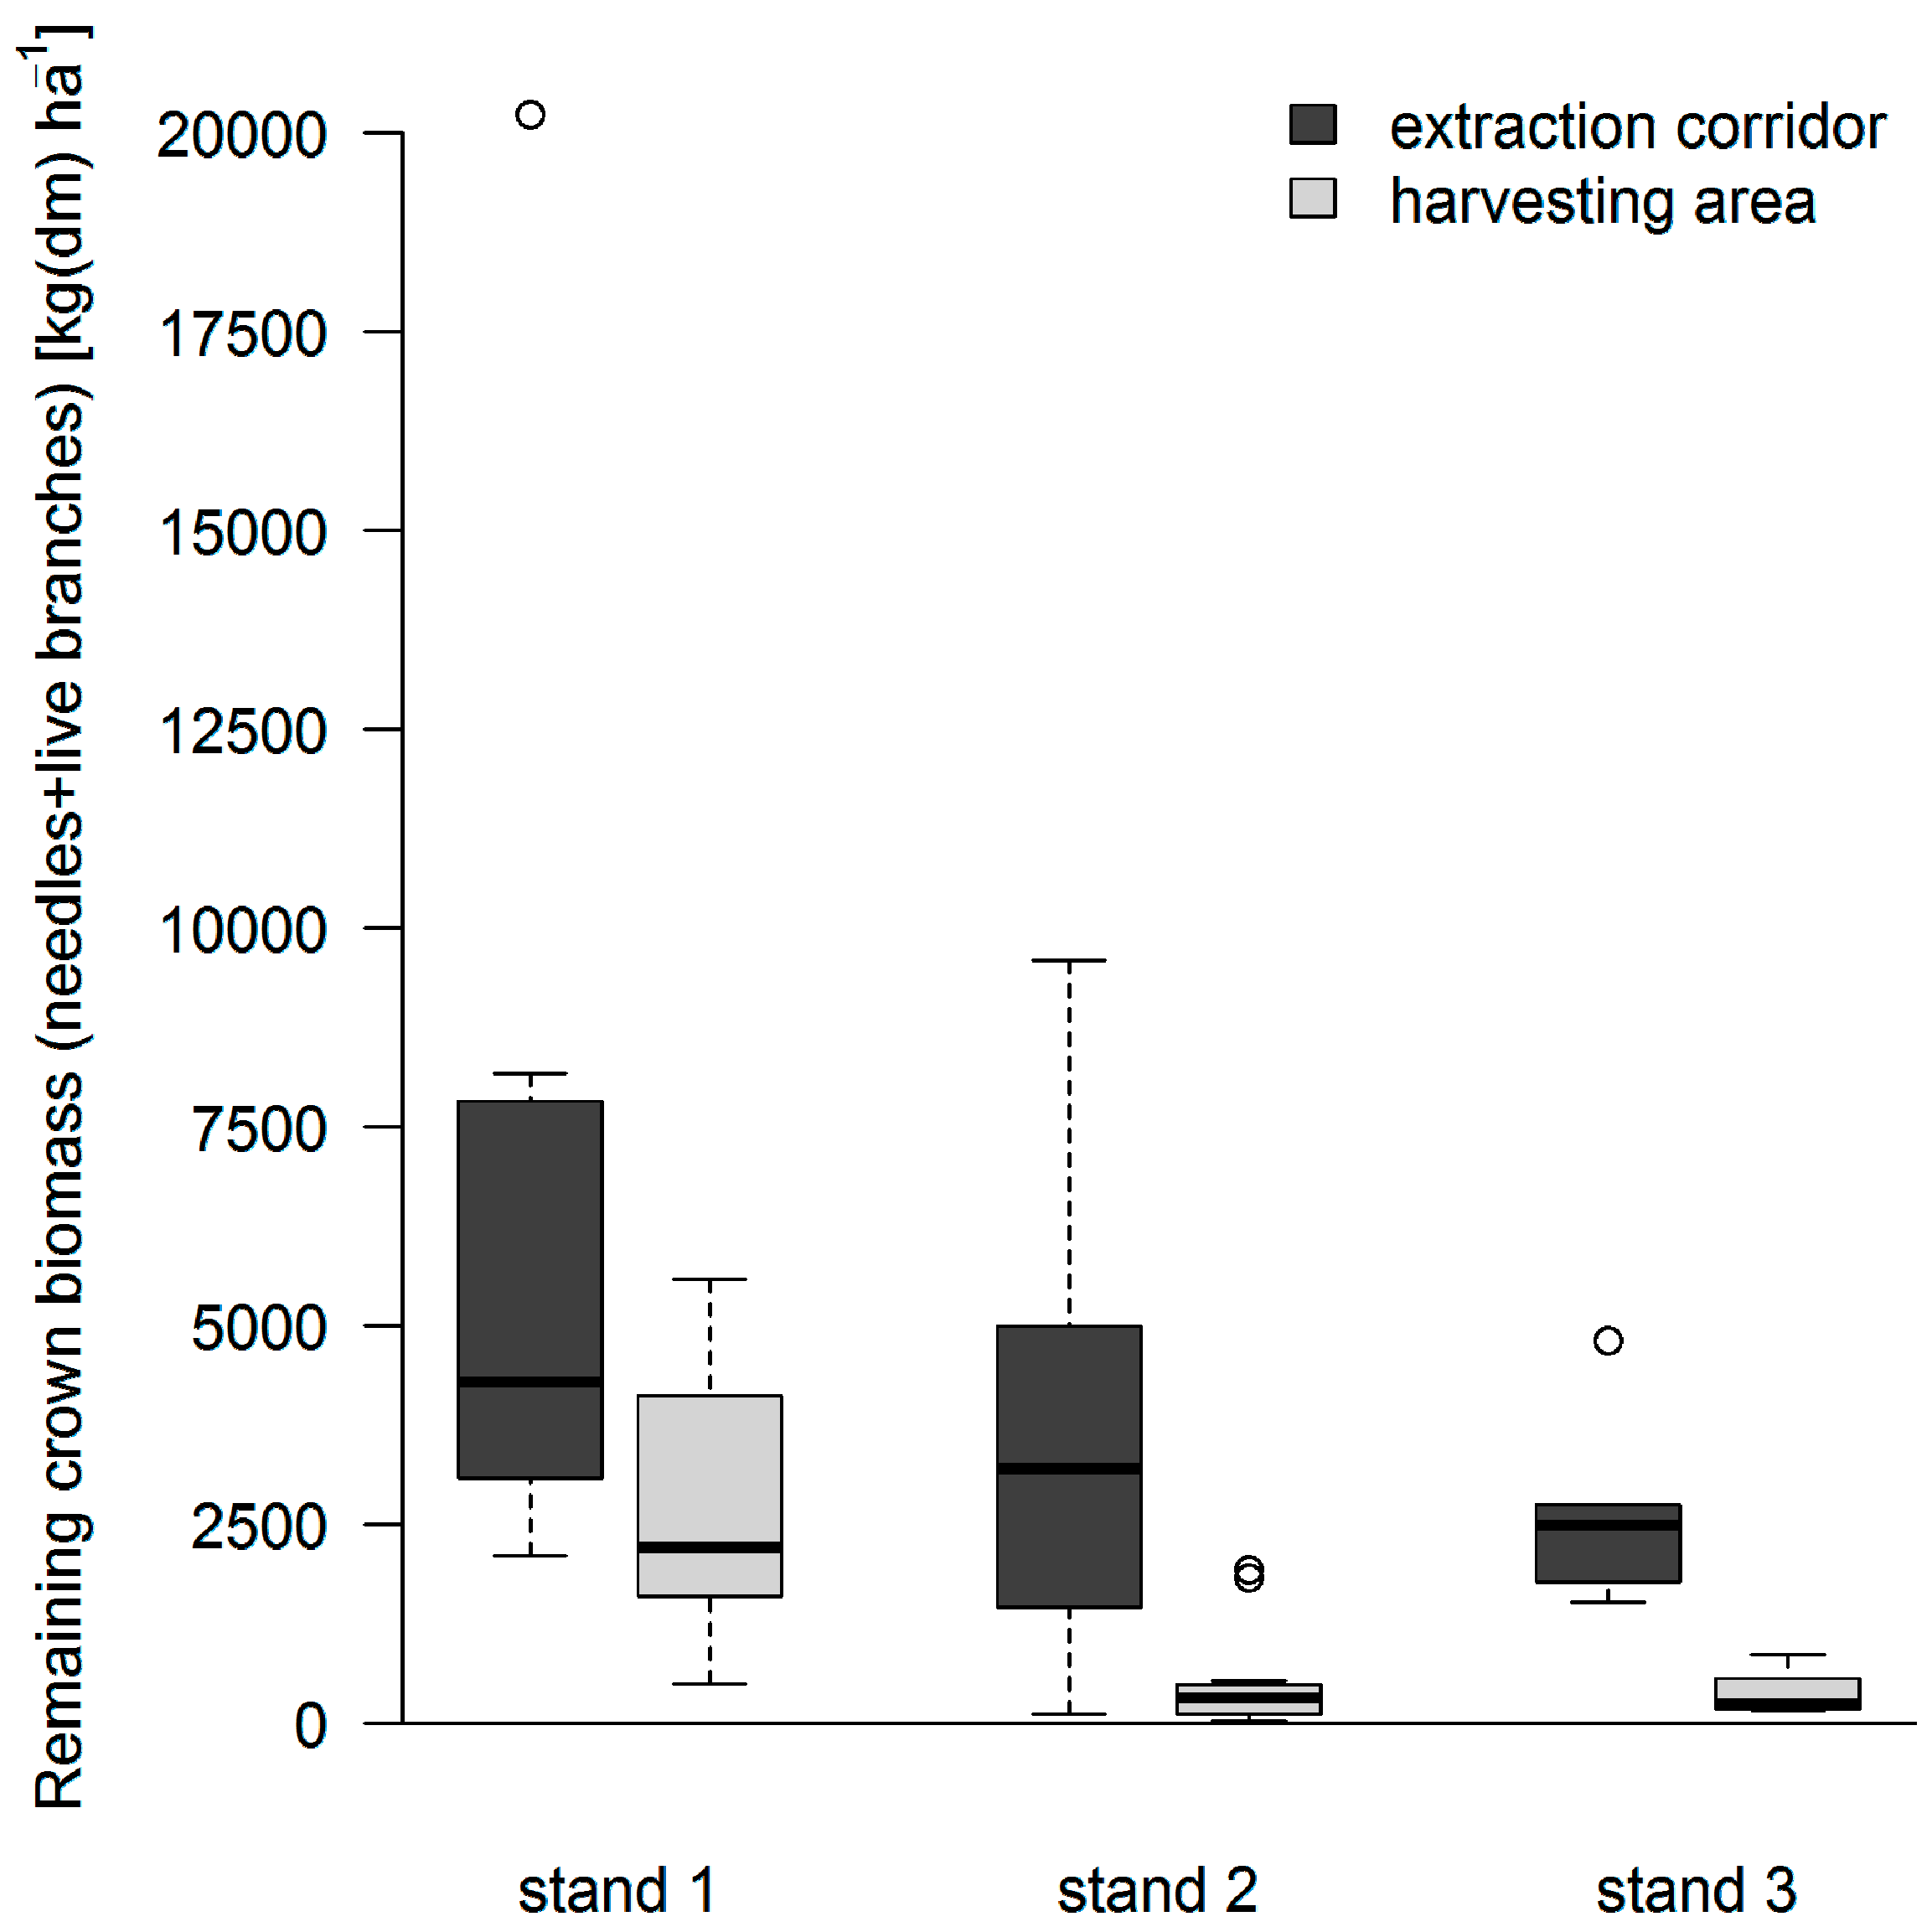
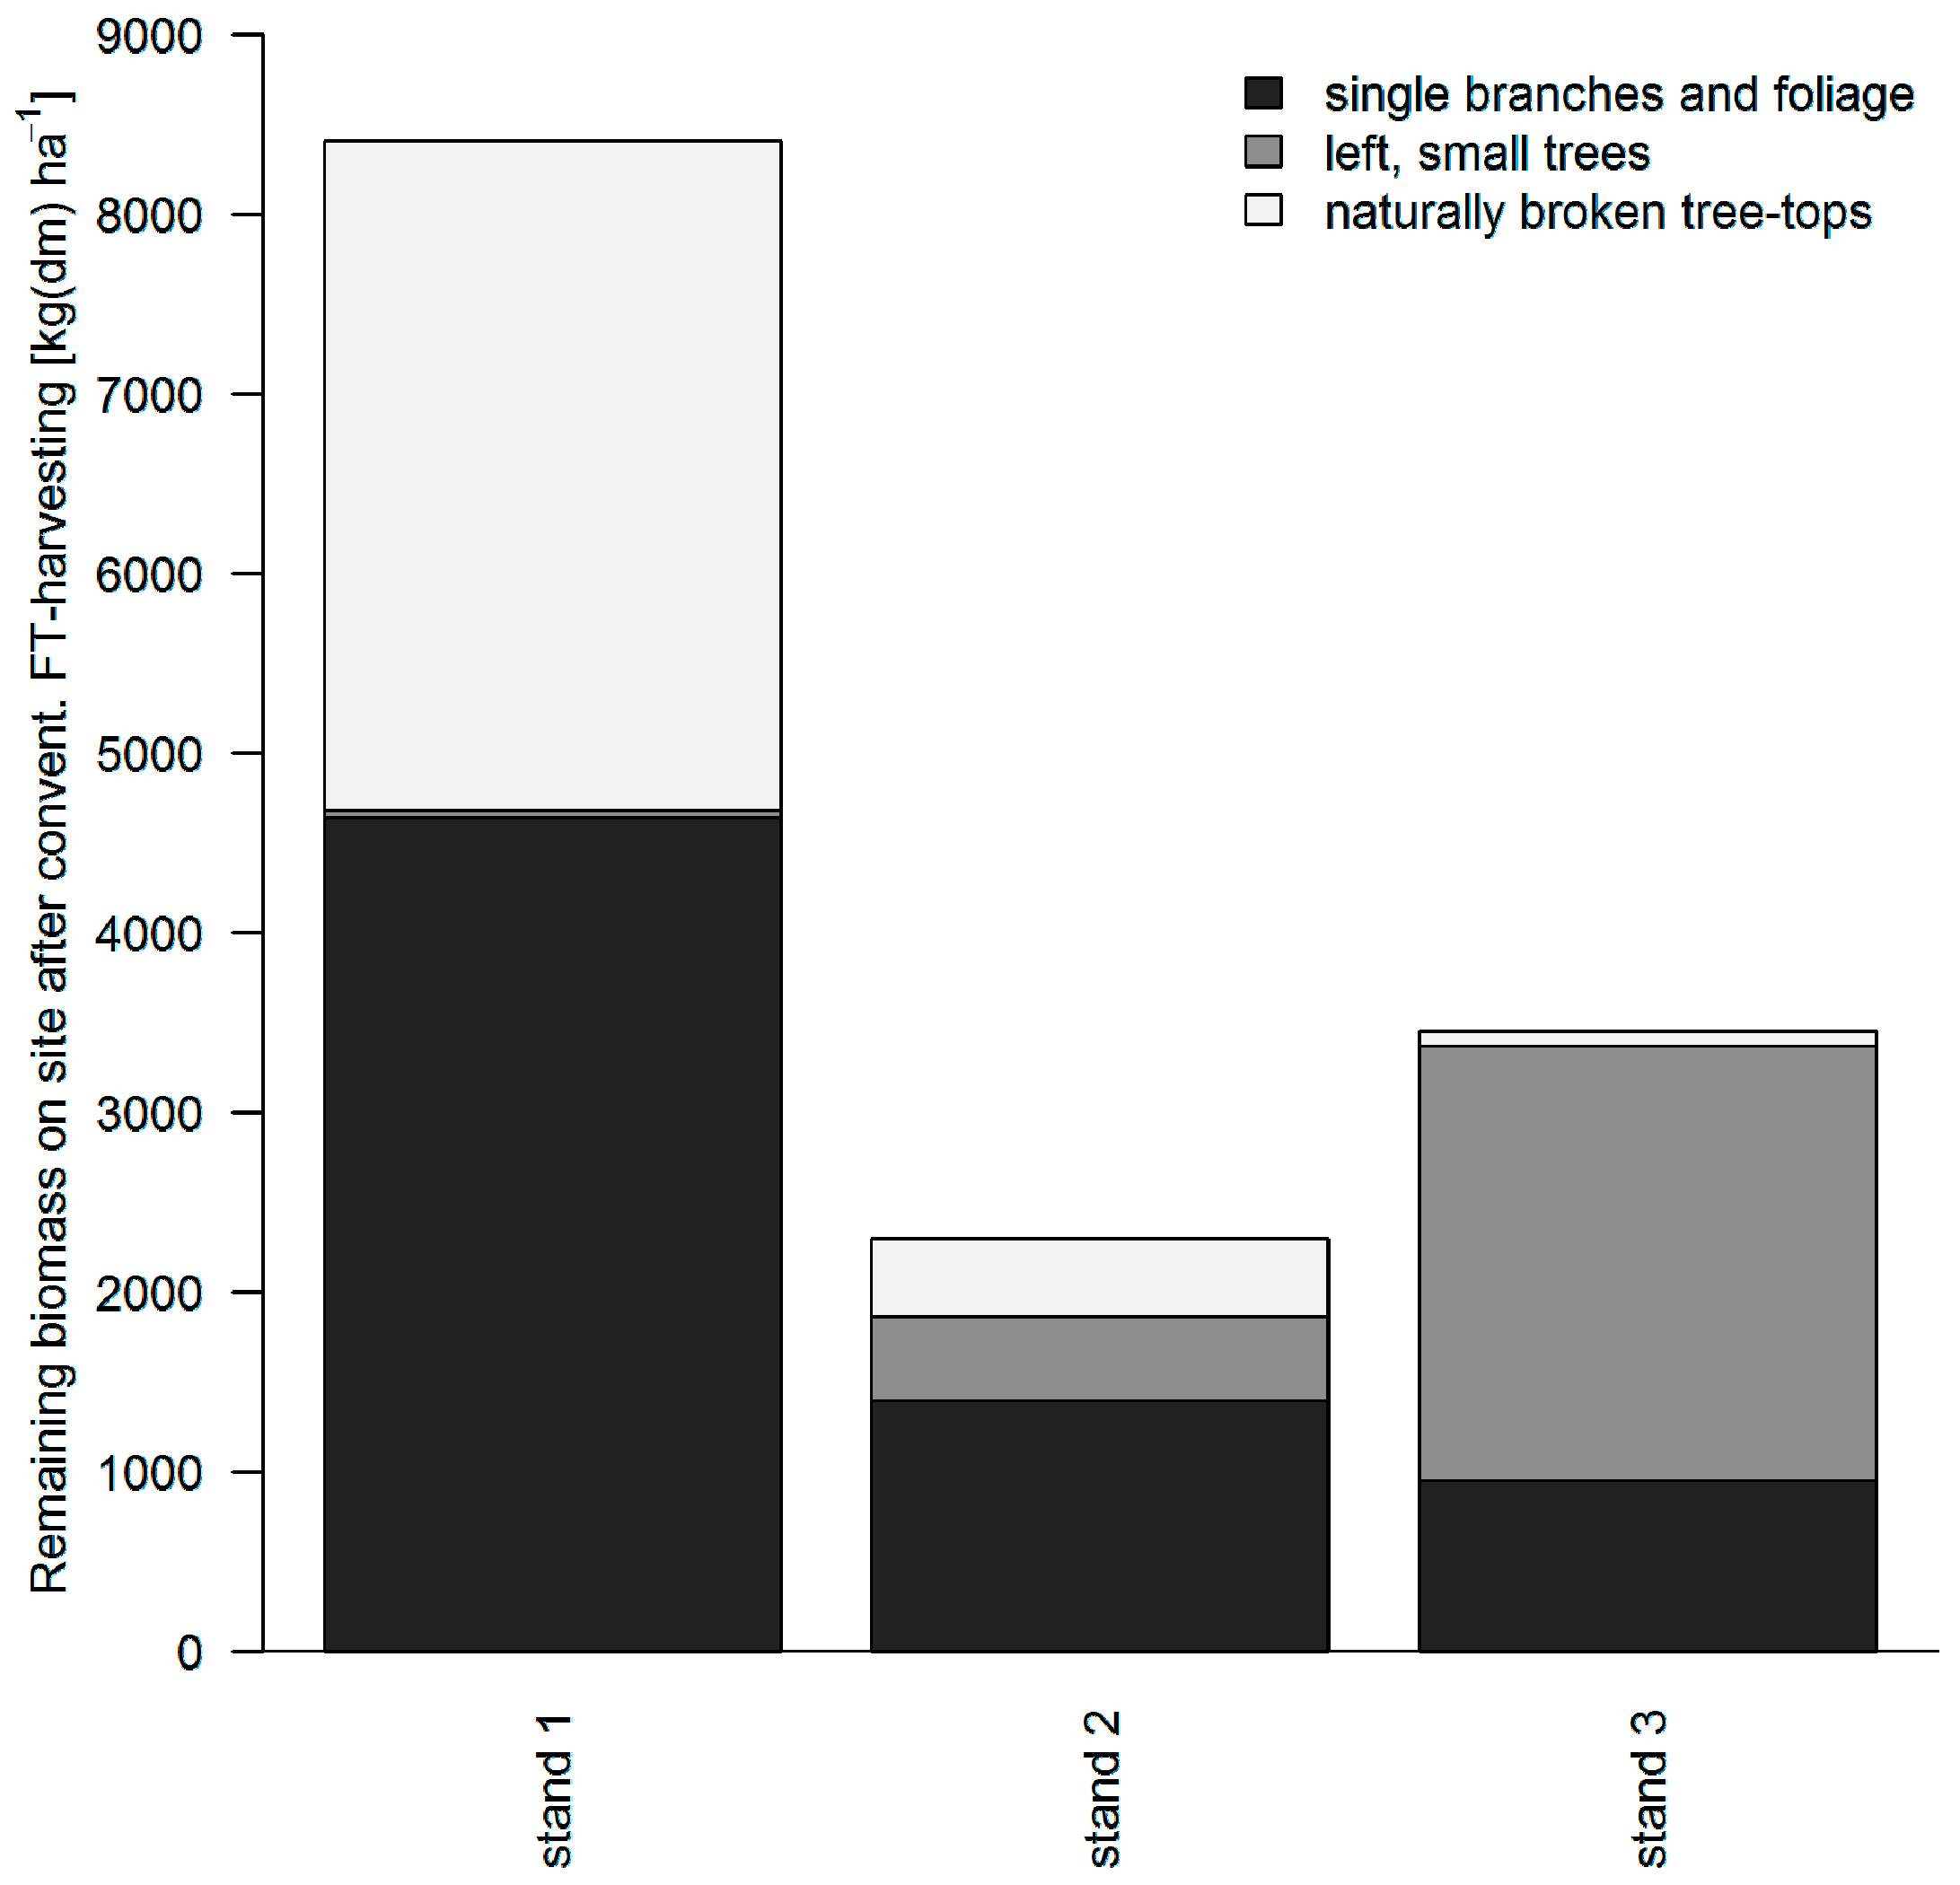
3.2. Distribution of Logging Residues after Conventional FT Cable Yarding

The accumulation of logging residues was highest in the vicinity of the extraction corridors (Figure 3). Especially in the first thinning stands, a significantly higher amount of logging residues was located on the extraction corridor than on the harvesting area (unpaired t-test, p < 0.001). In contrast, the remaining biomass was more evenly distributed at the second thinning stand due to a larger amount of logging residues at the harvesting area. At this site, no significant differences in biomass distribution could be found (unpaired t-test, p = 0.099).

3.3. Additional Effect of Topping on the Amount of Logging Residues

3.3.1. Tree Biomass Models

The final models for estimating the amount of component biomass of a tree are presented in Table 3. All parameter estimates of the aboveground tree component biomass models were statistically significant (p < 0.05) except the β0 parameter estimate of the dead branch model. In general, the absolute amount of biomass for each component increased with greater DBH and tree height. Crown ratio (CR) explained a significant amount of variation only in the needle and dead branch models. The models show that the amount of needles significantly increases with greater CR, while the amount of dead branches decreases with greater CR. The differences between measured and back-transformed modelled biomasses turned out to be small.

3.3.2. Tree-Top Biomass Models

The biomass of tree-tops at different topping diameters was calculated to be able to estimate the effect of different topping strategies (i.e., topping diameter) on biomass removal.
AIC values of the models ranged from 92.5 to 164.4 and RMSE values ranged from 34% to 40% (Table 4). In general, the biomass of the tree-tops of each component increased with increasing topping diameter and tree height. Models, which included factors that describe the social rank of a tree (CR, BAL), showed a small predictive power (selection was based on AIC) and were, thus, not selected as final models.

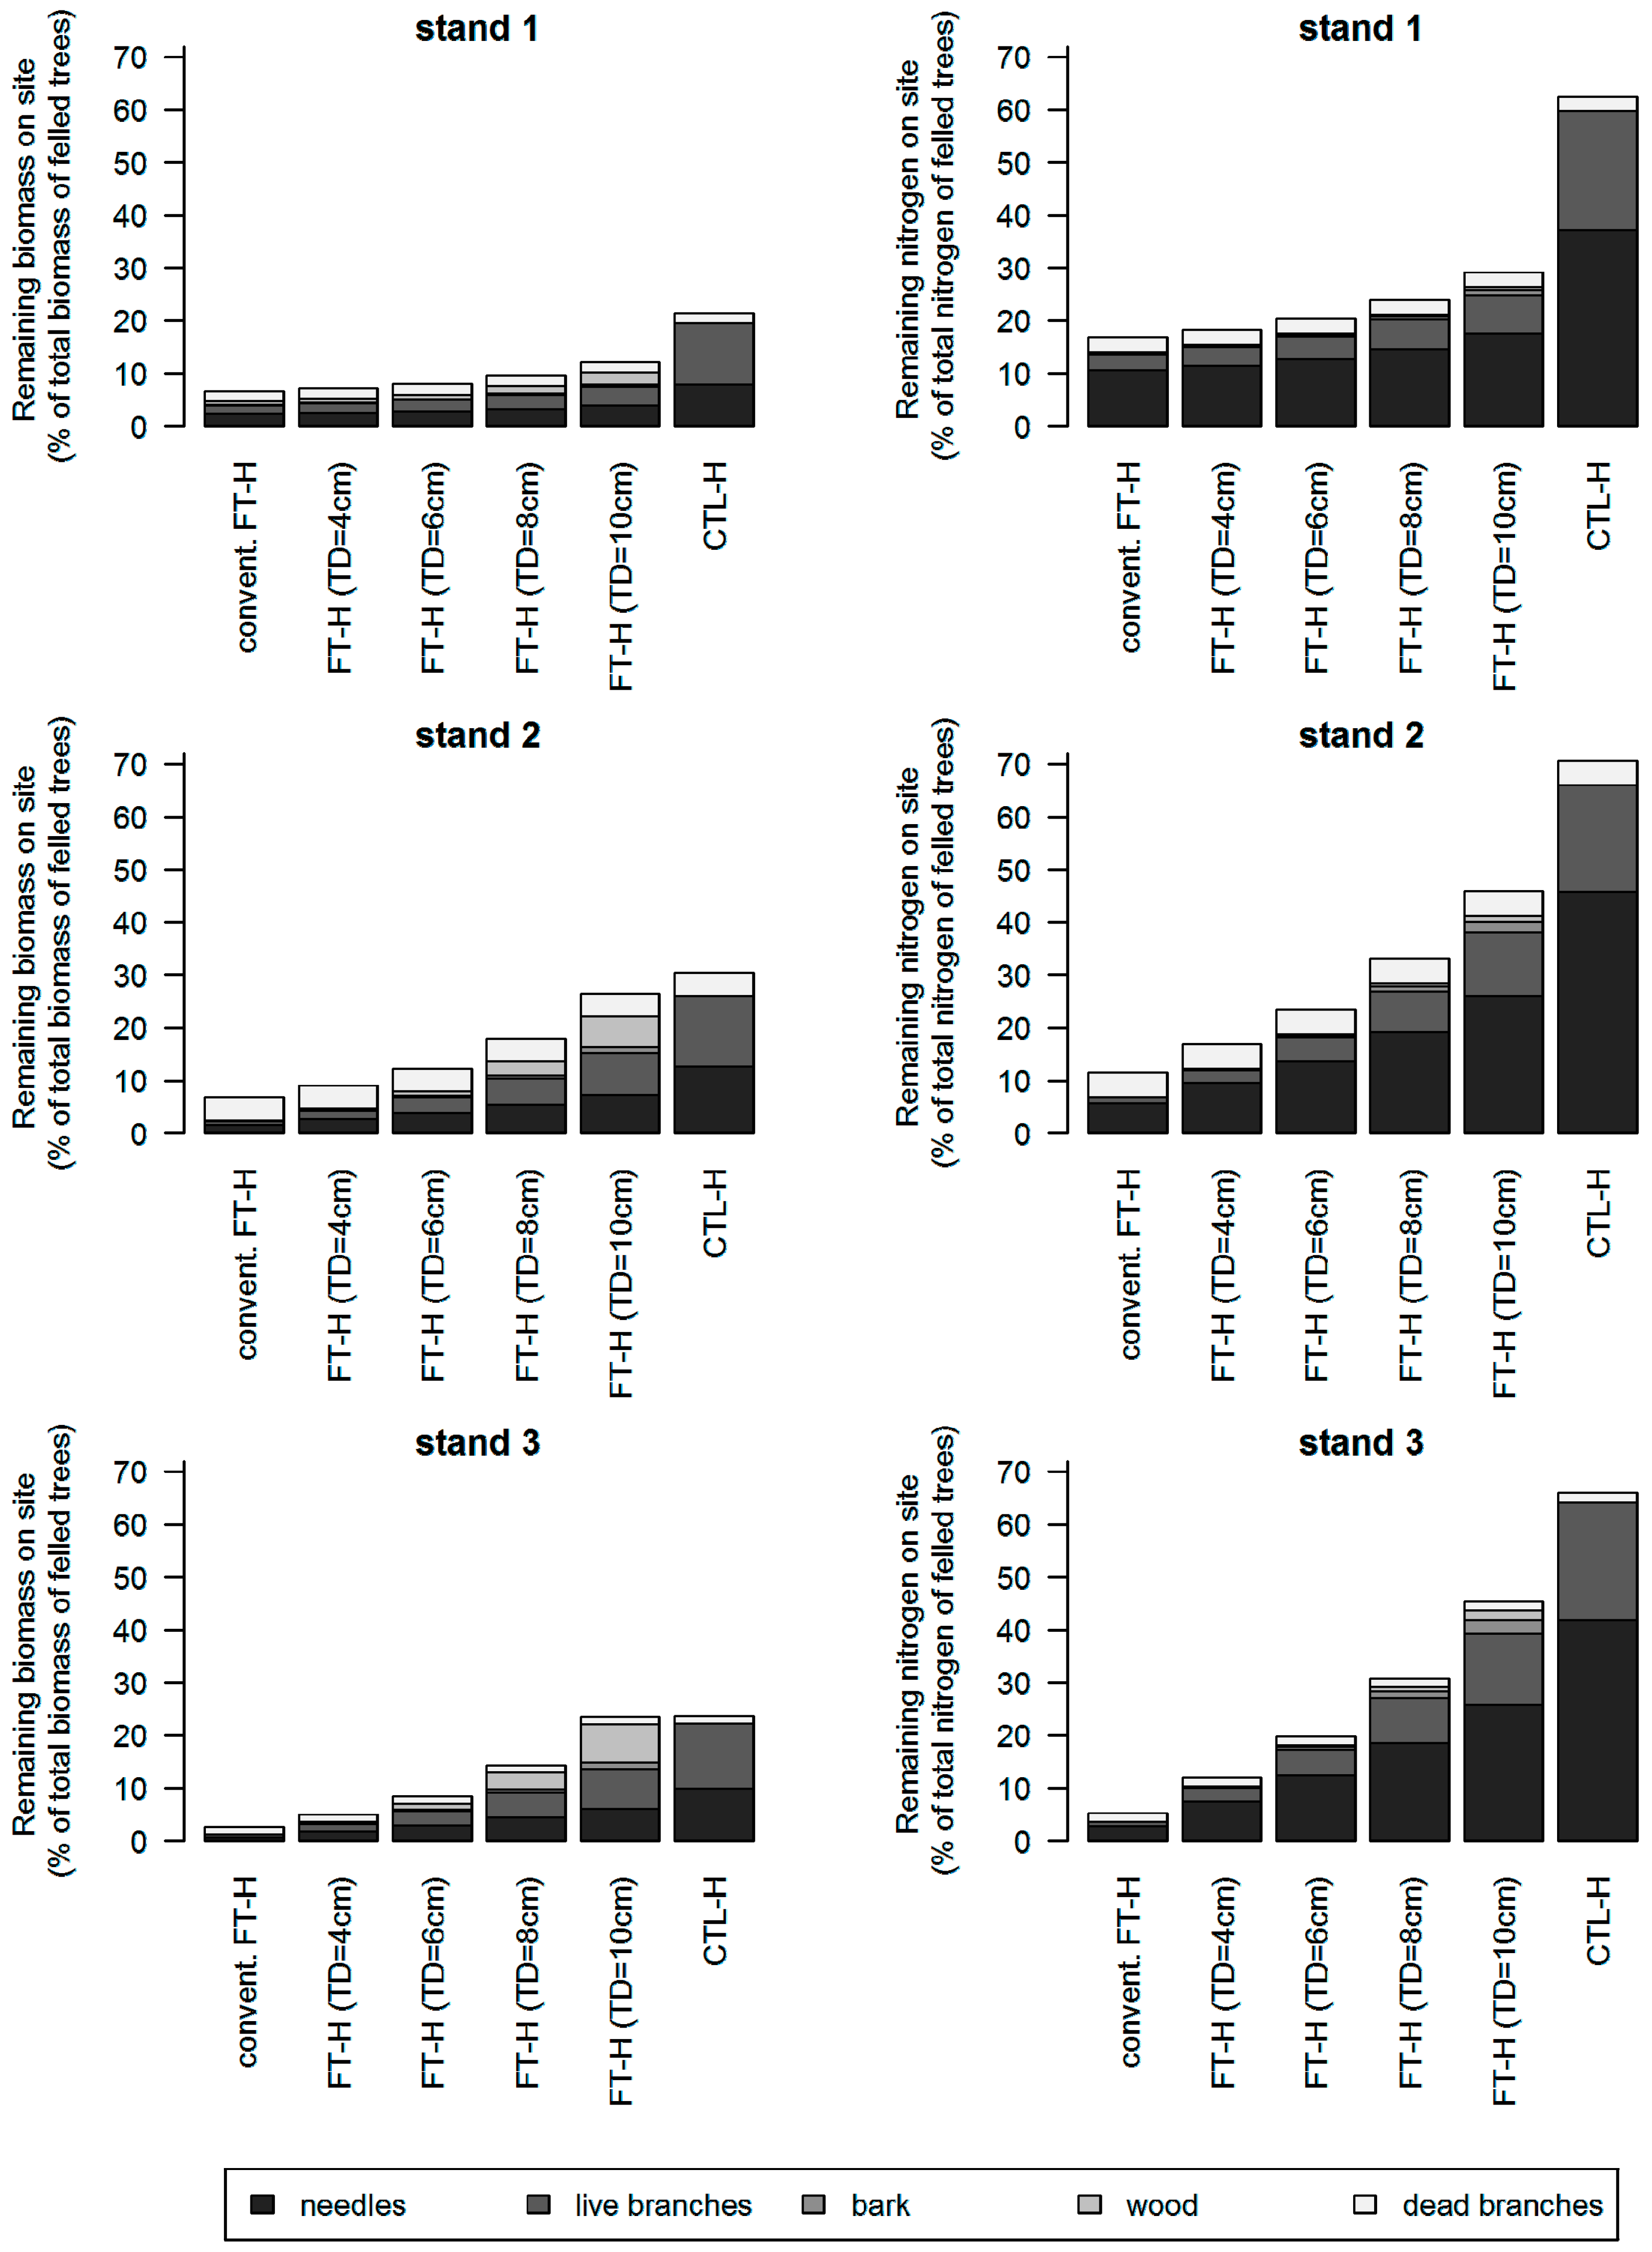
3.4. Scenario Analyses

After the first thinning operations (stands 2 and 3), only 3–8% of the biomass remained at the forest sites as logging residues (Figure 4) after conventional FT cable yarding. The implementation of topping strategies substantially increased the amount of logging residues and, thus, reduced the extraction of nitrogen from the forest sites. Topping the trees at a diameter of 4 cm resulted in an increase of logging residues by 43–67%. The use of a topping diameter of 8 cm would even increase the amount of logging resides by 260–370%, resulting in a total amount of logging residues between 14% and 18%.
After the second thinning operation (stand 1), 7% of the biomass remained on the site after conventional FT harvesting. In contrast to the first thinning operations (stands 2 and 3), the implementation of topping strategies resulted in a slight increase of the logging residues. Topping trees at a diameter of 8 cm only increases the amount of logging residues by 40%.
However, topping of trees mainly increases the amount of nutrient-rich needles and live branches within the logging residues. Other compartments, like wood and dead branches are not affected that much. As a result, an increase in the topping diameter (within the studied range up to a topping diameter of 10 cm) leads to a progressive, strong increase of the amount of nitrogen remaining on the sites. Topping trees at 8 cm within first thinning operations limits the amount of nitrogen extraction to ca. 65%. By using this topping diameter, almost half the amount of logging residues, which would remain in the stand after CTL-harvesting, were left behind in the stands.

4. Discussion

The purpose of this study was to analyze the effect of different topping strategies on the amount of logging residues and remaining nitrogen after FT cable yarding operations. The results clearly indicate that FT harvesting considerably increases nitrogen removal in comparison to CTL-harvesting systems, but still does not remove all nutrients from sites. Furthermore, the results showed that—especially in first thinning operations—topping is an effective way to decrease nitrogen losses due to harvesting.
The results of the present study show large differences in nitrogen removal between the study sites during conventional FT harvesting. Factors such as tree breakage or the leaving of non-merchantable trees in the stand played decisive roles at the study sites, which both substantially increased the amount of logging residues. The findings of this study correspond with those of Hytönen and Moilanen [16], who examined the amount of logging residues in 40–80 year old pine stands in Central Finland using ground-based harvesting machines, although they found somewhat higher amounts of logging residues after conventional FT harvesting, ranging from 32–66% of that of CTL-harvesting. Nevertheless, it has to be taken into account, that differences in factors like tree species, terrain, harvesting period, and harvesting systems may influence branch breakage and, thus, the amount of logging residues to a decisive extent.
According to the results of our study, the implementation of topping in FT cable yarding seems to be a promising strategy to decrease the negative ecological impacts of FT harvesting. Time studies already showed that the productivity of the cable yarding system decreases only marginally if topping of trees is performed [23]. Other studies on strategies, which aim to increase the nutrient pool of forest sites, including airborne fertilizer applications [27,28] and the spreading of wood ash [29,30], showed much higher costs.
The results of this study clearly show that the effect of topping trees on both the amount of logging residues and the amount of remaining nitrogen is highest in first thinning operations, which are usually characterized by a high stand density and a high number of trees that need to be harvested. This result is not surprising, since the number of remaining tree-tops and, thus, the effect of topping trees at a certain diameter is directly linked with the number of harvested trees. As a consequence, the positive ecological impact of topping trees increases with the number of harvested trees. In consideration of these findings, the results of these studies demonstrate that the implementation of topping strategies is especially advantageous in early thinning operations.
However, the decision whether to top trees or not, as well as the choice of the topping diameter, is a difficult and often-studied topic for many forest companies. One relevant driver in forest management decisions, which limits the implementation of topping strategies, is the increased risk of fatal insect outbreaks. Insect species, like the European spruce bark beetle (Ips typographus), or the six-toothed spruce bark beetle (Pityogenes chalcographus) are one of the major biotic disturbances in Central European Norway spruce stands [31]. Especially, Pityogenes chalcographus is of particular interest because this beetle, in contrast to Ips typographus, prefers to attack small diameter wood, like tree-tops [32]. However, the hazard of bark beetle attacks can be reduced both, by cutting the tree-tops to smaller pieces in order to increase drying speed or by avoiding harvesting operations during spring and summer at sites with high risk of bark beetle attacks.
However, one of the main limitation of this study is that it was not possible to distinguish between pre-existing dead branches and dead branches, which broke off during the harvesting operation. An additional pre-harvest forest residue sampling may serve as one opportunity for further study to assess the amount of logging residues with higher accuracy.

5. Conclusions

The results of this study show that topping trees is an effective way to minimize the export of nitrogen from forest sites when using FT cable yarding. In first thinning operations, only 5–12% of the nitrogen remained at the forest sites. The implementation of topping strategies substantially increases the amount of logging residues and reduces the amount of nitrogen extraction from the forest sites, and the topping diameter substantially increased the amount of logging residues. The effect of topping trees in second thinning operations was somewhat lower. However, the effect of topping largely depends on the topping diameter. Up to a topping diameter of 10 cm, the additional amount of nitrogen remaining on the sites increases nearly exponentially with increasing topping diameter.

Acknowledgments

This research was funded by the cooperation-platform “Forst-Holz-Papier”. The authors also thank the forest company “Mayr-Melnhof-Saurau” for providing the study sites and for supporting us during field measurements.

Author Contributions

C. Huber, E. Hochbichler, and K. Stampfer conceived and designed the experiments; M. Kastner and C. Huber performed the experiments; C. Huber and E. Hochbichler analyzed the data; and C. Huber wrote the paper.

Conflicts of Interest

The authors declare no conflict of interest.

References

  1. Heinimann, H.R.; Stampfer, K.; Loschek, J.; Caminada, L. Perspectives on Central European Cable Yarding Systems. Aust. J. For. Sci. 2006, 123, 121–139. [Google Scholar]
  2. European Parliament and Council. Directive 2009/28/EC of the European Parliament and of the Council of 23 April 2009 on the promotion of the use of energy from renewable sources and amending and subsequently repealing directives 2001/77/EC and 2003/30/EC, Public Law 140. 2009. Available online: https://www.ecolex.org/details/legislation/directive-200928ec-of-the-european-parliament-and-of-the-council-on-the-promotion-of-the-use-of-energy-from-renewable-sources-and-amending-and-subsequently-repealing-directives-200177ec-and-200330ec-lex-faoc088009/ (accessed on 16 October 2017).
  3. Krapfenbauer, A. Rationalisierungsbestrebungen und Standortsproduktivität. Allg. Forstzeitung. 1968, 79, 128–130. [Google Scholar]
  4. Kreutzer, K. Der Einfluss moderner Holzernteverfahren auf die Ökologie des Waldes. Verhandlungen der Gesellschaft für Ökologie 1980, 8, 229–233. [Google Scholar]
  5. Helmisaari, H.-S.; Hanssen, K.H.; Jacobson, S.; Kukkola, M.; Luiro, J.; Saarsalmi, A.; Tamminen, P.; Tveite, B. Logging residue removal after thinning in Nordic boreal forests: Long term impact on tree growth. For. Ecol. Manag. 2011, 261, 1919–1927. [Google Scholar] [CrossRef]
  6. Sterba, H. Increment losses by full-tree harvesting in Norway spruce (Picea abies). For. Ecol. Manag. 1988, 24, 283–292. [Google Scholar] [CrossRef]
  7. Proe, M.F.; Dutch, J. Impact of whole-tree harvesting on second-rotation growth of Sitka spruce: The first 10 years. For. Ecol. Manag. 1994, 66, 39–54. [Google Scholar] [CrossRef]
  8. Egnell, G.; Leijon, B. Effects of different levels of biomass removal in thinning on short–term production of pinus sylvestris and picea abies stands. Scand. J. For. Res. 1997, 12, 17–26. [Google Scholar] [CrossRef]
  9. Egnell, G. Is the productivity decline in Norway spruce following whole-tree harvesting in the final felling in boreal Sweden permanent or temporary? For. Ecol. Manag. 2011, 261, 148–153. [Google Scholar] [CrossRef]
  10. Tveite, B.; Hanssen, K.H. Whole-tree thinnings in stands of Scots pine (Pinus sylvestris) and Norway spruce (Picea abies): Short- and long-term growth results. For. Ecol. Manag. 2013, 298, 52–61. [Google Scholar] [CrossRef]
  11. Brandtberg, P.-O.; Olsson, B.A. Changes in the effects of whole-tree harvesting on soil chemistry during 10 years of stand development. For. Ecol. Manag. 2012, 277, 150–162. [Google Scholar] [CrossRef]
  12. Akselsson, C.; Westling, O.; Sverdrup, H.; Holmqvist, J.; Thelin, G.; Uggla, E.; Malm, G. Impact of harvest intensity on long-term base cation budgets in Swedish forest soils. Water Air Soil Poll. 2007, 7, 201–210. [Google Scholar] [CrossRef]
  13. Ranger, J.; Turpault, M.-P. Input-output nutrient budgets as a diagnostic tool for sustainable forest management. For. Ecol. Manag. 1999, 122, 139–154. [Google Scholar] [CrossRef]
  14. Palviainen, M.; Finér, L. Estimation of nutrient removals in stem-only and whole-tree harvesting of Scots pine, Norway spruce, and birch stands with generalized nutrient equations. Europ. J. For. Res. 2012, 131, 945–964. [Google Scholar] [CrossRef]
  15. Briedis, J.I.; Wilson, J.S.; Benjamin, J.G.; Wagner, R.G. Biomass retention following whole-tree, energy wood harvests in central Maine: Adherence to five state guidelines. Biomass Bionenerg. 2011, 35, 3552–3560. [Google Scholar] [CrossRef]
  16. Hytönen, J.; Moilanen, M. Effect of harvesting method on the amount of logging residues in the thinning of Scots pine stands. Biomass Bioenerg. 2014, 67, 347–353. [Google Scholar] [CrossRef]
  17. Ghaffariyan, M.R.; Apolit, R. Harvest residues assessment in pine plantations harvested by whole tree and cut-to-length harvesting methods (a case study in Queensland, Australia). Silva Balc. 2015, 16, 113–122. [Google Scholar]
  18. Kizha, A.R.; Han, H.-S. Forest residues recovered from whole-tree timber harvesting operations. Eur. J. For. Eng. 2015, 1, 46–55. [Google Scholar]
  19. Young, H.E.; Carpenter, P.M. Weight, Nutrient Element and Productivity Studies of Seedlings and Saplings of Eight tree Species in Natural Ecosystems. Maine Agricultural Experiment Station Technical Bulletin 28; University of Maine: Orono, ME, USA, 1967. [Google Scholar]
  20. Lick, E. Untersuchungen zur Problematik des Biomassen- und Nährelemententzuges bei der Erstdurchforstung eines Zentralalpinen Fichtenbestandes. Ph.D. Thesis, University of Natural Resources and Life Sciences, Vienna, Austria, 1989. [Google Scholar]
  21. Hendrickson, O.Q.; Chatarpaul, L.; Burgess, D. Nutrient cycling following whole-tree and conventional harvest in northern mixed forest. Can. J. For. Res. 2016, 19, 725–735. [Google Scholar] [CrossRef]
  22. Krapfenbauer, A.; Buchleitner, E. Holzernte, Biomassen- und Nährstoffaustrag, Nährstoffbilanz eines Fichtenbestandes. Aust. J. For. Sci. 1981, 98, 193–223. [Google Scholar]
  23. Huber, C.; Stampfer, K. Efficiency of topping trees in cable yarding operations. Croat. J. For. Eng. 2015, 36, 321–331. [Google Scholar]
  24. Zuur, A.F.; Ieno, E.N.; Walker, N.J.; Saveliev, A.A.; Smith, G.M. Mixed Effects Models and Extensions in Ecology with R; Springer: New York, NY, USA, 2009. [Google Scholar]
  25. Pinheiro, J.; Bates, D.; DebRoy, S.; Sarkar, D.; R Core Team. nlme: Linear and Nonlinear Mixed Effects Models, R-package Version 3.1-128. 2016. Available online: https://cran.r-project.org/web/packages/nlme/nlme.pdf (accessed on 16 May 2016).
  26. R Core Team. A Language and Environment of Statistical Computing; R Foundation of Statistical Computing: Vienna, Austria, 2014. [Google Scholar]
  27. Ring, E.; Högbom, L.; Jansson, G. Effects of previous nitrogen fertilization on soil-solution chemistry after final felling and soil scarification at two nitrogen-limited forest sites. Can. J. For. Res. 2013, 43, 396–404. [Google Scholar] [CrossRef]
  28. Page, J.M.; Gustafson, M.L. Equipment for Forest Fertilization. SAE Technical Paper 690553 1969. Available online: https://doi.org/10.4271/690553 (accessed on 16 May 2016).
  29. Väätäinen, K.; Sirparanta, E.; Räisänen, M.; Tahvanainen, T. The costs and profitability of using granulated wood ash as a forest fertilizer in drained peatland forests. Biomass Bioenerg. 2011, 35, 3335–3341. [Google Scholar] [CrossRef]
  30. Huber, C.; Stampfer, K. Evaluation of a modified centrifugal spreader to apply nutrient-rich fine 432 fractions from woodchips as a fertilizer to cutover areas in steep terrain. In Proceedings of the 39th 433 Annual Meeting of the Council of Forest Engineering (COFE), Vancouver, BC, Canada, 19–21 September 2016. [Google Scholar]
  31. Pasztor, F.; Matulla, C.; Rammer, W.; Lexer, M.J. Drivers of the bark beetle disturbance regime in Alpine forests in Austria. For. Ecol. Manag. 2014, 318, 349–358. [Google Scholar] [CrossRef]
  32. Seidl, R.; Baier, P.; Rammer, W.; Schopf, A.; Lexer, M.J. Modelling tree mortality by bark beetle infestation in Norway spruce forests. Ecol. Model. 2007, 206, 383–399. [Google Scholar] [CrossRef]
Figure 1. Estimation of logging residues after conventional FT cable yarding. Sample plots were positioned systematically across the harvesting area.
Sustainability 09 01856 g001
Figure 2. Amounts of logging residues at the experimental sites after conventional FT harvesting.
Sustainability 09 01856 g002
Figure 3. Lateral distribution of the remaining needle and twig biomass at the experimental sites.
Sustainability 09 01856 g003
Figure 4. Relative biomass (% of total tree biomass of extracted trees, left column) and relative nitrogen (% of total nitrogen within the biomass of extracted trees, right column) at the three study sites under different management scenarios: conventional FT-H (FT harvesting without topping), FT-H (4 cm) (FT harvesting and topping of all trees at 4 cm), FT-H (6 cm) (FT harvesting and topping of all trees at 6 cm), FT-H (8 cm) (FT harvesting and topping of all trees at 8 cm), FT-H (10 cm) (FT harvesting and topping of all trees at 10 cm), and CTL-H (Cut-to-length harvesting, where all branches and needles remain on site).
Sustainability 09 01856 g004
Table 1. Site, stand, and harvesting characteristics of the study sites.
Parameter Study Sites (Stands)
123
Harvesting operation Second thinningFirst thinningFirst thinning
Previous operation First thinningPre-commercial thinning-
Harvesting area (m2) 10,20011,7006800
Number of cable lines 222
Yarding distance (m) 170250125
Extraction direction uphilluphilluphill
Stand age (years) 583834
Average slope (%) 536170
Species composition 85% spruce83% spruce80% spruce
9% larch9% larch10% birch
6% others8% others10% others
Stand density 1 (trees ha−1)Before harvesting7289791667
After harvesting320454500
Basal area 1 (m² ha−1)Before harvesting52.426.434.2
After harvesting31.915.717.1
Stand volume 1 (m³ ha−1)Before harvesting727271204
After harvesting451163109
1 DBH threshold: 6 cm.
Table 2. Attributes of the felled Norway spruce sample trees.
AttributeMeanSD 1MinMax
Stand 1—Second Thinning (n = 8)
DBH (cm)29.98.716.041.9
height (m)29.13.822.134.1
crown length (m)13.81.910.316.7
crown ratio (%)4743954
Stand 2—First Thinning (n = 8)
DBH (cm)17.44.510.423.0
height (m)18.33.012.420.8
crown length (m)9.22.46.312.7
crown ratio (%)5083661
Stand 3—First Thinning (n = 9)
DBH (cm)16.54.89.122.4
height (m)16.54.37.121.0
crown length (m)7.82.62.510.3
crown ratio (%)4683562
1 SD = standard deviation.
Table 3. Estimated parameters of selected log-transformed aboveground tree component biomass models (Equation (3)), including model quality values (RMSE, AIC) and the bias correction factor (cf) (Equation (4)).
ComponentnParameter EstimatesRMSEAICcf
β0β1β2β3β4
ln(Needles)25−9.748 c2.507 c-1.219 b-0.24422.21.007
ln(Live branches)25−5.059 c2.613 c---0.30828.51.026
ln(Dead branches)251.6452.539 c-−1.961 b-0.38645.21.059
ln(Bark)25−5.054 c1.719 c0.795 a--0.1601.51.015
ln(Wood)25−4.131 c1.885 c1.018 c--0.137−8.40.976
a significant at p < 0.05; b significant at p < 0.01; c significant at p < 0.001.
Table 4. Estimated parameters of selected log-transformed tree-top biomass models (Equation (5)), including model quality values (RMSE, AIC) and the bias correction factor (cf) (Equation (4)).
ComponentnParameter estimatesRMSEAICcf
β0β1β2β3β4β5
ln(Needles)125−7.324 c-1.553 c--1.906 c0.402164.41.037
ln(Live branches)125−6.031 c0.942 c---2.223 c0.399152.71.089
ln(Bark)125−7.565 c−0.914 c0.996 b--3.247 c0.399126.40.928
ln(Wood)125−6.427 c−1.213 c1.141 c--3.669 c0.33692.50.936
a significant at p < 0.05; b significant at p < 0.01; c significant at p < 0.001.

