Analysis of the Driving Forces in Vegetation Variation in the Grain for Green Program Region, China


Abstract
:1. Introduction
2. Data and Methods
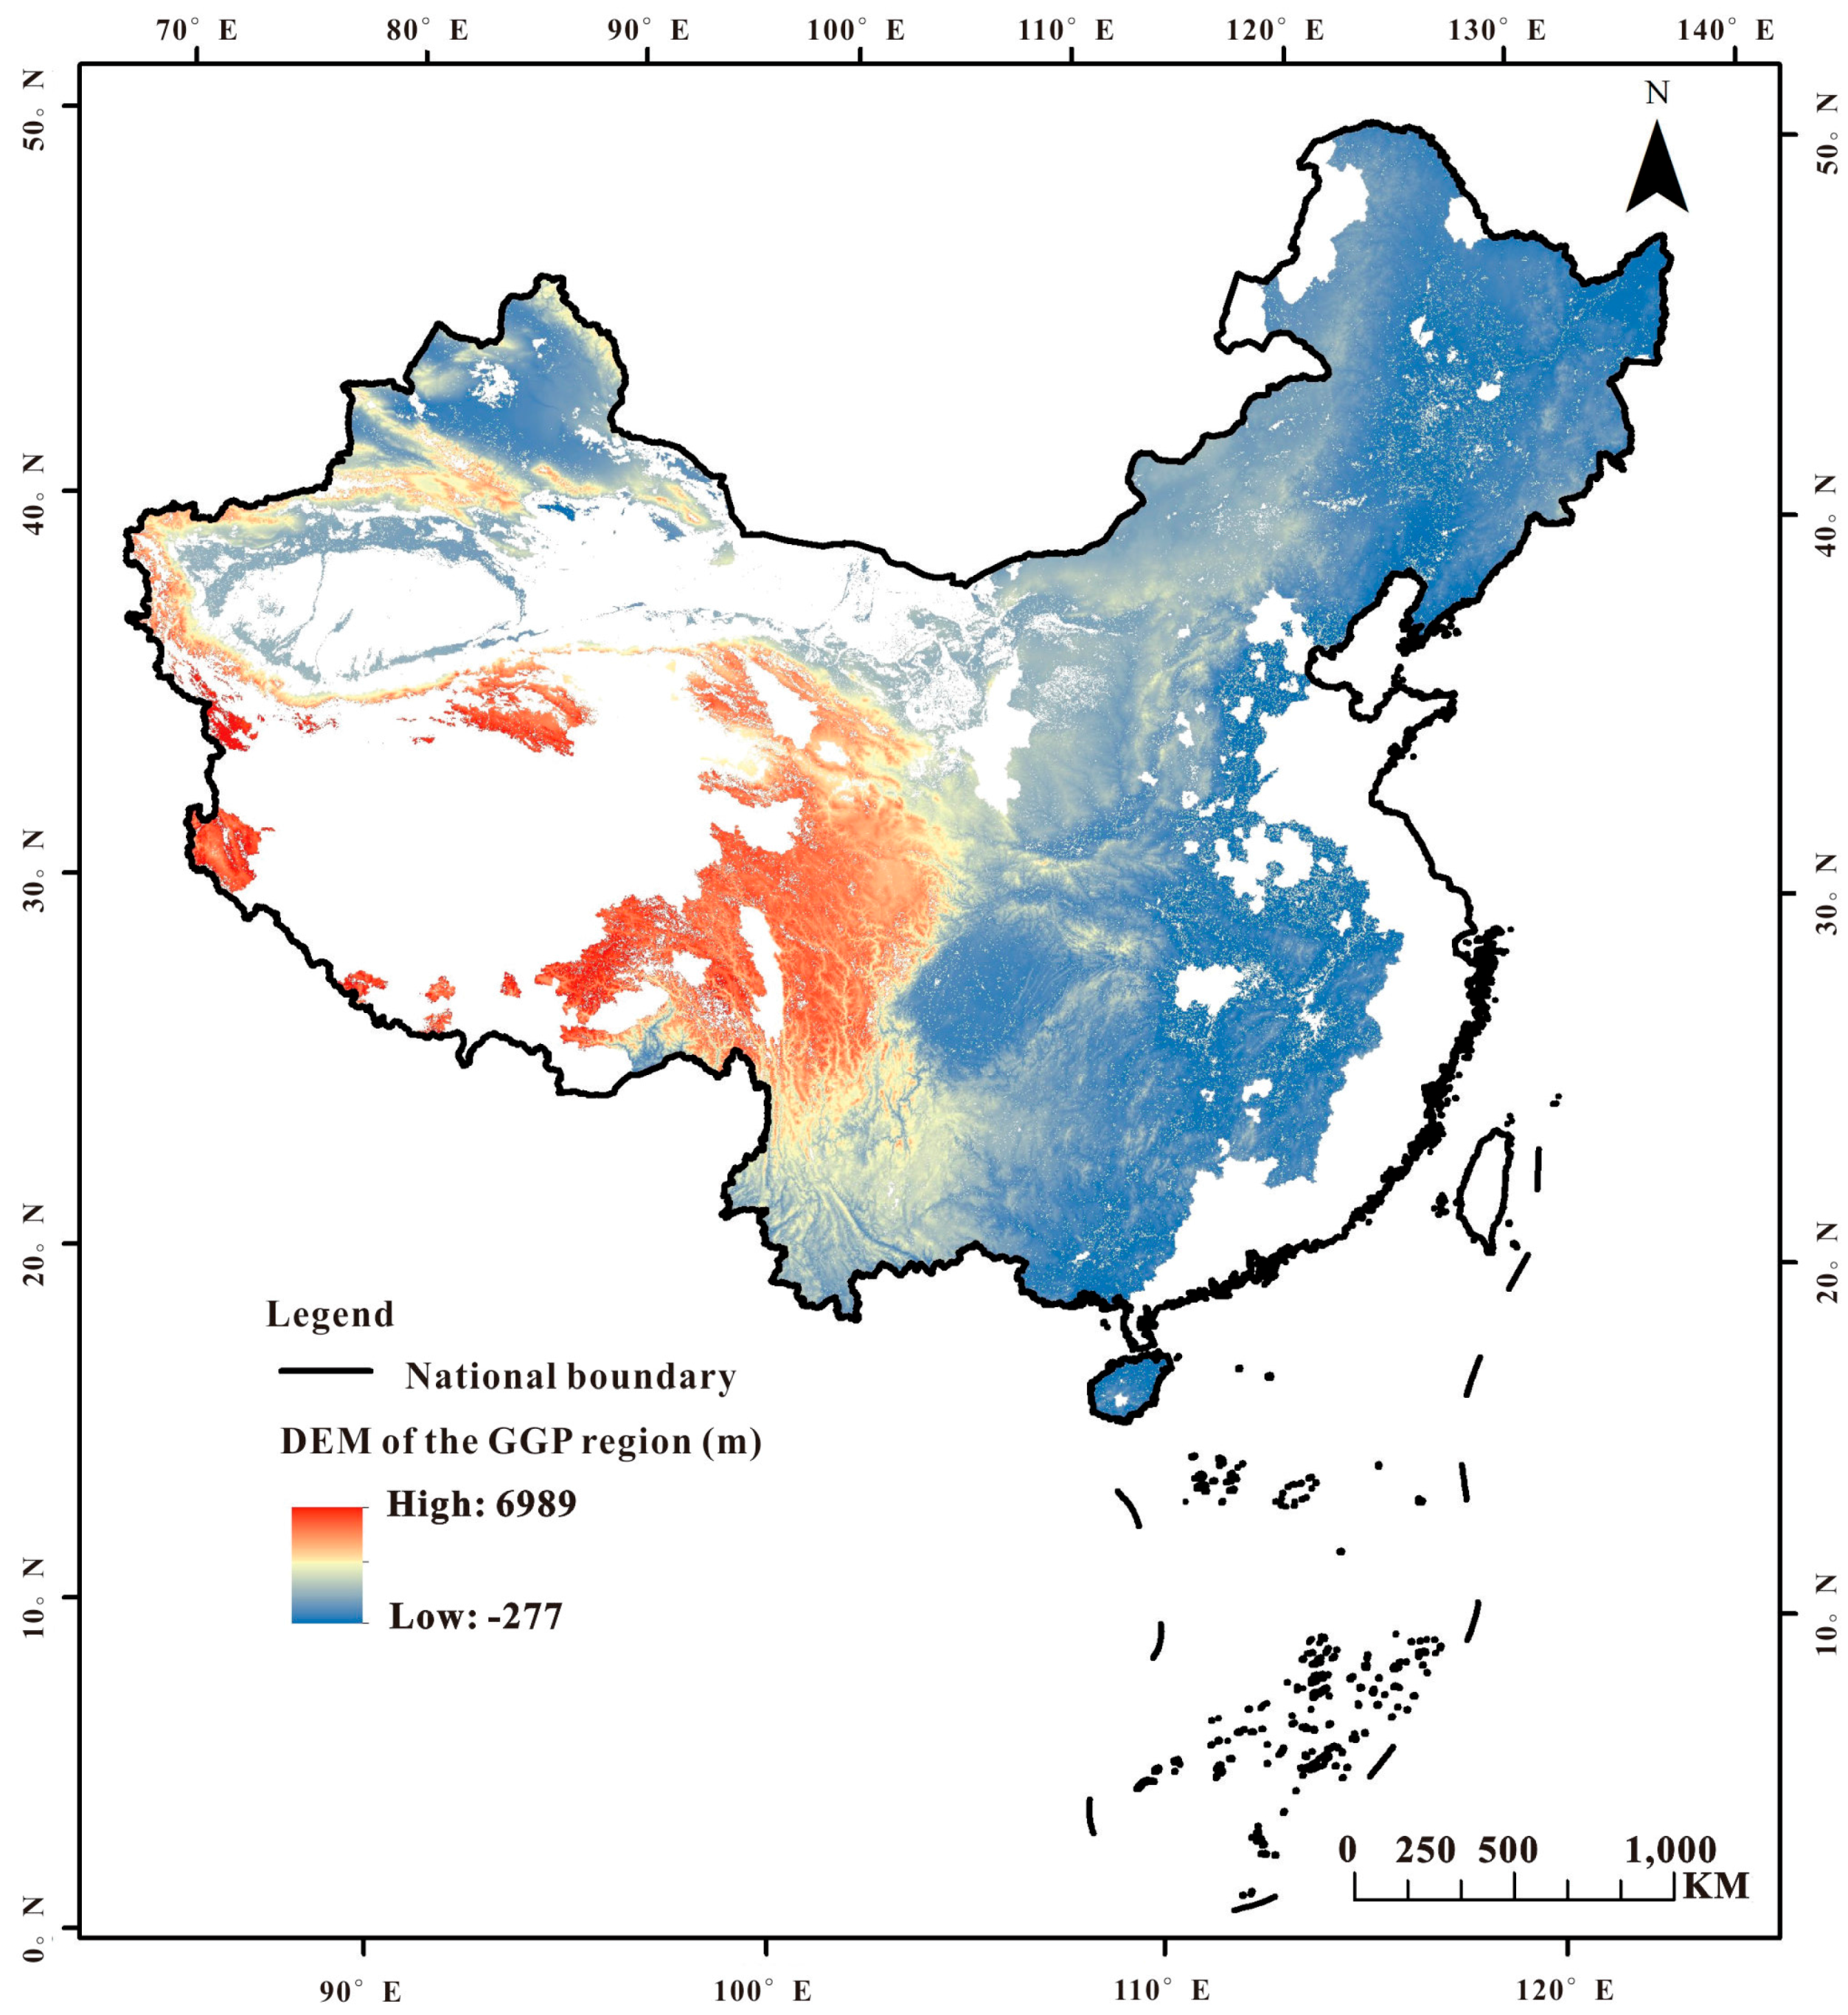
2.1. Study Area
2.2. Dataset
2.3. Methods
3. Results
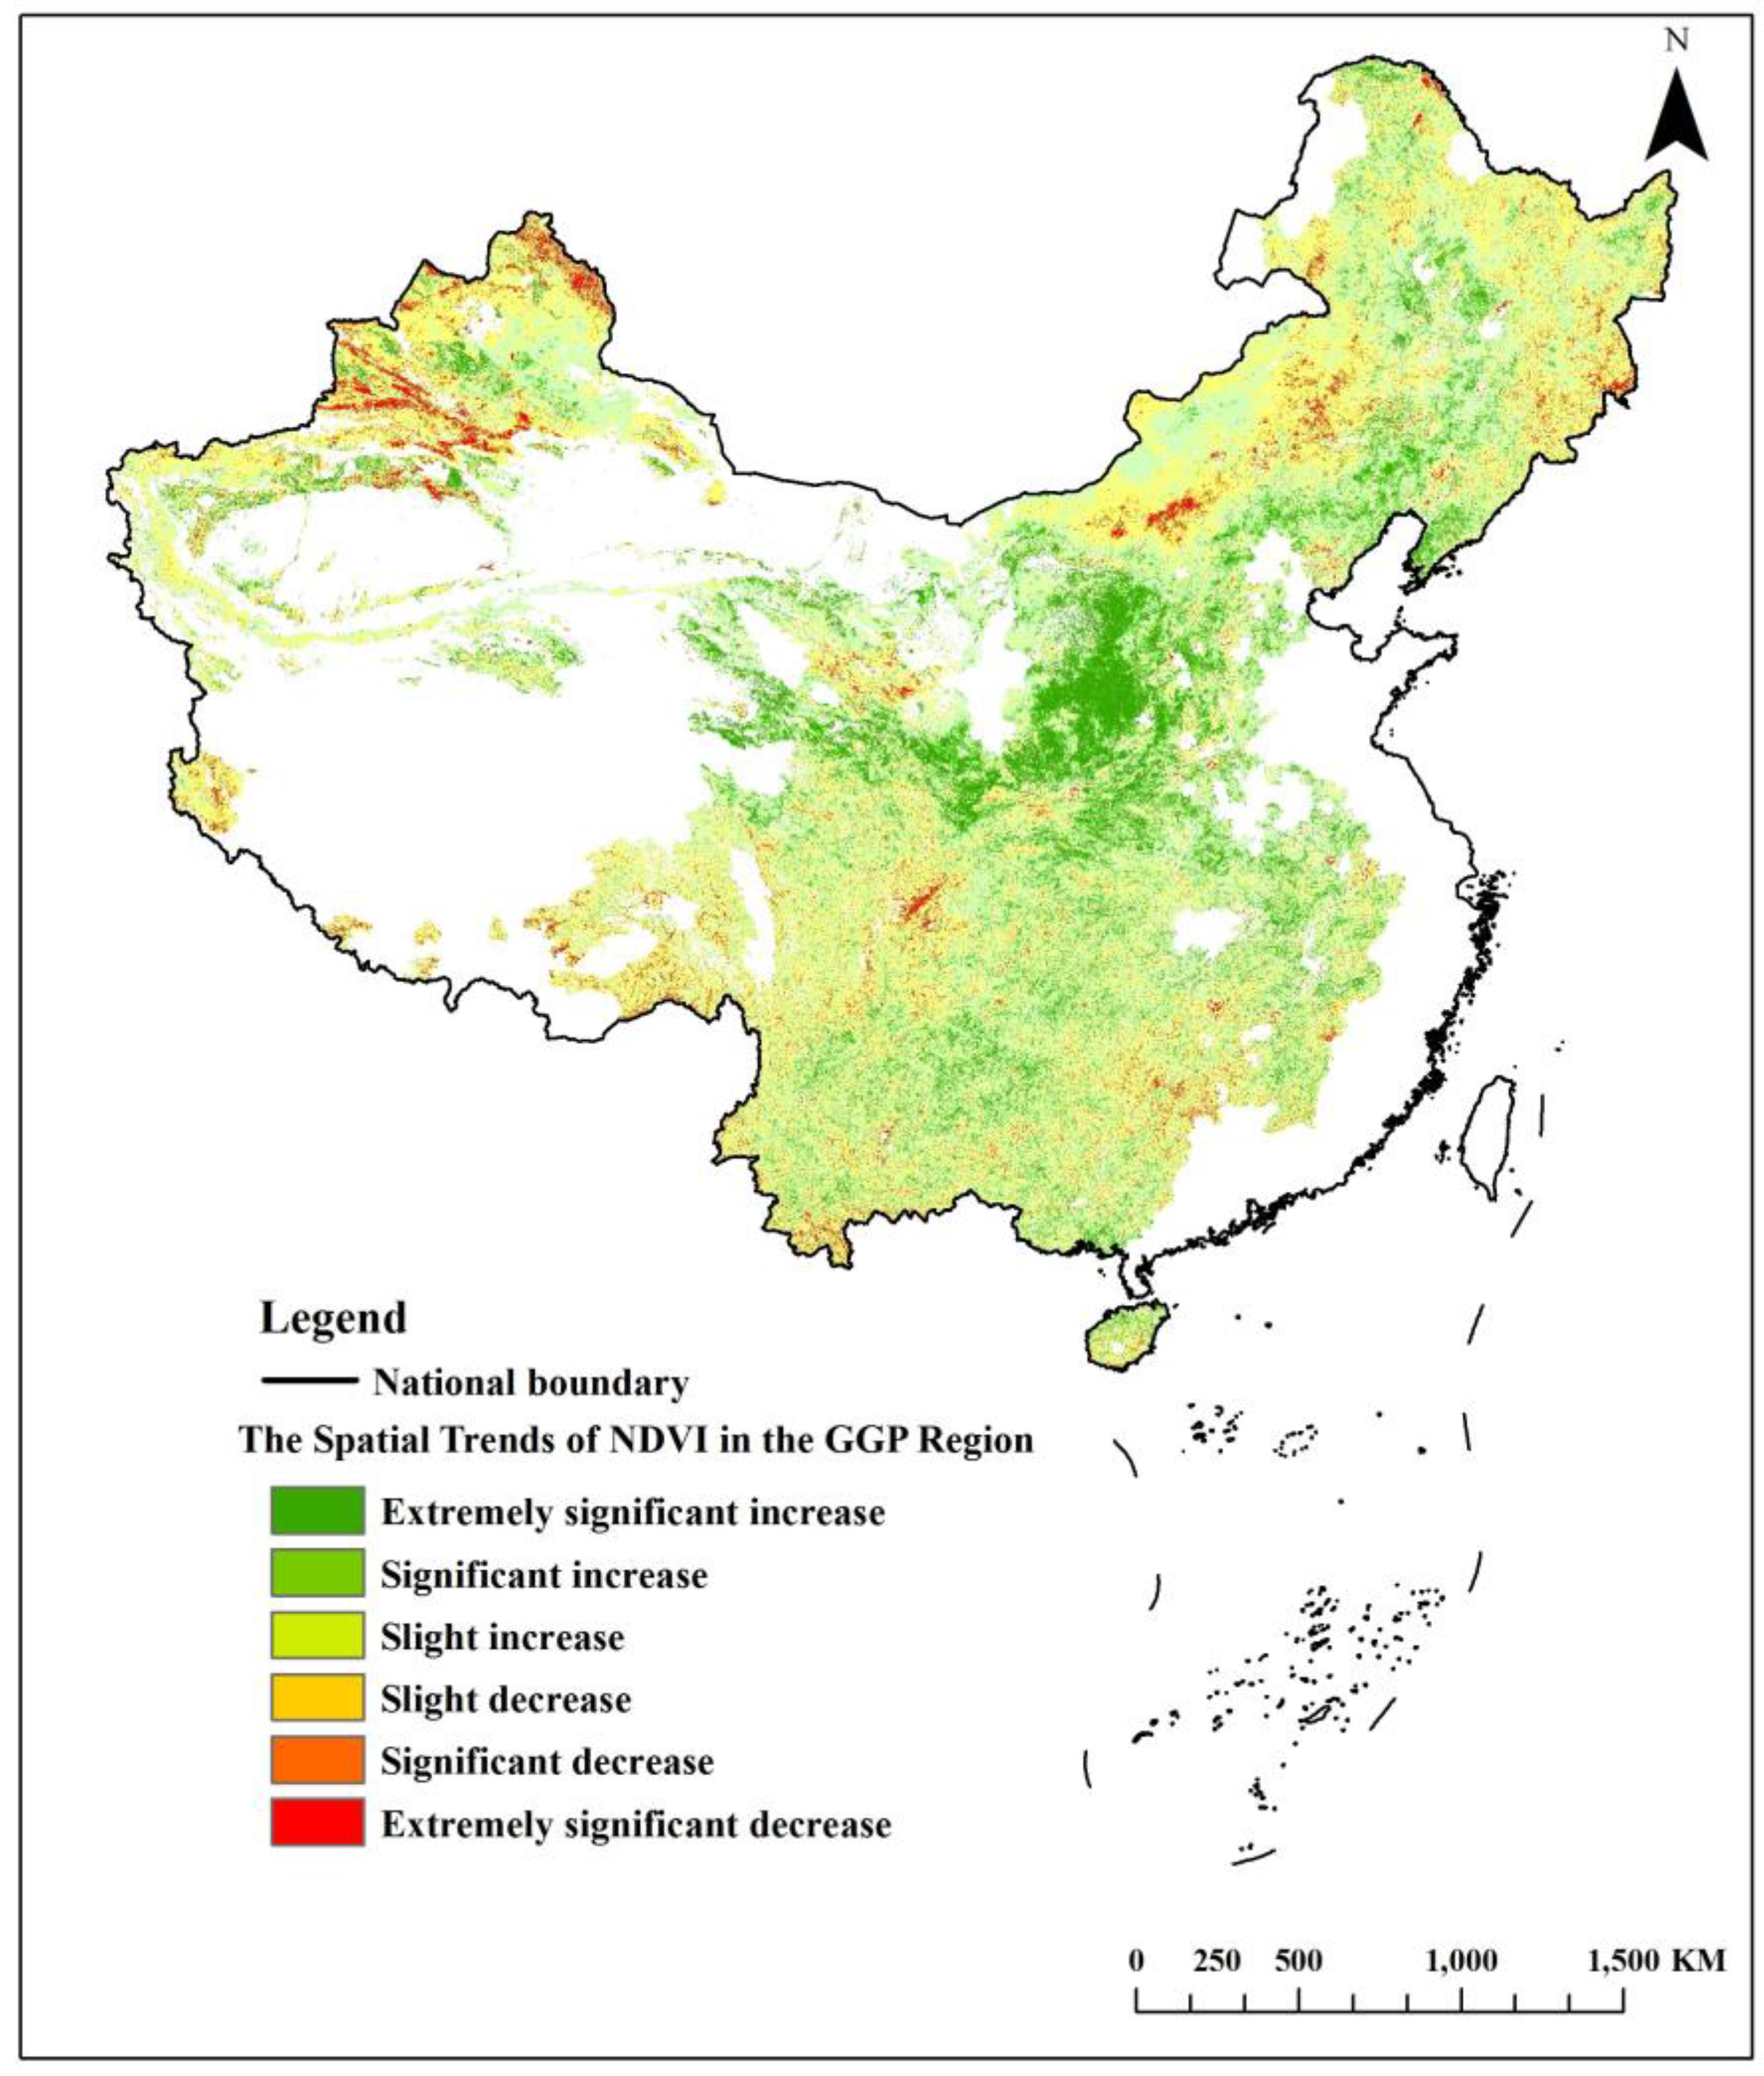
3.1. Spatio-Temporal Vegetation Patterns
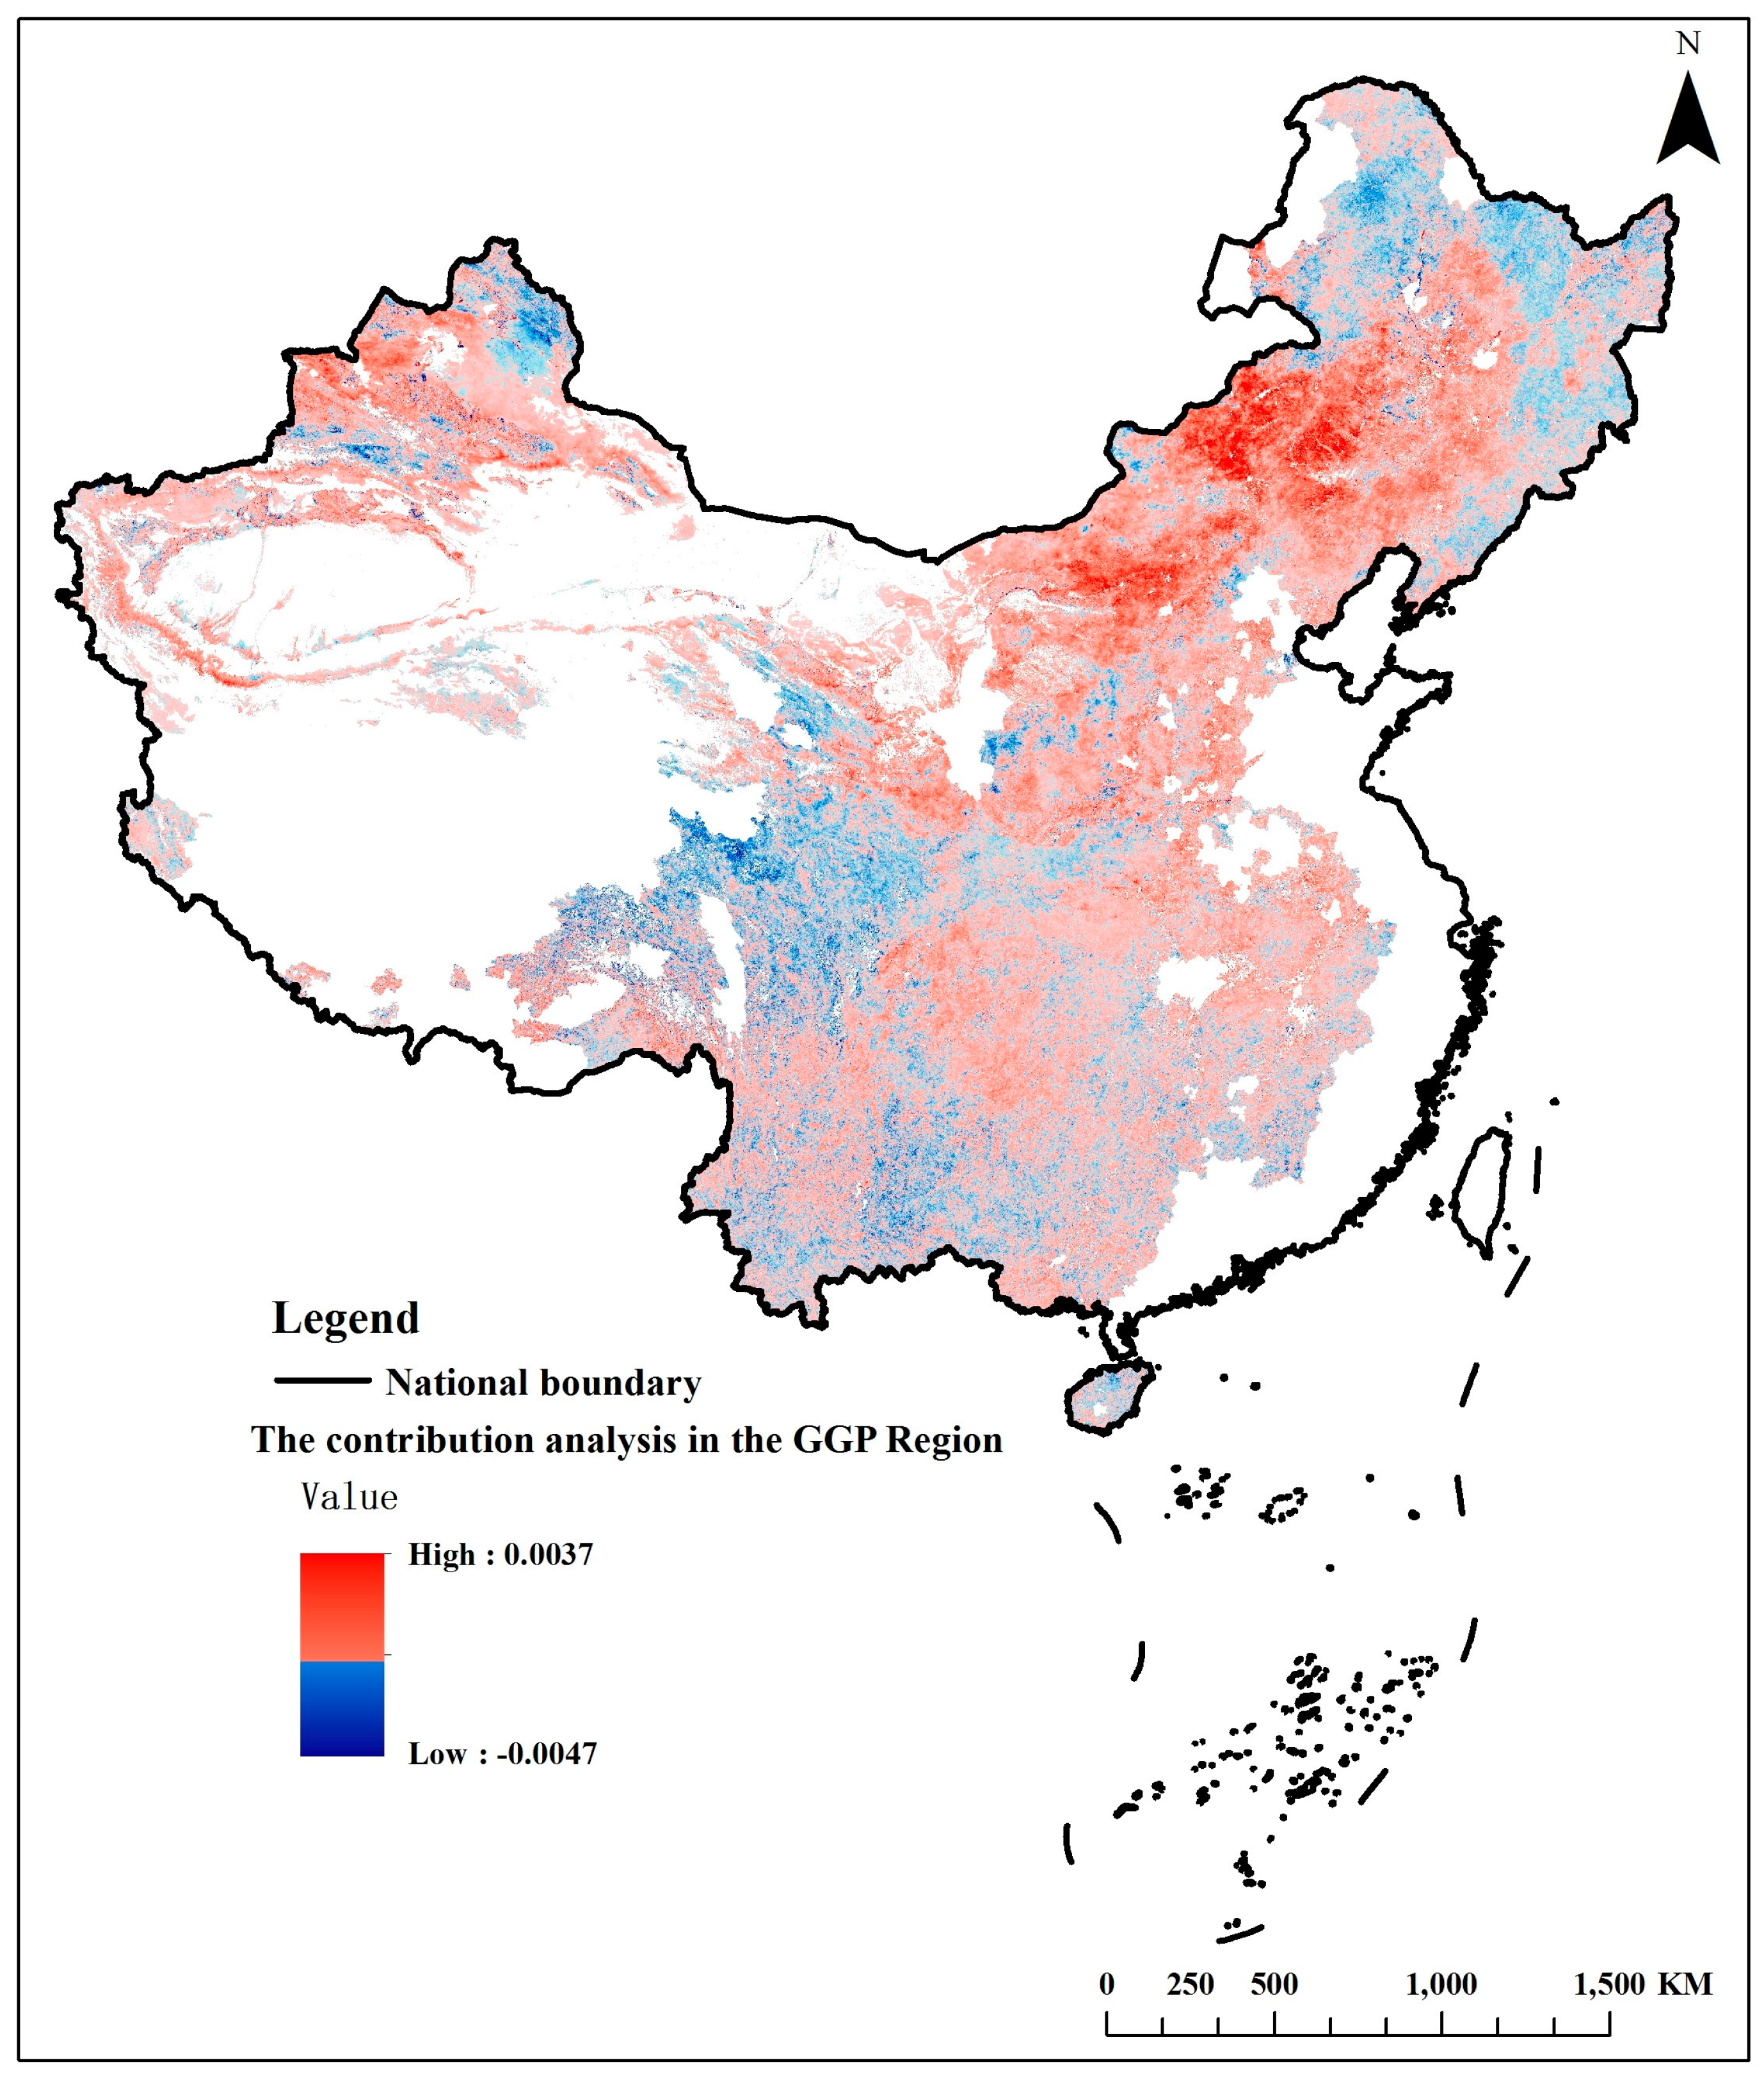
3.2. Effects of Climate Change and Human Activity on Vegetation
3.3. Vegetation Variation Affected by Human Activity
3.3.1. Land Use Change
3.3.2. Contribution of Different Land Use and Land Use Change Types to the NDVI Interannual Variations
4. Discussion
4.1. Methodology
4.2. Driving Forces
5. Conclusions
Acknowledgments
Author Contributions
Conflicts of Interest
References
- Xu, J.T.; Yin, R.S.; Li, Z.; Liu, C. China’s ecological rehabilitation: Unprecedented efforts, dramatic impacts, and requisite policies. Ecol. Econ. 2006, 57, 595–607. [Google Scholar] [CrossRef]
- Liu, J.G.; Diamond, J. China’s environment in a globalizing world. Nature 2005, 435, 1179–1186. [Google Scholar] [CrossRef] [PubMed]
- Lu, Y.H.; Zhang, L.W.; Feng, X.M.; Zeng, Y.; Fu, B.J.; Yao, X.L.; Li, J.R.; Wu, B.F. Recent ecological transitions in China: greening, browning, and influential factors. Sci. Rep. 2015, 5, 8732. [Google Scholar] [CrossRef] [PubMed]
- Yin, R.S.; Yin, G.P. China’s primary programs of terrestrial ecosystem restoration: Initiation, implementation, and challenges. Environ. Manag. 2010, 45, 429–441. [Google Scholar] [CrossRef] [PubMed]
- Wu, J.J.; Zhao, L.; Zheng, Y.T.; Lu, A. Regional differences in the relationship between climatic factors, vegetation, land surface conditions, and dust weather in China’s Beijing-Tianjin Sand Source Region. Nat. Hazards 2011, 62, 31–44. [Google Scholar] [CrossRef]
- Lu, Y.H.; Fu, B.J.; Feng, X.M.; Zeng, Y.; Chang, R.Y.; Sun, G.; Wu, B.F. A policy-driven large scale ecological restoration: Quantifying ecosystem services changes in the Loess Plateau of China. PLoS ONE 2012, 7, e31782. [Google Scholar] [CrossRef]
- Piao, S.L.; Fang, J.Y.; Zhou, L.M.; Guo, Q.H.; Henderson, M.; Ji, W.; Li, Y.; Tao, S. Interannual variations of monthly and seasonal Normalized Difference Vegetation Index (NDVI) in China from 1982 to 1999. J. Geophys. Res. 2003, 108, 4401. [Google Scholar] [CrossRef]
- Peng, S.S.; Chen, A.P.; Xu, L.; Cao, C.X.; Fang, J.Y.; Mayneni, R.B.; Pinzon, J.E.; Tucher, C.J.; Piao, S.L. Recent change of vegetation growth trend in China. Environ. Res. Lett. 2011, 6, 044027. [Google Scholar] [CrossRef]
- Chen, X.D.; Lupi, F.; He, G.M.; Quyang, Z.Y.; Liu, J.G. Factors affecting land reconversion plans following a payment for ecosystem service program. Biol. Conserv. 2009, 142, 1740–1747. [Google Scholar] [CrossRef]
- Li, Y.C. Grain for Green program is a great concrete action towards the ecological civilization in China: Summary of a decade program implementation. For. Constr. 2009, 27, 3–13. (In Chinese) [Google Scholar]
- Feng, X.M.; Fu, B.J.; Lu, N.; Zeng, Y.; Wu, B.F. How ecological restoration alters ecosystem services: An analysis of carbon sequestration in China’s Loess Plateau. Sci. Rep. 2013, 3, 2846. [Google Scholar] [CrossRef] [PubMed]
- Deng, L.; Liu, G.B.; Shangguan, Z.P. Land-use conversion and changing soil carbon stocks in China’s ‘Grain-for-Green’ Program: A synthesis. Glob. Chang. Biol. 2014, 20, 3544–3556. [Google Scholar] [CrossRef] [PubMed]
- Deng, L.; Shangguan, Z.P.; Sweeney, S. “Grain for Green” driven land use change and carbon sequestration on the Loess Plateau, China. Sci. Rep. 2014, 4, 7039. [Google Scholar] [CrossRef] [PubMed]
- Wang, Y.F.; Cao, S.X. Carbon sequestration may have negative impacts on ecosystem health. Environ. Sci. Technol. 2011, 45, 1759–1760. [Google Scholar] [CrossRef] [PubMed]
- Wu, Z.T.; Wu, J.J.; He, B.; Liu, G.H.; Wang, Q.F.; Zhang, H.; Liu, Y. Drought offset ecological restoration program-induced increase in vegetation activity in the Beijing-Tianjin Sand Source Region, China. Environ. Sci. Technol. 2014, 48, 12108–12117. [Google Scholar] [CrossRef] [PubMed]
- Wang, X.M.; Zhang, C.X.; Hasi, E.; Dong, Z.B. Has the Three Norths Forest Shelterbelt Program solved the desertification and dust storm problems in arid and semiarid China? J. Arid Environ. 2010, 74, 13–22. [Google Scholar] [CrossRef]
- Cao, S.X. Why Large-Scale Afforestation Efforts in China Have Failed To Solve the Desertification Problem. Environ. Sci. Technol. 2008, 42, 1826–1831. [Google Scholar] [CrossRef] [PubMed]
- Piao, S.L.; Fang, J.Y.; Ji, W.; Guo, Q.H.; Ke, J.H.; Tao, S. Variation in a satellite-based vegetation index in relation to climate in China. J. Veg. Sci. 2004, 15, 219–226. [Google Scholar] [CrossRef]
- Parmesan, C.; Yohe, G. A globally coherent fingerprint of climate change impacts across natural systems. Nature 2003, 421, 37–42. [Google Scholar] [CrossRef] [PubMed]
- Yao, J.Q.; Yang, Q.; Chen, Y.N. Climate change in arid areas of Northwest China in past 50 years and its effects on the local ecological environment. Chin. J. Ecol. 2013, 32, 1283–1291. [Google Scholar]
- Wang, J.; Wang, K.L.; Zhang, M.Y.; Zhang, C. Impacts of climate change and human activities on vegetation cover in hilly southern China. Ecol. Eng. 2015, 81, 451–461. [Google Scholar] [CrossRef]
- Wang, H.; Liu, G.H.; Li, Z.S.; Xin, Y.; Wang, M.; Gong, L. Driving force and changing trends of vegetation phenology in the Loess Plateau of China from 2000 to 2010. J. Mt. Sci. 2016, 13, 844–856. [Google Scholar] [CrossRef]
- Chen, B.; Zhang, X.; Tao, J.; Wu, J.S.; Wang, J.S.; Shi, P.L.; Zhang, Y.J.; Yu, C. Q. The impact of climate change and anthropogenic activities on alpine grassland over the Qinghai-Tibet Plateau. Agric. For. Meteorol. 2014, 189–190, 11–18. [Google Scholar] [CrossRef]
- Li, A.; Wu, J.; Huang, J. Distinguishing between human-induced and climate-driven vegetation changes: A critical application of RESTREND in inner Mongolia. Landsc. Ecol. 2012, 27, 969–982. [Google Scholar] [CrossRef]
- Nowacki, G.J.; Abrams, M.D. Is climate an important driver of post-European vegetation change in the Eastern United States? Glob. Chang. Biol. 2015, 21, 314–334. [Google Scholar] [CrossRef] [PubMed]
- Ma, E.; Deng, X.; Zhang, Q.; Liu, A. Spatial Variation of Surface Energy Fluxes Due to Land Use Changes across China. Energies 2014, 7, 2194–2206. [Google Scholar] [CrossRef]
- Liu, Y.; Wang, Y.; Peng, J.; Du, Y.Y.; Liu, X.F.; Li, S.S.; Zhang, D.H. Correlations between Urbanization and Vegetation Degradation across the World’s Metropolises Using DMSP/OLS Nighttime Light Data. Remote Sens. 2015, 7, 2067–2088. [Google Scholar] [CrossRef]
- Zhang, B.Q.; Wu, P.T.; Zhao, X.N.; Wang, Y.; Gao, X. Changes in vegetation condition in areas with different gradients (1980–2010) on the Loess Plateau, China. Environ. Earth Sci. 2012, 68, 2427–2438. [Google Scholar] [CrossRef]
- Zhang, J.; Wang, T.M.; Ge, J. Assessing Vegetation Cover Dynamics Induced by Policy-Driven Ecological Restoration and Implication to Soil Erosion in Southern China. PLoS ONE 2015, 10, e0131352. [Google Scholar] [CrossRef] [PubMed]
- Wang, J.; Meng, J.J.; Cai, Y.L. Assessing vegetation dynamics impacted by climate change in the southwestern karst region of China with AVHRR NDVI and AVHRR NPP time-series. Environ. Geol. 2008, 54, 1185–1195. [Google Scholar] [CrossRef]
- Wang, J.; Wang, K.L.; Zhang, M.Y.; Duan, Y.F. Temporal-Spatial Variation in NDVI and Drivers in Hilly Terrain of Southern China. Resour. Sci. 2014, 36, 1712–1723. (In Chinese) [Google Scholar]
- Ostwald, M.; Simelton, E.; Chen, D.; Liu, A. Relation between vegetation changes, climate variables and land-use policy in Shaanxi province, China. Geogr. Ann. Ser. A Phys. Geogr. 2007, 89A, 223–236. [Google Scholar] [CrossRef]
- Emi, U.; Xu, J.T.; Scott, R. Grain for Green: Cost-Effectiveness and Sustainability of China’s Conservation Set-Aside Program. Land Econ. 2005, 81, 247–264. [Google Scholar] [CrossRef]
- Liu, J.G.; Li, S.X.; Ouyang, Z.Y.; Tam, C.; Chen, X.D. Ecological and socioeconomic effects of China’s policies for ecosystem services. Proc. Natl. Acad. Sci. USA 2008, 105, 9477–9482. [Google Scholar] [CrossRef] [PubMed]
- Song, X.Z.; Peng, C.H.; Zhou, G.M.; Jiang, H.; Wang, W.F. Chinese Grain for Green Program led to highly increased soil organic carbon levels: A meta-analysis. Sci. Rep. 2014, 4, 4460. [Google Scholar] [CrossRef] [PubMed]
- Shangguan, Z.P.; Deng, L. Food security and farmers’ income: Impacts of the grain for green programme on rural households in China. J. Food Agric. Environ. 2011, 9, 826–831. [Google Scholar]
- Slayback, D.A.; Pinzon, J.E.; Los, S.O.; Tucker, C.J. Northern hemisphere photosynthetic trends 1982–1999. Glob. Chang. Biol. 2003, 9, 1–15. [Google Scholar] [CrossRef]
- Wang, X.H.; Piao, S.L.; Ciais, P.; Li, G.S.; Friedlingstein, P.; Koven, C.; Chen, A. Spring temperature change and its implication in the change of vegetation growth in North America from 1982 to 2006. Proc. Natl. Acad. Sci. USA 2011, 108, 1240–1245. [Google Scholar] [CrossRef] [PubMed]
- Wang, H.; Liu, G.H.; Li, Z.S.; Xin, Y.; Wang, M.; Gong, L. Impacts of climate change on net primary productivity in arid and semiarid regions of China. Chin. Geogr. Sci. 2015, 26, 35–47. [Google Scholar] [CrossRef]
- Gang, C.C.; Zhou, W.; Chen, Y.Z.; Wang, Z.Q.; Sun, Z.G.; Li, J.L.; Qi, J.G.; Odeh, I. Quantitative assessment of the contributions of climate change and human activities on global grassland degradation. Environ. Earth Sci. 2014, 72, 4273–4282. [Google Scholar] [CrossRef]
- Yang, Y.; Wang, Z.Q.; Li, J.L.; Gang, C.C.; Zhang, Y.Z.; Zhang, Y.; Odeh, I.; Qi, J.G. Comparative assessment of grassland degradation dynamics inresponse to climate variation and human activities in China, Mongolia, Pakistan and Uzbekistan from 2000 to 2013. J. Arid Environ. 2016, 135, 164–172. [Google Scholar] [CrossRef]
- Evans, J.; Geerken, R. Discrimination between climate and human-induced dryland degradation. J. Arid Environ. 2004, 57, 535–554. [Google Scholar] [CrossRef]
- Wessels, K.J.; Prince, S.D.; Malherbe, J.; Small, J.; Frost, P.E.; VanZyl, D. Can human-induced land degradation be distinguished from the effects of rainfall variability? A case study in South Africa. J. Arid Environ. 2007, 68, 271–297. [Google Scholar] [CrossRef]
- Zhang, C.X.; Wang, X.; Li, J.C.; Hua, T. Roles of climate changes and human interventions in land degradation: A case study by net primary productivity analysis in China’s Shiyanghe Basin. Environ. Earth Sci. 2011, 64, 2183–2193. [Google Scholar] [CrossRef]
- Zhou, W.; Li, J.L.; Mu, S.J.; Gang, C.C.; Sun, Z.G. Effects of ecological restoration-induced land-use change and improved management on grassland net primary productivity in the Shiyanghe River Basin, north-west China. Grass Forage Sci. 2013, 69, 596–610. [Google Scholar] [CrossRef]
- Xu, D.Y.; Kang, K.X.; Zhuang, D.F.; Pan, J.J. Multi-scale quantitative assessment of the relative roles of climate change and human activities in desertification: A case study of the Ordos Plateau, China. J. Arid Environ. 2010, 74, 498–507. [Google Scholar] [CrossRef]
- Zhou, W.; Gang, C.; Zhou, L.; Chen, Y.Z.; Li, J.L.; Ju, W.M.; Odeh, I. Dynamic of grassland vegetation degradation and its quantitative assessment in the northwest China. Acta Oecol. 2014, 55, 86–89. [Google Scholar] [CrossRef]
- Ahlstrom, A.; Raupach, M.R.; Schurgers, G.; Smith, B.; Arneth, A.; Jung, M.; Reichstein, M.; Canadell, J.G.; Friedlingstein, P.; Jain, A.K. The dominant role of semi-arid ecosystems in the trend and variability of the land CO2 sink. Science 2015, 348, 8958–8999. [Google Scholar] [CrossRef] [PubMed]
- Zhou, W.; Gang, C.C.; Zhou, F.C.; Li, J.L.; Dong, X.G.; Zhao, C.Z. Quantitative assessment of the individual contribution of climate and human factors to desertification in northwest China using net primary productivity as an indicator. Ecol. Indic. 2015, 48, 560–569. [Google Scholar] [CrossRef]
- Ma, Y.H.; Fan, S.Y.; Zhou, L.H.; Dong, Z.Y.; Zhang, K.; Feng, J.M. The temporal change of driving factors during the course of land desertification in arid region of North China: The case of Minqin County. Environ. Geol. 2007, 51, 999–1008. [Google Scholar] [CrossRef]
- Millington, J.D.A.; Perry, G.L.W.; Romero-Calcerrada, R. Regression techniques for examining land use/cover change: A case study of a Mediterranean landscape. Ecosystems 2007, 10, 562–578. [Google Scholar] [CrossRef]
- Wrbka, T.; Erb, K.; Schulz, N.B.; Peterseil, J.; Hahn, C.; Haberl, H. Linking pattern and process in cultural landscapes. An empirical study based on spatially explicit indicators. Land Use Policy 2004, 21, 289–306. [Google Scholar] [CrossRef]
- Cai, H.Y.; Yang, X.H.; Wang, K.J.; Xiao, L.L. Is Forest Restoration in the Southwest China Karst Promoted Mainly by Climate Change or Human-Induced Factors? Remote Sens. 2014, 6, 9895–9910. [Google Scholar] [CrossRef]
- Wang, Y.; Tan, Y.G.; Bureau, Z.M. Research on the Variation of Vegetation NDVI and Its Relationship with Climate Factors in Northern China. J. Shanxi Afric. Sci. 2014, 42, 890–895. (In Chinese) [Google Scholar]
- Chang, R.Y.; Fu, B.J.; Liu, G.H.; Liu, S.G. Soil carbon sequestration potential for “Grain for Green” project in Loess Plateau, China. Environ. Manag. 2011, 48, 1158–1172. [Google Scholar] [CrossRef] [PubMed]
- Piao, S.L.; Yin, G.D.; Tan, J.G.; Cheng, L.; Huang, M.T.; Li, Y.; Liu, R.G.; Mao, J.F.; Myneni, R.B.; Peng, S.S.; et al. Detection and attribution of vegetation greening trend in China over the last 30 years. Glob. Chang. Biol. 2015, 21, 1601–1609. [Google Scholar] [CrossRef] [PubMed]
- Yi, L.; Ren, Z.Y.; Zhang, C.; Liu, W. Vegetation cover, climate and human activities on the loess plateau. Resour. Sci. 2014, 36, 0166–0174. (In Chinese) [Google Scholar]
- Cao, X.; Gu, Z.H.; Chen, J.; Liu, J.; Shi, P.J. Analysis of human_induced steppe degradation based on remote sensing in xilin gole, inner mongolia, China. J. Plant Ecol. 2006, 30, 268–277. (In Chinese) [Google Scholar]
- Wang, Q.; Zhang, B.; Dai, S.P.; Zhang, F.F.; Zhao, Y.F.; Yin, H.X.; He, X.Q. Analysis of the vegetation cover chang and its relationship with factors in the Three-North Shelter Forest Program. China Environ. Sci. 2012, 32, 1302–1308. (In Chinese) [Google Scholar]
- Zheng, Y.R.; Xie, Z.X.; Robert, C.; Jiang, L.H.; Shimizu, H. Did climate drive ecosystem change and induce desertification in Otindag sandy land, China over the past 40 years? J. Arid Environ. 2006, 64, 523–541. [Google Scholar] [CrossRef]
- Wang, X.; Zhao, X.L.; Zhang, Z.X.; Yi, L.; Zuo, L.J.; Wen, Q.K.; Liu, F.; Xu, J.Y.; Hu, S.G.; Liu, B. Assessment of soil erosion change and its relationships with land use/cover change in China from the end of the 1980s to 2010. Catena 2016, 137, 256–268. [Google Scholar] [CrossRef]
- Herrmann, S.M.; Anyamba, A.; Tucker, C.J. Recent trends in vegetation dynamics in the African Sahel and their relationship to climate. Glob. Environ. Chang. 2005, 15, 394–404. [Google Scholar] [CrossRef]
- Shi, Y.; Shen, Y.; Kang, E.; Li, D.L.; Ding, Y.J.; Zhang, G.W.; Hu, R.J. Recent and Future Climate Change in Northwest China. Clim. Chang. 2006, 80, 379–393. [Google Scholar] [CrossRef]
- Zhai, P.M.; Zhuang, X.B.; Wan, H.; Pan, X. Trends in Total Precipitation and Frequency of Daily Precipitation Extremes over China. J. Clim. 2005, 18, 1096–1108. [Google Scholar] [CrossRef]
- Mabutt, J.A. Impacts of carbon dioxide warming on climate and man in the semi-arid tropics. Clim. Chang. 1989, 15, 191–221. [Google Scholar] [CrossRef]
- Nan, C.; Piao, S.L.; Chen, A.P.; Wang, X.H.; Lin, X.; Chen, S.P.; Han, S.J.; Zhou, G.S.; Zhang, X.P. Spring vegetation green-up date in China inferred from SPOT NDVI data: A multiple model analysis. Agric. For. Meteorol. 2012, 165, 104–113. [Google Scholar] [CrossRef]
- Pimentel, D.; Pimentel, M. Global environmental resources versus world population growth. Ecol. Econ. 2006, 59, 195–198. [Google Scholar] [CrossRef]
- Dewan, A.M.; Yamaguchi, Y. Land use and land cover change in Greater Dhaka, Bangladesh: Using remote sensing to promote sustainable urbanization. Appl. Geogr. 2009, 29, 390–401. [Google Scholar] [CrossRef]
- Luck, G.W.; Smallbone, L.T.; O’Brien, R. Socio-Economics and Vegetation Change in Urban Ecosystems: Patterns in Space and Time. Ecosystems 2009, 12, 604–620. [Google Scholar] [CrossRef]
- Deng, L.; Shangguan, Z.P.; Li, R. Effects of the grain-for-green program on soil erosion in China. Int. J. Sediment. Res. 2012, 27, 120–127. [Google Scholar] [CrossRef]
- Xiao, J.F. Satellite evidence for significant biophysical consequences of the “Grain for Green” Program on the Loess Plateau in China. J. Geophys. Res. 2014, 119, 2261–2275. [Google Scholar] [CrossRef]


| SP | SR | Roles of Climate and Human Factors | |
|---|---|---|---|
| Vegetation growth increased (SA > 0) | |||
| Scenario1 | <0 | >0 | Vegetation restoration attributable largely to human factors |
| Scenario 2 | >0 | <0 | Vegetation restoration attributable largely to climate factors |
| Scenario 3 | >0 | >0 | Vegetation restoration attributable largely to both climate and human factors |
| Vegetation growth decreased (SA < 0) | |||
| Scenario 1 | >0 | <0 | Vegetation degradation attributable largely to human factors |
| Scenario 2 | <0 | >0 | Vegetation degradation attributable largely to climate factors |
| Scenario 3 | <0 | <0 | Vegetation degradation attributable largely to both climate and human factors |
| Variables | NDVI |
|---|---|
| Increasing (%) | 58.94 |
| Increasing significantly (%) | 16.3 |
| Increasing extremely significantly (%) | 11.22 |
| Decreasing | 41.06 |
| Decreasing significantly (%) | 6.58 |
| Decreasing extremely significantly (%) | 3.91 |
| Land Use Type | Forest | Grassland | Wetland | Farmland | Urban Land | Bare Land | Net Change |
|---|---|---|---|---|---|---|---|
| Forest | 98.97 | 0.25 | 0.01 | 0.51 | 0.13 | 0.12 | 0.77 |
| Grassland | 0.87 | 97.93 | 0.07 | 0.73 | 0.19 | 0.21 | −0.78 |
| Wet land | 0.27 | 1.14 | 93.09 | 3.65 | 0.32 | 1.53 | −1.70 |
| Farmland | 1.45 | 0.93 | 0.10 | 95.93 | 1.30 | 0.29 | −1.72 |
| Urban land | 0.08 | 0.08 | 0.01 | 0.48 | 99.26 | 0.08 | 21.67 |
| Bare land | 0.17 | 0.32 | 0.09 | 0.27 | 0.11 | 99.04 | −0.15 |
| Land Use Types | Contribution Rate to the NDVI Interannual Variations |
|---|---|
| Grassland | 37% |
| Farmland | 31% |
| Forest | 20% |
| Wet land | 1% |
| Land Use Changes | Contribution Rate to the NDVI Interannual Variations |
|---|---|
| Grassland to farmland | 6.27‰ |
| Grassland to forest | 5.86‰ |
| Farmland to grassland | 4.49‰ |
| Forest to farmland | 3.68‰ |
| Farmland to forest | 2.81‰ |
| Bare land to farmland | 1.66‰ |
| Forest to grassland | 1.48‰ |
| Farmland to urban land | 1.23‰ |
| Grassland to urban land | 1.07‰ |
| Bare land to grassland | 1.05‰ |
© 2017 by the authors. Licensee MDPI, Basel, Switzerland. This article is an open access article distributed under the terms and conditions of the Creative Commons Attribution (CC BY) license (http://creativecommons.org/licenses/by/4.0/).
Share and Cite
Wang, H.; Liu, G.; Li, Z.; Ye, X.; Fu, B.; Lü, Y. Analysis of the Driving Forces in Vegetation Variation in the Grain for Green Program Region, China. Sustainability 2017, 9, 1853. https://doi.org/10.3390/su9101853
Wang H, Liu G, Li Z, Ye X, Fu B, Lü Y. Analysis of the Driving Forces in Vegetation Variation in the Grain for Green Program Region, China. Sustainability. 2017; 9(10):1853. https://doi.org/10.3390/su9101853
Chicago/Turabian StyleWang, Hao, Guohua Liu, Zongshan Li, Xin Ye, Bojie Fu, and Yihe Lü. 2017. "Analysis of the Driving Forces in Vegetation Variation in the Grain for Green Program Region, China" Sustainability 9, no. 10: 1853. https://doi.org/10.3390/su9101853
APA StyleWang, H., Liu, G., Li, Z., Ye, X., Fu, B., & Lü, Y. (2017). Analysis of the Driving Forces in Vegetation Variation in the Grain for Green Program Region, China. Sustainability, 9(10), 1853. https://doi.org/10.3390/su9101853