Urban Growth Control DSS Techniques for De-Sprinkling Process in Italy


Abstract
:1. Introduction
- Development plans that favour citizens’ or businesses’ requests. They request to improve the value of their properties, regardless of their location.
- Political trends that tend to maximize consensus by favouring the implementation of the development plan with “direct action”.
- Speculation or necessity unauthorized development.
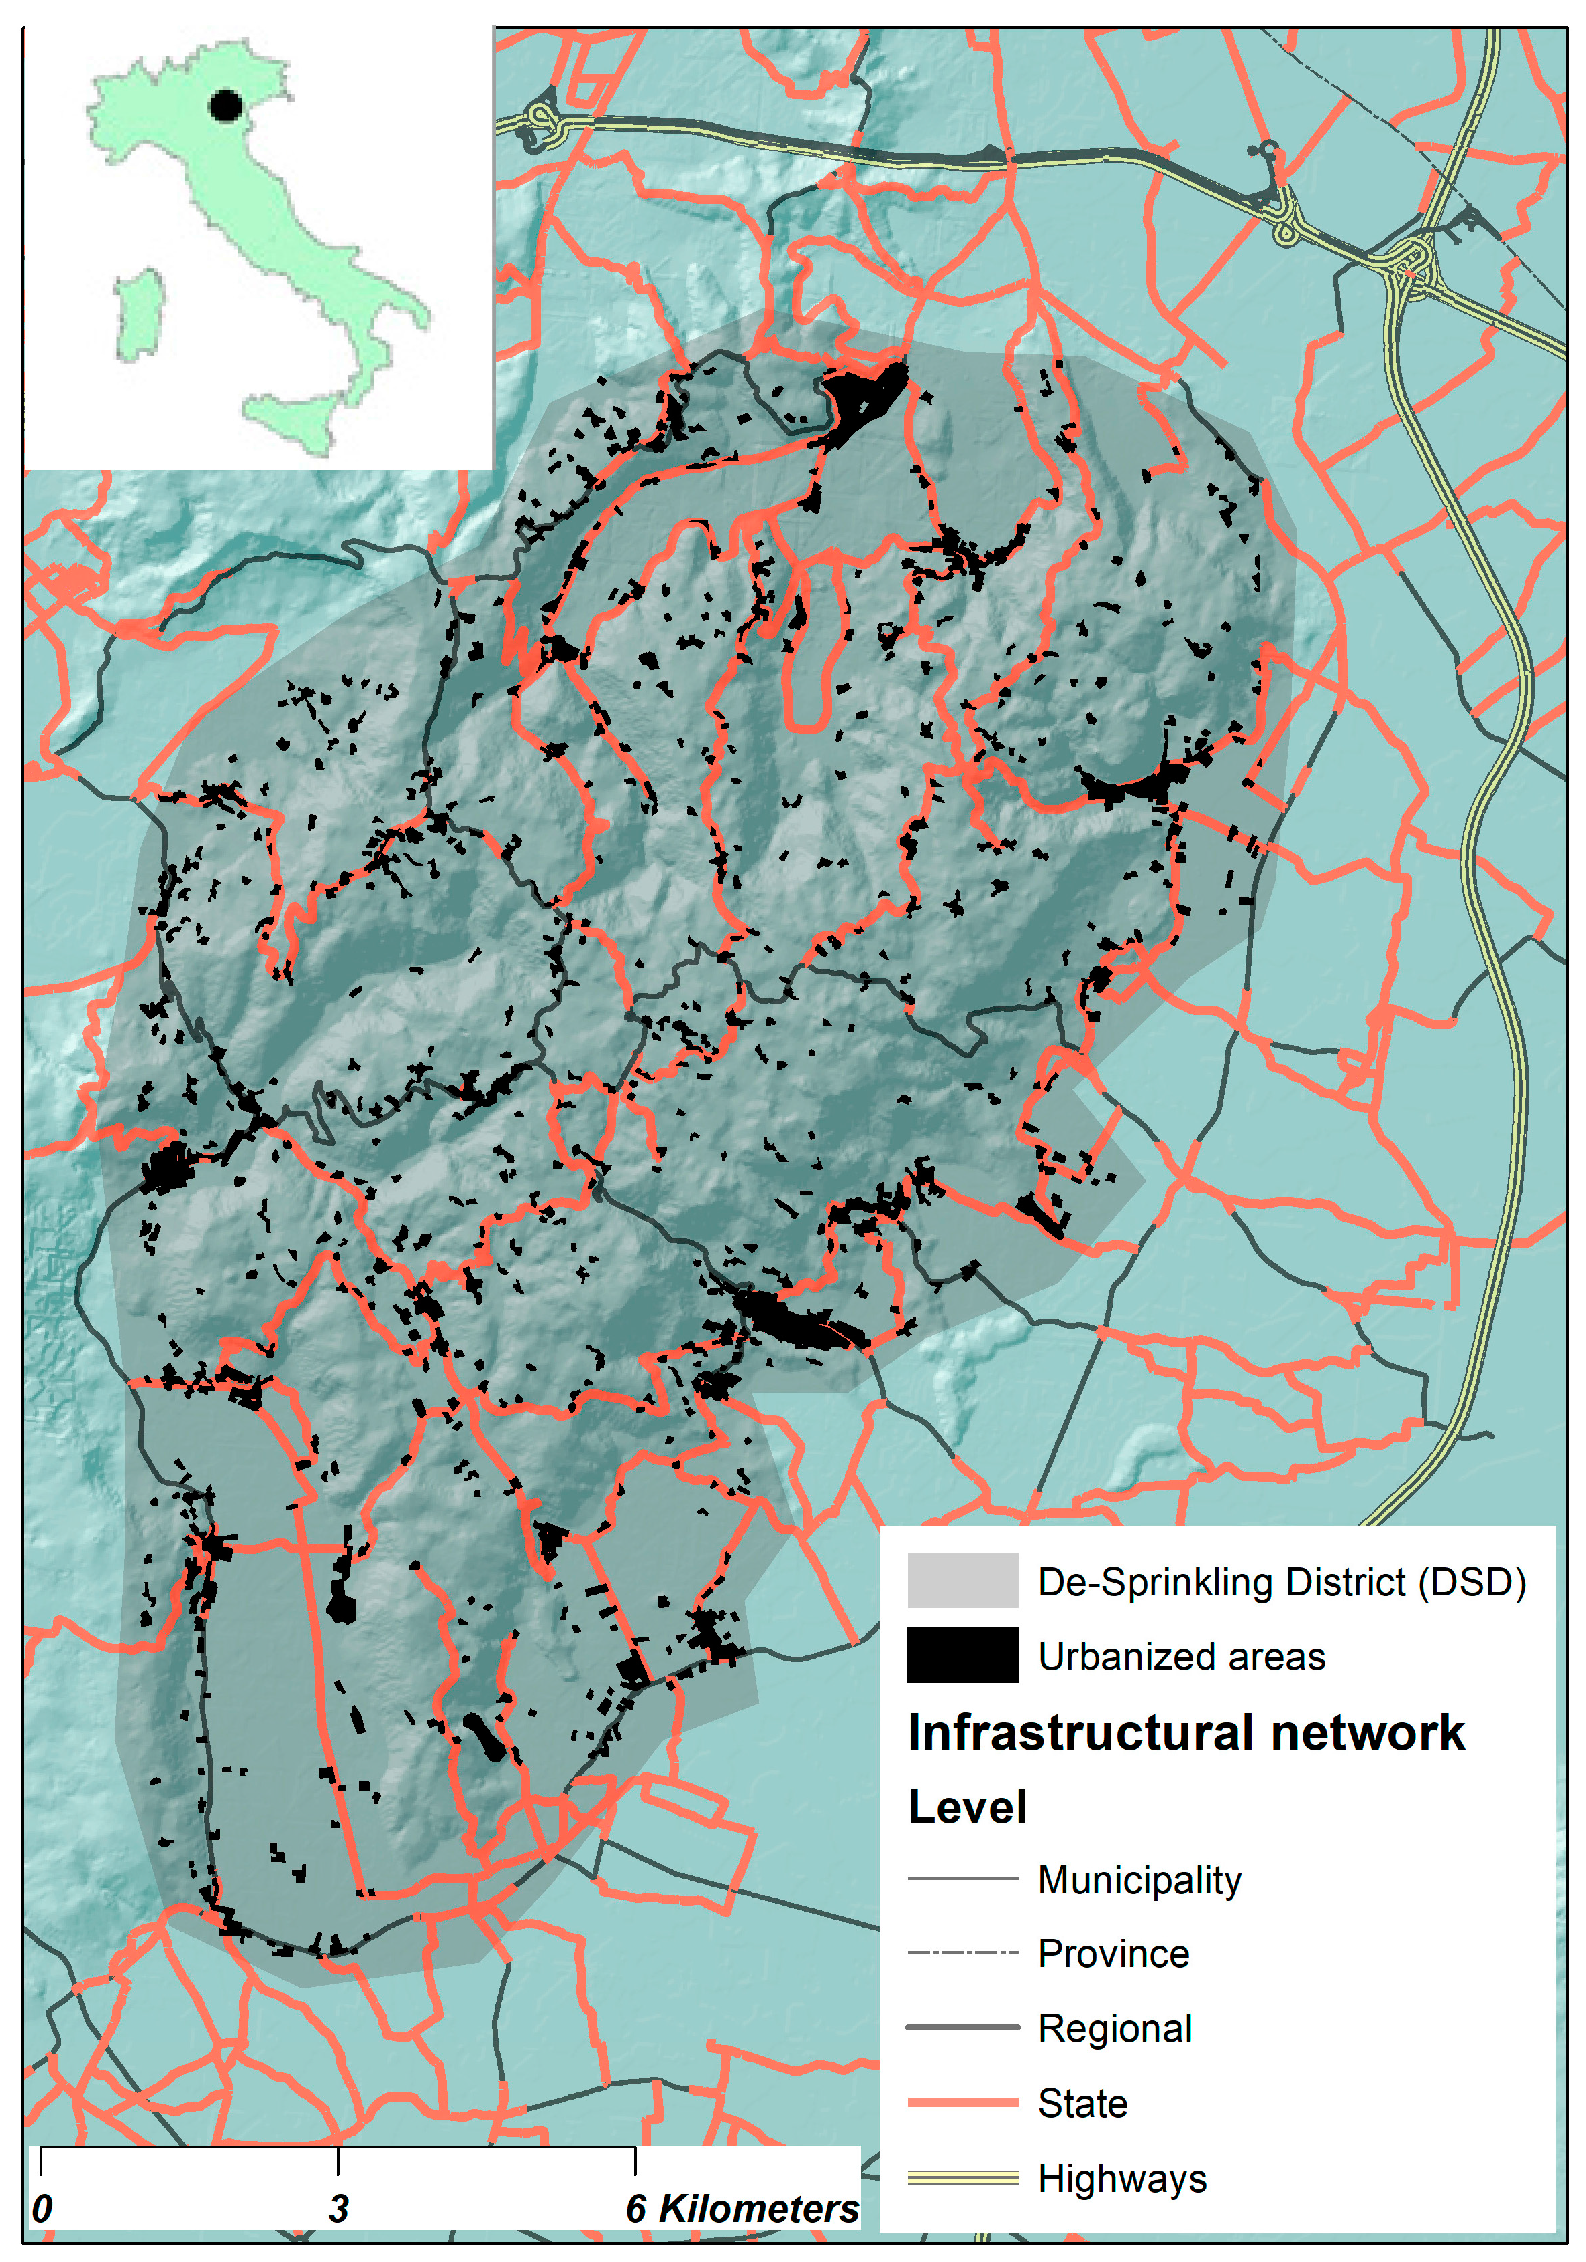
2. Study Area
- -
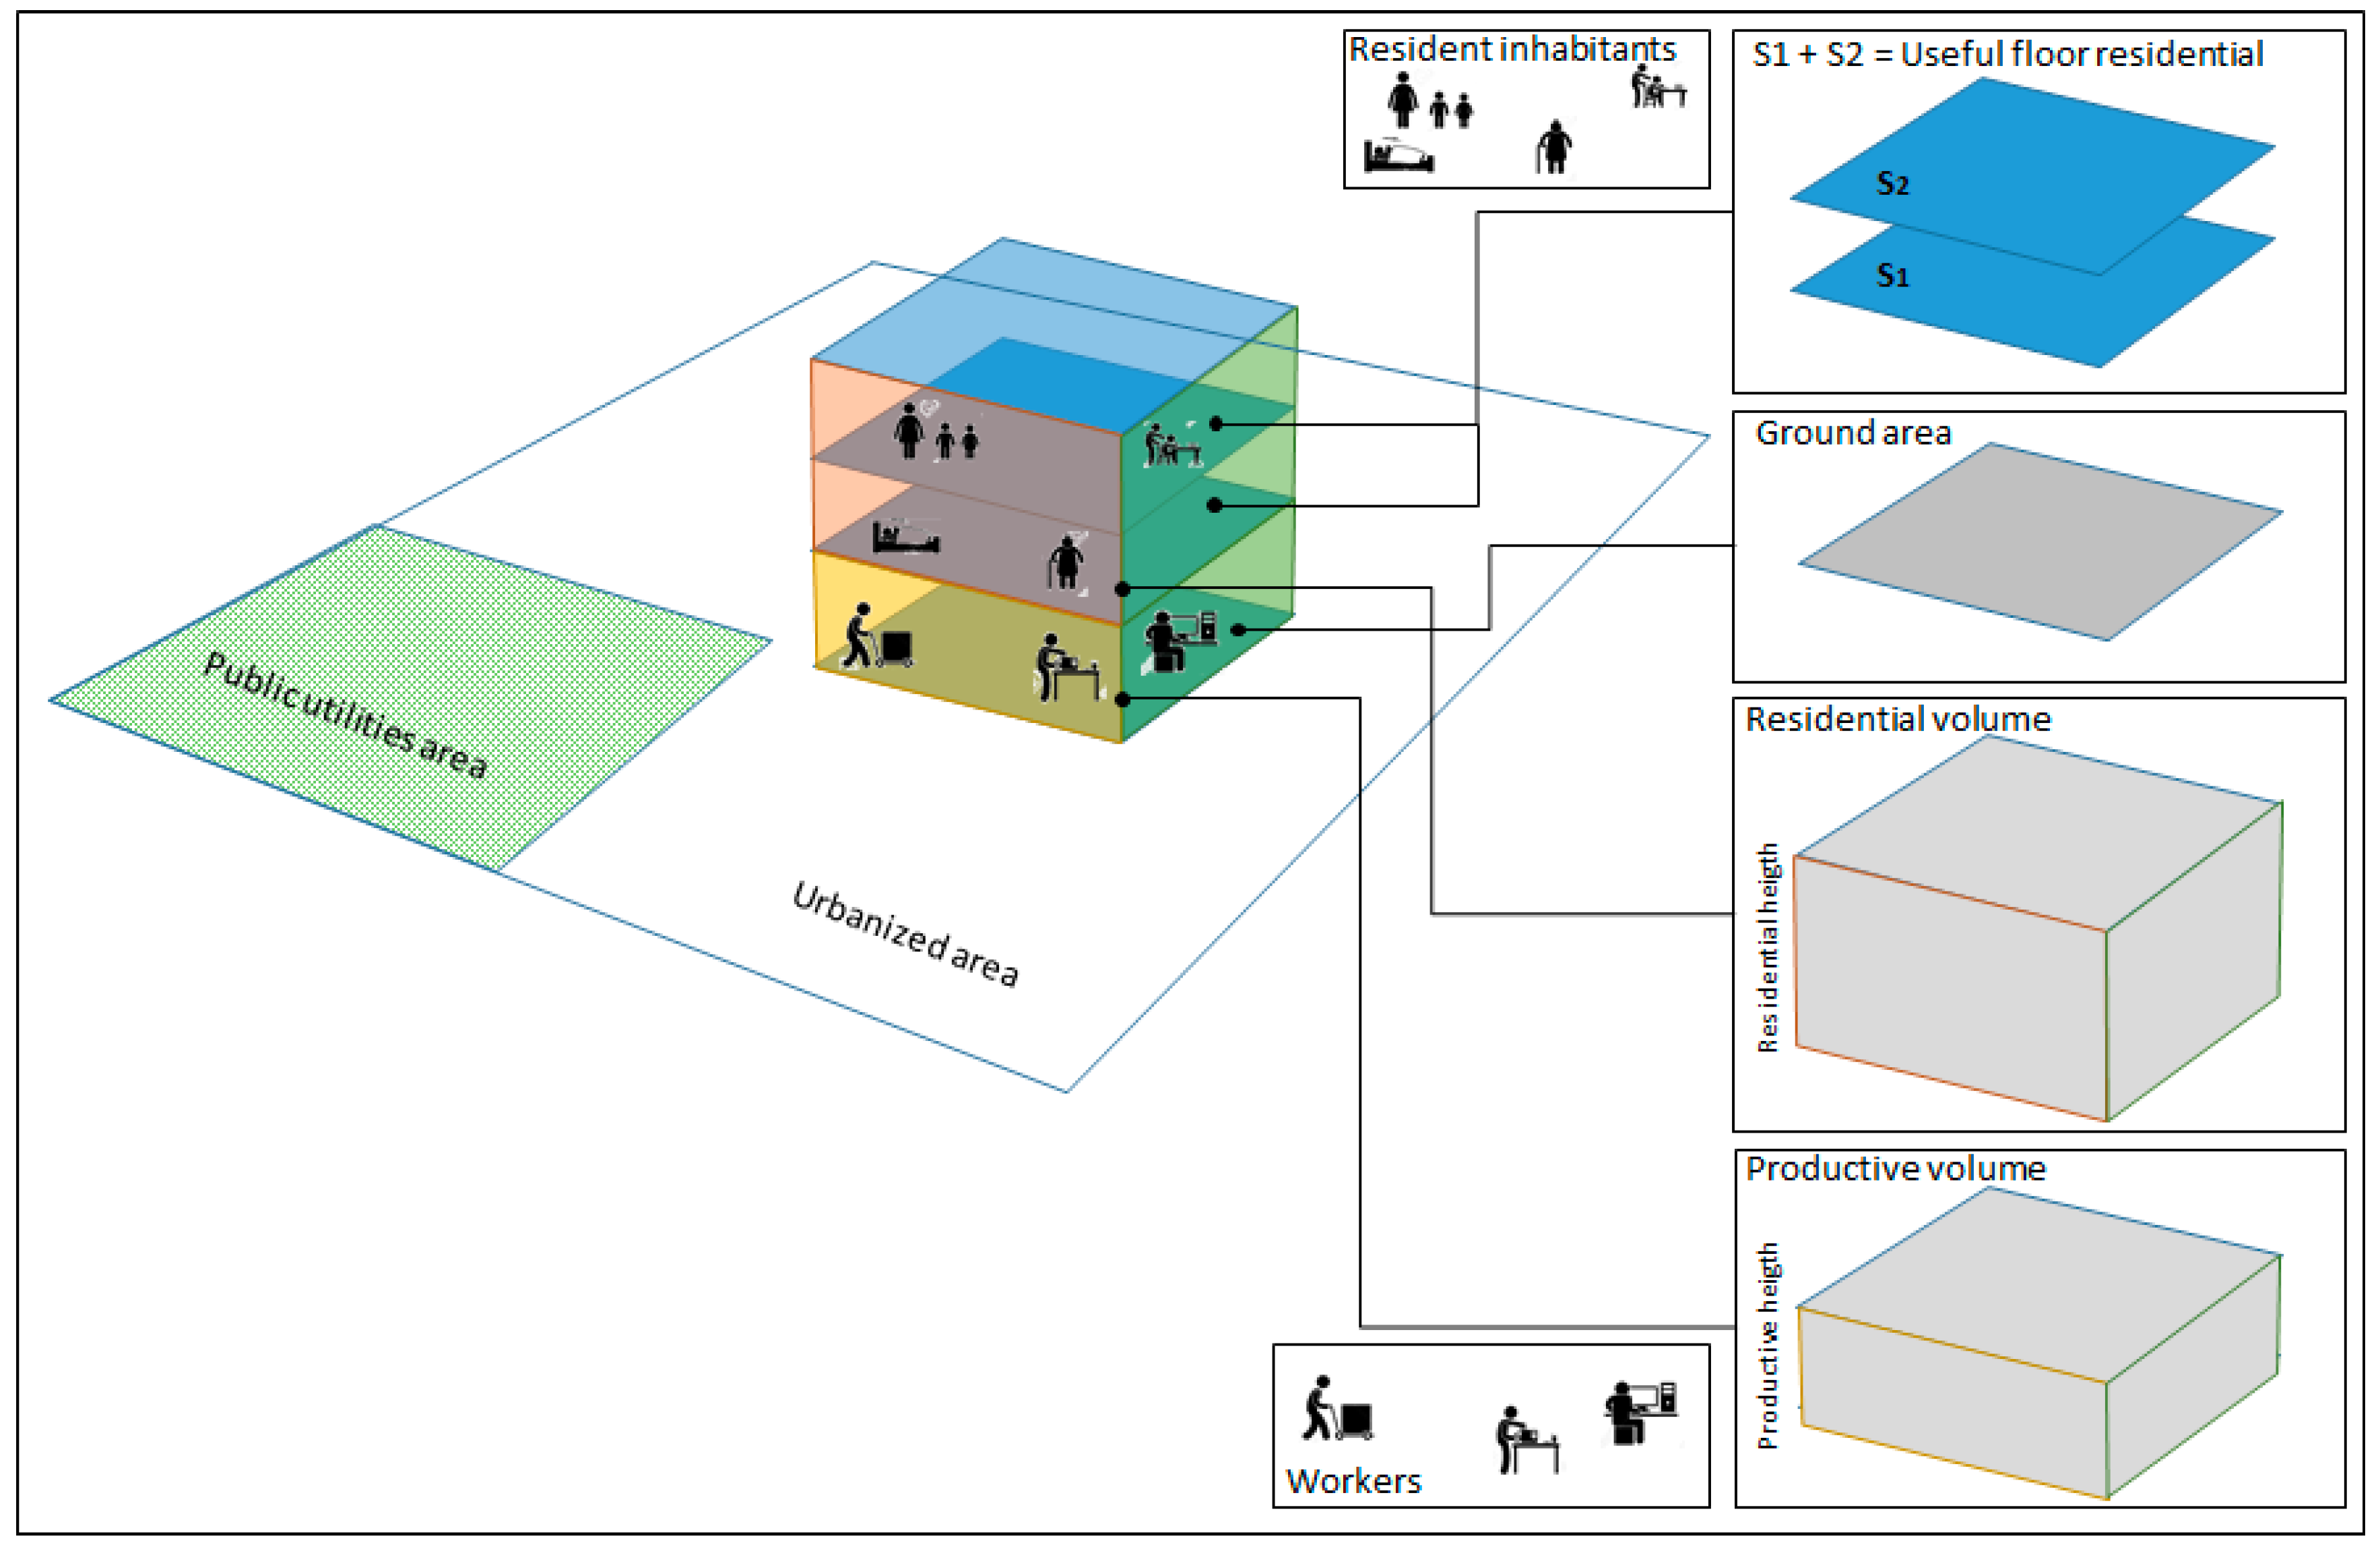
- urbanized soil by type (residential, services, and production);
- -
- volume of buildings by type (residential, services, and production);
- -
- built-up land by type (residential, services, and production);
- -
- population by type (residential, services and production workers) referring to each urbanized soil and volume of buildings.
3. Method and Results
- -
- 6 for areas ≤ 3 km away from a motorway toll booth or train station;
- -
- 5, 4, 3, and 2 for areas within 200 m respectively of national roads, provincial roads, >6 m wide municipal roads, or <6 m wide municipal roads;
- -
- 1 for all the other areas.
4. Discussion
5. Conclusions
Acknowledgments
Author Contributions
Conflicts of Interest
References
- Romano, B.; Zullo, F.; Fiorini, L.; Ciabò, S.; Marucci, A. Sprinkling: An Approach to Describe Urbanization Dynamics in Italy. Sustainability 2017, 9, 97. [Google Scholar] [CrossRef]
- Steffen, W.; Crutzen, P.J.; McNeill, J.R. The Anthropocene: Are Humans Now Overwhelming the Great Forces of Nature? AMBIO 2007, 36, 614–621. [Google Scholar] [CrossRef]
- Waters, C.N.; Zalasiewicz, J.; Summerhayes, C.; Barnosky, A.D.; Poirier, C.; Gałuszka, A.; Cearreta, A.; Edgeworth, M.; Ellis, E.C.; Jeandel, C.; et al. The Anthropocene is functionally and stratigraphically distinct from the Holocene (review). Science 2016, 351. [Google Scholar] [CrossRef] [PubMed]
- Romano, B.; Zullo, F. The urban transformation of Italy’s Adriatic coastal strip: Fifty years of unsustainability. Land Use Policy 2014, 38, 26–36. [Google Scholar] [CrossRef]
- Fiorini, L.; Zullo, F.; Romano, B. Urban development of the coastal system of the italian largest island: Sicily and Sardinia. Ocean Coast. Manag. 2017, 143, 184–194. [Google Scholar] [CrossRef]
- Romano, B.; Zullo, F.; Fiorini, L.; Marucci, A.; Ciabò, S. Land transformation of Italy due to half a century of urbanization. Land Use Policy 2017, 67, 387–400. [Google Scholar] [CrossRef]
- Bruegmann, R. Sprawl: A Compact History; University of Chicago Press: Chicago, IL, USA, 2005; ISBN 022-6-07-691-1. [Google Scholar]
- Daily, G.C. Management objectives for the protection of ecosystem services. Environ. Sci. Policy 2000, 3, 333–339. [Google Scholar] [CrossRef]
- Squires, G.D. (Ed.) Urban Sprawl: Causes, Consequences, & Policy Responses; The Urban Institute Press: Washington, DC, USA, 2002; p. 368. [Google Scholar]
- European Commission. Urban Sprawl in Europe: The Ignored Challenge; EEA Report 10; European Commission: Strasbourg, France, 2006. [Google Scholar]
- Ewing, R.H. Characteristics, Causes, and Effects of Sprawl: A Literature Review; Marzluff, J.M., Shulenberger, E., Endlicher, W., Alberti, M., Bradley, G., Ryan, C., Simon, U., ZumBrunnen, C., Eds.; Urban Ecology; Springer: Berlin, Germany, 2008. [Google Scholar]
- Angel, S.; Parent, J.; Civco, D. The fragmentation of urban landscapes: Global evidence of a key attribute of the spatial structure of cities, 1990−2000. Environ. Urban. 2012, 24, 249–283. [Google Scholar] [CrossRef]
- Batty, M. The theory of city size. Science 2013, 340, 1418–1419. [Google Scholar] [CrossRef] [PubMed]
- Barrington-Leigh, C.; Millard-Ballb, A. A century of sprawl in the United States. Proc. Natl. Acad. Sci. USA 2015, 112, 8244–8249. [Google Scholar] [CrossRef] [PubMed]
- Paleari, S. Is the European Union protecting soil? A critical analysis of Community environmental policy and law. Land Use Policy 2017, 64, 163–173. [Google Scholar] [CrossRef]
- Italian National Institute for Environmental Protection and Research. Consumo di Suolo, Dinamiche Territoriali e Servizi Ecosistemici, Edizione 2017; ISPRA: Roma, Italy, 2017. [Google Scholar]
- Romano, B.; Zullo, F. Half a century of urbanisation in Southern European lowlands a study on the Po Valley (Northern Italy). J. Urban Res. Pract. 2015, 9, 109–130. [Google Scholar] [CrossRef]
- Filip, F.G.; Zamfirescu, B.C.; Ciurea, C. Computer-Supported Collaborative Decision-Making, Automation, Collaboration, & E-Services 4; Springer: Berlin, Germany, 2017. [Google Scholar]
- Gelli, F. Planning Systems in Italy within the Context of New Processes of ‘Regionalization’. Eur. Plan. Stud. 2010, 6, 183–197. [Google Scholar] [CrossRef]
- Colavitti, A.M.; Usai, N.; Bonfiglioli, S. Urban Planning in Italy: The Future of Urban General Plan and Governance. Eur. Plan. Stud. 2013, 21, 167–186. [Google Scholar] [CrossRef]
- Servillo, L.; Lingua, V. The Innovation of the Italian Planning System: Actors, Path Dependencies, Cultural Contradictions and a Missing Epilogue. Eur. Plan. Stud. 2014, 22, 400–417. [Google Scholar] [CrossRef]
- Renard, V. Property Rights and the “Transfer of Development Rights”: Questions of Efficiency and Equity. Town Plan. Rev. 2007, 78, 41–60. [Google Scholar] [CrossRef]
- Henger, R.; Bizer, K. Tradable planning permits for land use control in Germany. Land Use Policy 2010, 27, 843–852. [Google Scholar] [CrossRef]
- Romano, B.; Zullo, F. Models of Urban Land Use in Europe: Assessment tools and criticalities. Int. J. Agric. Environ. Inf. Syst. (IJAEIS) 2013, 4, 80–97. [Google Scholar] [CrossRef]
- Benguigui, L. Aggregation models for town growth. J. Philos. Mag. Part B 1998, 77, 1269–1275. [Google Scholar] [CrossRef]
- Waddell, P. UrbanSim: Modelling urban development for land use, transportation and environmental planning. J. Am. Plan. Assoc. 2002, 68, 297–314. [Google Scholar] [CrossRef]
- Jacobs-Crisioni, C.; Rietveld, P.; Koomen, E. The impact of spatial aggregation on urban development analyses. Appl. Geogr. 2013, 47, 46–56. [Google Scholar] [CrossRef]
- Barredo, J.I.; Kasanko, M.; McKormick, N.; Lavalle, C. Modelling dynamic spatial processes: Simulation of urban future scenarios through cellular automata. Landsc. Urban Plan. 2003, 64, 145–160. [Google Scholar] [CrossRef]
- Schweitzer, F. Analysis and Simulation of Urban Aggregation; Brownian Agents and Active Particles; Springer: Berlin, Germany, 2003; pp. 295–333. [Google Scholar]
- Batty, M. Cities and Complexity: Understanding Cities with Cellular Automata, Agent-Based Models, and Fractals; MIT Press: Cambridge, MA, USA, 2005; ISBN 978-0-26-202583-6. [Google Scholar]
- Santè, I.; Garcìa, M.; Miranda, D.; Crecente, R. Cellular automata models for the simulation of real-world urban processes: A review and analysis. Landsc. Urban Plan. 2010, 96, 108–122. [Google Scholar] [CrossRef]
- Amato, F.; Pontrandolfi, P.; Murgante, B. Supporting planning activities with the assessment and the prediction of urban sprawl using spatio-temporal analysis. Ecol. Inform. 2015, 30, 365–378. [Google Scholar] [CrossRef]
- De Santis, E.; Romano, B. LUC, Land Uptake Control: A Gis based Approach. In Proceedings of the ICINCO 2013 10th International Conference on Informatic in Control, Reykjavik, Iceland, 29–31 July 2013; pp. 450–456. [Google Scholar]
- Murgante, B.; Scorza, F. Ontology and Spatial Planning. In Computational Science and Its Applications—ICCSA 2011; Murgante, B., Gervasi, O., Iglesias, A., Taniar, D., Apduhan, B.O., Eds.; Lecture Notes in Computer Science; Springer: Berlin/Heidelberg, Germany, 2011; Volume 6783, pp. 255–264. [Google Scholar]
- Borruso, G.; Bertazzon, S.; Favretto, A.; Murgante, B.; Torre, C.M. (Eds.) Geographic Information Analysis for Sustainable Development and Economic Planning: New Technologies; IGI Global: Hershey, PA, USA, 2013; ISBN 978-1-46-661926-5. [Google Scholar]


| De-Sprinkling Process | |||||
|---|---|---|---|---|---|
| Step | Methodologies/Goals | Pattern | Action | Tools | Time Horizon |
| 1 | Slackening, up to the interruption, of the phenomena of further land take according to traditional dynamics, so as not to further burden the current conditions. It is an action reasonably falling within the Regions’ strategic responsibilities. In this sense, the laws pertaining to “land consumption,” with which several Regions have already complied, seem to be the main solution for setting regulatory-fiscal regulations aimed at containing the behaviours of Municipalities and private subjects as to further forms of uncontrolled use of territorial surfaces. |  | Stopping urban sprawl/sprinkling | regulatory intervention/tax deduction | short term |
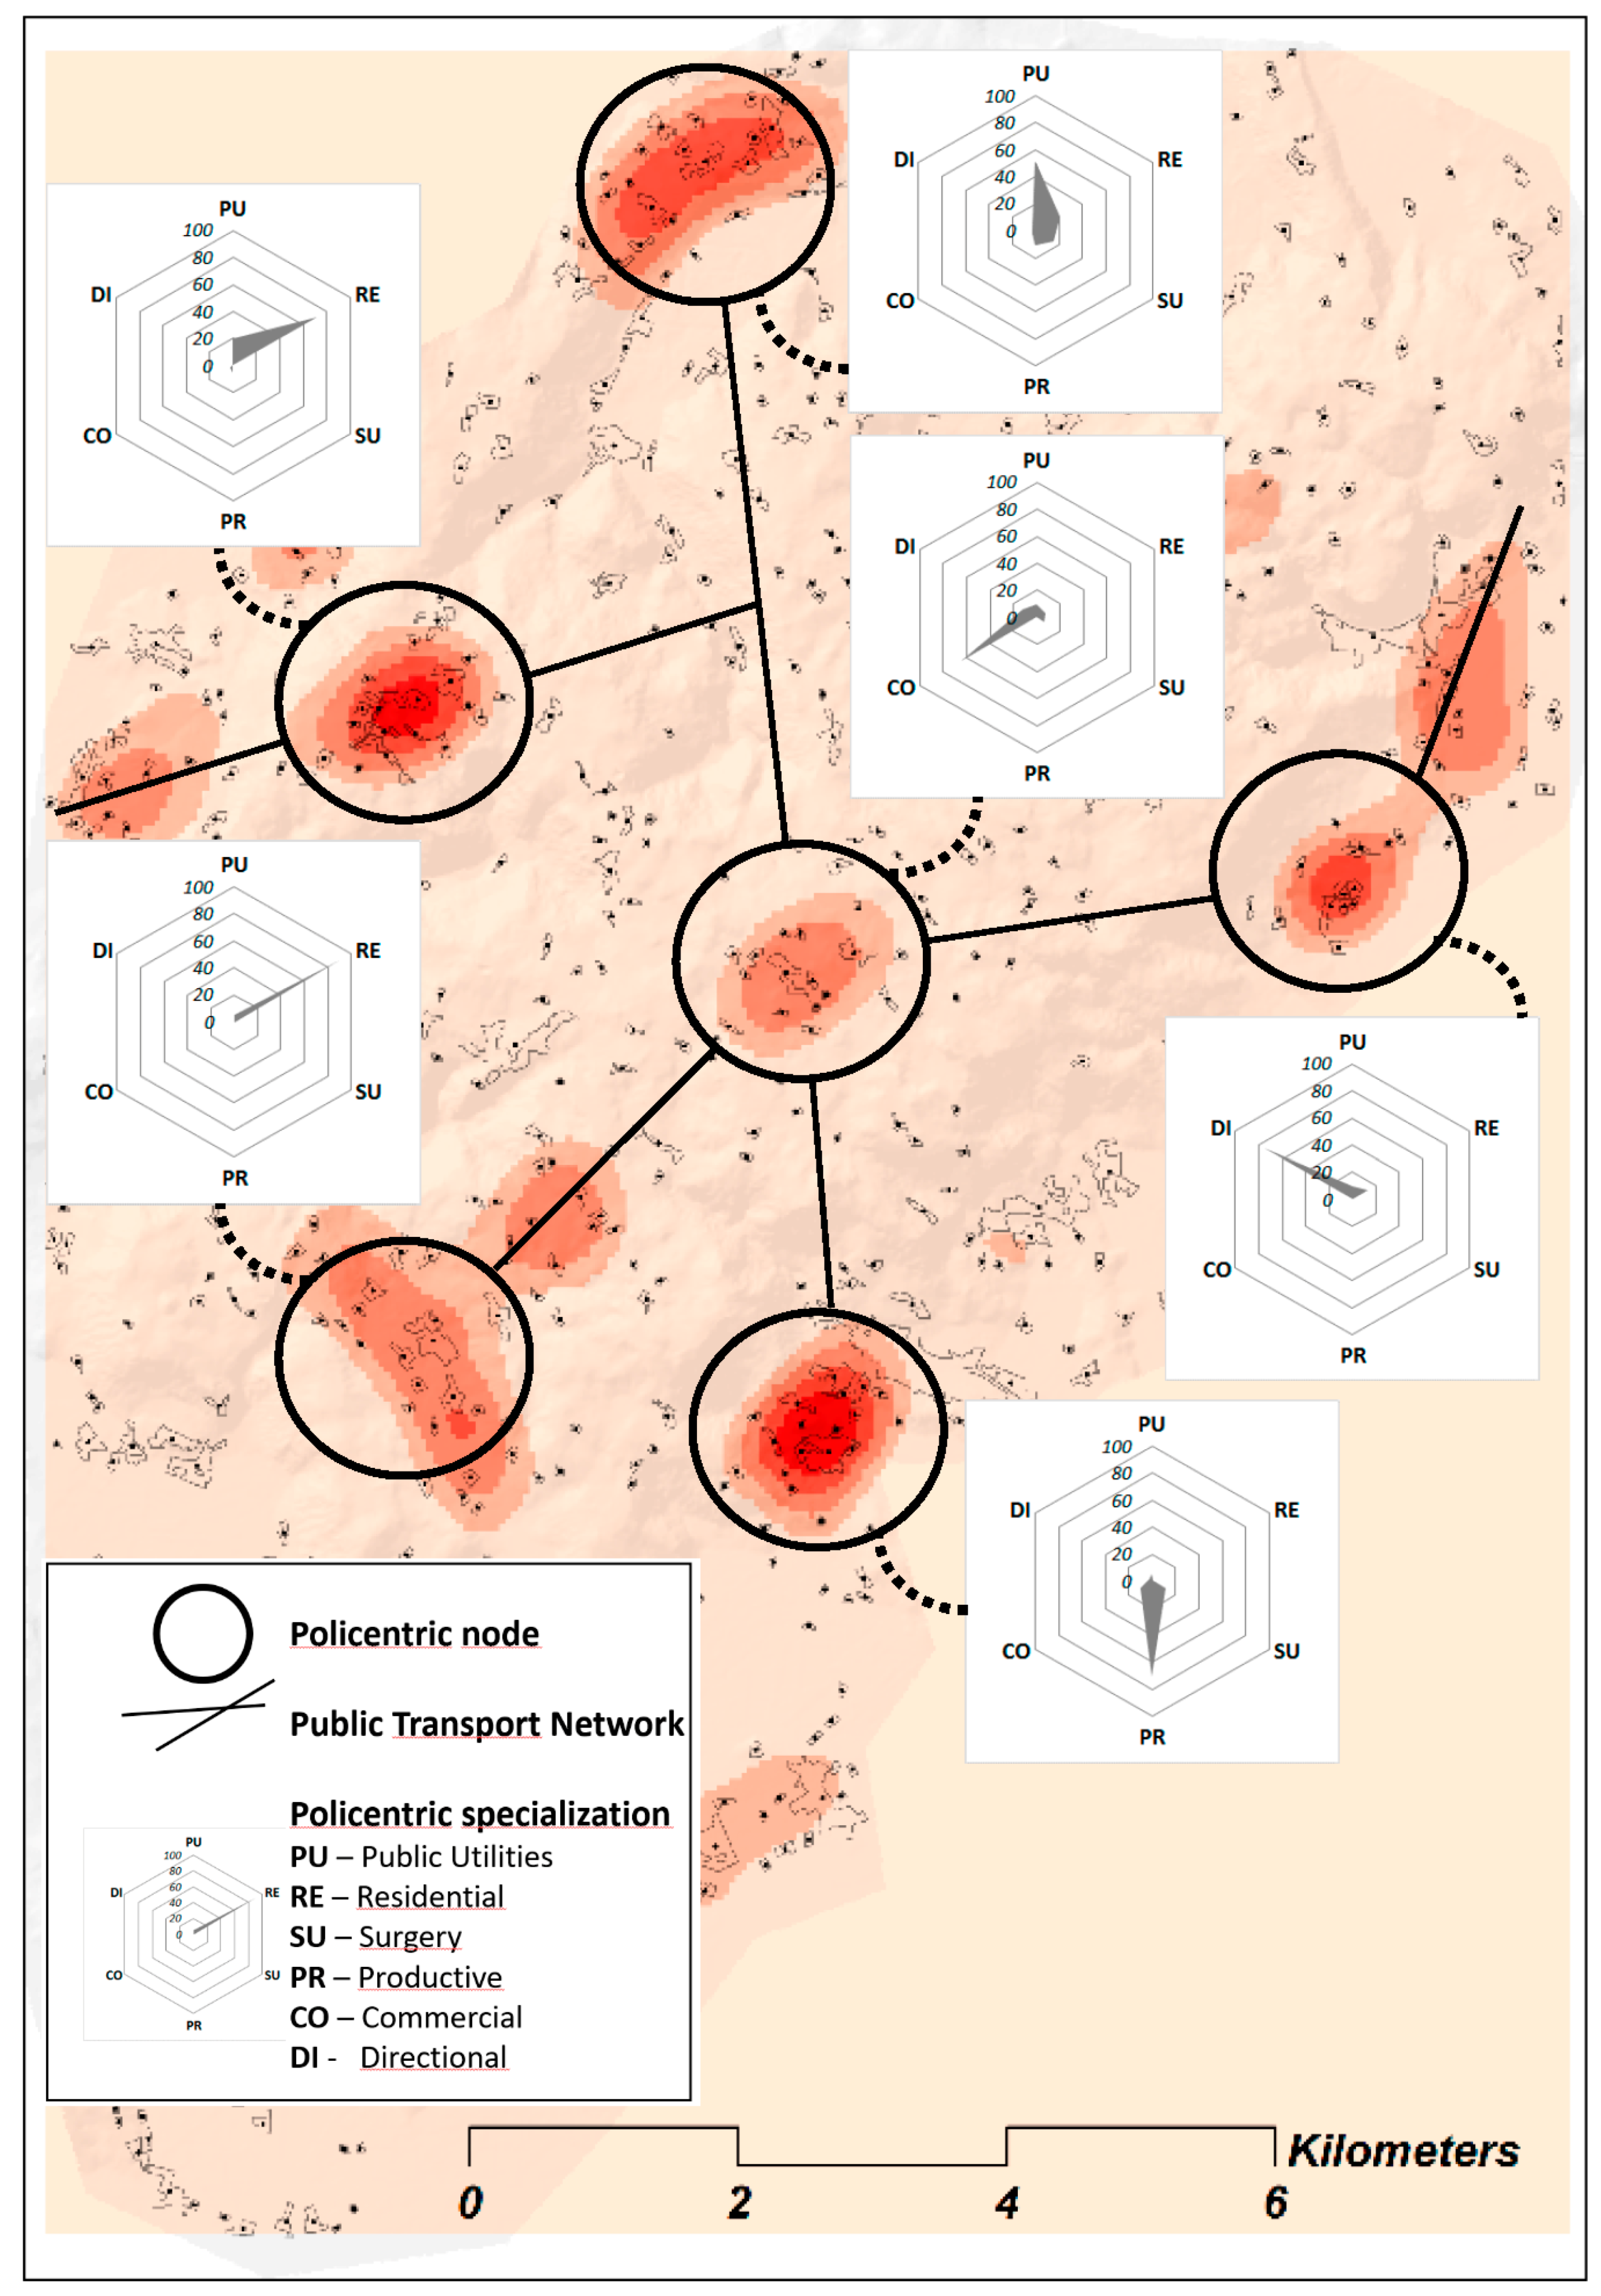
| 2 | Identification and reorganization of "key areas" in which to carry out localization interventions of infrastructures, services and polarizing productive functions, with the intent to reorganize a macro urban fabric with its central areas and its reclassified road system. It is a key step in the de-sprinkling process, as it requires an almost paradigmatic reformulation of the current planning modalities. The aim, in fact, can be achieved by inverting the plan reduction trajectory, giving it a more incisive compulsoriness |  | Prioritised functional ranking | strategic plan/operational plan | mid term |
| 3 | Densification intervention of the urban fabric so as to satisfy the future needs of land take increase, but especially to guarantee efficient public utilities, optimizing the users’ accessibility and threshold volumes. The key areas host all the functions that in time become indispensible to guarantee the qualitative and supply improvement of the territorial ambit (housing, utilities, industrial, commercial, managerial) systematically using the tools of equal distribution/compensation of land. |  | Densification/infilling | Operational planning/urban projec | mid term |
| 4 | Incentives or managerial interventions negotiated in phase of equal distribution/compensation (for example, through the acquisition of public patrimony areas) aimed at the gradual removal of built/urbanized areas, with local projects of re-establishment/restoration of the landscape-environmental-pedological state of the areas and of the original use of the land, with increasing of urban density |  | Shrinking | regulatory intervention/tax deduction | long term |
| Indicators | km² | m | m³ | m³/m² | N. | Inhab/km² | % | m³/inhab | ||
|---|---|---|---|---|---|---|---|---|---|---|
| Primary data | Urbanization data | De-sprinkling district (DPX-D) | 135.3 | |||||||
| Urbanized areas | 7.45 | 0.055 | ||||||||
| Mean urbanized area | 1.15 | |||||||||
| Public utilities | 0.053 | 0.007 | ||||||||
| Building data | Floor area (residential) | 2.95 | ||||||||
| Floor area (productive) | 0.3 | |||||||||
| Total residential volume | ||||||||||
| Total productive volume | 18,658,651 | |||||||||
| Mean heigth residential buindings | 6.32 | 1,760,550 | ||||||||
| Mean heigth productive buindings | 5.9 | |||||||||
| Demographic data | Resident inhabitants | 39731 | ||||||||
| Workers to the productive sector | 15308 | |||||||||
| Secondary data | Urban/building densities | Urban density | 0.055 | |||||||
| Cover Ratio (residenzial) | 0.3959 | |||||||||
| Cover Ratio (productive) | 73154 | |||||||||
| Land Utilization Index (residential) | 0.04 | |||||||||
| Volumetric density (residential) | 2.5 | 0.83 | ||||||||
| Volumetric Standard (residential) | ||||||||||
| Useful floor (residential) | 6.19 | 180 | ||||||||
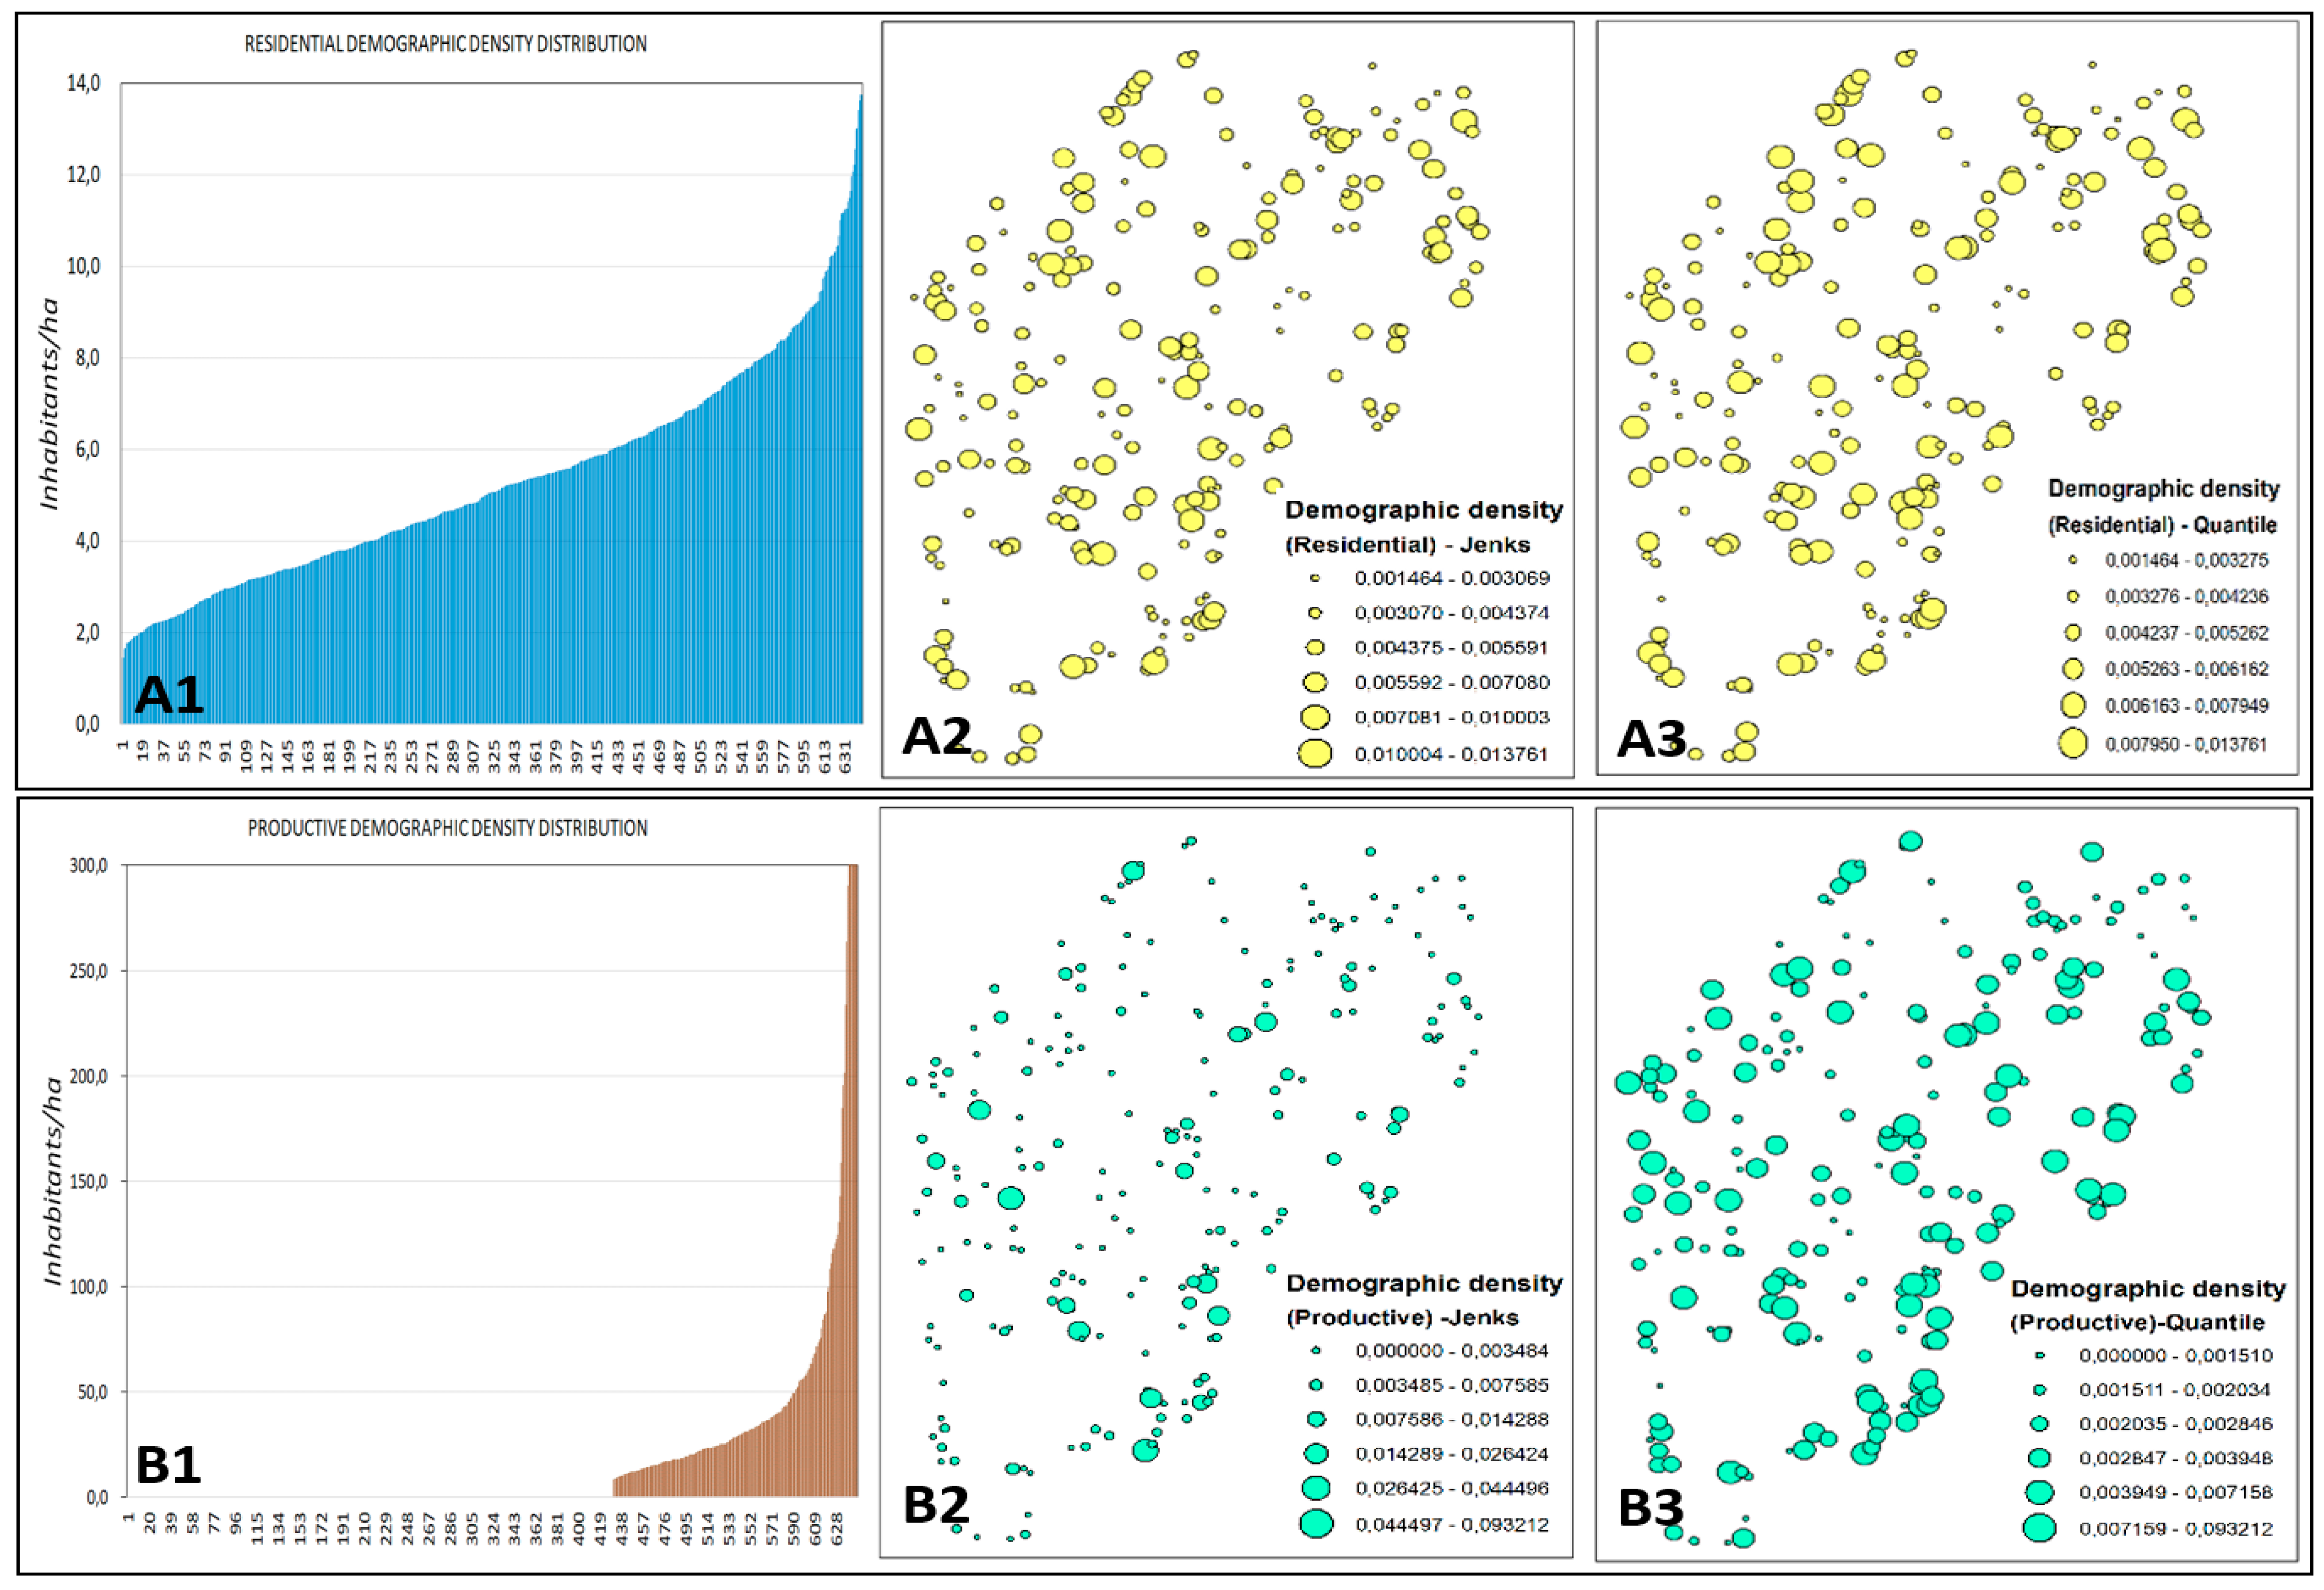
| Demographic densities | Demographic density | 293.65 | ||||||||
| Worker density | 113.14 | |||||||||
| J Parameter | Quantile (1–6) | J Weigth |
|---|---|---|
| Urbanized soil (m2) | qUS | αUS |
| Residential volumetric density (m3/m2) | qRVD | αRVD |
| Productive volumetric density (m3/m2) | qPVD | αPVD |
| Residential demographic density (inhab/ha) | qRDD | αRDD |
| Productive demographic density (Inhab/ha) | qPDD | αPDD |
| Part of urbanized soil for public utilities (Public utilities %) | qPU | αPU |
| Road proximity (km) | qRP | αRP |
© 2017 by the authors. Licensee MDPI, Basel, Switzerland. This article is an open access article distributed under the terms and conditions of the Creative Commons Attribution (CC BY) license (http://creativecommons.org/licenses/by/4.0/).
Share and Cite
Romano, B.; Fiorini, L.; Zullo, F.; Marucci, A. Urban Growth Control DSS Techniques for De-Sprinkling Process in Italy. Sustainability 2017, 9, 1852. https://doi.org/10.3390/su9101852
Romano B, Fiorini L, Zullo F, Marucci A. Urban Growth Control DSS Techniques for De-Sprinkling Process in Italy. Sustainability. 2017; 9(10):1852. https://doi.org/10.3390/su9101852
Chicago/Turabian StyleRomano, Bernardino, Lorena Fiorini, Francesco Zullo, and Alessandro Marucci. 2017. "Urban Growth Control DSS Techniques for De-Sprinkling Process in Italy" Sustainability 9, no. 10: 1852. https://doi.org/10.3390/su9101852
APA StyleRomano, B., Fiorini, L., Zullo, F., & Marucci, A. (2017). Urban Growth Control DSS Techniques for De-Sprinkling Process in Italy. Sustainability, 9(10), 1852. https://doi.org/10.3390/su9101852