Experimental Study of the Viability of Low-Grade Biofuels in Small-Scale Appliances

 ,
,  ,
, 
Abstract
:1. Introduction
2. Methodology
2.1. Fuel
2.1.1. Chemical Characterization
2.1.2. Raw Input Materials
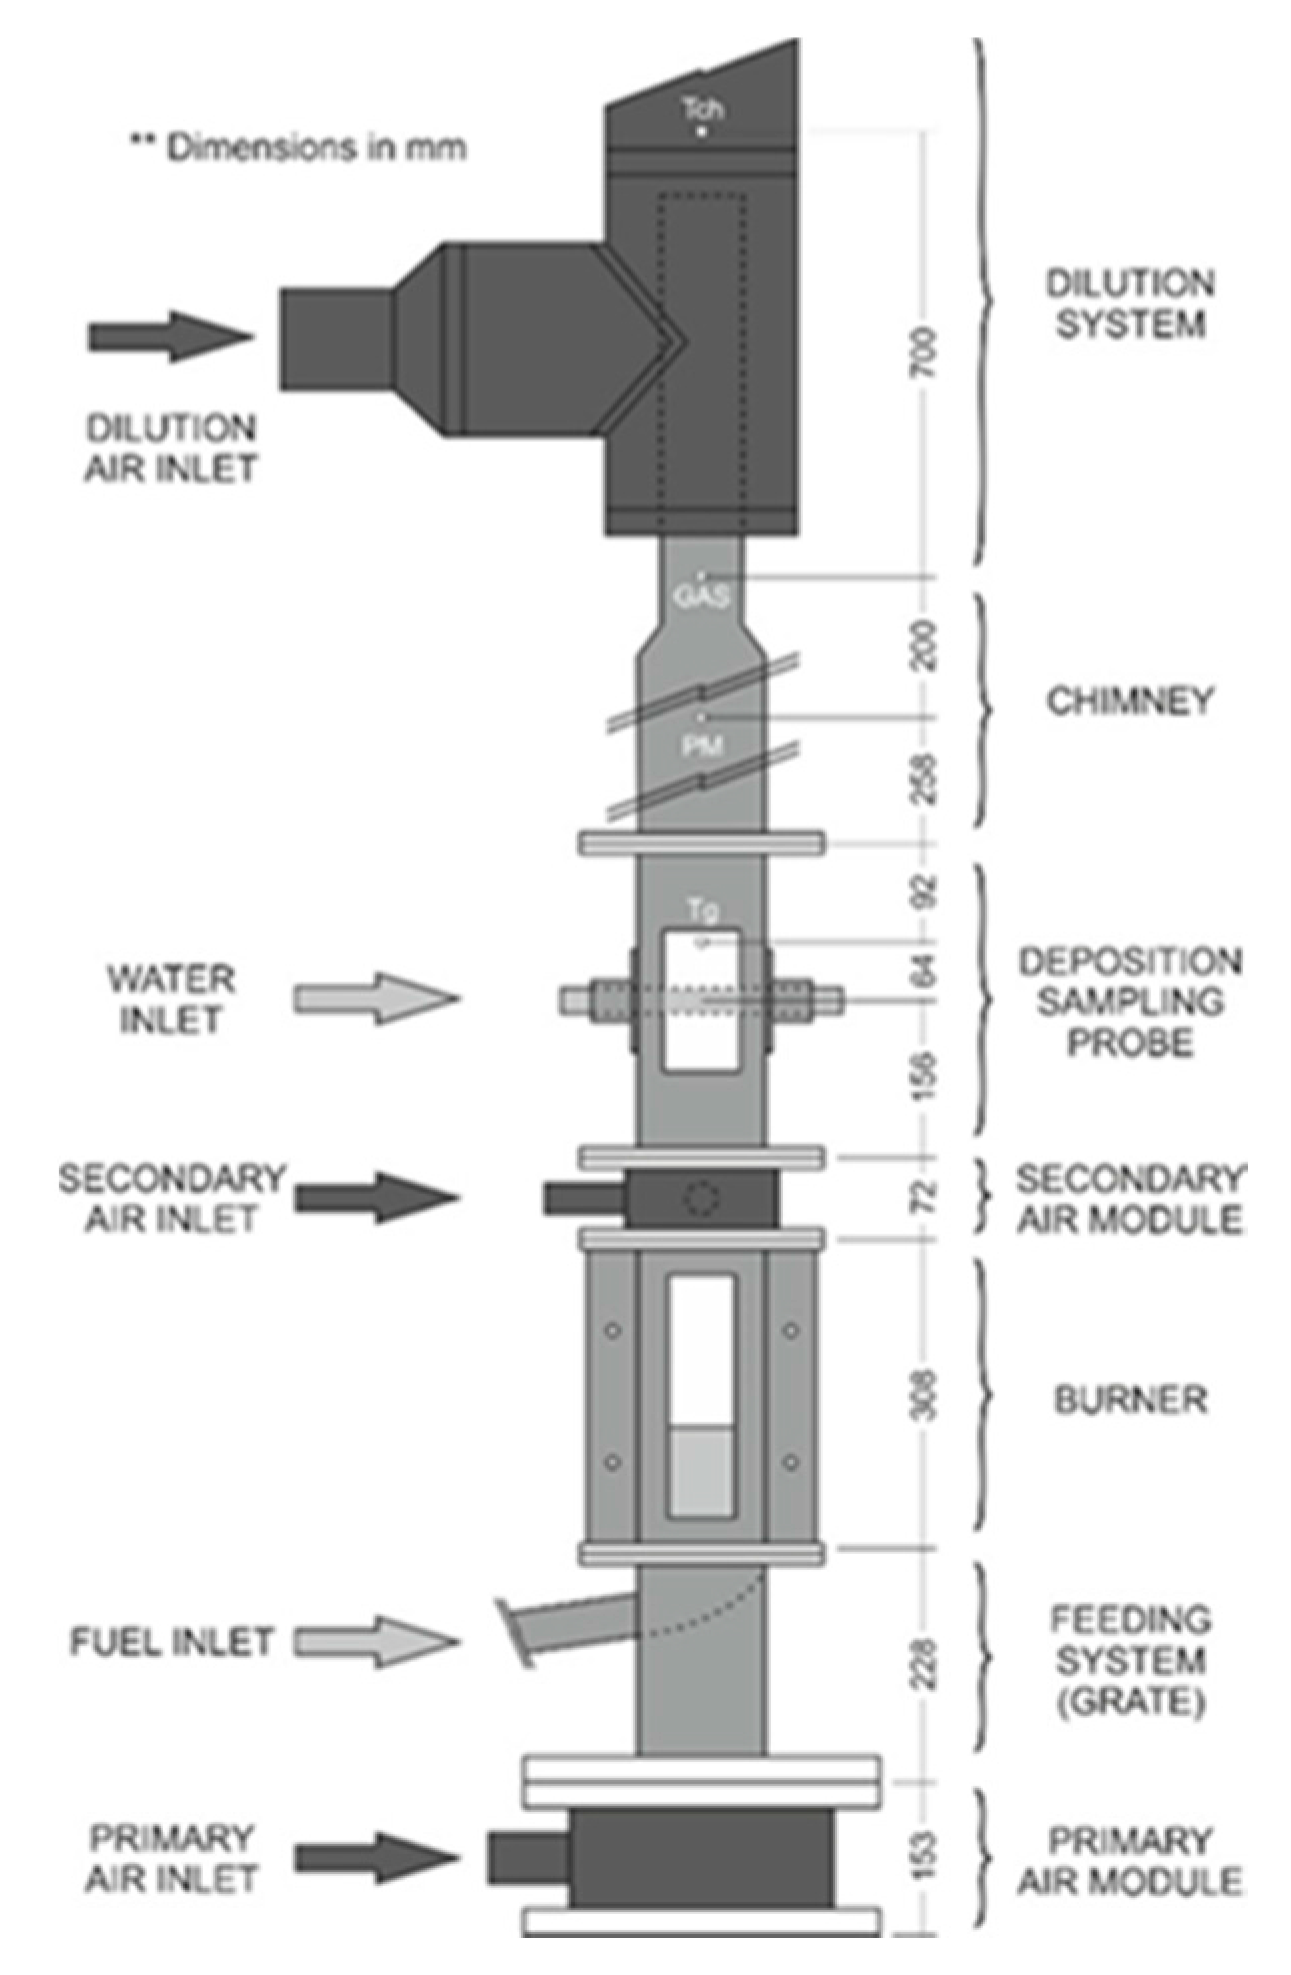
2.2. Description of the Facility
2.3. Experimental Methodology
3. Results and Discussion
3.1. Chemical Properties
3.2. Physical Properties
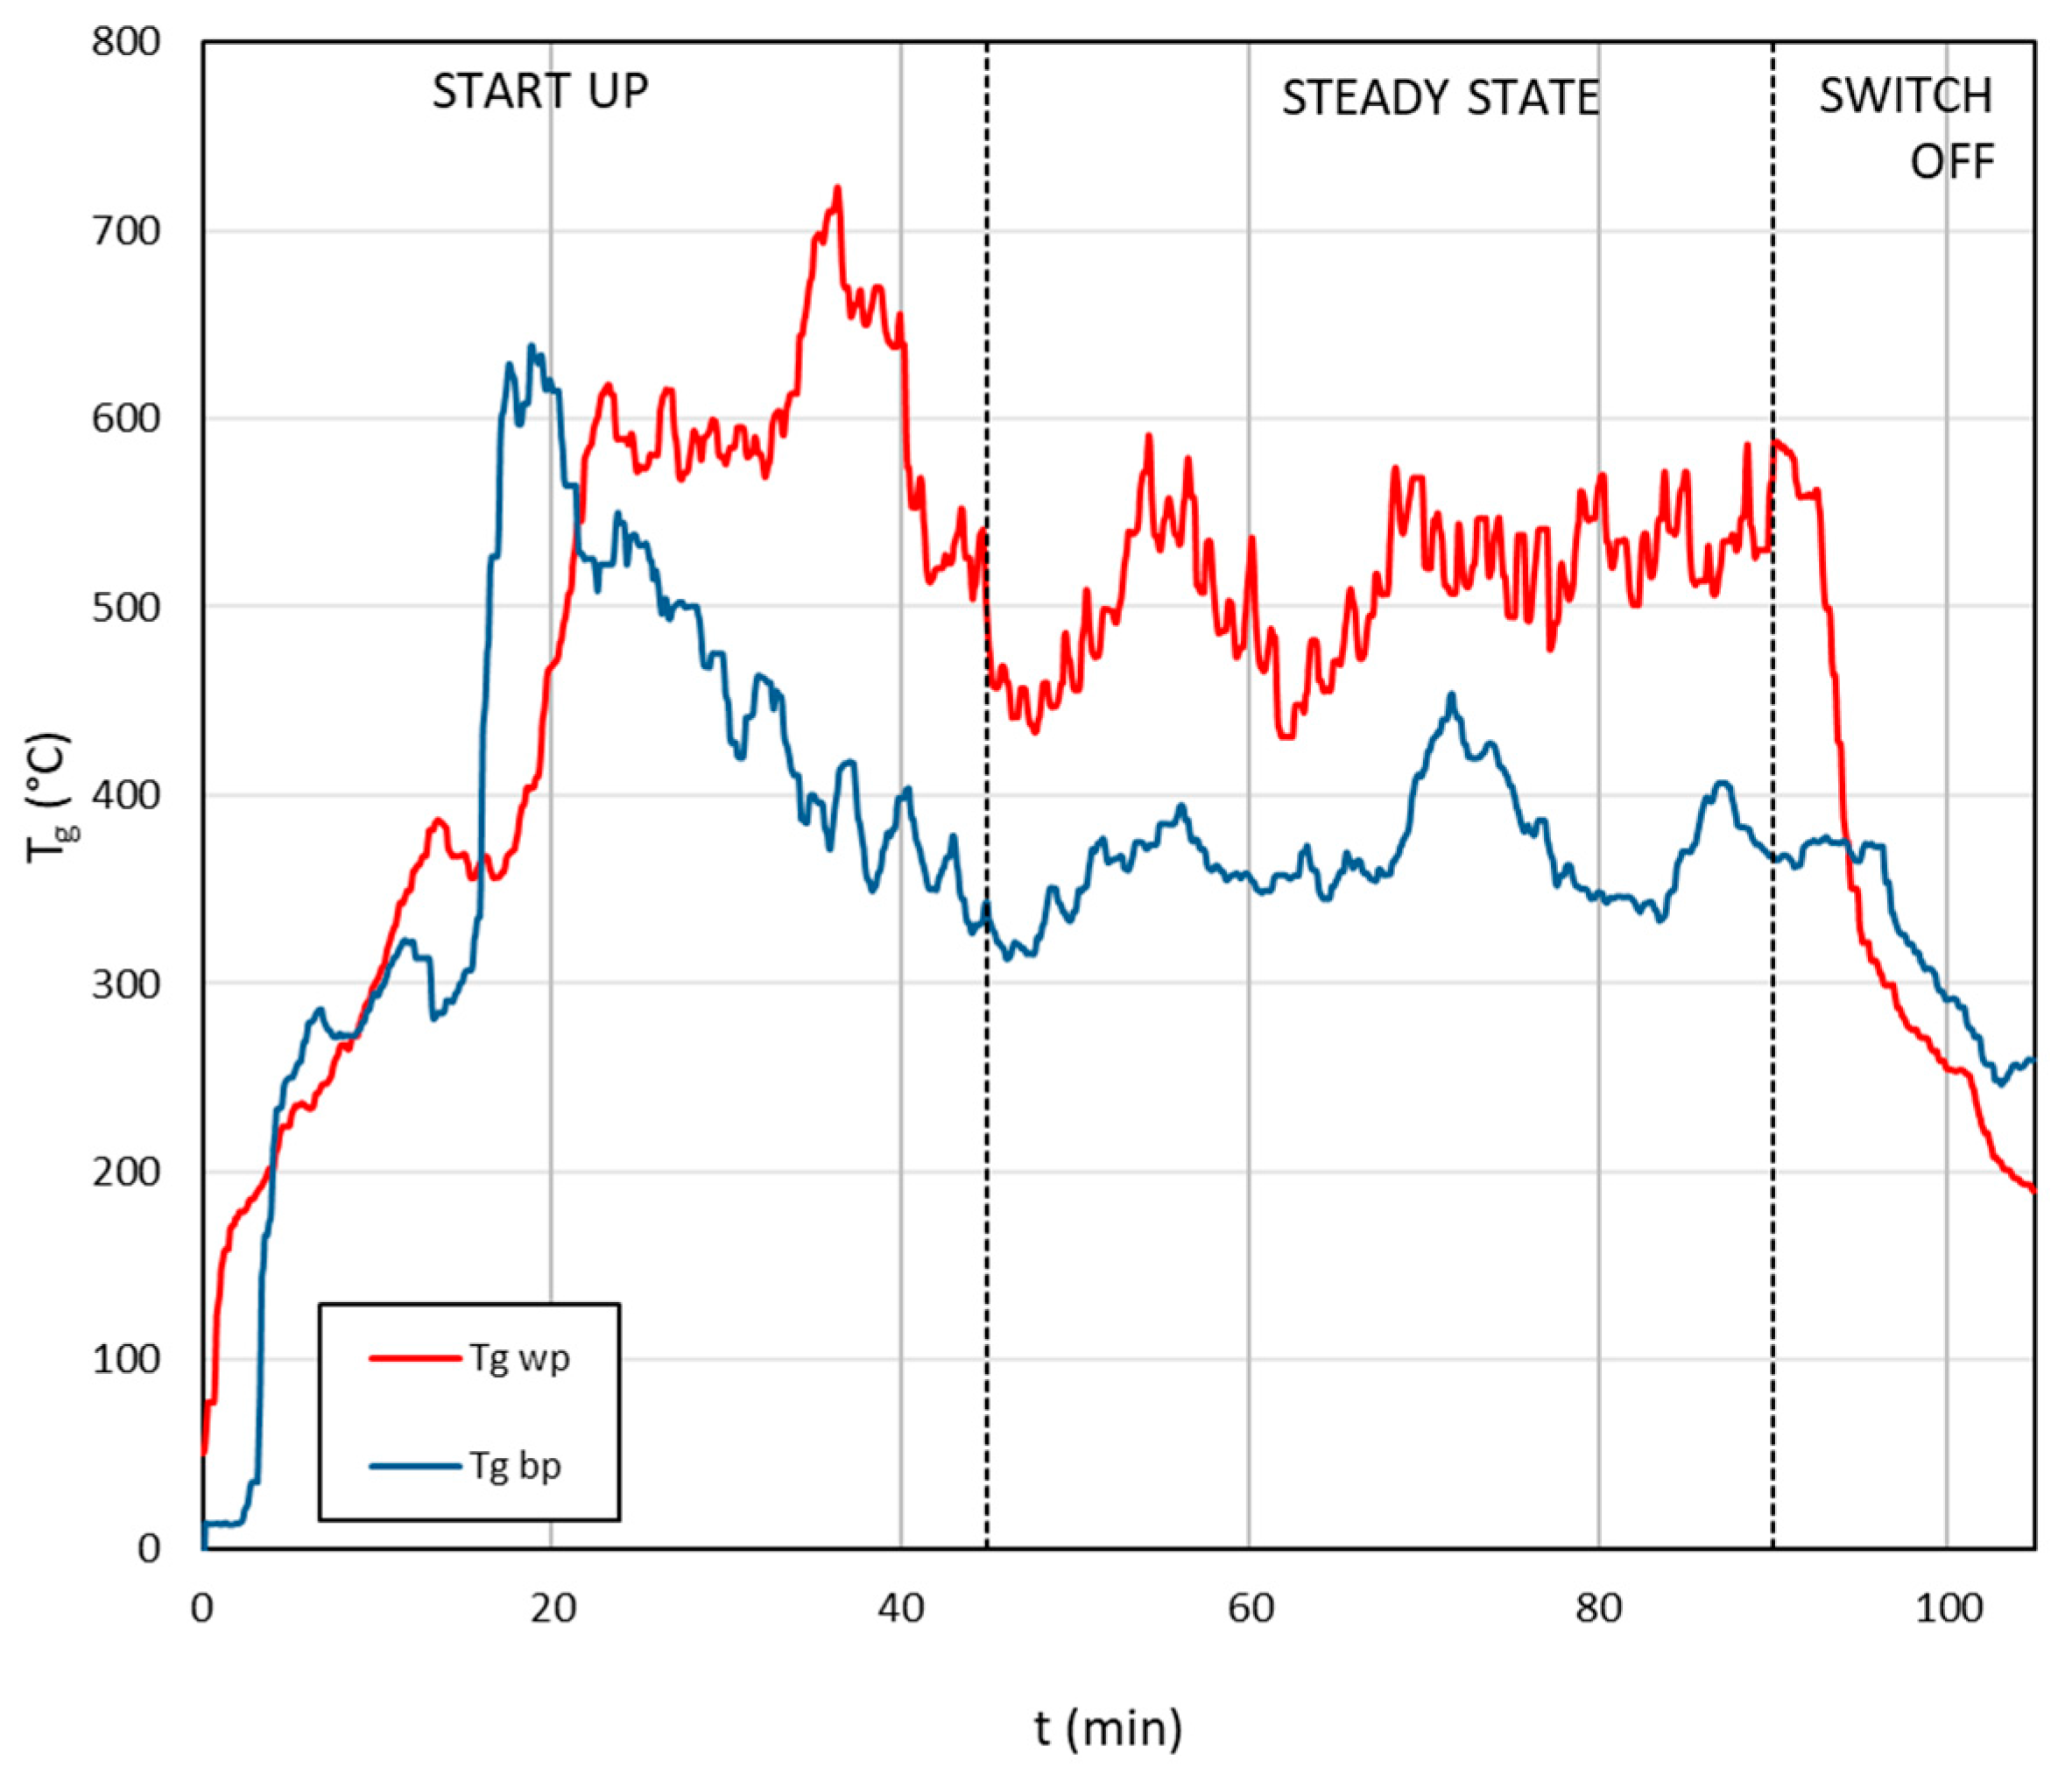
3.3. Stability of the Facility
3.4. Plant Repeatability
3.5. Combustion Parameters
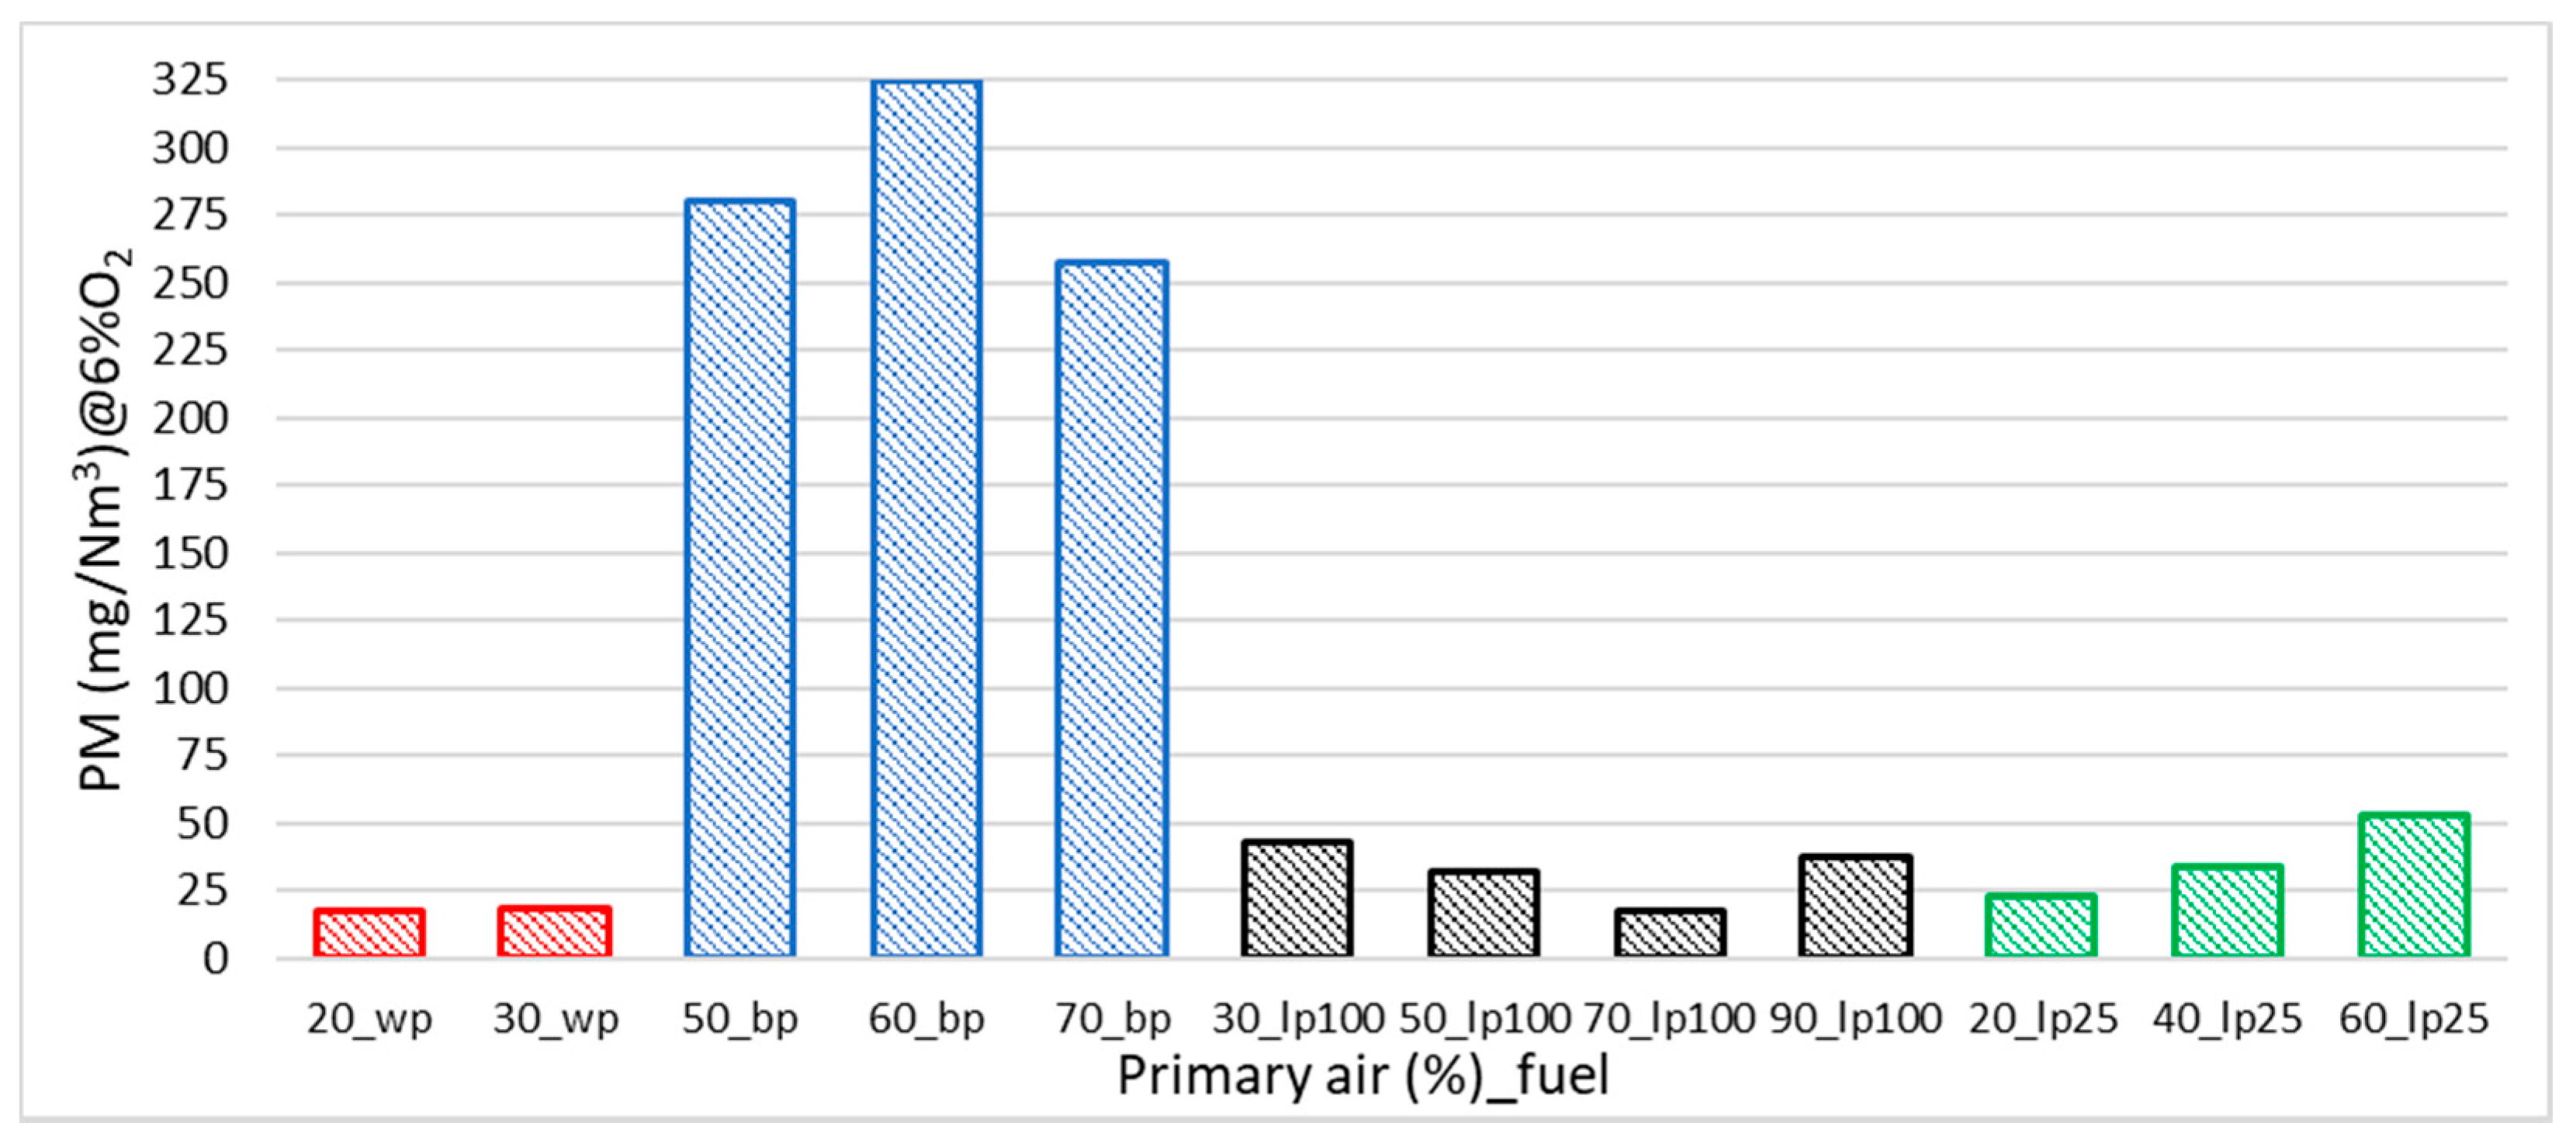
3.6. Particulate Emissions
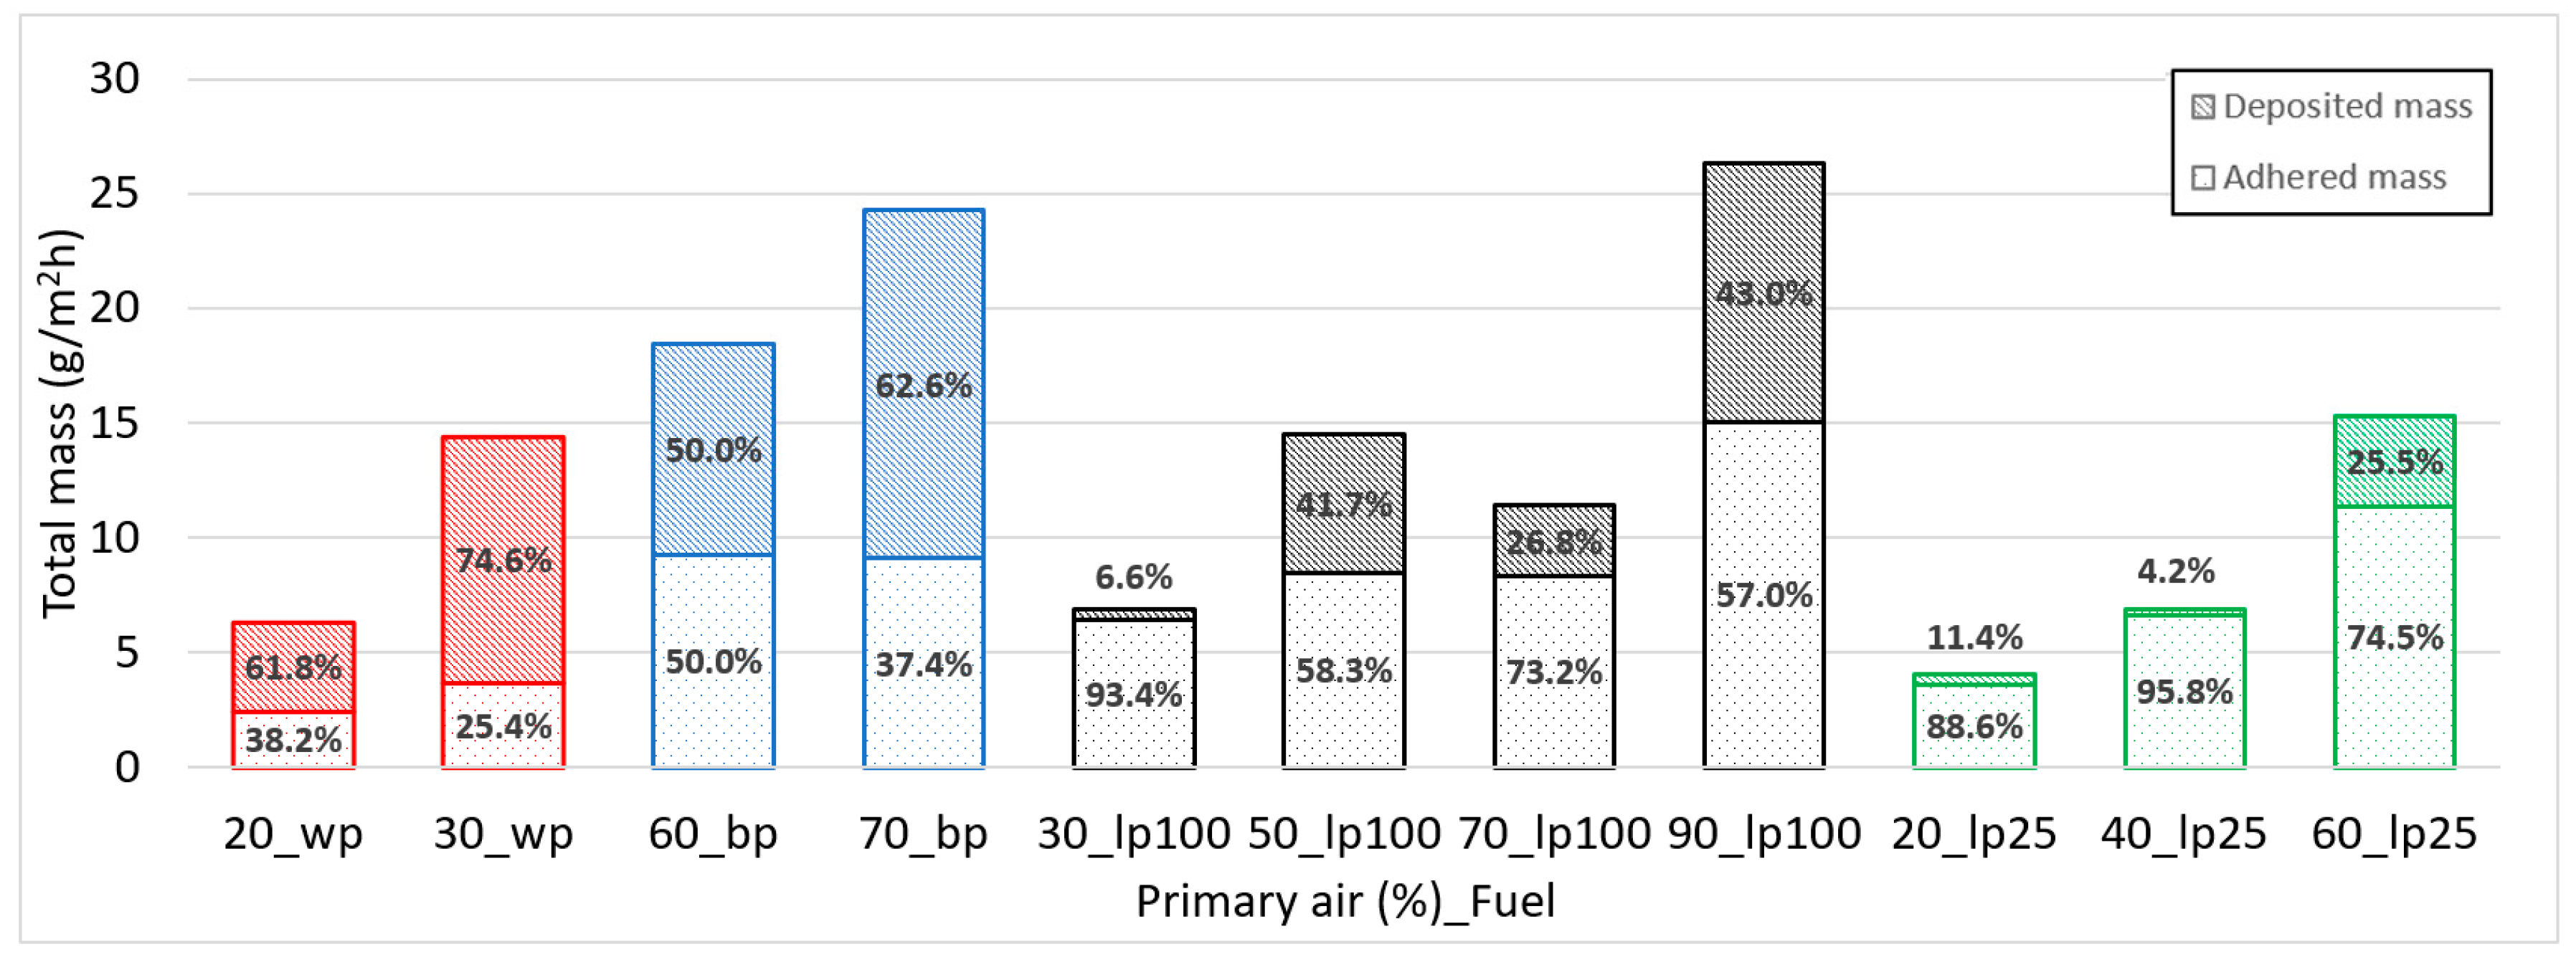
3.7. Fouling and Slagging
4. Conclusions
- The test duration is directly related to the ash content in the fuel. The ash is accumulated in the bed after combustion. If very high temperatures are reached, part of the ash melts and forms slag, which worsens the combustion, causing instabilities and unwanted downtime. The test duration without transitory periods for the reference fuel (wp) was 180 min. However, this value was reduced to 40 and 45 min for lp100 and bp, respectively. For lp25, the duration was 90 min.
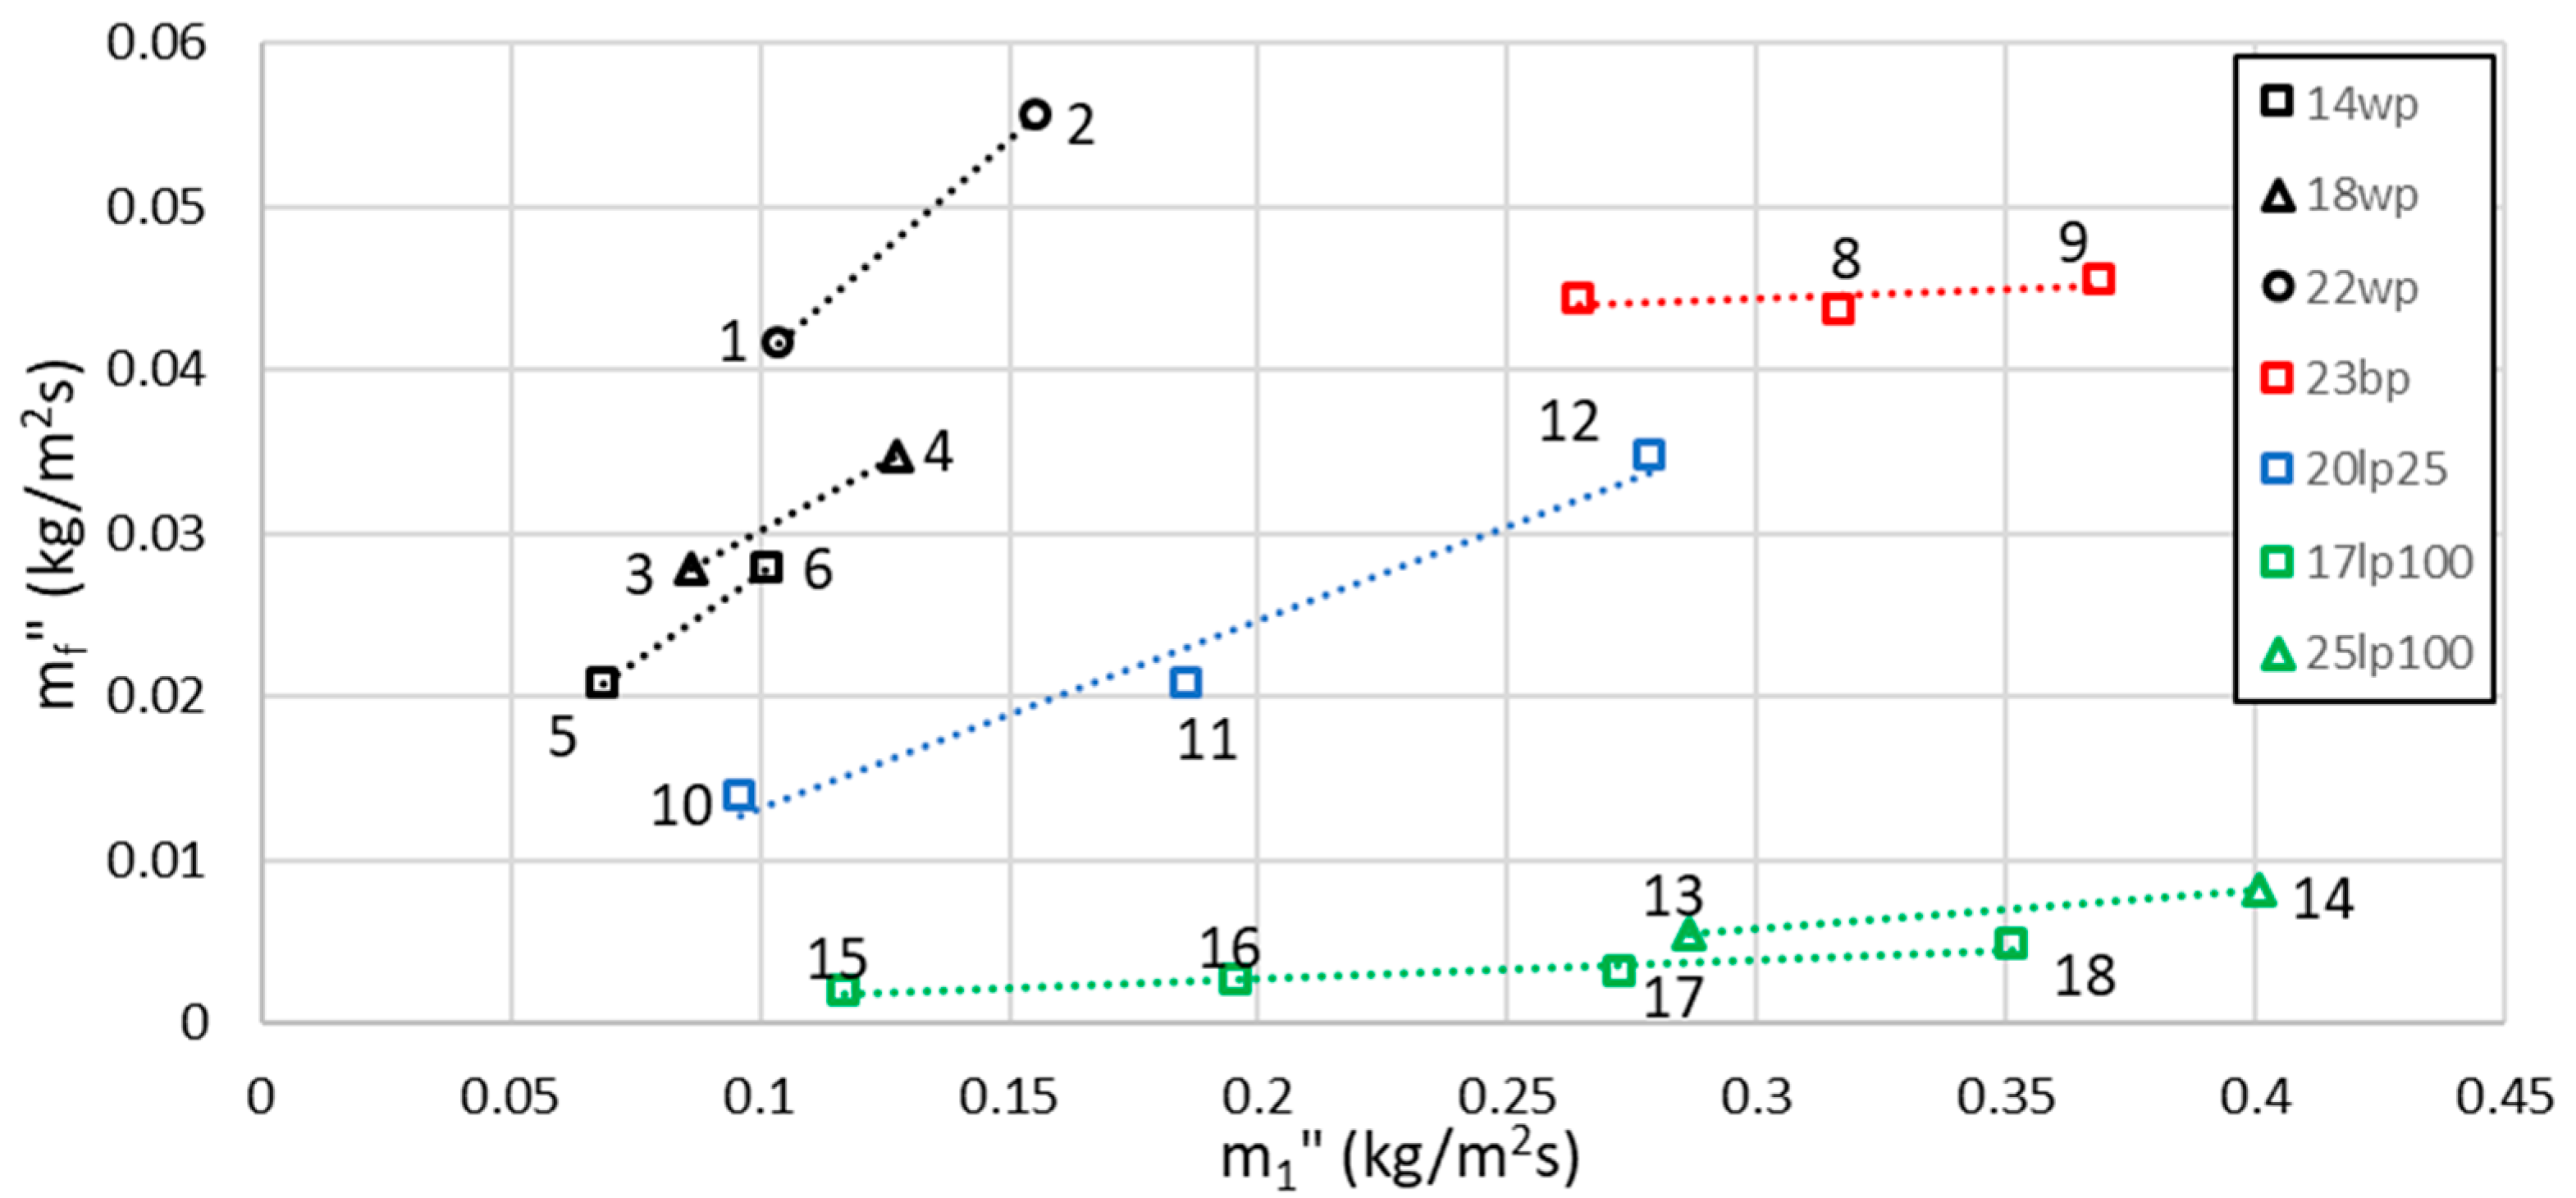
- In the study of the operating limits of each fuel, the best results for the non-commercial pellets were obtained for lp25, since the primary airflow needed to support combustion is relatively low for high fuel consumption. Furthermore, worse conditions were observed for the 100% leaf pellet, whose combustion required larger amounts of primary air to be employed, obtaining considerably low power values. Its high ash content led to a large accumulation of ash in the bed, which worsens combustion. In addition, a directly proportional relationship was found between the amount of primary air and fuel consumption.
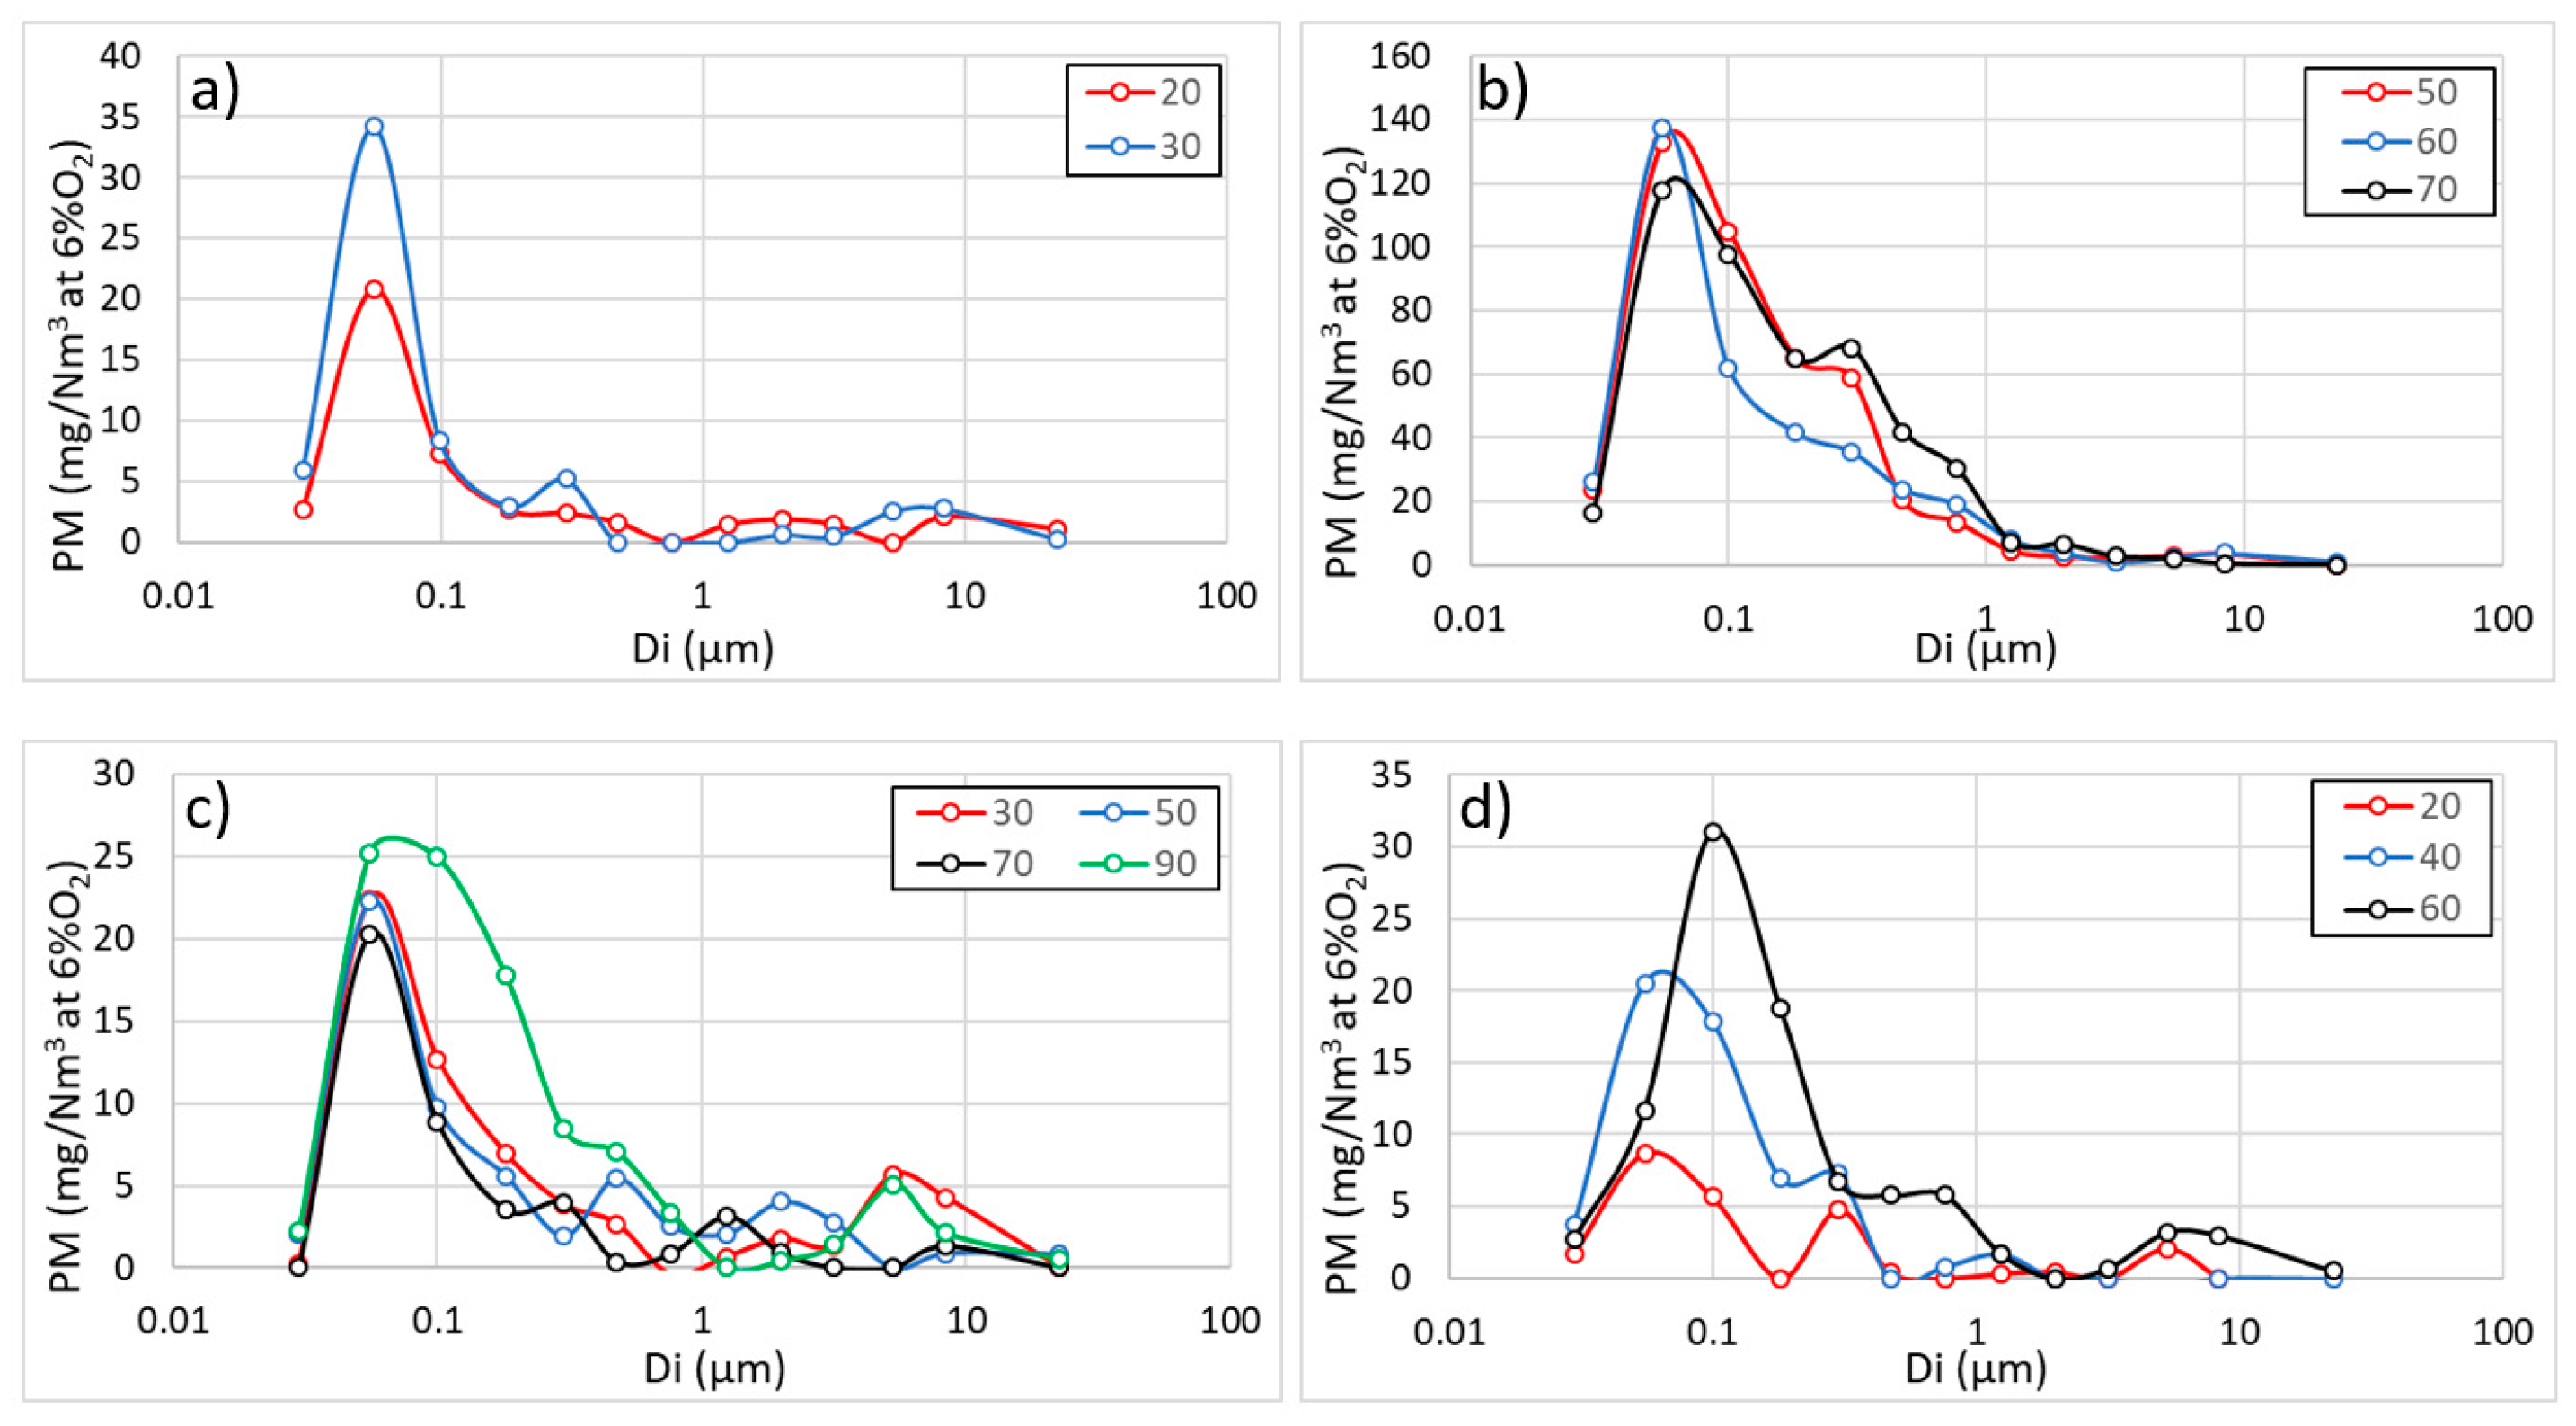
- The particulate matter emission ranges were determined for the three new pellets. The concentration for wp was between 17.5 and 18 mg/Nm3 in this facility. The concentrations for bp, lp100 and lp25 were between 257 and 325 mg/Nm3, 17 and 43 mg/Nm3 and 22 and 53 mg/Nm3, respectively. The particle-size distribution is unimodal for all cases except bp, in which it is mixed. However, all particles are smaller than 1 μm. The size of the particles increases with the amount of primary air, because an entrainment phenomenon occurred in the bed. The mass size distribution peak was located between 30 and 470 nm for bp and in the range of 30 to 300 nm for lp100 and lp25.
- The fouling rates were similar to that obtained for wp. In all cases, independently of the used parameters, the fouling rate was located between 4.1 and 26.4 mg/Nm3. Related to this factor, all fuels were shown to have a good behavior.
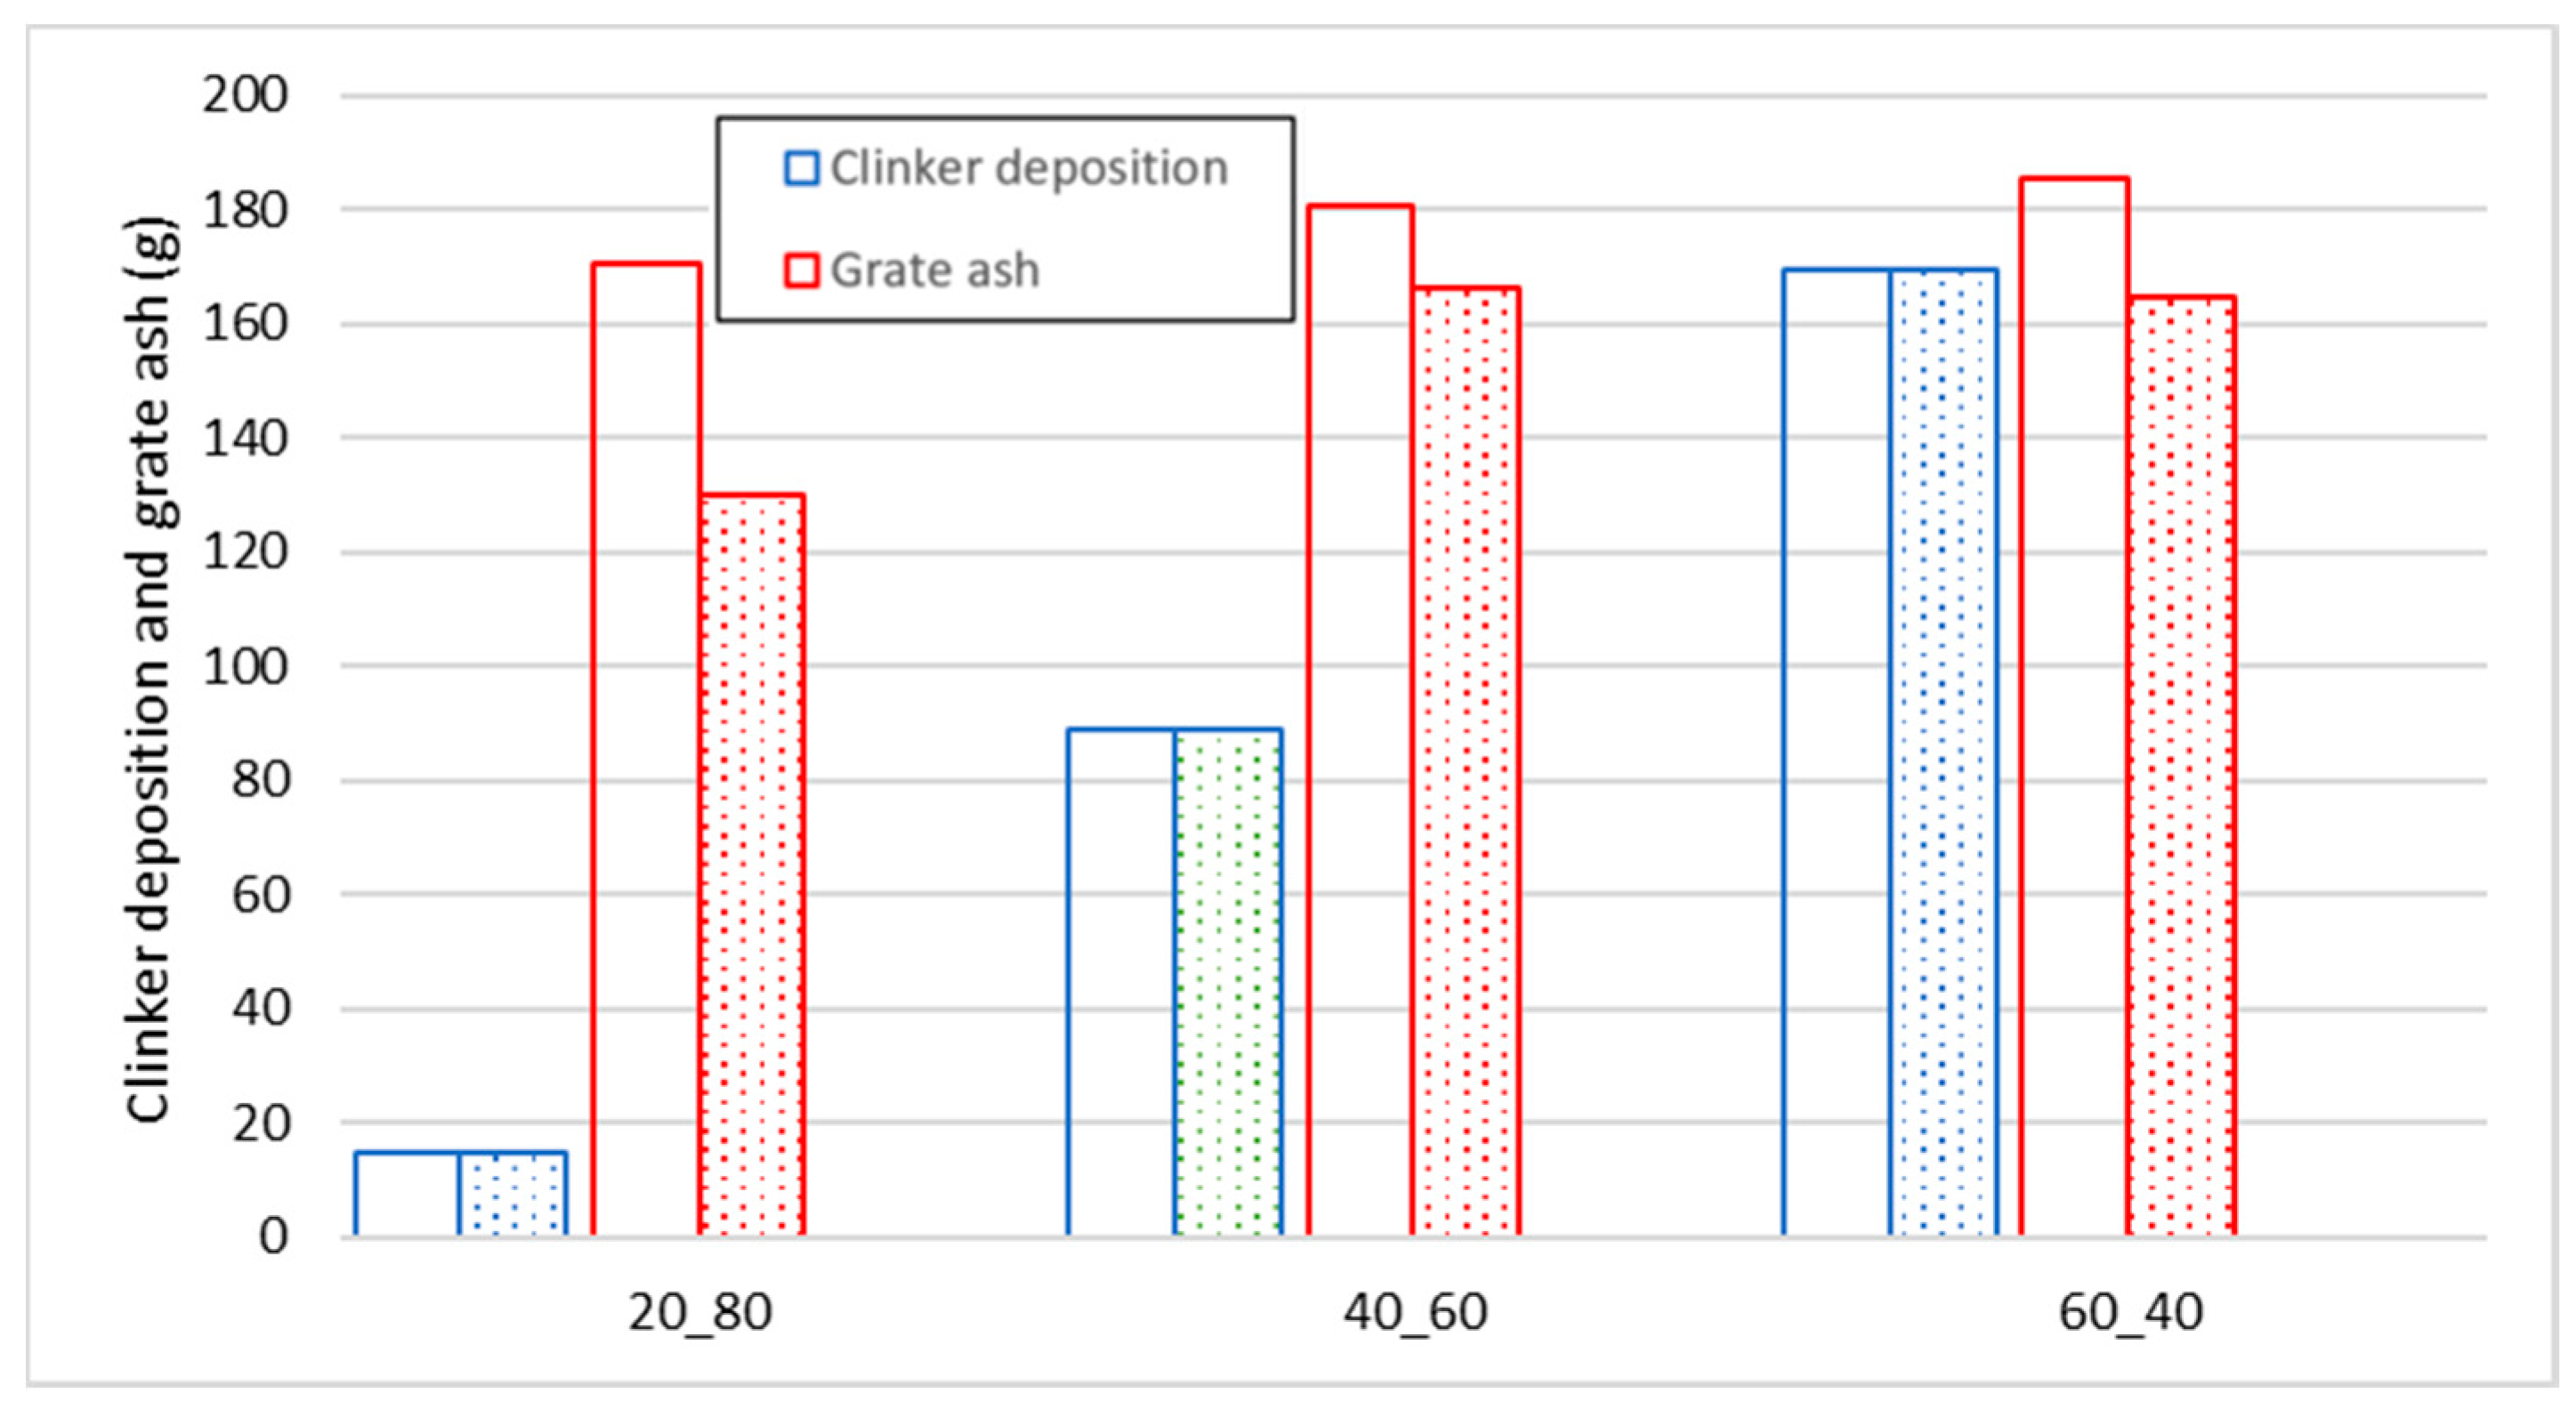
- Slagging residues were present to a greater extent for lp100, associated with the high ash content of the fuel. There are two kinds of slag: sintered deposition and grate ash. The first is not practically volatile, while the presence of volatile matter is notable in the second.
- A priori, under the tested conditions, bp and lp100 do not seem to be good choices for commercialization. However, lp25 is not a bad alternative, although its commercialization necessitates the use of additives to improve the fuel quality.
Acknowledgments
Author Contributions
Conflicts of Interest
Nomenclature
| ṁ1" | Primary air mass flow (kg/m2s) |
| ṁ2" | Secondary air mass flow (kg/m2s) |
| ṁf" | Fuel burning rate (kg/m2s) |
| ṁair" | Total air mass flow (ṁ1" + ṁ2") (kg/m2s) |
| Tg | Gas temperature (°C) |
| Tin | Water inlet temperature (°C) |
| fc | Unconfined yield strength (kPa) |
| ffc | Flow index |
| Greek Symbols | |
| δe | Effective angle of internal friction (°) |
| σ1 | Major consolidation stress (kPa) |
| ρb | Bulk density (kg/m3) |
| Ф | Angle of wall friction (°) |
| λ | Air-exceed ratio |
| ψ1 | Primary airflow (%) |
| ψ2 | Secondary airflow (%) |
| ψ | Air staging ratio ( %Primary air/%secondary air ) |
| Abbreviation | |
| bp | Barley pellet |
| DLPI | Dekati Low Pressure Impactor |
| lp25 | Pellet with 25% leaf–75% wood |
| lp100 | Leaf pellet |
| PM | Particulate matter |
| wp | Wood pellet |
References
- Luque, R.; Herrero-Davila, L.; Campelo, J.M.; Clark, J.H.; Hidalgo, J.M.; Luna, D.; Marinas, J.M.; Romero, A.A. Biofuels: A technological perspective. Energy Environ. Sci. 2008, 1, 542–564. [Google Scholar] [CrossRef]
- Verma, V.; Bram, S.; De Ruyck, J. Small scale biomass heating systems: Standards, quality labelling and market driving factors–an EU outlook. Biomass Bioenergy 2009, 33, 1393–1402. [Google Scholar] [CrossRef]
- Fiedler, F. The state of the art of small-scale pellet-based heating systems and relevant regulations in Sweden, Austria and Germany. Renew. Sustain. Energy Rev. 2004, 8, 201–221. [Google Scholar] [CrossRef]
- Verma, V.; Bram, S.; Gauthier, G.; De Ruyck, J. Evaluation of the performance of a multi-fuel domestic boiler with respect to the existing European standard and quality labels: Part-1. Biomass Bioenergy 2011, 35, 80–89. [Google Scholar] [CrossRef]
- Cardozo, E.; Erlich, C.; Alejo, L.; Fransson, T.H. Combustion of agricultural residues: An experimental study for small-scale applications. Fuel 2014, 115, 778–787. [Google Scholar] [CrossRef]
- Gilbe, C.; Ohman, M.; Lindström, E.; Boström, D.; Backman, R.; Samuelsson, R.; Burvall, J. Slagging characteristics during residential combustion of biomass pellets. Energy Fuels 2008, 22, 3536–3543. [Google Scholar] [CrossRef]
- Dias, J.; Costa, M.; Azevedo, J. Test of a small domestic boiler using different pellets. Biomass Bioenergy 2004, 27, 531–539. [Google Scholar] [CrossRef]
- Verma, V.; Bram, S.; Delattin, F.; Laha, P.; Vandendael, I.; Hubin, A.; De Ruyck, J. Agro-pellets for domestic heating boilers: Standard laboratory and real life performance. Appl. Energy 2012, 90, 17–23. [Google Scholar] [CrossRef]
- Roy, M.M.; Dutta, A.; Corscadden, K. An experimental study of combustion and emissions of biomass pellets in a prototype pellet furnace. Appl. Energy 2013, 108, 298–307. [Google Scholar] [CrossRef]
- Öhman, M.; Boman, C.; Hedman, H.; Nordin, A.; Boström, D. Slagging tendencies of wood pellet ash during combustion in residential pellet burners. Biomass Bioenergy 2004, 27, 585–596. [Google Scholar] [CrossRef]
- Örberg, H.; Jansson, S.; Kalén, G.; Thyrel, M.; Xiong, S. Combustion and slagging behavior of biomass pellets using a burner cup developed for ash-rich fuels. Energy Fuels 2014, 28, 1103–1110. [Google Scholar] [CrossRef]
- Lindström, E.; Larsson, S.H.; Boström, D.; Öhman, M. Slagging characteristics during combustion of woody biomass pellets made from a range of different forestry assortments. Energy Fuels 2010, 24, 3456–3461. [Google Scholar] [CrossRef]
- Regueiro, A.; Patiño, D.; Granada, E.; Porteiro, J. Experimental study on the fouling behaviour of an underfeed fixed-bed biomass combustor. Appl. Therm. Eng. 2017, 112, 523–533. [Google Scholar] [CrossRef]
- Regueiro, A.; Patiño, D.; Porteiro, J.; Granada, E.; Míguez, J.L. Effect of Air Staging Ratios on the Burning Rate and Emissions in an Underfeed Fixed-Bed Biomass Combustor. Energies 2016, 9, 940. [Google Scholar] [CrossRef]
- Febrero, L.; Granada, E.; Patiño, D.; Eguía, P.; Regueiro, A. A comparative study of fouling and bottom ash from woody biomass combustion in a fixed-bed small-scale boiler and evaluation of the analytical techniques used. Sustainability 2015, 7, 5819–5837. [Google Scholar] [CrossRef]
- Patiño, D.; Crespo, B.; Porteiro, J.; Míguez, J.L. Experimental analysis of fouling rates in two small-scale domestic boilers. Appl. Therm. Eng. 2016, 100, 849–860. [Google Scholar] [CrossRef]
- Rashidian, B.; Al-Abdeli, Y.M.; Patiño, D.; Guzzomi, F.G.; Yeoh, G.H. Effect of freeboard deflectors in the fixed bed combustion of biomass. Appl. Therm. Eng. 2016, 103, 543–552. [Google Scholar] [CrossRef]
- Jenkins, B.; Baxter, L.; Miles, T. Combustion properties of biomass. Fuel Process. Technol. 1998, 54, 17–46. [Google Scholar] [CrossRef]
- Teixeira, P.; Lopes, H.; Gulyurtlu, I.; Lapa, N.; Abelha, P. Evaluation of slagging and fouling tendency during biomass co-firing with coal in a fluidized bed. Biomass Bioenergy 2012, 39, 192–203. [Google Scholar] [CrossRef]
- Tchapda, A.H.; Pisupati, S.V. A review of thermal co-conversion of coal and biomass/waste. Energies 2014, 7, 1098–1148. [Google Scholar] [CrossRef]
- Pronobis, M. Evaluation of the influence of biomass co-combustion on boiler furnace slagging by means of fusibility correlations. Biomass Bioenergy 2005, 28, 375–383. [Google Scholar] [CrossRef]
- Ganesan, V.; Rosentrater, K.A.; Muthukumarappan, K. Flowability and handling characteristics of bulk solids and powders–A review with implications for DDGS. Biosyst. Eng. 2008, 101, 425–435. [Google Scholar] [CrossRef]
- Khodaei, H.; Guzzomi, F.; Yeoh, G.H.; Regueiro, A.; Patiño, D. An experimental study into the effect of air staging distribution and position on emissions in a laboratory scale biomass combustor. Energy 2017, 118, 1243–1255. [Google Scholar] [CrossRef]
- Gilbe, C.; Lindström, E.; Backman, R.; Samuelsson, R.; Burvall, J.; Ohman, M. Predicting slagging tendencies for biomass pellets fired in residential appliances: A comparison of different prediction methods. Energy Fuels 2008, 22, 3680–3686. [Google Scholar] [CrossRef]
- Chen, Q.; Zhang, X.; Bradford, D.; Sharifi, V.; Swithenbank, J. Comparison of emission characteristics of small-scale heating systems using biomass instead of coal. Energy Fuels 2010, 24, 4255–4265. [Google Scholar] [CrossRef]
- Johansson, L.S. Characterisation of Particle Emissions from Small-Scale Biomass Combustion; Chalmers Tekniska Högsk: Göteborg, Sweden, 2002. [Google Scholar]
- Wiinikka, H.; Gebart, R.; Boman, C.; Boström, D.; Öhman, M. Influence of fuel ash composition on high temperature aerosol formation in fixed bed combustion of woody biomass pellets. Fuel 2007, 86, 181–193. [Google Scholar] [CrossRef]
- Fernandes, U.; Costa, M. Formation of fine particulate matter in a domestic pellet-fired boiler. Energy Fuels 2013, 27, 1081–1092. [Google Scholar] [CrossRef]
- Wiinikka, H.; Gebart, R. Critical parameters for particle emissions in small-scale fixed-bed combustion of wood pellets. Energy Fuels 2004, 18, 897–907. [Google Scholar] [CrossRef]
- Gaegauf, C.; Wieser, U.; Macquat, Y. In Field investigation of nanoparticle emissions from various biomass combustion systems. In Proceedings of the International Seminar on Aerosol from Biomass Combustion, Zurich, Switzerland, 27 June 2001; pp. 81–85. [Google Scholar]
- Obernberger, I.; Brunner, T.; Bärnthaler, G. In Fine particulate emissions from modern Austrian small-scale biomass combustion plants. In Proceedings of the 15th European Biomass Conference & Exhibition, Florence, Italy, 17 May 2007; pp. 1546–1557. [Google Scholar]
- Johansson, L.; Tullin, C.; Leckner, B.; Sjövall, P. Particle emissions from biomass combustion in small combustors. Biomass Bioenergy 2003, 25, 435–446. [Google Scholar] [CrossRef]
- Theis, M.; Skrifvars, B.-J.; Hupa, M.; Tran, H. Fouling tendency of ash resulting from burning mixtures of biofuels. Part 1: Deposition rates. Fuel 2006, 85, 1125–1130. [Google Scholar] [CrossRef]


| Proximate Analysis 1 (%) | ||||
| wp | bp | lp100 | lp25 | |
| Moisture 2 | 7.33 | 6.92 | 7.74 | 9.79 |
| Volatile | 68.02 | 63.06 | 56.58 | 59.54 |
| Char | 24.10 | 21.62 | 22.71 | 23.42 |
| Ash | 0.55 | 8.39 | 12.97 | 7.26 |
| Elemental Analysis 3 (%) | ||||
| C | 48.99 | 44.69 | 44.14 | 45.65 |
| H | 6.45 | 6.03 | 5.55 | 6.35 |
| N | 0.23 | 0.55 | 1.12 | 0.61 |
| O 4 | 43.73 | 39.72 | 35.14 | 39.35 |
| S 5 | - | - | - | - |
| Ash Analysis (wt % of Dry Ash) | ||||
| Na2O | 0.71 | 0.03 | 0.01 | 0.49 |
| MgO | 9.45 | 1.62 | 0.60 | 3.80 |
| Al2O3 | 12.23 | 0.46 | 0.70 | 8.56 |
| SiO2 | 22.79 | 68.21 | 49.74 | 39.12 |
| P2O5 | 3.05 | 1.24 | 0.53 | 2.74 |
| SO3 | 6.68 | 2.78 | 0.69 | 2.42 |
| Cl | 1.41 | 0.74 | 0.11 | 0.61 |
| K2O | 16.63 | 13.98 | 1.43 | 8.95 |
| CaO | 22.48 | 10.67 | 43.93 | 28.58 |
| TiO2 | 0.58 | 0.02 | 0.19 | 0.42 |
| Cr2O3 | - | - | - | 0.02 |
| MnO | 1.38 | 0.04 | 0.55 | 0.41 |
| Fe2O3 | 2.23 | 0.18 | 1.41 | 3.50 |
| NiO | - | - | - | 0.01 |
| ZnO | 0.26 | 0.01 | 0.08 | 0.11 |
| Rb2O | - | - | - | 0.00 |
| SrO | 0.13 | 0.03 | 0.05 | 0.07 |
| ZrO2 | - | - | - | 0.01 |
| BaO | - | - | - | 0.16 |
| Fouling Index | ||||
| Alkali index | 0.05 | 0.67 | 0.11 | 0.39 |
| Base-acid ratio B/A | 1.45 | 0.39 | 0.94 | 0.94 |
| Slagging ratio SR | 40.02 | 84.54 | 51.99 | 52.15 |
| Fouling ratio FU | 25.08 | 5.40 | 1.34 | 8.90 |
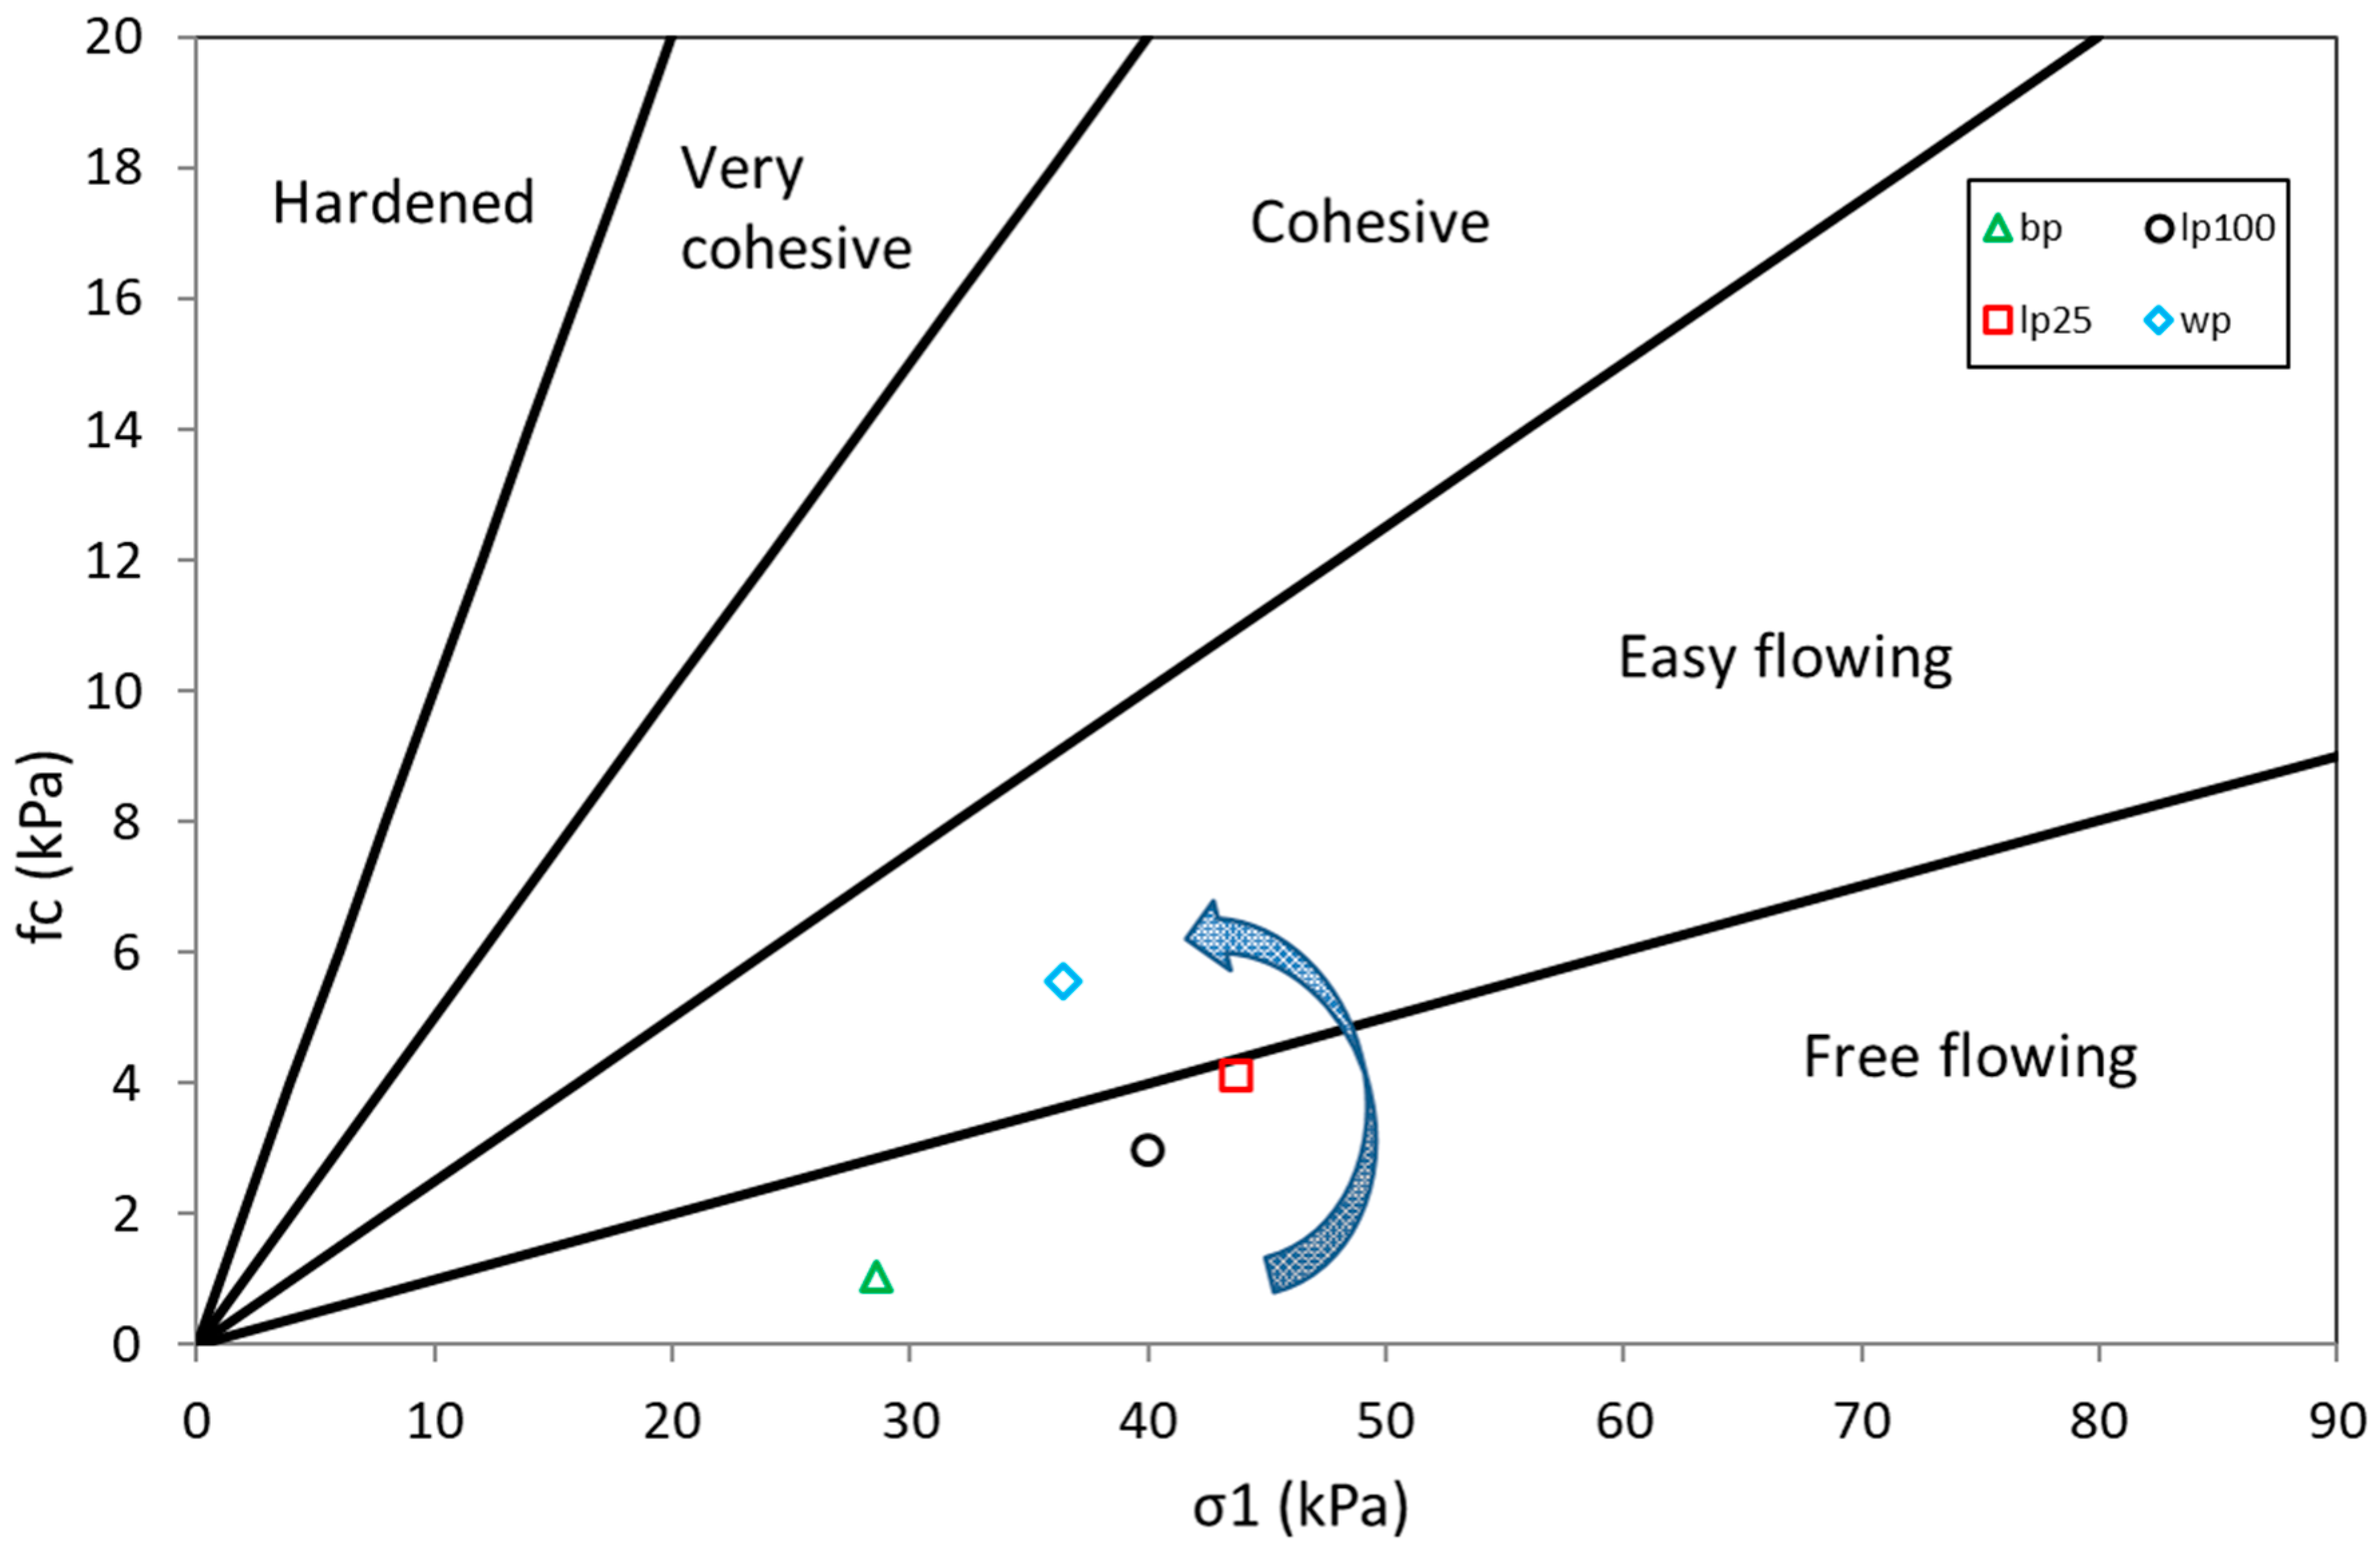
| Flow Index | ffc < 1 | 1 < ffc < 2 | 2 < ffc < 4 | 4 < ffc < 10 | ffc > 10 |
|---|---|---|---|---|---|
| Flowability | Hardened (not flowing) | Very cohesive | Cohesive | Easy flowing | Free flowing |
| Raw Material | ρb (kg∙m−3) | δe (°) | ffc (-) | Ф (°) |
|---|---|---|---|---|
| bp | 148 | 27.0 | 27.3 | 13.1 |
| lp100 | 245 | 43.1 | 13.4 | 9.6 |
| lp25 | 221 | 45.0 | 10.7 | 14.8 |
| wp | 204 | 46.7 | 6.6 | 13.3 |
| Total Duration (min) | Ignition (min) | Stability (min) | Shut Own (min) | |
|---|---|---|---|---|
| Pine pellet | 240 | 45 | 180 | 15 |
| Barley pellet | 105 | 45 | 45 | 15 |
| Leaf pellet 100% | 100 | 45 | 40 | 15 |
| Leaf pellet 25% | 150 | 45 | 90 | 15 |
| Relative Deviation (%) | ||
|---|---|---|
| Combustion parameters | Burning rate (kg/m2s) | 17.82 |
| Gas temperature (°C) | 6.81 | |
| Fouling | Deposited mass (g/m2h) | 10.04 |
| Attached mass (g/m2h) | 13.00 | |
| Total mass (g/m2h) | 6.90 | |
| Particulate matter | Particulate matter (mg/Nm3) | 4.13 |
| Gaseous emissions | O2 measured (%) | 1.70 |
| CO (ppm) | 8.24 | |
| NOx (ppm) | 5.77 | |
| CO2 (%) | 3.69 |
| Fuel | Test ID | ψ (%) |
|---|---|---|
| wp | 1, 3, 5 | 20 |
| 2, 4, 6 | 30 | |
| bp | 7 | 50 |
| 8 | 60 | |
| 9 | 70 | |
| lf25 | 10 | 20 |
| 11 | 40 | |
| 12 | 60 | |
| lf100 | 15 | 30 |
| 13, 16 | 50 | |
| 14, 17 | 70 | |
| 18 | 90 |
| Fuel Type | wp ref | References | wp | bp | lp100 | lp25 |
|---|---|---|---|---|---|---|
| PM (mg/Nm3) | 13–34 | [27,28,30,31] | 17.5–18 | 257–325 | 17–43 | 22–53 |
| Particle-size distribution | Unimodal and bimodal | [28] | Unimodal | Mixed | Unimodal | Unimodal |
| Particle-size peak (nm) | 30–300 | [30,32] | 30–100 | 30–470 | 30-300 | 30–300 |
| Conc. peak (mg/Nm3) | 28–240 | [31,32] | 20–35 | 120–140 | 20–27 | 8–31 |
| Fouling (g/m2h) | 7–28 | [13] | 6.3–14.4 | 18.5–24.3 | 6.9–26.4 | 4.1–15.3 |
© 2017 by the authors. Licensee MDPI, Basel, Switzerland. This article is an open access article distributed under the terms and conditions of the Creative Commons Attribution (CC BY) license (http://creativecommons.org/licenses/by/4.0/).
Share and Cite
Regueiro, A.; Jezerská, L.; Patiño, D.; Pérez-Orozco, R.; Nečas, J.; Žídek, M. Experimental Study of the Viability of Low-Grade Biofuels in Small-Scale Appliances. Sustainability 2017, 9, 1823. https://doi.org/10.3390/su9101823
Regueiro A, Jezerská L, Patiño D, Pérez-Orozco R, Nečas J, Žídek M. Experimental Study of the Viability of Low-Grade Biofuels in Small-Scale Appliances. Sustainability. 2017; 9(10):1823. https://doi.org/10.3390/su9101823
Chicago/Turabian StyleRegueiro, Araceli, Lucie Jezerská, David Patiño, Raquel Pérez-Orozco, Jan Nečas, and Martin Žídek. 2017. "Experimental Study of the Viability of Low-Grade Biofuels in Small-Scale Appliances" Sustainability 9, no. 10: 1823. https://doi.org/10.3390/su9101823
APA StyleRegueiro, A., Jezerská, L., Patiño, D., Pérez-Orozco, R., Nečas, J., & Žídek, M. (2017). Experimental Study of the Viability of Low-Grade Biofuels in Small-Scale Appliances. Sustainability, 9(10), 1823. https://doi.org/10.3390/su9101823