Article

Changes in Service and Associated Ridership Impacts near a New Light Rail Transit Line

1
College of Architecture and Design, University of Ulsan, Ulsan City 44610, Korea
2
Sol Price School of Public Policy, University of Southern California, Los Angeles, CA 90089, USA
3
Department of Urban Planning and Public Policy, University of California, Irvine, CA 92697, USA
4
Department of Urban & Regional Planning, San Jose State University, San Jose, CA 95192, USA
5
School of Urban and Regional Planning, University of Iowa, Iowa City, IA 52242, USA
*
Author to whom correspondence should be addressed.
Sustainability 2017, 9(10), 1827; https://doi.org/10.3390/su9101827
Submission received: 24 August 2017 / Revised: 2 October 2017 / Accepted: 9 October 2017 / Published: 11 October 2017
(This article belongs to the Section Sustainable Urban and Rural Development)

Abstract

:
Los Angeles (LA), for many years a city with limited rail transit, is substantially expanding its public transit system. This paradigm change in transportation policy and investment creates new requirements for monitoring. One area needing evaluation is whether new, high quality transit options, such as light rail, near existing transit services increase sustainable transportation mode shares and reduce car travel. Few studies have explored light rail’s role as a catalyst to increase overall transit use and achieve sustainability goals within an auto-oriented city like LA. Metro’s data show that trips taken on its bus and rail system dropped overall by 10.5% between 2009 and 2016, but its rail ridership grew 21% during the same period due to the debut of the Gold Line and Expo Line extensions. We analyze changes to bus service and associated ridership impacts that resulted from the opening of these two LRT lines in LA. The immediate effect of the city’s bus service changes along the Gold Line light rail extension appear to be associated with a net “bus plus rail” ridership decline in that corridor. In contrast, the Expo Line corridor experienced an initial increase in ridership during the two years immediately after its opening, possibly because the bus service was not reduced by the same magnitude as along the Gold Line extension. Our findings indicate that changes in bus service made to coincide with the introduction of new light rail transit (LRT) can negatively affect the overall transit ridership in the corridor. Planners and policy makers should closely monitor changes in bus service and ridership associated with new rail transit to ensure investments results in an overall net increase in more sustainable travel.

1. Introduction

Los Angeles (LA) is pursuing possibly the most ambitious rail transit investment program in the United States. The LA Metropolitan Transportation Authority’s (Metro) long-range plan committed funds to six new rail transit lines scheduled to open between 2011 and 2019. In total, those six lines will increase the LA Metro rail network from 73 to approximately 120 miles (116.8 km to approximately 192 km), making it larger than the current Washington DC Metro system. This impressive commitment to transit infrastructure is playing out in the context of ambitious state-level greenhouse gas (GHG) emission reduction targets to enhance sustainable urban development. California’s Sustainable Communities and Climate Protection Act of 2008, known as Senate Bill 375 (SB375), requires metropolitan planning organizations (MPOs) to develop coordinated land use–transportation plans that meet state GHG reduction requirements. The LA region’s MPO, the Southern California Association of Governments (SCAG), through its Regional Transportation Plan/Sustainable Communities Strategy [1], has targeted increased development in transit corridors as a major component of its overall GHG reduction effort. In LA County, much of the funding for transit improvements has come from local sales tax increases approved by voters with two-thirds majorities, as required by state law. This infusion of capital has helped to remedy past budget uncertainties due to fluctuating transit funding commitments at the federal and state levels.
Recent studies have attempted to quantify the GHG reduction attributable to public transportation in the US. According to calculations by the US PIRG Education Fund [2], Metro’s 2006 operations resulted in a net GHG reduction equivalent to 862 thousand metric tons of CO2. This placed Metro 8th in the US, but at a level less than one-tenth of New York’s system and less than half of Washington D.C.’s system. However, potential gains in GHG reductions and SCAG’s planning for transit-oriented development stress the importance of understanding the impact of transit infrastructure and service provision on travel behavior.
There is debate about what form of urban transport system is more sustainable. This issue has been discussed at length in the literature (e.g., [3,4,5,6,7,8,9]). Many agencies nationally and internationally stated the need for urban transport to become more sustainable, providing a competitive alternative to car driving. There can be little doubt that certain transportation systems are more efficient in terms of reducing private automobile use or the related aim of reducing energy consumption or carbon dioxide emissions. One of critical issues in sustainable transport systems is whether high-quality public transport services can attract new ridership or solely draw ridership from existing transit users [10].
Questions remain, in particular, about light rail transit’s (LRT) role as a catalyst to increase overall transit use and reach sustainability goals, at least in the context of an auto-oriented city like LA. The present studies demonstrated that U.S. public transit agencies, including the Los Angeles County Metro Transit, have invested to extend the infrastructures for public transport since 1990s but increasing investments could not necessarily increase ridership [11,12]. In its 2017 report, the LA Times stated that “since 2009, Metro has opened four new rail extensions at a cost of more than $4 billion. In the same period, rail ridership soared 21%, but bus trips—a much larger share of overall ridership—dropped 18%” [13]. Metro’s data show that trips taken on the L.A. County Metro’s bus and rail system dropped in 2016 by nearly 6%, largely due to continuing declines in bus patronage [14]. LA Metro system has experienced rapid growth of light rail ridership due to the debut of the Gold Line and Expo Line extensions but also a precipitous drop in bus ridership.
There are many plausible explanations for the overall drop in ridership even as new high-quality light rail service is coming online. One possibility is that the reduction in access points for bus versus LRT has reduced the overall transit service area in corridors in which bus routes were replaced by LRT. Another is that restructuring of lines that could serve as feeders to LRT have been less than optimal. A third possibility is that Metro is prioritizing service in LRT station areas where future transit oriented development is most likely. Advocacy groups have pointed out that Metro’s restructuring has often been at the expense of bus riders, who tend to be poorer and include a higher percentage of ethnic minorities [15]. The first two possibilities raise questions about service design, while the last raises questions of equity.
This study explores some of the reasons for recent decreases in transit ridership that are related to changes in transit service. To examine the effects of the two most recently opened LRT lines, the Expo Line and the Gold Line, we compare key transit performance metrics before and after the opening of each of these lines. We first compare changes in total transit ridership of the Expo Line and the Gold Line extension to explore whether these LRT openings were associated with increased system-level transit ridership. Second, we examine trends in both bus and LRT ridership along the two corridors to identify corridor-wide changes to bus ridership. Third, we compare the changes in bus service system-wide against those in new LRT corridors to examine the effects of network restructuring and service changes on performance. We also examine the potential changes in ridership associated with the new LRT service and corresponding changes to nearby bus service.
Our analysis and findings relate to an older literature on how agencies modify bus routes when LRT service opens (e.g., [16,17]). We add to the literature in two ways. First, our analysis updates this work at a time when cities worldwide are building or expanding LRT systems. Second, we document that the combined “bus plus rail” corridor transit ridership decreased along LA’s Gold Line extension in the year following the opening of that LRT line, but total transit ridership initially increased along LA’s Expo Line. We show associations between the net transit ridership gains or losses in the corridors and changes in bus service. This evidence, while descriptive, moves the literature forward in assessing the still somewhat under-studied question of how bus service changes (which are common when new LRT systems open) are associated with the sustainability characteristics (e.g., ridership) of the overall transit system. We also document that, after 2014, system-wide bus ridership declines have been larger than any ridership effects that are specific to either the Expo or Gold Line LRT corridors.
In the next section, we contextualize our research within the existing body of ridership research, focusing on LRT. This is followed by an overview of Metro’s Expo Line and the 2009 Gold Line extension. Next, we evaluate ridership and service changes, before and after the opening of these LRT projects. Finally, we conclude with a discussion of some policy implications that flow from this research.

2. Literature Review

Much of the existing literature on the impacts of introducing a new LRT service focus on comparing ridership counts, capital and operating costs, and transit service and land use before and after light rail service introduction to provide insights into the actual ridership gains and costs, as well as impacts of major transit investments. Most studies of ridership impacts use traditional data, including questionnaires and travel surveys. They focus on ridership changes that occur with the introduction of new or improved transit services. These include work by Gomez-Ibanez [16] on the ridership and operating costs of new light rail services in San Diego, Calgary, and Edmonton, and work by Allen and Hufstedler [17] on the ridership characteristics of the transit systems serving large areas with relatively low population densities in Dallas and Houston, Texas.
Gomez-Ibanez [16] was one of the first to examine total (bus and rail) ridership changes in a new LRT corridor and to present results pointing to the possibility of varying impacts. After the introduction of an LRT line in San Diego, total transit ridership along the route increased by about 22% after accounting for new LRT ridership and reductions in ridership of bus routes that were eliminated or that competed with the new LRT line. The author found only 2% increase in total transit share of trips after the opening of a new LRT line in Calgary and concluded that LRT in Edmonton could have been associated with an increase in total transit ridership of between 9% and 19%, but the contribution of LRT remained unclear since the bus service in the area had been expanded two years before the LRT service began.
Allen and Hufstedler [17] compared ridership between the Dallas Area Rapid Transit (DART) bus-and-rail system and Houston’s Metro bus system, using the National Transit Database for the period 1985 through 2003. Houston’s approach, through 2003, had been the provision of a high level of bus service incorporating an extensive system of park-and-ride facilities, while DART’s approach was the introduction of a light rail system complemented by bus service in the Dallas area. The authors found that Houston’s commitment to its bus system achieved both higher service levels and higher bus ridership than DART achieved. DART’s light rail system resulted in increases in system ridership although there was a downturn in bus system ridership. The authors attributed this decreased bus ridership to the restructuring of some bus routes during LRT implementation.
Other research on how bus or vehicle ridership changes with the implementation of rail transit has adopted a wide array of methodological approaches using statistical analyses, interviews, surveys, and geospatial tools. Research using statistical analyses typically focuses on evaluating the relative causal influences of internal and external factors on ridership [18,19,20,21,22]. Some studies, however, conducted interviews with transit system managers and focused on how some agencies were more successful than others in increasing transit ridership and how the managers of transit systems perceive influences of various factors on ridership [23,24]. Other studies conducted attitudinal surveys of passengers to identify the factors influencing passenger satisfaction [25,26]. Some recent empirical studies examined the spatial patterns and interactions of ridership utilizing geospatial data. For instance, Li et al. [27] examined the interactions between a newly opened subway and taxi service in Wuxi, China from a spatial perspective using GPS trajectory data to explore taxi pathways relative to spatial effects of the subway. Zhang and Wang [28] used a network Kriging method to estimate the subway ridership of a new subway line, the Second Avenue Subway in New York City.
Overall, existing practice and research (e.g., [16]) indicate the potential that reductions in bus routes made to coincide with a new LRT service could countervail the new LRT ridership. The current study uses transit boarding data for bus and LRT to examine ridership changes adjacent to the Expo and Gold Lines. It provides important case studies that contribute to the literature because few studies have holistically examined the impact of a new LRT service on corridor-and system-wide ridership. Our findings expand the literature on the “total transit” impact of LRT by providing two illustrative case studies of recent LRT openings in a city that has traditionally been auto-oriented but has a maturing and rapidly growing rail transit system.

3. Ridership and Service Changes

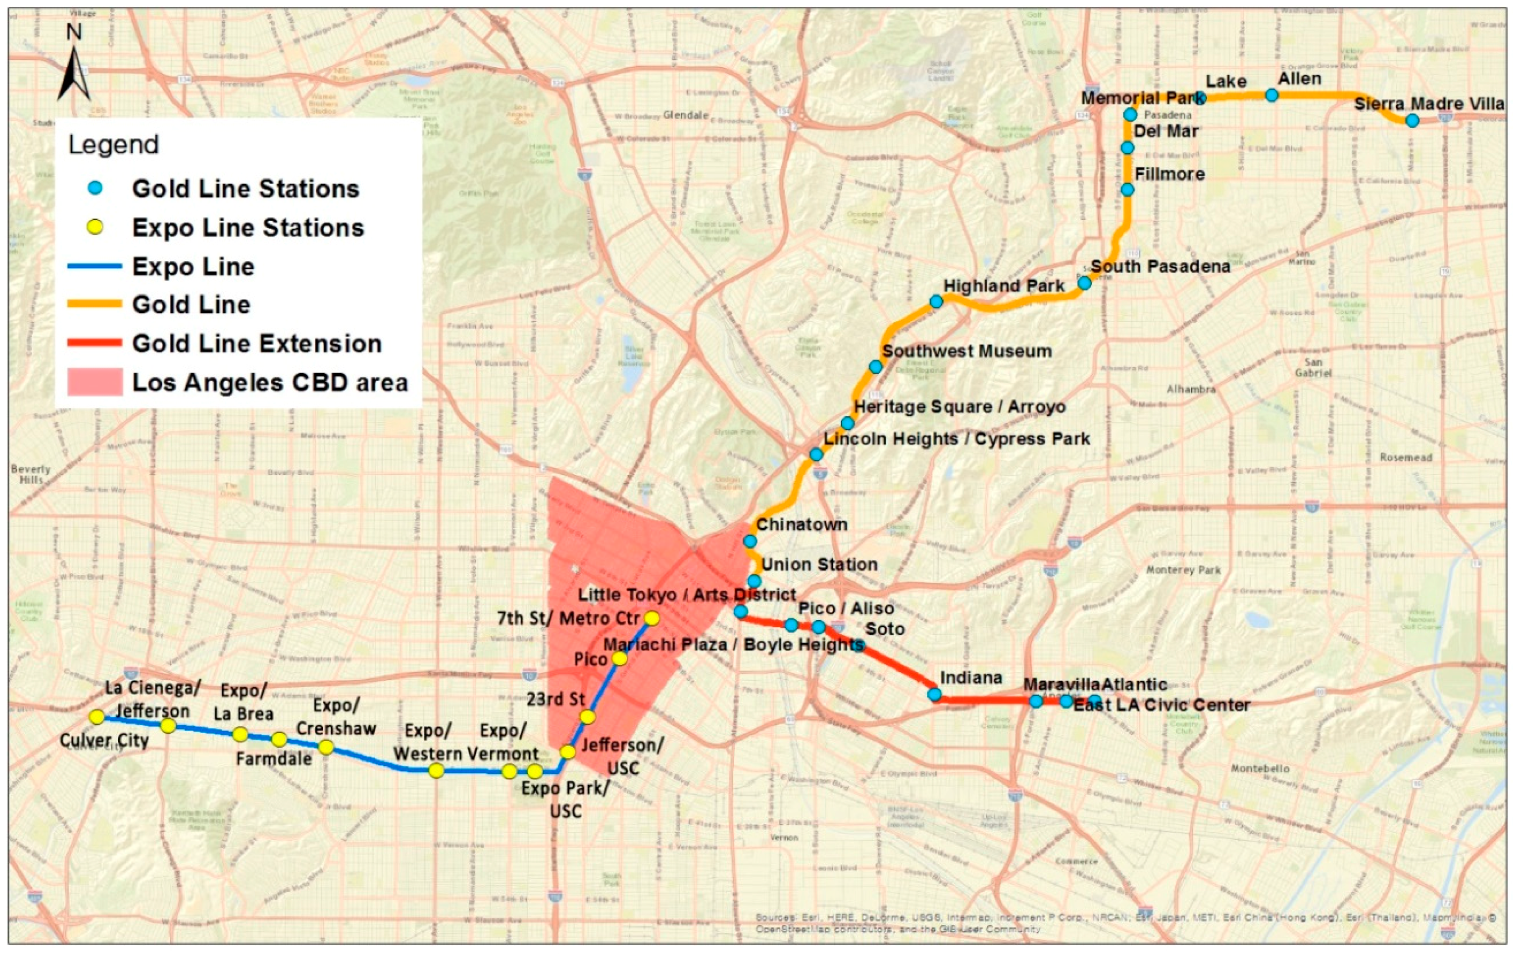
3.1. Overview of the Expo and Gold LRT Lines
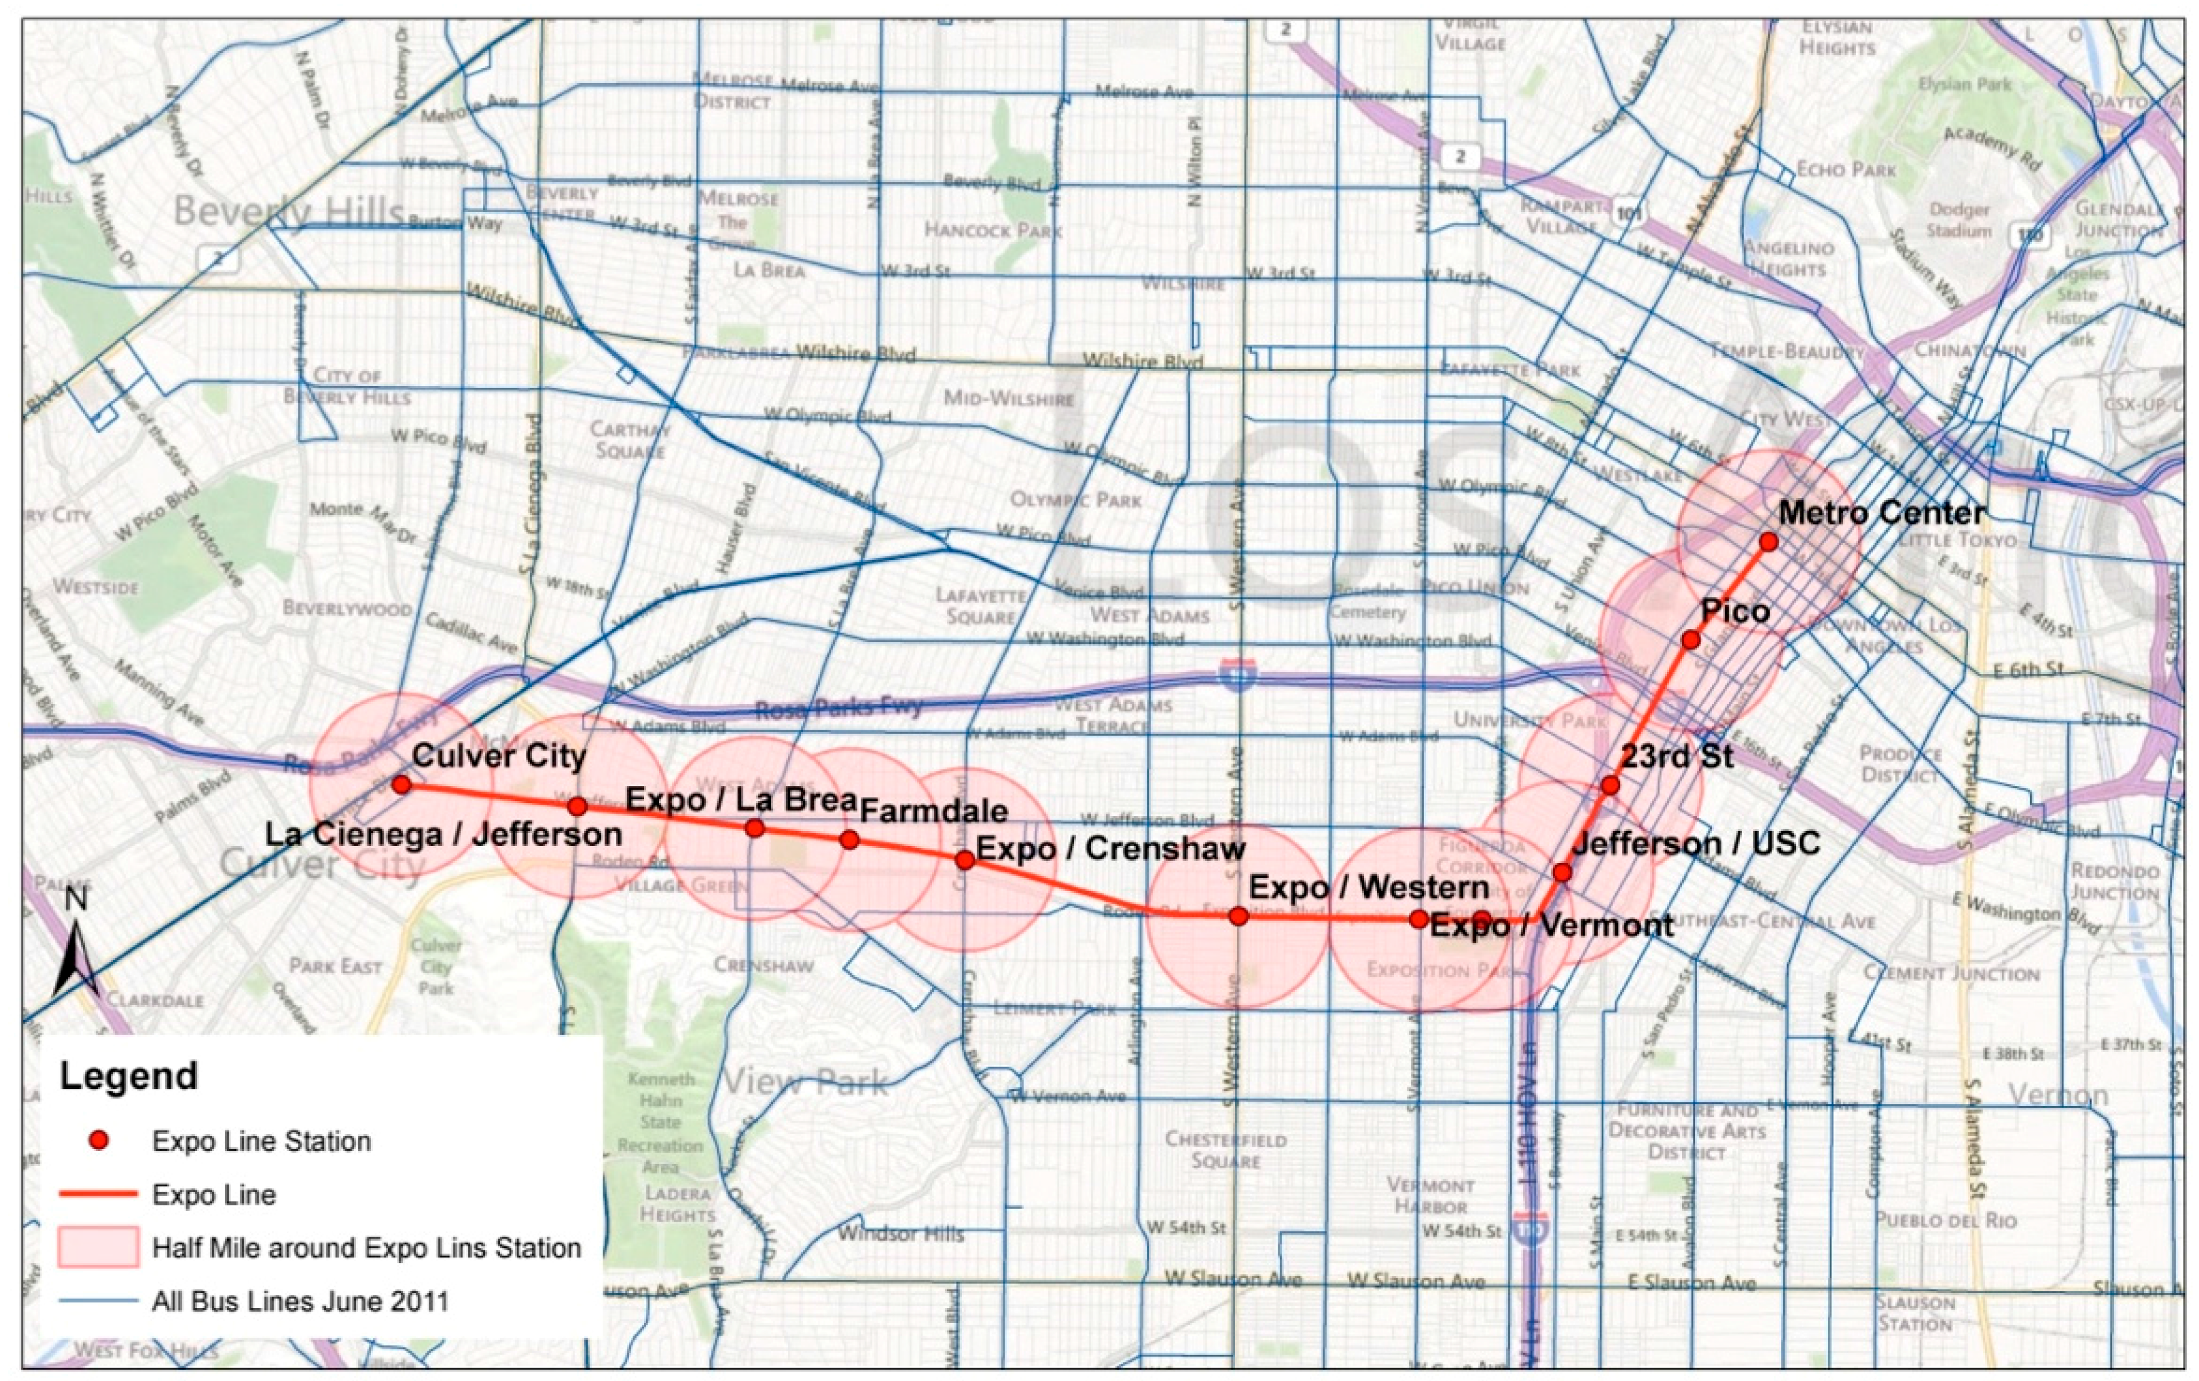
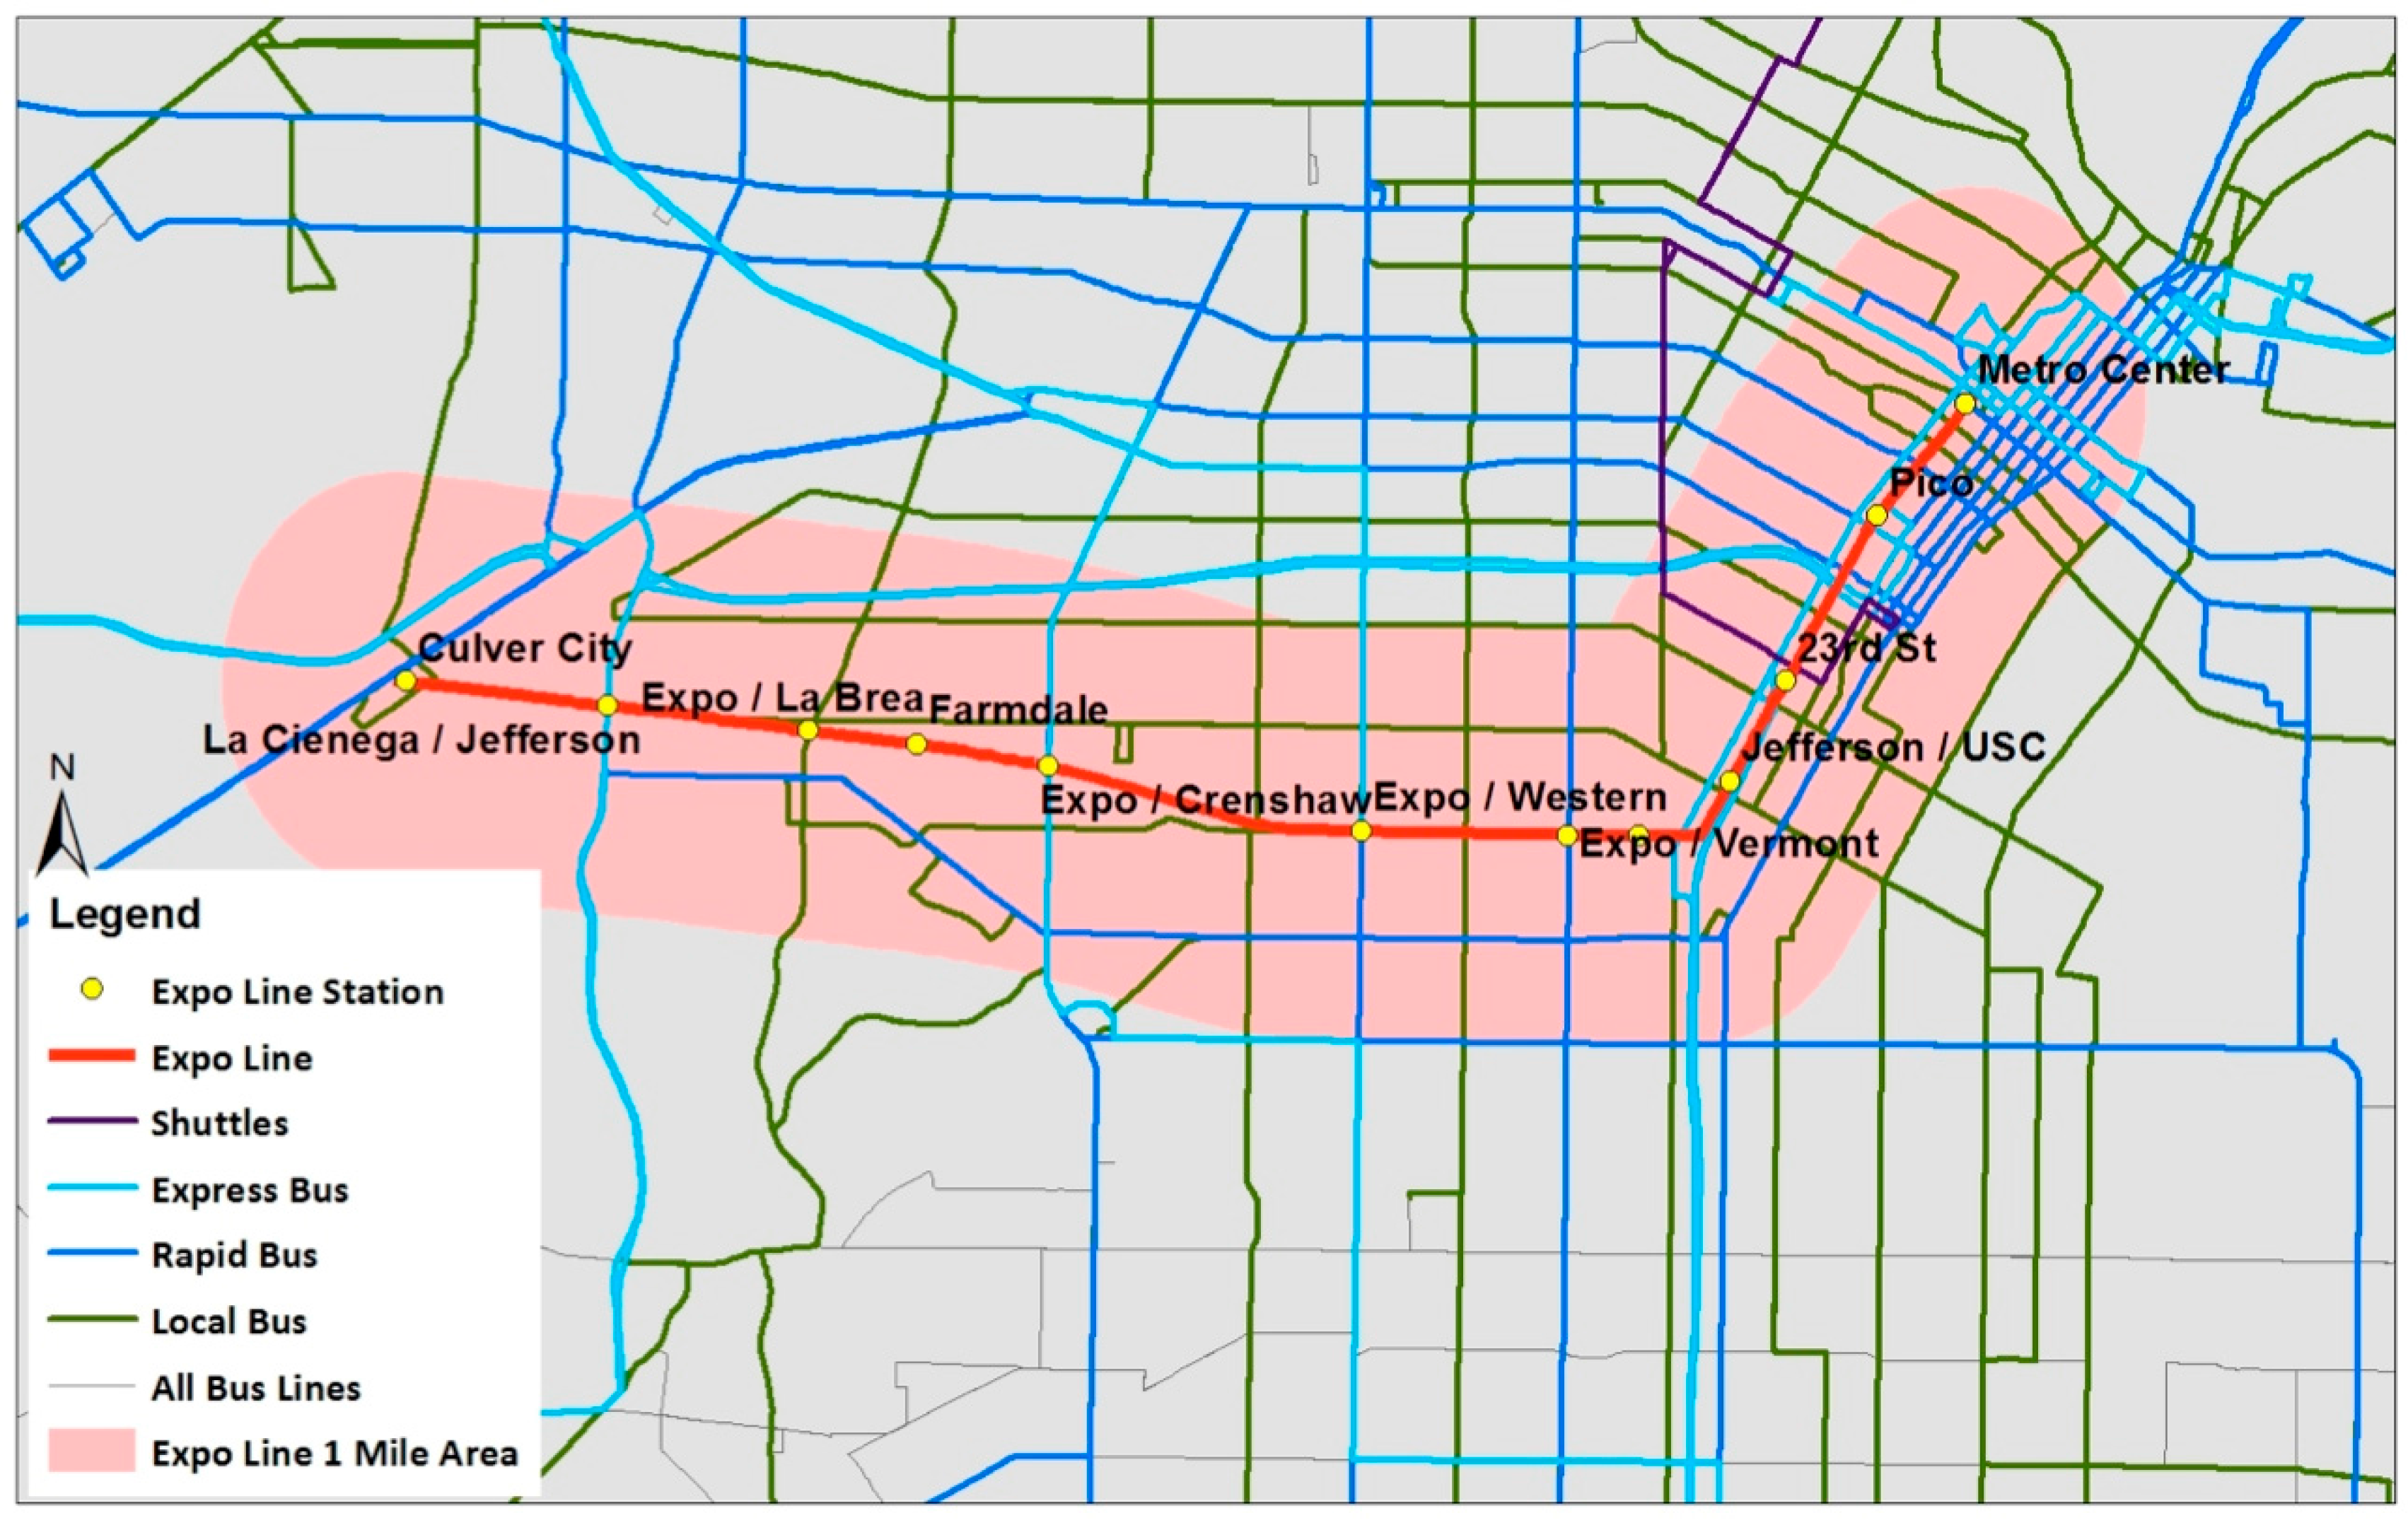
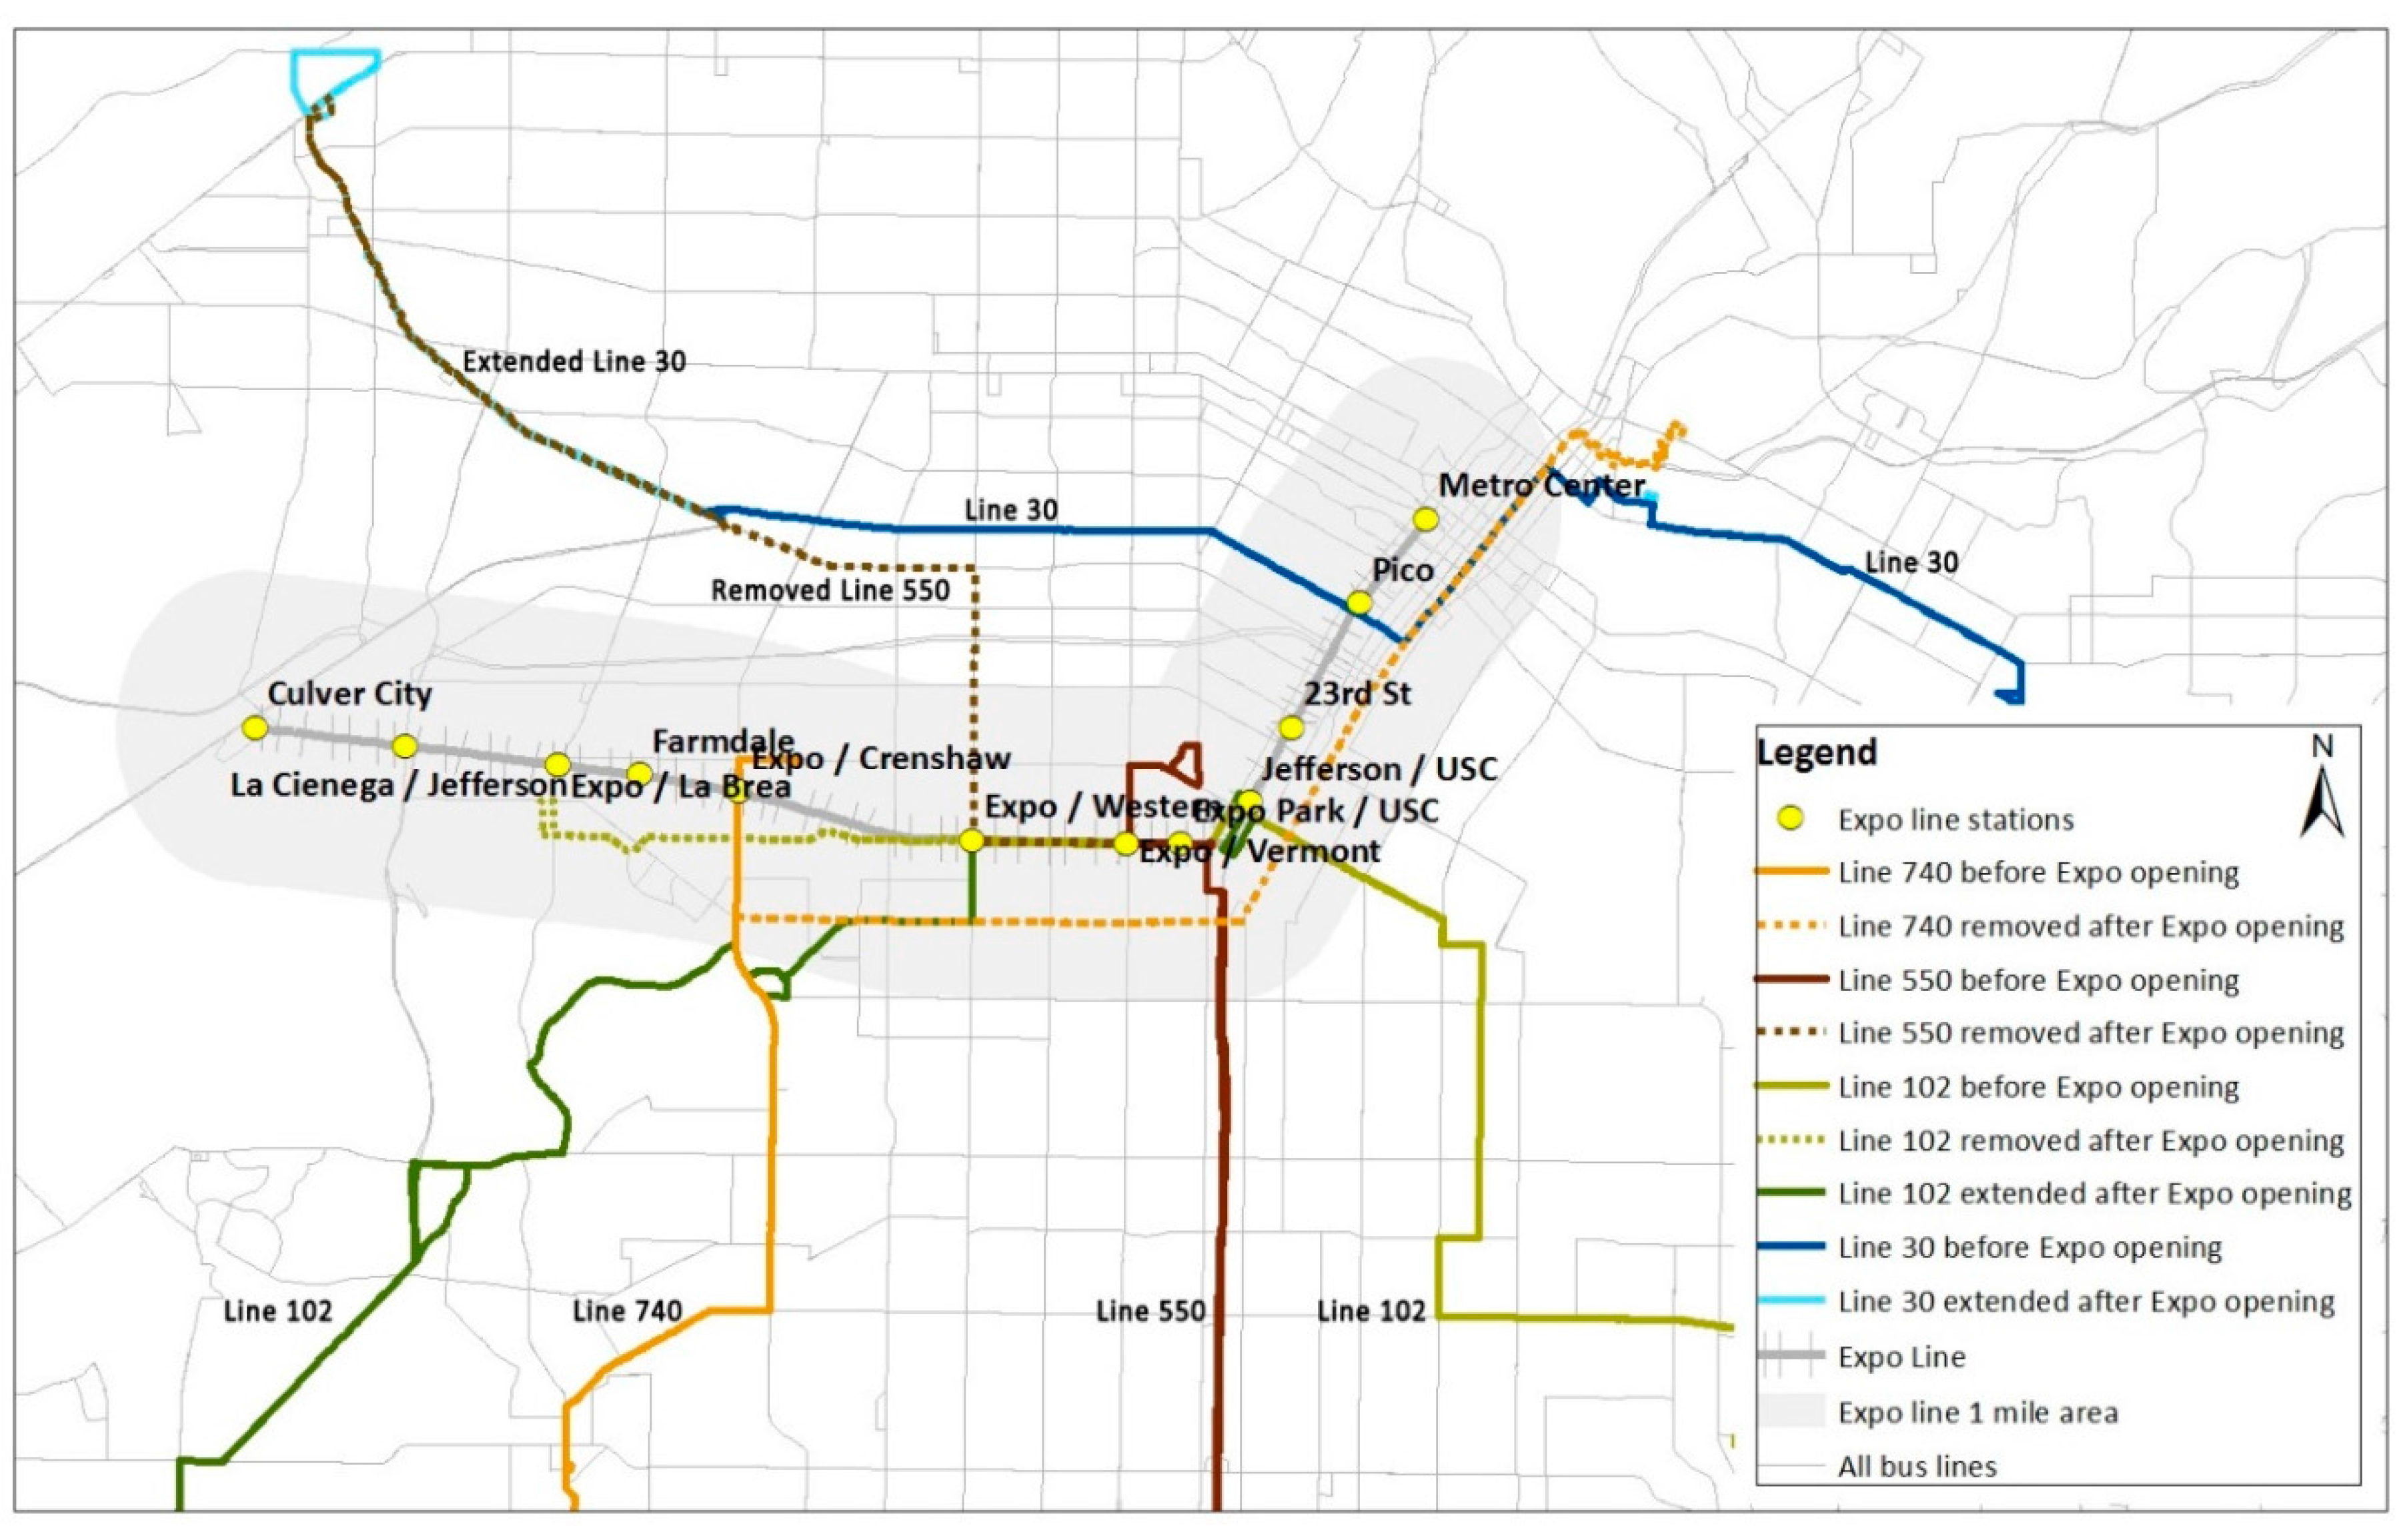
3.1.1. Expo Line

The Expo Line is an LRT line in the LA metropolitan area that extends south and west from downtown LA to downtown Santa Monica. The line was built in two phases. Phase 1, opened in April 2012, runs 8.7 miles (14 km) from downtown LA westward to Culver City near the junction of the I-405 and I-10 freeways (see Figure 1). Service began on the eastern portion of the Phase 1 section on 28 April 2012, and service was extended to Culver City on 20 June 2012. Phase 1 of the Expo Line has 12 stations, 10 of which were newly constructed (Figure 1). Phase 2 from Culver City to Santa Monica, which was a focus of this study, opened in May 2016.
Demographic characteristics for Expo Line Phase 1 corridor station areas (defined as half-mile-radius buffer areas from stations) were obtained from the 2010–2014 American Community Survey (ACS) block group data. The average population of the half-mile-radius areas of Expo Line Phase 1 stations was approximately 11,000 and the average annual household median income was approximately $36,000, but income levels varied between eastern and western portions of the corridor (Figure 2). Half of the Phase 1 corridor stations in the eastern portion of the line had an annual median household income level below $30,000 per year, but the westernmost station, Culver City, had an annual median household income of $65,000.

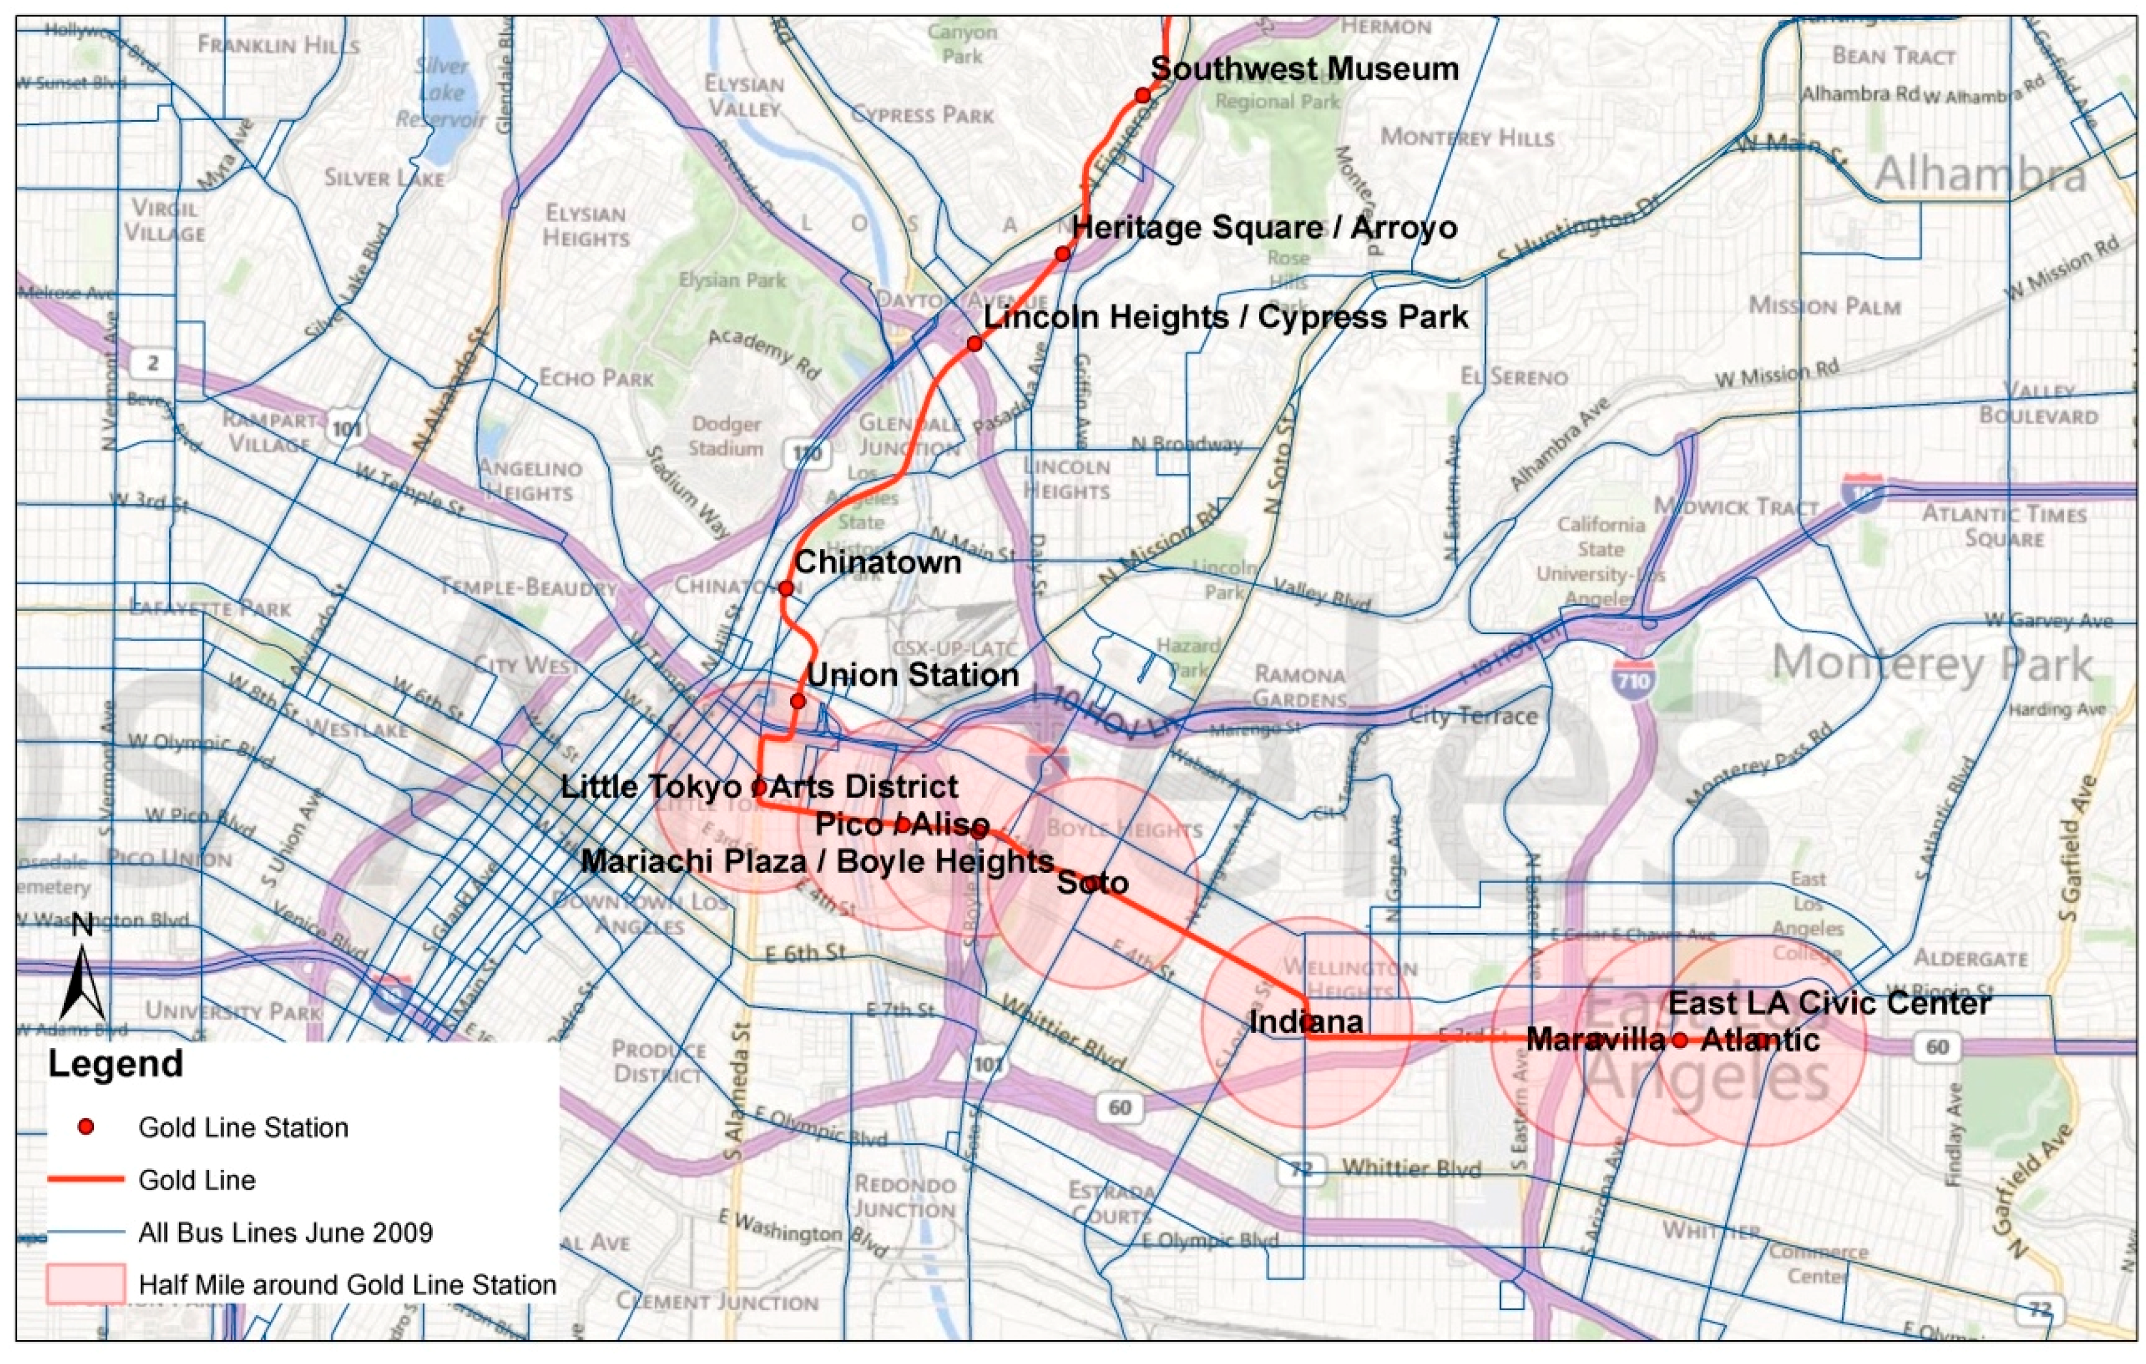
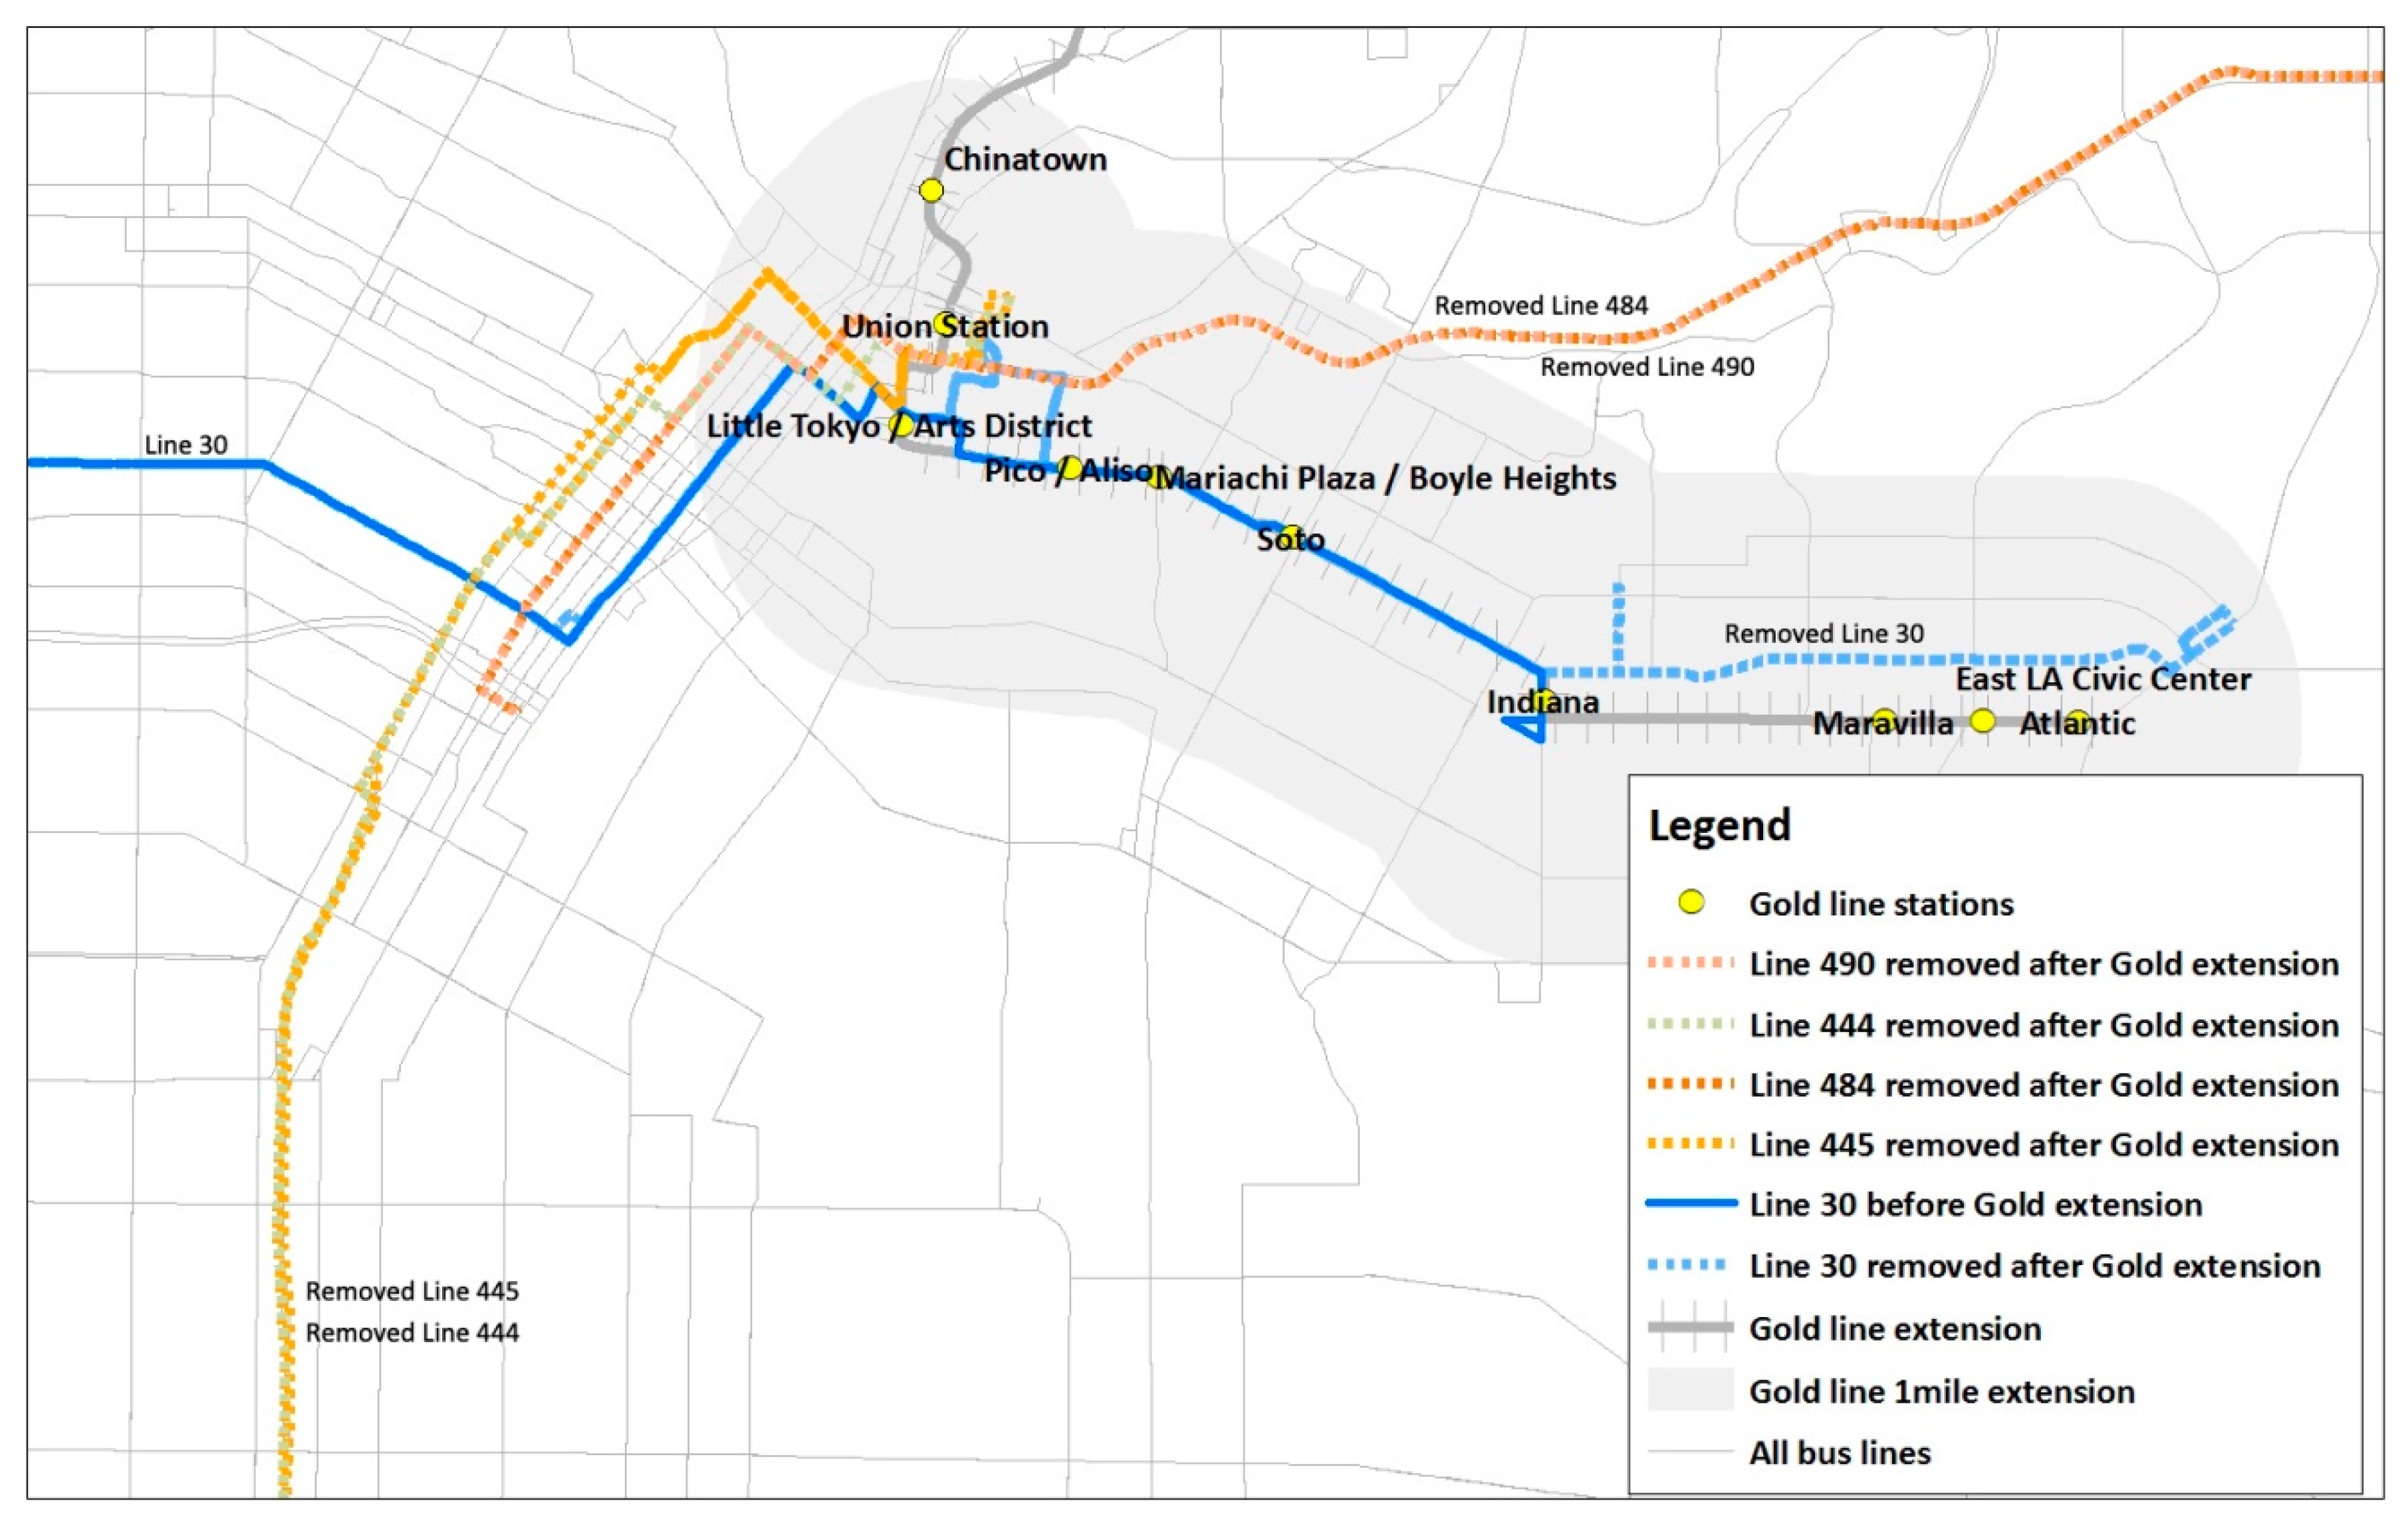
3.1.2. Gold Line and Gold Line Extension

The Gold Line runs from Pasadena to East LA via downtown LA. Phase 1 was comprised of twelve stations which began service in June of 2003 running from Union Station in downtown LA to east Pasadena. In November 2009, Metro opened the second phase of the Gold Line serving eight stations, from Union Station to Atlantic Station. This Gold Line Eastside extension, which is the focus of this study, is a six-mile (9.6 km) LRT line that serves ethnically diverse and culturally rich communities including the Little Tokyo–Arts District, Boyle Heights, and East LA (Figure 1).
The average population of the half-mile-radius areas around each Gold Line Eastside Extension station was approximately 10,500, similar to that of the Expo Line Phase 1 station areas (Figure 3). The average household median income of the Gold Line areas was $38,000, slightly higher than that of the Expo Line study areas. While income levels of Expo Line station areas varied between eastern (lower income) and western (higher income) areas, annual household income levels for the Gold Line station areas were relatively consistent, ranging between $30,000 and $44,000.

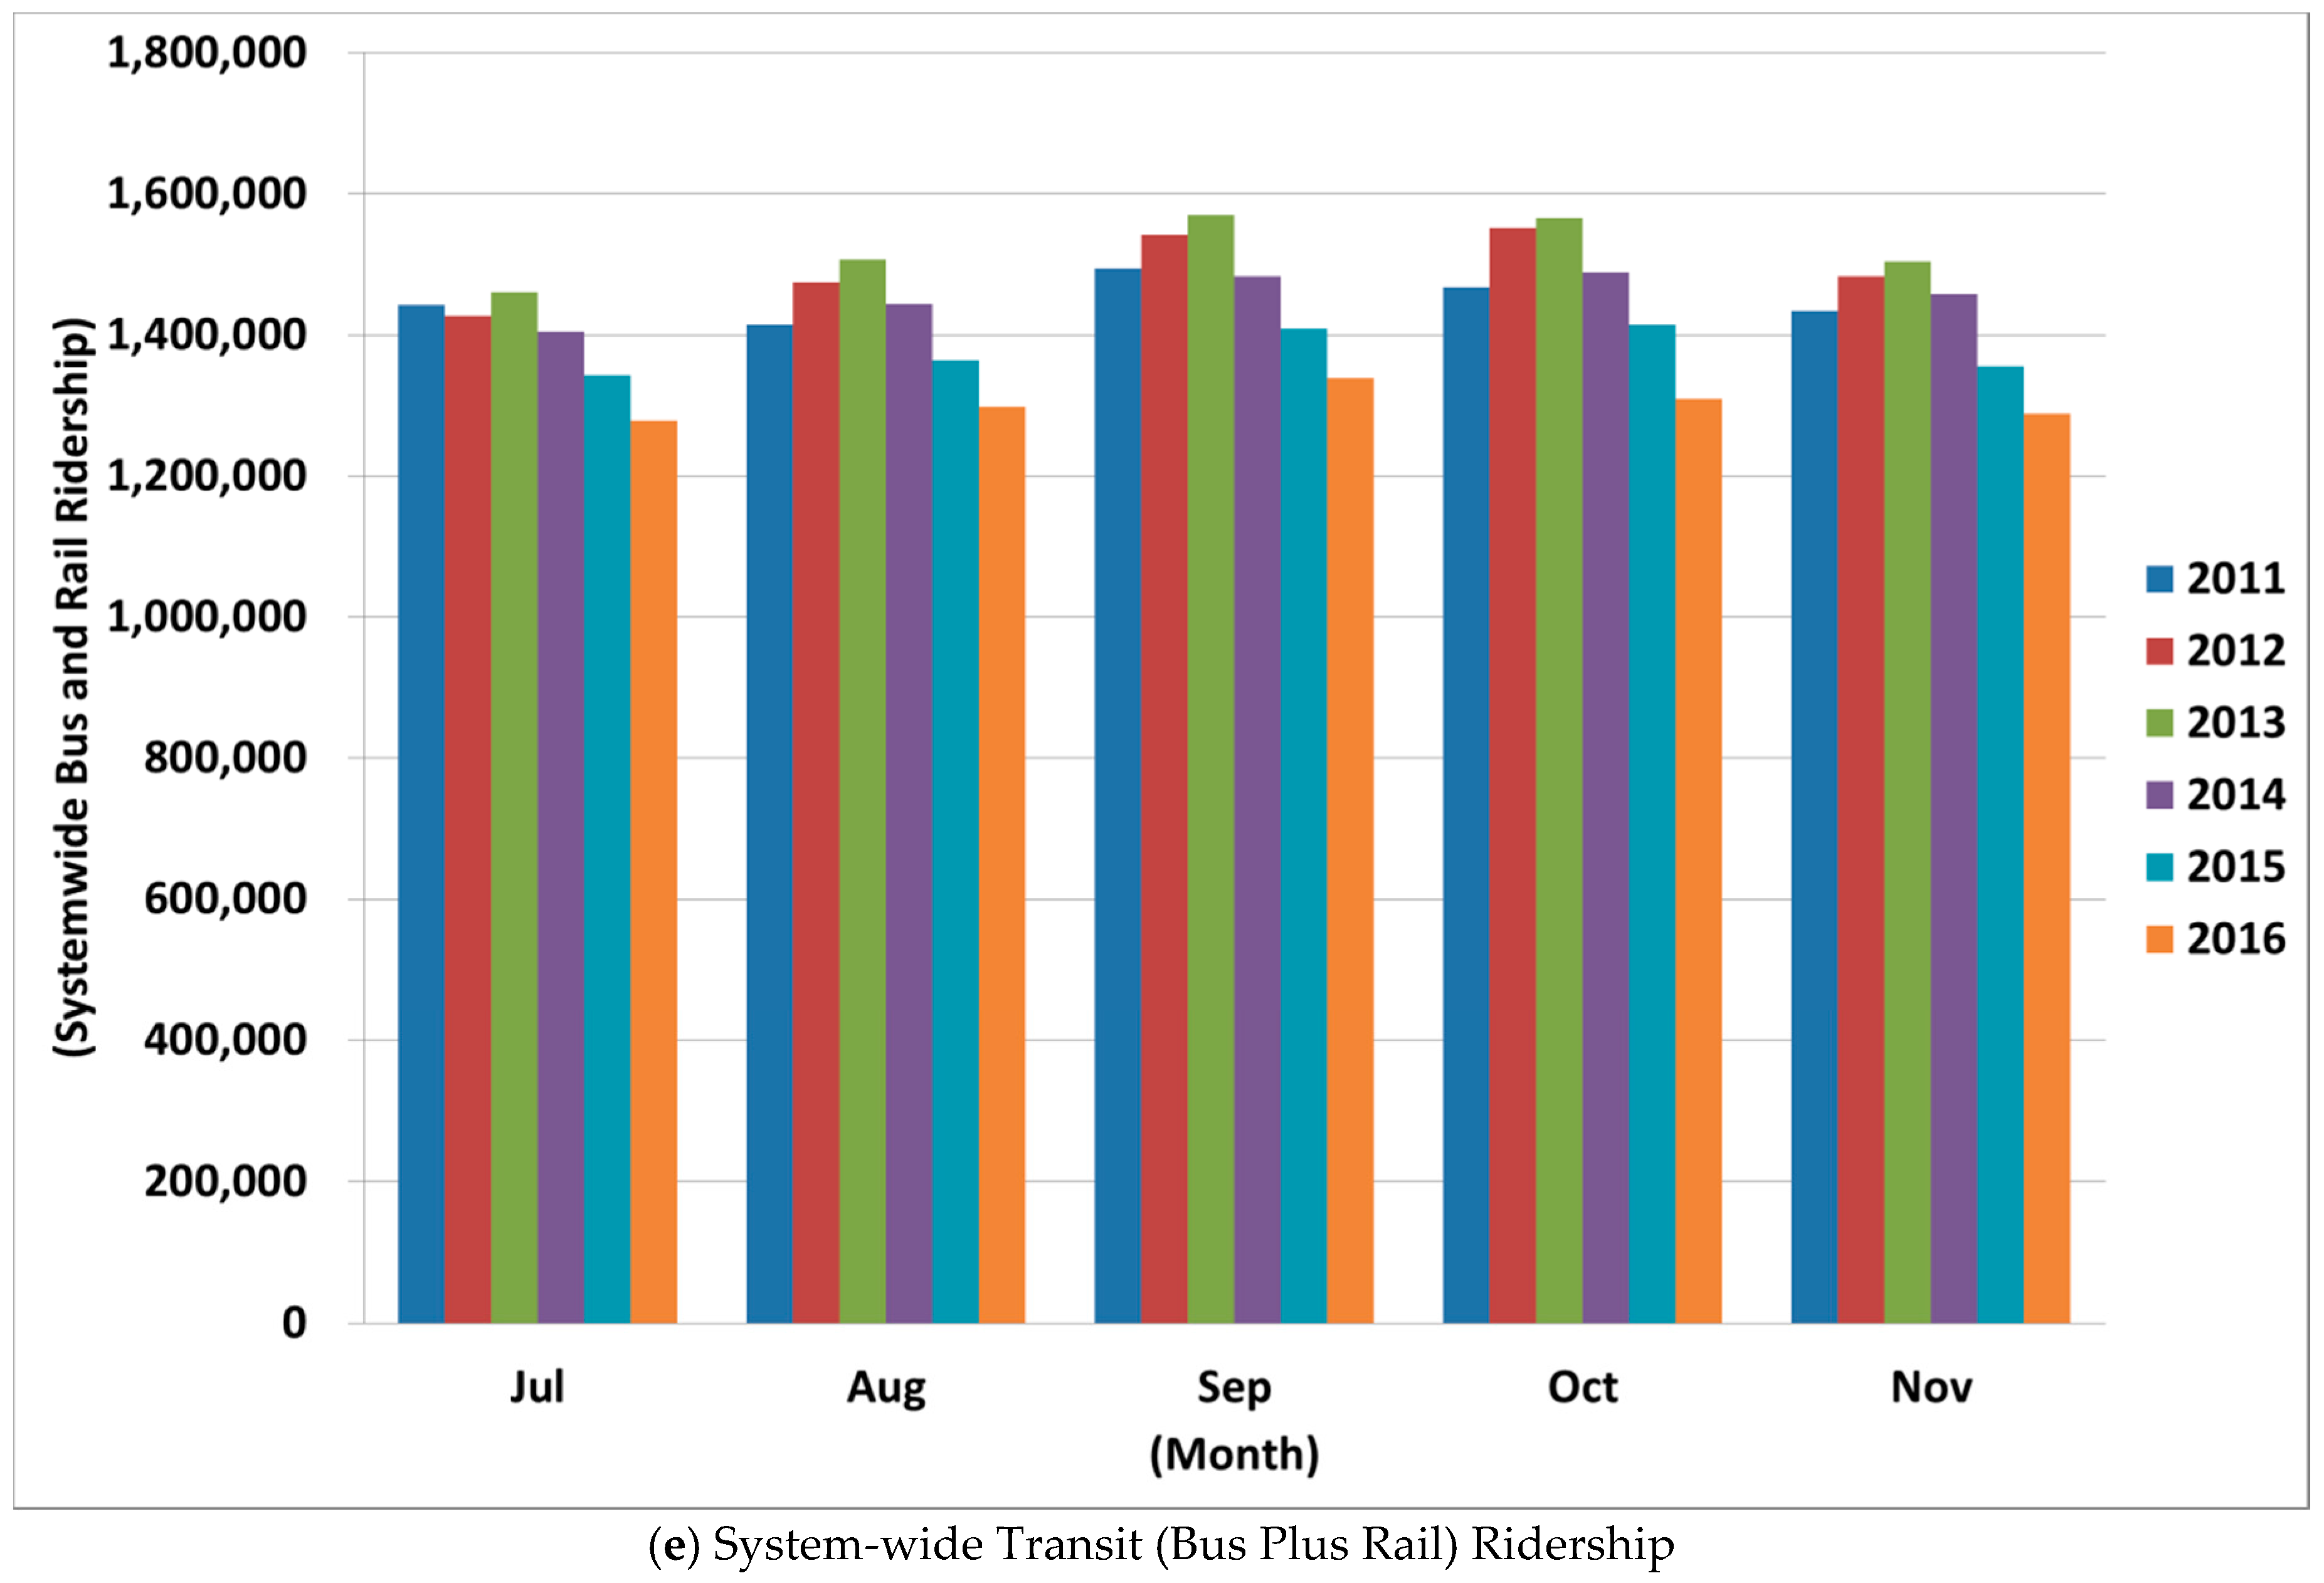
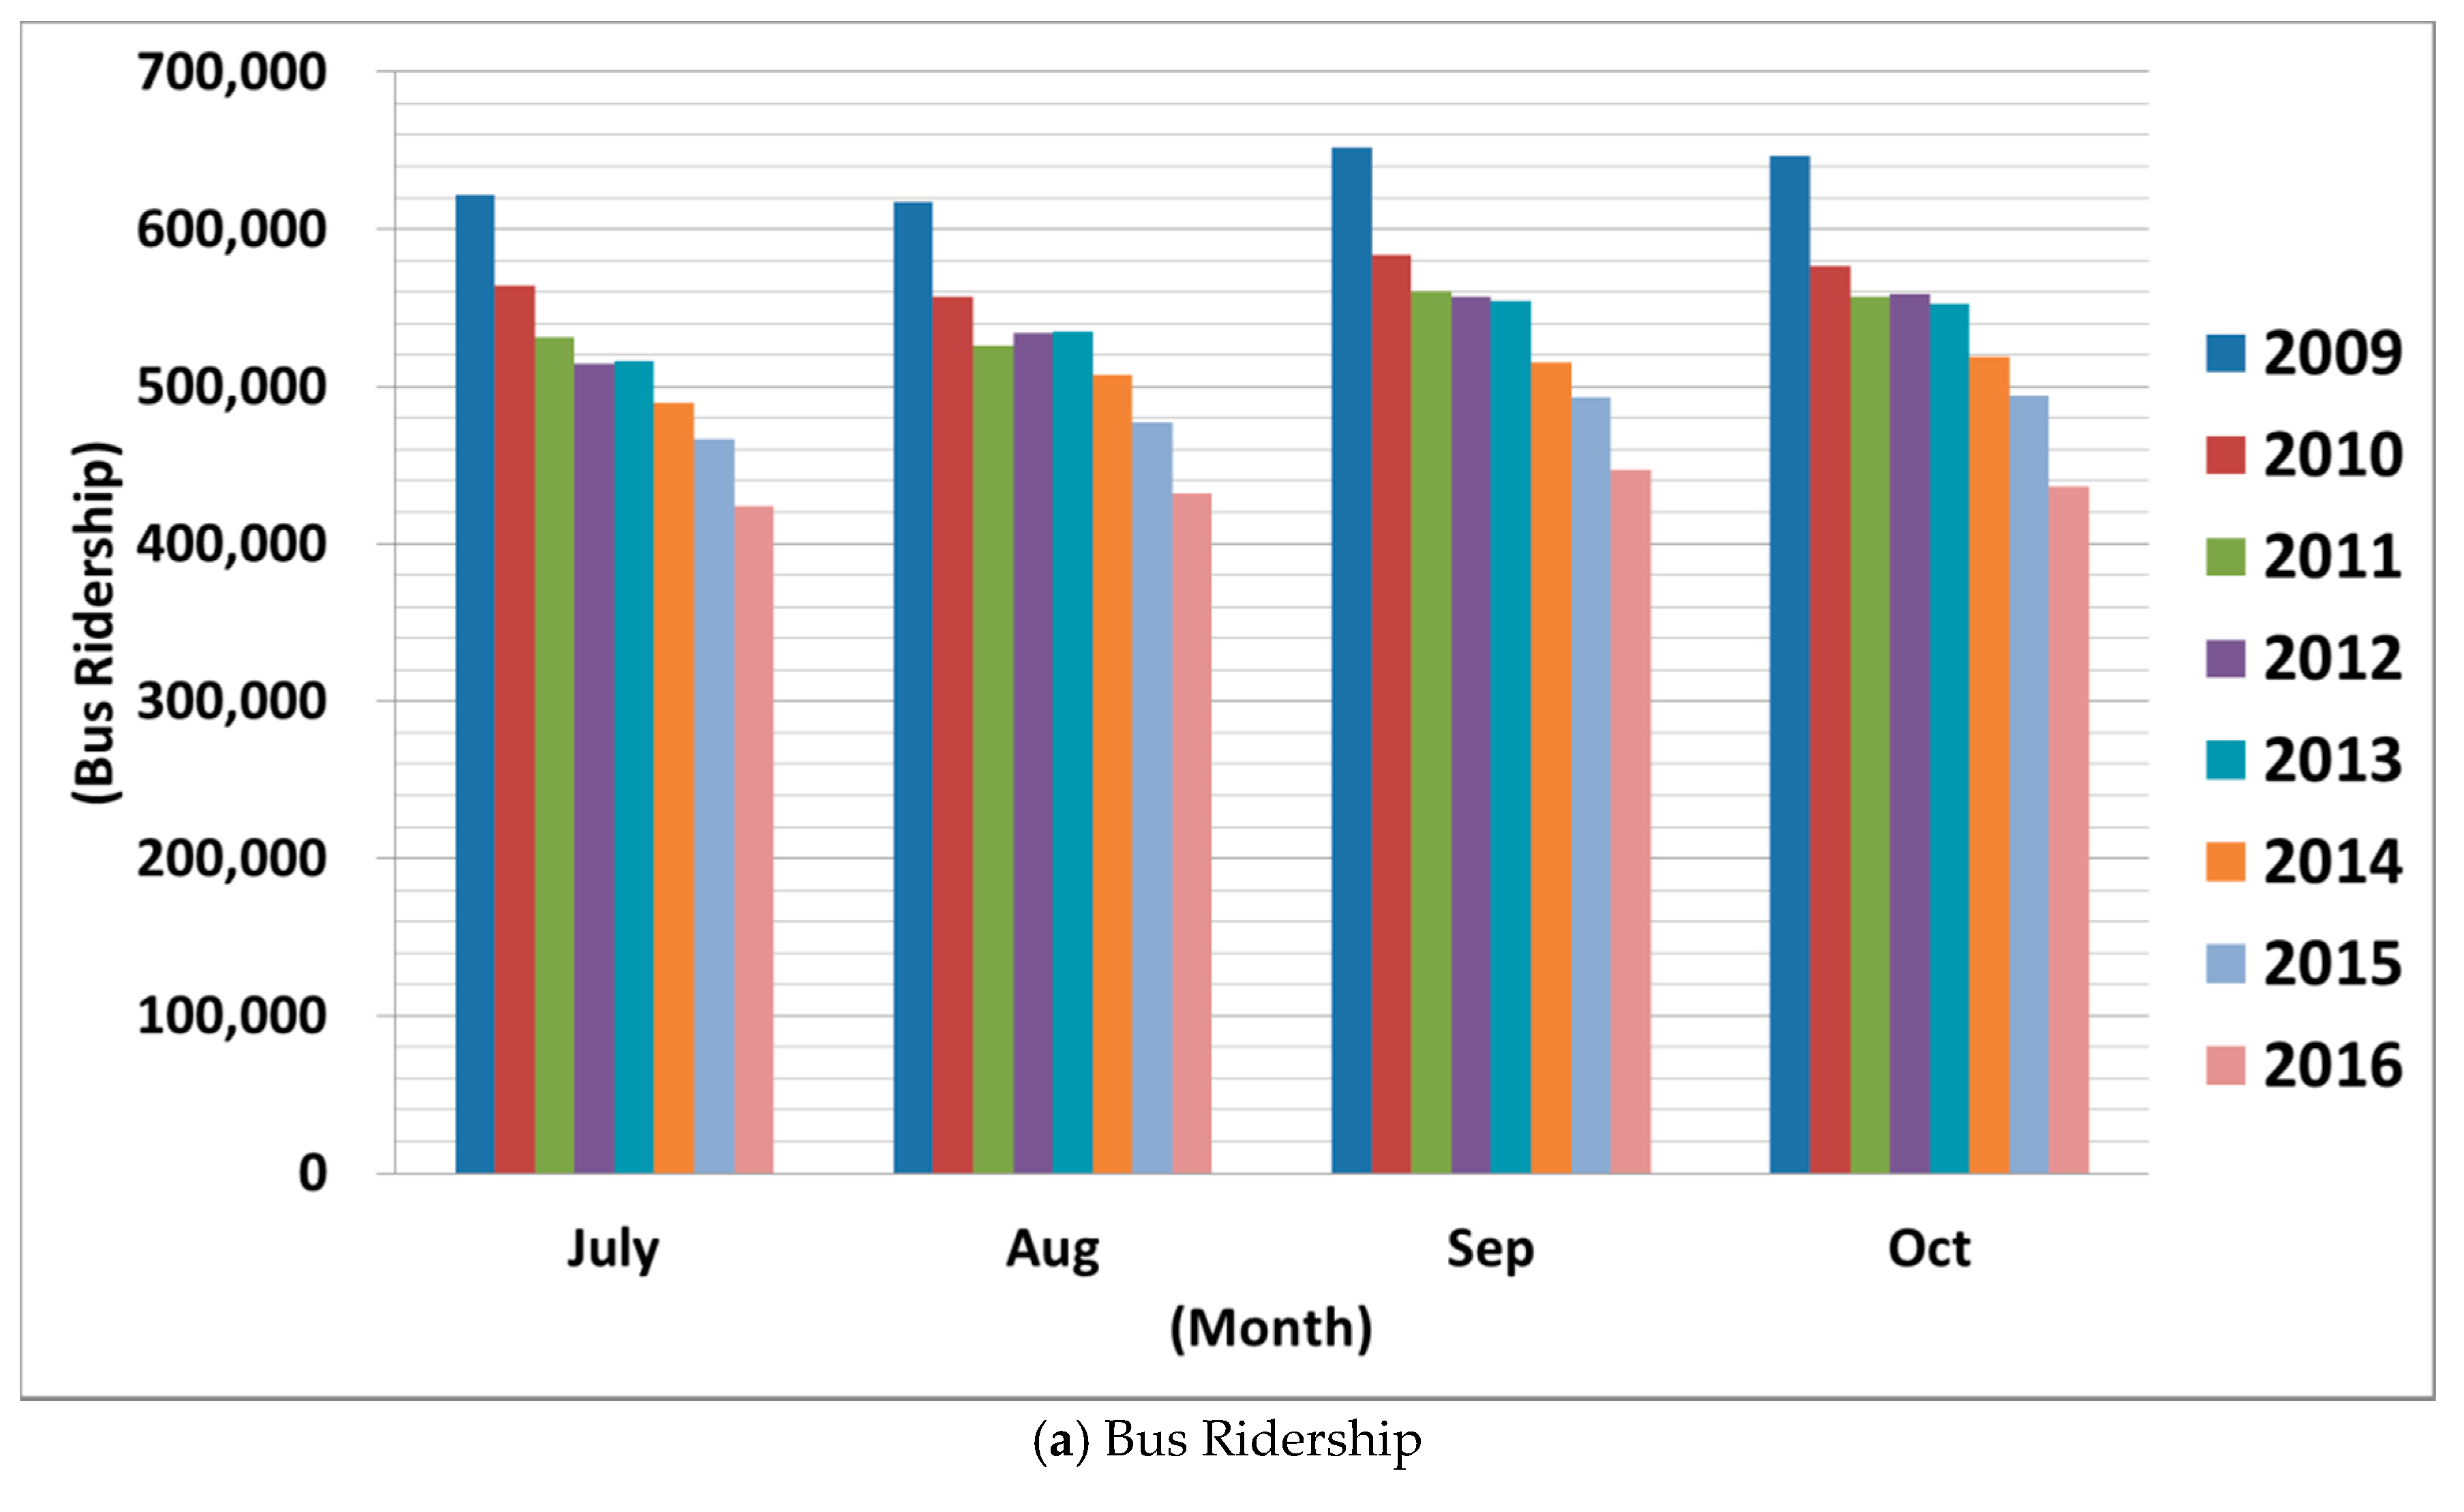
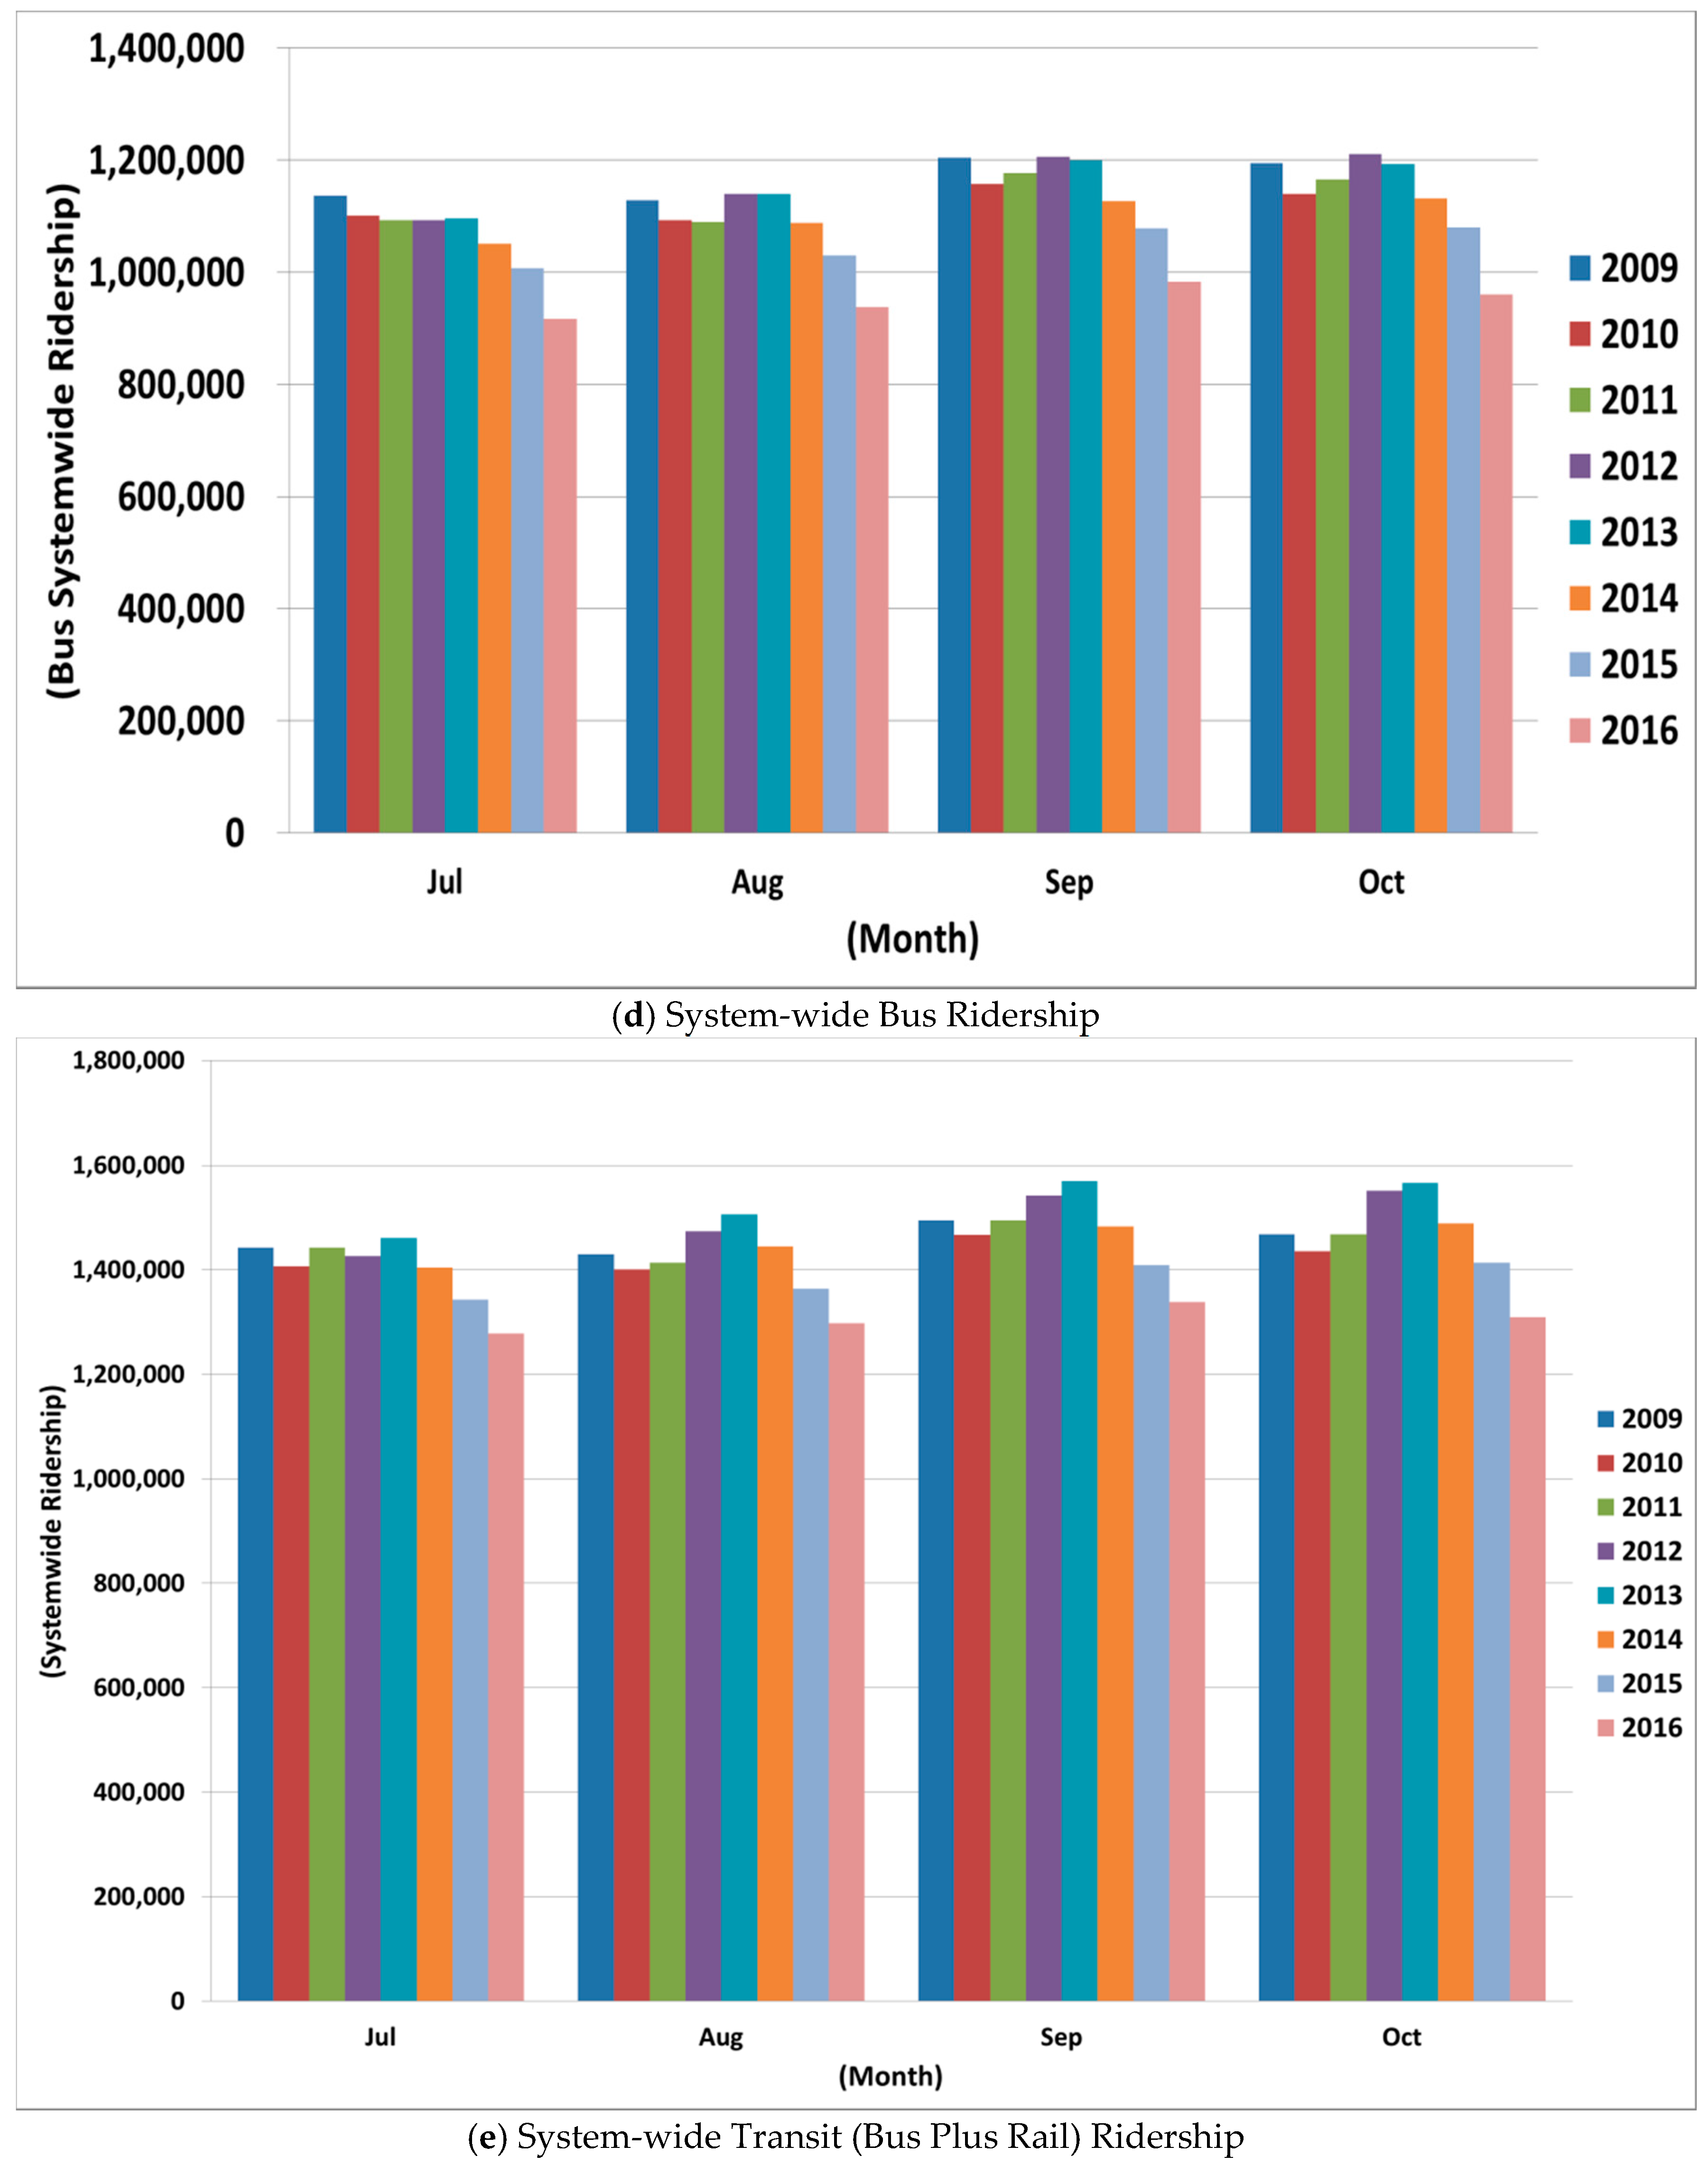
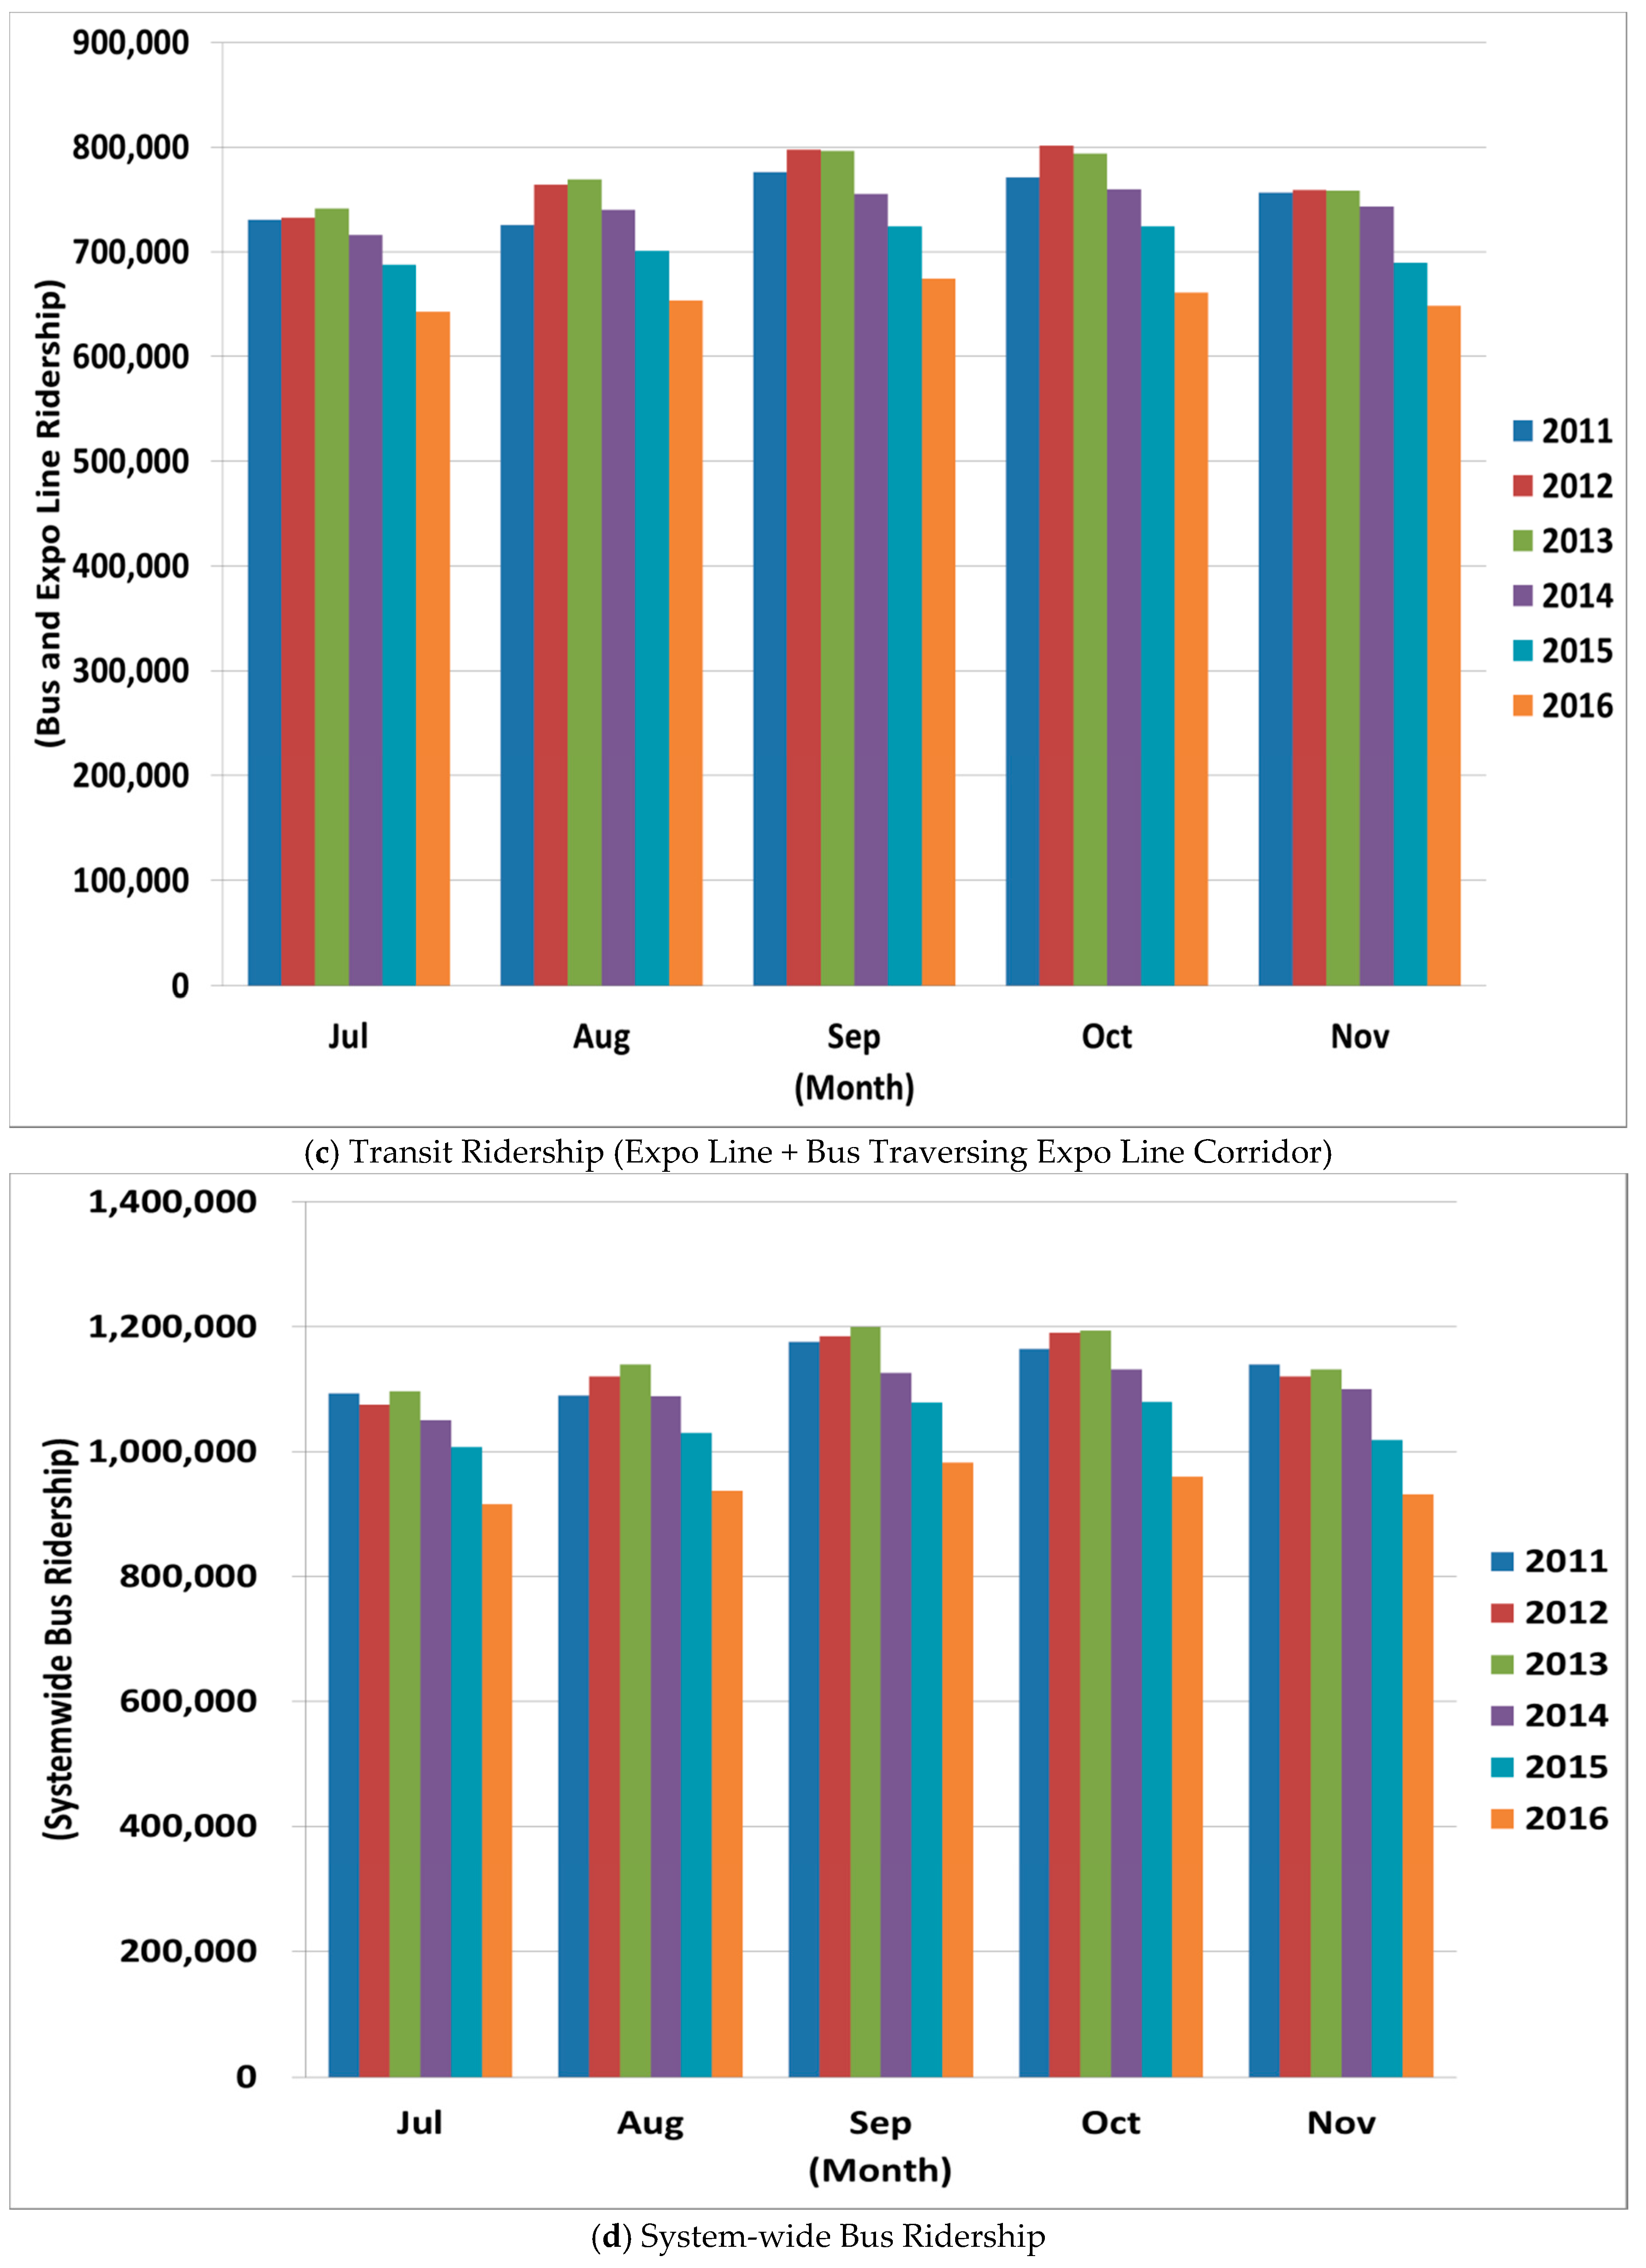
3.2. Bus Ridership Change after LRT Opening/Extension
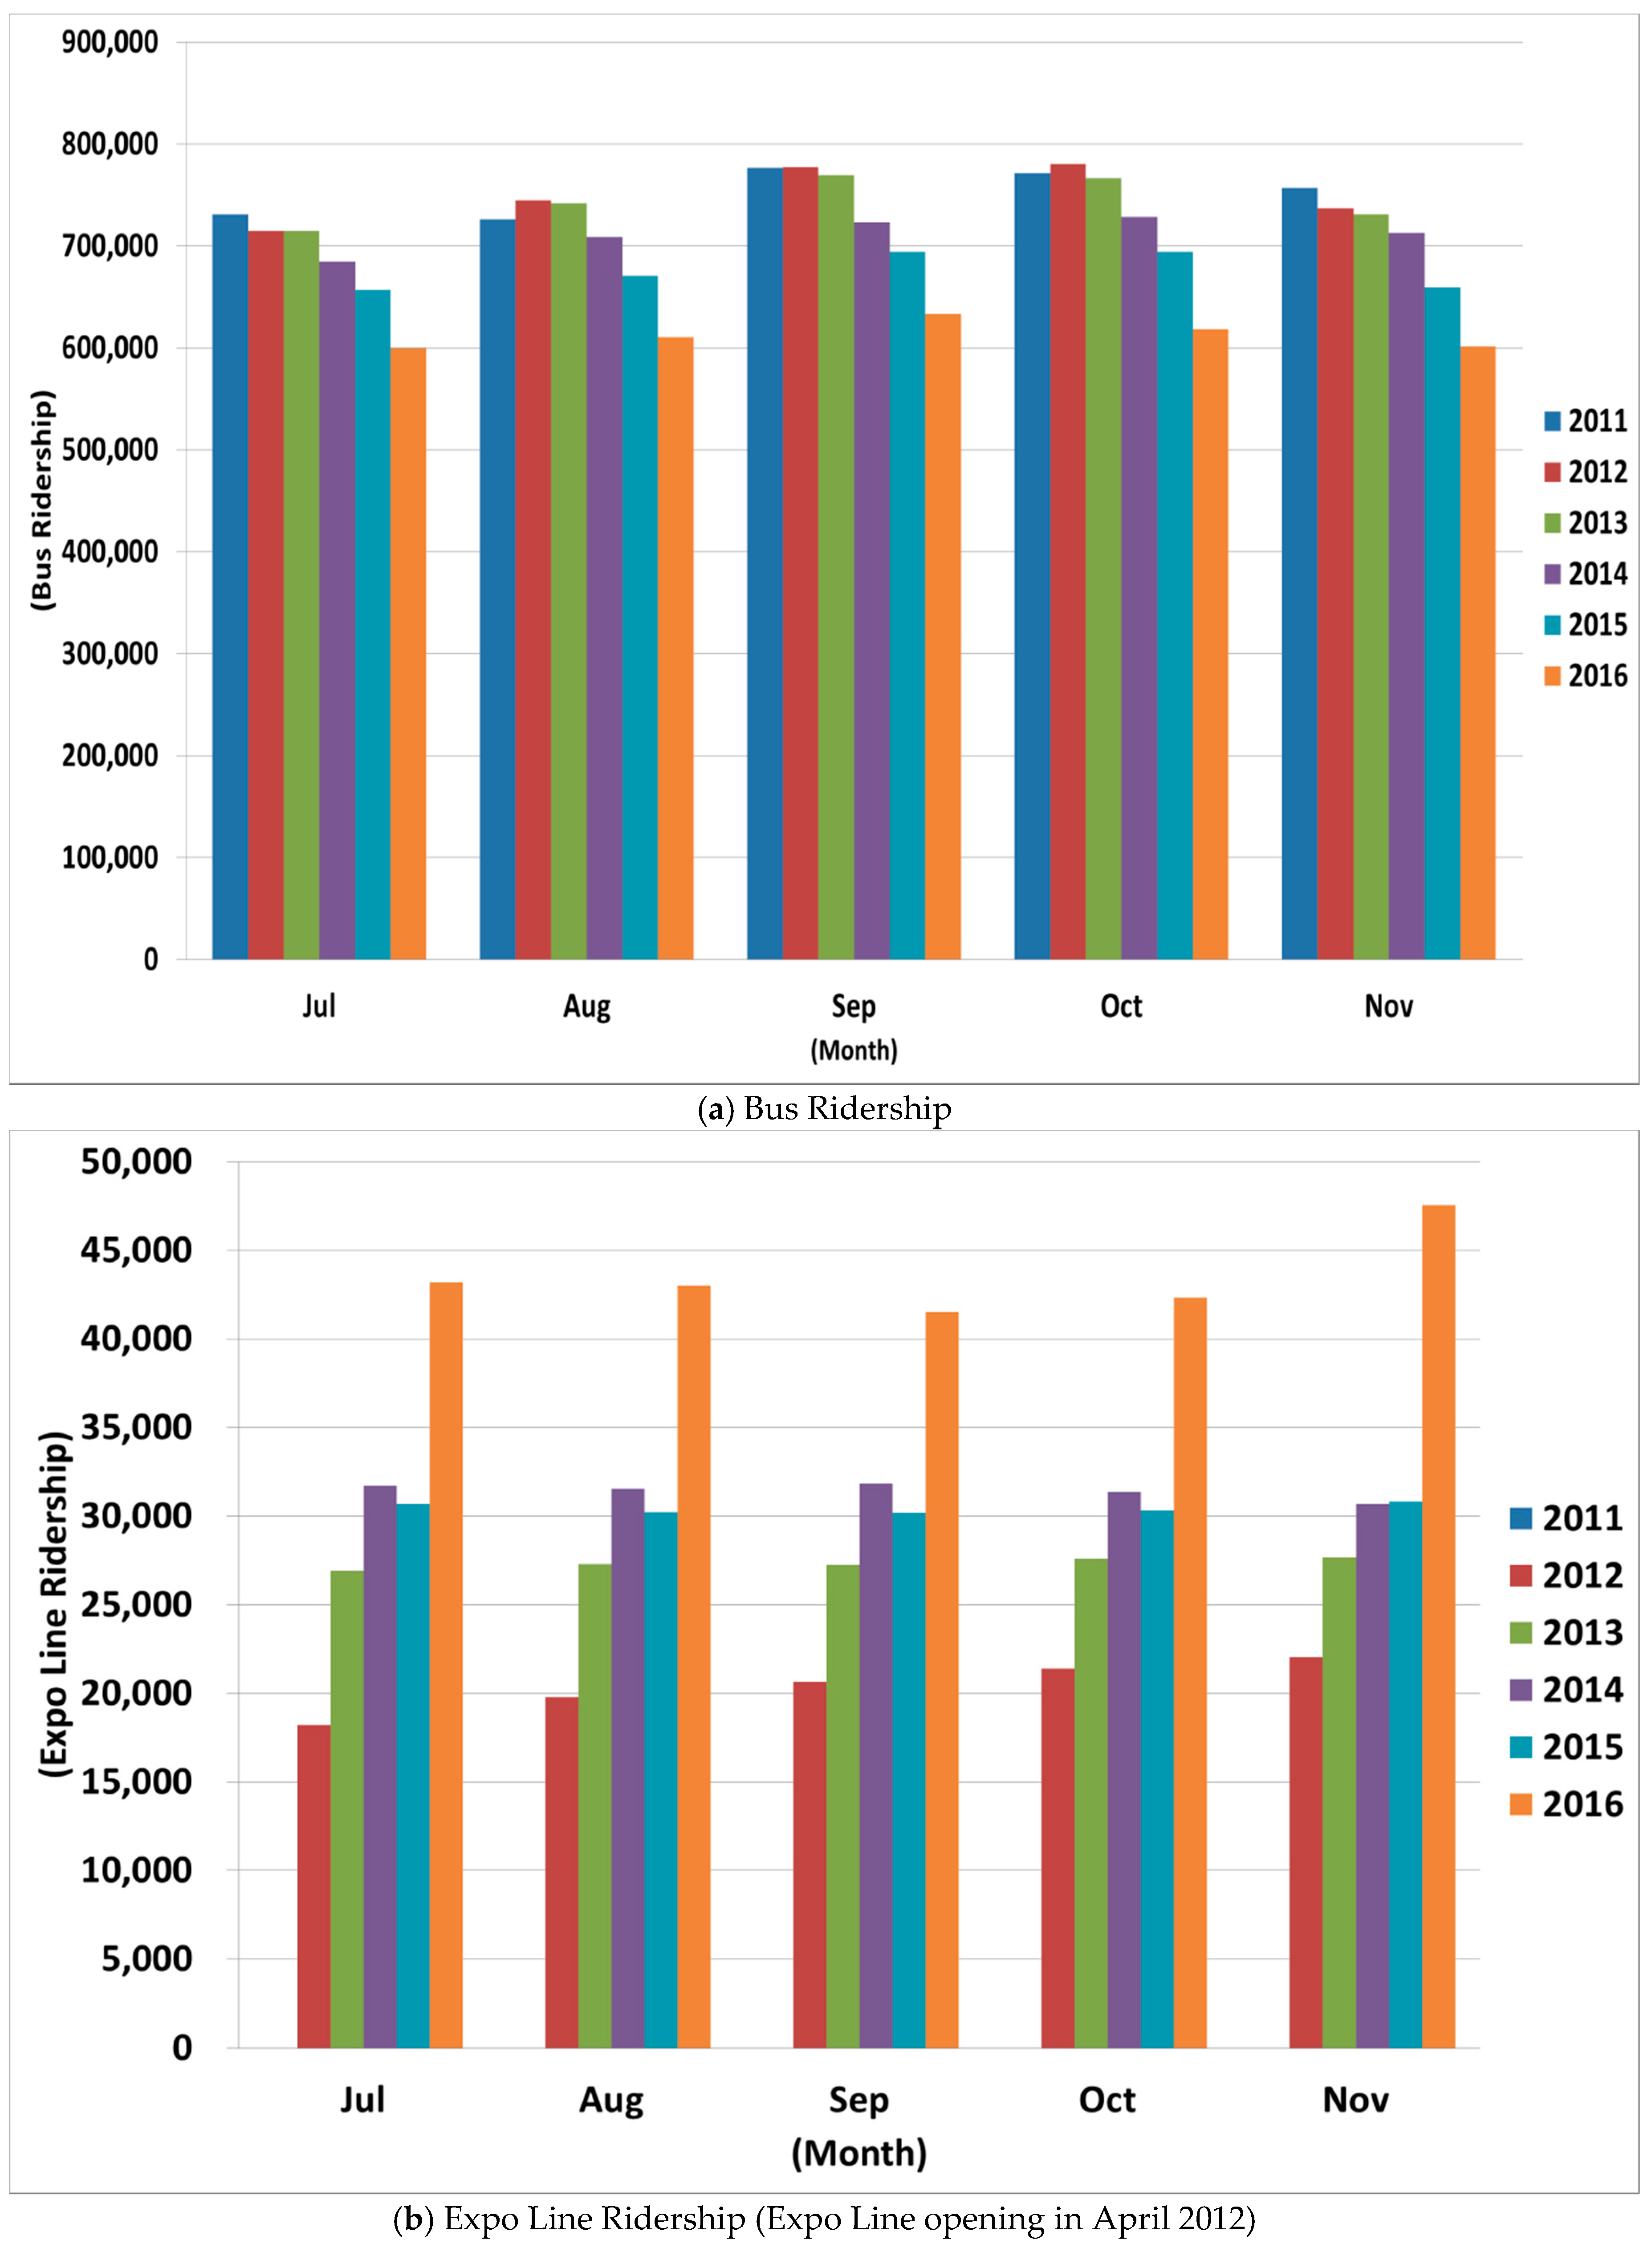
We compare ridership between the Gold Line extension and Expo Line Phase 1 and we examine patterns in both bus and LRT ridership along these corridors. Transit ridership data come from the LA County Metropolitan Transportation Authority (Metro) and the data are available in monthly mean format for weekday ridership [14]. The data indicate the total number of daily boardings that occur along the line, between the beginning and end of service on a typical business day not including Saturday, Sunday or holidays. Fluctuations are observed between the monthly ridership mean values and this ridership fluctuations resulted from the normal seasonal pattern. Data were reviewed for two periods: 2011 to 2016 (Corresponding with the Expo Line opening in April 2012) and 2009 to 2016 (Corresponding with the Gold Line extension opening in November 2009).

3.2.1. Expo Line

Sixty-six Metro bus lines traversed a one-mile (1.6 km) area around the Expo Line Phase 1 in 2011 before service began, including four types of Metro services: local, rapid, express, and shuttle buses (Figure 4). Metro local bus services entail frequent stops. Metro local buses operated 41 routes across the area in 2011. Among these 41 local bus lines, 30 lines ran through downtown LA and connected the Central Business District (CBD) area to Beverly Hills, Santa Monica, West LA, and the LAX/South Bay area. The other 11 local bus lines connected the non-CBD area to West Hollywood, Culver City, Inglewood, Norwalk, Athens, South Gate, Hawthorne, etc. Fifteen rapid buses, eight express buses, and two shuttle buses ran through the Expo Line corridor [29].
Table 1 presents bus, LRT, and total transit (bus + LRT) average weekday ridership for five-month periods in 2011 through 2016. Figure 5 compares the average weekday ridership for bus (see Figure 5a), LRT (see Figure 5b), and total transit ridership (see Figure 5c) along the Expo Line corridor for each month (July through November) from 2011 to 2016. In addition, we compared this ridership along the Expo Line corridor with a system-wide ridership for Metro bus (see Figure 5d) and transit system (see Figure 5e) to assess whether the observed changes in boardings reflected an overall trend in system-wide ridership.
LRT ridership (Expo Line) greatly increased from a weekday average of approximately 18,000 in July 2012 to 48,000 during November 2016 after the opening of Expo Line in April 2012 (see Figure 5b). As shown in Table 1, transit ridership of the Expo Line corridor increased by approximately 19,800 riders per weekday between 2011 and 2013, but then decreased in 2014 to less than 30,000 riders. Since 2014, ridership decreased steadily. The net transit ridership of the Expo Line area for 2016 (LA County area) was 13% lower than the 2011 average before the introduction of the new light rail system.
On the bus side, ridership of the Expo Line corridor slightly declined by approximately 7600 from 2011 to 2013, 70,000 from 2014 to 2015, and 62,000 in 2016, leading to a total 18.6-percent reduction in weekday bus ridership, or about 140,000 riders, since the opening of the Expo Line. System-wide, Metro bus ridership dropped by 16.5% to roughly 187,000 riders between 2011 and 2016.
Net transit ridership peaked in 2013 with almost 772,000 unlinked passenger trips. However, the net ridership along the Expo Line corridor in “bus plus rail” ridership in 2014 decreased 3.8%, probably because Metro raised fares in September 2014 [30]. Concurrently, Metro’s system-wide “bus plus rail” ridership decreased about 4.3% compared to the prior calendar year. This trend continued for the next two years, as the reduction in bus ridership exceeded the increase in the number of Expo Line riders.
Total transit ridership for lines traversing the corridor decreased by approximately 96,000 riders per day, which implies a 19% reduction in bus ridership of about 140,000 riders per day for the five years following the opening of the Expo Line in April 2012 (Table 1). This results in about a 13% loss of transit ridership along the Expo Line corridor over the five years. System-wide, overall Metro ridership of LA County decreased 10% and bus ridership decreased 17% for the same time period (2009–2016).

3.2.2. Gold Line

The Gold line extension between Union Station and Atlantic Station was the focus of our ridership analysis. We analyzed the ridership patterns of Metro bus lines that traverse a one-mile (1.6 km) area around the Gold Line extension.
Sixty-four Metro bus lines traverse a one-mile radius around the Gold Line extension which opened in November 2009. Four types of Metro services—local, rapid, express, and shuttle buses—traverse this corridor (Figure 6). Metro local buses operated 38 routes across the corridor in 2009. Among these 38 routes, 31 ran through downtown LA and connected the CBD to West LA, Santa Monica, Burbank, Sun Valley, etc. The other seven local bus lines served north-south routes in non-CBD areas, and they connected the East LA, Compton, Pasadena, and Lynwood areas. Ten express bus lines, three shuttle lines, and 13 rapid lines ran through this corridor [29].
Table 2 presents bus, LRT, and total transit (bus + LRT) average weekday ridership along the Gold Line extension corridor for four-month periods in 2009 through 2016 and Figure 7 compares the average weekday ridership for bus (see Figure 7a), LRT (see Figure 7b), and total transit (see Figure 7c) of the Gold line extension corridor for each month (July through October) from 2009 to 2012. These patterns are compared with the system-wide ridership for Metro bus (see Figure 7d) and the overall transit system (see Figure 7e).
Metro opened the second phase of the Gold Line on 15 November 2009. The average weekday ridership of Gold Line rapidly increased from 21,000 (October 2009) to 28,500 (November 2009) concurrent with this extension. The Gold Line ridership continued to increase and by 2013 had almost doubled (99% increase, 44,250 trips) since 2009. The average weekday Gold Line ridership grew from 22,000 in 2009 to 51,000 in 2016, an increase of (unlinked) about 29,000 trips.
Although the Gold Line extension resulted in rapid increases in LRT ridership, the net transit ridership continued to decrease after the line was extended in November 2009. Total transit (bus plus rail) ridership in Gold Line extension corridor decreased about 8% despite the increase (57%) in Gold Line ridership between 2009 and 2010. This trend continued in 2011, as the reduction in bus ridership exceeded the increase in the number of Gold Line riders. Overall, total transit ridership for lines traversing the corridor decreased by approximately 171,000 riders per day, which implies a 31.5% reduction in bus ridership of about 200,000 riders per day for the seven years following the opening of this second phase of the Gold Line (Table 2). This results in a loss of ridership of about 26% along the extension corridor of Gold Line over the seven years. System-wide, overall Metro ridership in LA County decreased 10.5% and bus ridership decreased 18.6% for the same time period (2009–2016).

3.3. Service Change after LRT Opening/Extension

Of particular interest for this research is whether changes in bus service made to coincide with the opening of new LRT service impact ridership. In order to evaluate whether changes in our study areas reflect unique service changes in those areas, or parallel broader system-wide service changes, we examine Metro’s system-wide bus service levels along both the Expo Line and Gold Line extension corridor compared to system-wide service changes. As seen in a number of before-and-after studies completed per Federal Transit Administration’s requirements, it is not unusual, or unexpected, for transit agencies to make changes to bus services coincident with the opening of a new rail service. Bus lines running along the same corridor as the new rail service are often eliminated, with the rail service replacing the previous bus service. In addition, agencies often re-route, or increase bus service to serve as feeders into the new rail line.
During the period after the Expo Line opened, the bus service changes were implemented in June 2012. Table 3 compares Metro’s system-wide service changes with changes within the Expo Line corridor between 2011 and 2012. During the morning peak period, essentially no change in bus service occurred system-wide, however, service within the Expo Line corridor decreased very slightly. During the afternoon peak period, both system-wide and Expo Line bus service levels declined by an identical percentage. The Expo Line corridor saw an increase in base period bus service level compared to system-wide changes, while the late night “owl” service decreased similarly for the study area and system-wide.
Vehicle revenue hours of service and vehicle revenue miles of service were 0.3% and 1.5% lower, respectively, in 2012 than they were in 2011. System-wide, vehicle revenue hours of service remained almost the same but vehicle revenue miles of service decreased by approximately 1% (Table 4).
Following the opening of the Gold Line extension, the bus service changes were implemented in June 2010 and bus service frequencies decreased as shown in Table 5. The system-wide service level decreased almost 5% between 2009 and 2010. However, bus service level decreases within the Gold Line extension corridor were substantially larger. Overall, Metro decreased the number of buses traversing the Gold Line extension corridor by 13%, with the largest decreases occurring during the morning and afternoon peak times (−14.3% and −13.0%, respectively). Base period bus service levels decreased in the study area by nearly 11%.
In terms of vehicle revenue hours and miles, both system-wide and Gold Line bus service levels declined, but the decreases for the Gold Line extension corridor were larger as a percentage of June 2009 levels. Vehicle revenue hours of service and vehicle revenue miles of service for buses in the Gold Line corridor were 13% and 16% lower, respectively, in 2010 than they were in 2009. System-wide, vehicle revenue hours of bus service and vehicle revenue miles of bus service decreased 5.5% and 6%, respectively (Table 6).
After the Gold Line extension and the Expo Line openings, Metro also implemented several bus route service changes. After the Expo Line opening in 2012, Metro made route changes to lines 550 (express) and 740 (rapid bus), eliminating service into West Hollywood and the Central Business District area. Metro extended the 30 and 102 local lines to West Hollywood and LA International Airport (LAX) and doubled the number of vehicles serving those lines (Figure 8). These four lines experienced the largest individual changes in ridership with lines 30 and 102 showing noticeable increases in ridership, while lines 550 and 740 experienced declines (Table 7).
The Federal Transit Administration [31] states that “service on one bus route was dropped east of the Indiana Street station”. We found that Metro made a change to Line 30, eliminating the easternmost portion of the route and reducing the number of vehicles with the extension of the Gold Line in 2009. In addition, four of the limited express bus services (number 444, 445, 484, and 490) were discontinued, concurrent with opening of the second phase of Gold Line (see Figure 9 and Table 8). Although these four lines were not bus services directly aligned with the Eastside Extension project, these four lines were bus services that traversed the corridor within a 1-mile radius of the Gold Line eastside extension.
In sum, Metro eliminated four bus routes, cut the service hours by 13%, and shortened service routes by 16% along the Gold Line extension corridor in 2010. Overall transit (bus plus LRT) ridership of this corridor fell over 8% in 2010, despite a record number of riders who used the Gold Line system. This decline is much higher than Metro’s system-wide decline of about 2% in 2010.

4. Conclusions and Policy Implications

This study examines aggregate data to track changes in ridership before and after the opening of new LRT services with an emphasis on how changes to bus service and routing may impact travel.
The results underscore two important, and related, points. First, changes in bus service made to coincide with the introduction of new LRT can negatively affect the overall transit ridership in the corridor. Although the Expo Line and Gold Line extension areas had similar demographic and socio-economic characteristics, the net transit ridership effect along these corridors differed during the years immediately after LRT service began. Expo LRT service began in April 2012 and resulted in 2013 net transit ridership increasing to its highest level. However, a year-to-year Gold Line LRT ridership comparison shows a dip in net corridor transit ridership between 2009 and 2010, although gas prices in the region rose after the Gold Line was extended to the Eastside in 2009. This pattern is probably in part because the entire system suffered service reductions during this period. However, bus service decreased substantially more within the Gold Line extension corridor compared to the countywide decrease in bus service. This change along the Gold Line extension appears to be related to a net “bus plus rail” ridership decline (over 8%) in that corridor, which was greater than Metro’s system-wide “bus plus rail” ridership decrease of about 2% for the same period, 2009 to 2010. The results of this research suggest that there was a large reduction in bus service concurrent with the opening of the Gold Line LRT extension in 2009.
Second, the results of our Expo Line analysis show that the ridership decline is not attributable to any single factor. The net transit ridership along the Expo Line corridor slightly increased in “bus plus rail” ridership until the end of 2013, after the rail line opened in April 2012, possibly because the bus service was not reduced by the same magnitude as along the Gold Line extension from 2009 to 2010. However, ridership along the corridor in 2014 was down 4%, concurrent with the 4% decrease in the Metro’s system-wide ridership compared to the prior calendar year. This decrease occurred after Metro raised fares in September 2014. It shows that predicting and increasing ridership are complex tasks, but fares and service cuts likely play key roles in increasing or decreasing ridership.
In terms of policy implications, our results give reasons for transit agencies to think carefully about bus and rail transit service, particularly when new LRT is introduced. Light rail runs along the street—often along heavily traveled bus routes—and it seems intuitive to eliminate some bus routes to optimize the system once the new LRT service commences. This study does not argue against such efforts, but based on our findings, we suggest some caution. Changes in bus service, on net, can be consistent with increases in transit ridership (as in the Expo Line corridor in the first two years after that LRT line opened) or decreases in transit ridership (as in the Gold Line corridor immediately following 2009). More importantly, system optimization might affect a wide range of travel behavior. Eliminating bus stops (and other related reductions in service) could suppress ridership among households near eliminated bus stops along the new light rail corridor. This study suggests that transit agencies should take a more holistic view of travel impacts, and that changes to bus service should be carefully crafted to maximize the use of new LRT service and facilitate changes in travel behavior that are consistent with a shift away from automobility.
Looking more generally, the results of this study touch on broader issues of sustainability and transit. The LA case illustrates three issues that require further research. First, how do rail and bus transit jointly affect sustainability goals? In the Gold Line corridor in LA, the initial opening of rail service was associated with both service reductions and decreases in bus transit ridership. The net GHG emission impact of those trends would be complex, and would depend on the overall travel behavior changes of riders, power generation and fuel sources for the bus and rail systems, and occupancy levels of both the bus and rail lines. For LA, some summary information is available from previous research. Chester et al. [32] give data on per-mile carbon emissions of several bus and rail lines in major U.S. cities, and those data, for LA, indicate that the Gold Line has emissions averaging 124.02 g of CO2 per passenger, while the Orange Line Bus Rapid Transit (BRT) line in LA has emissions averaging 68.54 g of CO2 per passenger. If the Orange Line BRT is reflective of other bus service (Chester et al. do not report emissions for other LA bus lines), this raises the possibility that a shift of riders from busses to LRT along the Gold Line corridor may be a move from low to higher emission transit systems. Recently Metro’s Board approved the purchase of 95 electric buses which will run along the Orange and Silver Line busways. An ambitious goal set forth by L.A.’s mayor would electrify the entire fleet by 2030 [33]. This could make buses even lower GHG which makes the recent drop in bus ridership more problematic. We caution that the specific net emission change will depend on circumstances of the lines and passenger travel behavior, but as cities worldwide expand rail transit systems, more careful assessment of how changes in overall transit ridership affect GHG emissions should be pursued.
Second, travel behavior itself should be an object of study as cities open new rail transit systems [34,35]. While we document changes in bus ridership associated with the opening of new LRT lines in LA, it is still unclear from this study to what extent bus riders are shifting to new LRT service, and there is no a priori reason to expect such shifts to be one-for-one. We suggest future research that continues to explore how LRT and bus service changes are associated with changes in transit ridership.
Third, changes in urban development that are associated with new and expanded transit systems should be studied in future work. The evidence that we document, on changes in bus and LRT ridership, are short-term effects, soon after the new LRT service opened. Longer-term land use changes could reinforce or modify the ridership patterns observed in this study. While our goal was not to study how the city and metropolitan area are coordinating land use near transit, as cities worldwide are embarking on rail transit expansions, such studies are increasingly important. We note that, from our results, questions of the interaction of new LRT service with bus service are important, and to date the literature has focused almost exclusively on the role of land use and development only in relationship to rail transit.
To recap our main findings, bus service changes and total corridor transit ridership were strongly associated in the first approximately two years after each LRT system opened. The Gold Line saw a large reduction in bus service and immediate (in 2010) reductions in bus ridership that more than countervailed the increase in LRT ridership. The Expo Line corridor had almost no net change in bus service and an initial increase in total transit ridership. In the most recent years, approximately since 2014, system-wide bus ridership declines appear to swamp any corridor specific effects. By suggesting a more holistic view, we encourage transit agencies to be more alert to both bus service and overall system factors. The large reductions in bus service along the Gold Line corridor are associated with overall transit ridership declines in the same corridor, and we suggest that agencies be alert to the links from bus service to transit ridership changes. However, clearly broader, systemic factors are also important in ridership, as the data from 2014 forward indicate. Our study was not designed to illuminate those systemic factors, although the bus fare increases and gas price declines of recent years are factors that warrant further study [25,36]. Overall, we conclude that changes in service, particularly those associated with new LRT, can change travel behavior. Transit agencies and future research should be more alert to before-after evaluations of new service. Insights drawn from the current study can serve as an example of the importance of such evaluations and we suggest that this approach should become a standard part of agency operations.

Acknowledgments

This study was funded by the Mineta Transportation Institute. This research was also supported by Basic Science Research Program through the National Research Foundation of Korea (NRF) funded by the Ministry of Education (NRF-2016R1D1A3B03936226).

Author Contributions

All of the authors made contributions to the work in this paper. Jeongwoo Lee contributed to data collection and analysis, prepared the figures and tables, and wrote the paper. Marlon Boarnet contributed some ideas for this research, designed the study, and contributed to the writing. Douglas Houston, Hilary Nixon, and Steven Spears all participated in conducting the study, and provided contributions to the writing.

Conflicts of Interest

The authors declare no conflict of interest.

Appendix A. Detailed Ridership Data for Expo and Gold Lines

Table A1. Ridership data for bus lines traversing the Expo Line corridor (within one mile of the line).
Line #July 2011August 2011September 2011October 2011November 2011July 2012August 2012September 2012October 2012November 2012July–November 2011July–November 2012Average DifferenceDifference (%)
Local through CBD219,41718,86820,32420,38019,52319,24919,83820,51520,77919,34519,70219,9452431.2%
420,58220,29421,57321,64521,31520,96322,20022,38822,25421,03621,08221,7686863.3%
1011,99411,78513,91413,86813,29511,46312,92413,91913,95912,89012,97113,031600.5%
1419,16619,47621,91922,11221,45819,04020,59522,24422,37620,49820,82620,9511240.6%
1625,50925,21426,73927,10326,92424,41525,50625,99526,08225,08926,29825,417−880−3.3%
1824,67824,31425,69525,52824,90123,65424,55424,82124,82723,99625,02324,370−653−2.6%
2017,16117,17717,55817,40916,79217,21517,68417,77317,79116,65417,21917,4232041.2%
287902778481488047794285358571879388348371796586216568.2%
3013,04513,09013,23713,04812,86818,51118,70319,31719,37718,33713,05818,849579144.4%
3312,41812,17312,90612,70012,58612,74413,54613,72713,68612,87412,55713,3157596.0%
3512,05011,87213,62713,44113,27910,65511,65512,87712,93212,00412,85412,025−829−6.5%
4024,02223,79025,13325,25425,12622,54623,52124,40824,01022,72824,66523,443−1222−5.0%
4521,90821,66822,90122,64122,36620,29621,10722,02622,20721,12622,29721,352−944−4.2%
5127,07427,60629,06828,90528,63927,50928,45929,51730,08028,74328,25828,8626032.1%
5313,34213,29914,62314,53614,33813,40814,10215,12215,30014,33914,02814,4544273.0%
559094903410,27010,30899348501952010,68210,657975997289824961.0%
6019,80919,86420,74920,25219,99220,09320,91821,16321,61020,76720,13320,9107773.9%
624851504151905103507650565189533953805113505252151633.2%
6619,68419,31419,51619,44219,24618,39418,76518,82818,78217,81219,44018,516−924−4.8%
7012,36812,34112,73112,60612,44312,37112,44312,91613,06412,22912,49812,6051070.9%
7116631670187920372010183919592128228421131852206521311.5%
7610,82910,71111,23111,07810,96310,42910,20610,74010,69010,17410,96210,448−515−4.7%
7811,57311,46512,11311,88511,71011,69011,76712,42512,51512,05311,74912,0903412.9%
8115,87015,98717,35717,16116,75715,37416,11217,33617,27616,54316,62616,528−98−0.6%
83403439184189410739963368340635143581330640493435−614−15.2%
84918286129691952493608559873095659593896392749082−192−2.1%
905911611369826772662664066478779175897084648170705899.1%
92577156615855582759165468552557145747559758065610−196−3.4%
94664465176669655365226221624265456492614265816328−253−3.8%
961631160716511628151616762030174316901533160717341288.0%
Local through non-CBD10215561590175216851579227424422609260525321632249286052.7%
10511,66811,83312,74612,55712,85012,49613,26513,56913,72513,03212,33113,2178877.2%
20014,79014,84615,71415,75215,23115,17015,85216,23516,06315,40515,26715,7454783.1%
20426,77026,61629,34029,25928,81025,77227,90429,28728,94926,89928,15927,762−397−1.4%
20612,94012,73814,08314,14913,68812,95113,76714,34114,05713,28913,52013,6811611.2%
20723,76622,94524,84724,09323,45521,49122,85523,73823,25221,76123,82122,619−1202−5.0%
20985087510401049103389510341177117310449691065959.8%
21014,57614,35915,93115,40414,89714,77215,39816,84016,94215,96715,03315,9849506.3%
21213,13213,24914,18114,39514,12514,30314,93515,49215,40214,64513,81614,95511398.2%
2178063813283367994802285458889906691608699810988727629.4%
220289267269252264280301295307273268291238.6%
Limited Express30526062580276226512775 2675
439428443470453429 445
442228241268277256249252274283281254268145.4%
45013891396149515671545163516181704177117231478169021214.3%
4604586468346204528443248624874495048964637457048442746.0%
487382537794103428540923840379841984437398240174051340.9%
534300230153114297529082853300530943032287330032971−31−1.0%
550317631363316328931901618166417891747165532211695−1527−47.4%
Shuttle6036555645570146921711164037330743572796764681170422313.4%
6074243505161635275676649651530.8%
Rapid705756177418519841882087347762680998241789280897841−248−3.1%
7106977693081558044790571797605884688738428760281865847.7%
72041,60141,21541,80041,09840,11542,24042,81942,72842,10840,01441,16641,9828162.0%
728674765636833672365515724577161026236600966835968−715−10.7%
73046954606480046444673 4684
73313,11912,62113,14612,97512,50712,08512,73012,86112,88511,78512,87412,469−404−3.1%
740752075418097807378943643386842704368417578254065−3760−48.1%
745684367277316730271726430661569237080673670726757−315−4.5%
75420,30420,13722,39022,27121,79320,04920,89022,26322,46821,10821,37921,356−23−0.1%
75712,52712,73013,70213,70013,75412,89713,48614,49714,86113,82913,28313,9146314.8%
760648665946855672365895816608263046198597866496076−574−8.6%
770878685549207903789828527840591889292883689138850−64−0.7%
7809854953410,83710,88110,61410,10010,24611,26611,42510,49510,34410,7063623.5%
7944953510554385462514451205334542155985480522053911703.3%
9109480973010,41411,23410,64811,20611,44912,19713,76513,51510,30112,426212520.6%
EXPO806 18,18119,77620,65621,38222,066
Buses 730,872725,814776,398771,071756,721714,483744,416777,004779,989737,025752,175750,583−1592−0.2%
Total 730,872725,814776,398771,071756,721732,664764,192797,660801,371759,091752,175770,99618,8202.5%
Table A2. Ridership data for bus lines traversing the Gold Line area (within one mile of the line).
Line #July 2009August 2009September 2009October 2009July 2010August 2010September 2010October 2010July–October 2009July–October 2010Average DifferenceDifference (%)
Local through CBD222,08021,62022,59522,62619,65620,10520,34820,65422,23020,191−2040−9.2%
420,63020,40421,65121,41819,37519,03119,54819,31321,02619,317−1709−8.1%
1012,90212,81014,56714,38711,93411,66613,30213,06013,66712,491−1176−8.6%
1416,34616,18718,15818,28516,47716,25117,56117,32217,24416,903−341−2.0%
1626,51126,31127,33227,48525,16924,97426,10126,24826,91025,623−1287−4.8%
1826,78326,53327,86927,74024,85324,58125,59025,19227,23125,054−2177−8.0%
2017,56917,55018,12817,79416,78916,68916,81217,03617,76016,832−929−5.2%
2627,41327,25928,36328,77727,74427,49528,45028,16727,95327,964110.0%
289470958195459520840080928317865695298366−1163−12.2%
3016,89816,56516,57416,20213,22112,84313,04212,91316,56013,005−3555−21.5%
3323,21422,93123,47522,92211,63711,29911,43011,39623,13611,441−11,695−50.6%
3588538503991110,011791978579008908593208467−852−9.1%
385779575864606476545953936092588761185708−411−6.7%
4017,67717,34418,40918,44917,55117,03817,72217,11517,97017,357−613−3.4%
424859470351205122458945294755481349514672−280−5.6%
4520,84120,59421,75121,35120,92220,72821,88321,53021,13421,2661320.6%
5310,38910,34811,22610,92210,60310,42310,97010,91410,72110,72860.1%
5510,358982711,26511,4549487953810,41110,34010,7269944−782−7.3%
6017,64217,58517,70417,76718,09618,09418,16317,64917,67518,0013261.8%
6242444367440444724647472748744724437247433718.5%
6623,23123,28523,48923,48920,76920,51820,61720,42923,37420,583−2790−11.9%
7013,30113,36513,91613,74311,92211,78112,21511,69313,58111,903−1679−12.4%
7610,67910,55311,04710,89410,43910,38710,88410,70810,79310,605−189−1.7%
7811,45711,40211,80611,58911,34111,24111,77711,34511,56411,426−138−1.2%
8116,90316,72717,81517,74215,96115,85916,90316,81617,29716,385−912−5.3%
835710554859585965477046184952486257954801−995−17.2%
849222911910,1819834877783299121910095898832−757−7.9%
906034601165416496588357536579622562716110−161−2.6%
925675572059665989578357675890576458385801−37−0.6%
946837684969876924613561056314610868996166−734−10.6%
962407238923392098233423072501245523082399913.9%
Local through non-CBD25110,07310,06410,29410,123963196919781937810,1399620−518−5.1%
2522786259032743231272228173025321029702944−27−0.9%
2545996627276917257157597636707417110.6%
2561497138420381735142613591667165816641528−136−8.2%
2581612165117761730149915421689162616921589−103−6.1%
26011,44711,26412,47512,18511,68811,61612,95112,62911,84312,2213783.2%
28717751751187519001976192620081923182519581337.3%
Limited Express43991497297110061111109511441105966111414815.3%
442209209240242205214219237225219−6−2.8%
4442982300830263024 3010 −3010
4451314133913611380120011731226122813491207−142−10.5%
4464122402343244386 4214 −4214
4604238441243674171451643754323417242974347501.2%
4846975702174157884 7324 −7324
4852931281830423283244722702541281030192517−502−16.6%
4873862374341794185355334613856386939923685−308−7.7%
4905548569062836517 6010 −6010
Shuttle6052339237128472533199819502376237825232176−347−13.8%
620646657761774731716709740710724152.0%
6658137899491025711674791844894755−139−15.5%
Rapid70412,47912,38413,31112,62812,17112,07112,81812,79812,70112,465−236−1.9%
7143866372942064197320732243502354140003369−631−15.8%
72038,40538,36738,37037,14137,78737,79838,00336,89838,07137,622−449−1.2%
7288428856288738611812479008267832386198154−465−5.4%
7304951490054585262481445584914503151434829−314−6.1%
7409110903996569705857084048890864093788626−752−8.0%
7457935800382298288712669747523742281147261−853−10.5%
7515967622963506335625660606395606862206195−26−0.4%
7533149304231663320287728442820284031692845−324−10.2%
7608513853689528764871687548831861986918730390.4%
7625267525162576165495446475447527457355081−655−11.4%
7709217915110,13410,153906887189344918896649080−584−6.0%
7946084638764326442551856765829564363365667−670−10.6%
GOLD80421,06524,17522,47621,32234,28535,24735,64934,44022,26034,90512,64656.8%
Buses 621,967617,746652,170646,959563,969557,240583,780576,374634,711570,341−64,370−10.1%
Total 643,032641,921674,646668,281598,254592,487619,429610,814656,970605,246−51,724−7.9%

References

  1. Southern California Association of Governments (SCAG). The 2016–2040 Regional Transportation Plan/Sustainable Communities Strategy. Available online: http://scagrtpscs.net/Pages/FINAL2016RTPSCS.aspx (accessed on 9 October 2017).
  2. Baxandall, P.; Dutzik, T.; Hoen, J. A Better Way to Go: Meeting America’s 21st Century Transportation Challenges with Modern Public Transit; US PIRG: Boston, MA, USA, 2008. [Google Scholar]
  3. Black, W.R. Sustainable transportation: A US perspective. J. Transp. Geogr. 1996, 4, 151–159. [Google Scholar] [CrossRef]
  4. Shiftan, Y.; Kaplan, S.; Hakkert, S. Scenario building as a tool for planning a sustainable transportation system. Transp. Res. Part D 2003, 8, 323–342. [Google Scholar] [CrossRef]
  5. Kennedy, C.; Miller, E.; Shalaby, A.; Maclean, H.; Coleman, J. The four pillars of sustainable urban transportation. Transp. Rev. 2005, 25, 393–414. [Google Scholar] [CrossRef]
  6. Boschmann, E.E.; Kwan, M.P. Toward socially sustainable urban transportation: Progress and potentials. Int. J. Sustain. Transp. 2008, 2, 138–157. [Google Scholar] [CrossRef]
  7. May, A.D. Urban transport and sustainability: The key challenges. Int. J. Sustain. Transp. 2013, 7, 170–185. [Google Scholar] [CrossRef]
  8. Henao, A.; Piatkowski, D.; Luckey, K.S.; Nordback, K.; Marshall, W.E.; Krizek, K.J. Sustainable transportation infrastructure investments and mode share changes: A 20-year background of Boulder, Colorado. Transp. Policy 2015, 37, 64–71. [Google Scholar] [CrossRef]
  9. Un-Habitat. Planning and Design for Sustainable Urban Mobility: Global Report on Human Settlements. 2013. Available online: https://unhabitat.org/wp-content/uploads/2013/06/GRHS.2013.03.pdf (accessed on 28 September 2017).
  10. Werner, C.M.; Brown, B.B.; Tribby, C.P.; Tharp, D.; Flick, K.; Miller, H.J.; Smith, K.R.; Jensen, W. Evaluating the attractiveness of a new light rail extension: Testing simple change and displacement change hypotheses. Transp. Policy 2016, 45, 15–23. [Google Scholar] [CrossRef] [PubMed]
  11. Moore, J.E. Ridership and cost on the long Beach-Los Angeles blue line train. Transp. Res. Part A Policy Pract. 1993, 27, 139–152. [Google Scholar] [CrossRef]
  12. Chakrabarti, S. How can public transit get people out of their cars? An analysis of transit mode choice for commute trips in Los Angeles. Transp. Policy 2017, 54, 80–89. [Google Scholar] [CrossRef]
  13. Nelson, L.J. The Metro Can Take You Farther Than Ever. Here’s Why Ridership Dropped—Again. Available online: http://www.latimes.com/local/lanow/la-me-ln-2016-metro-ridership-decline-20170209-story.html (accessed on 9 October 2017).
  14. Los Angeles County Metropolitan Transportation Authority. Metro Ridership. Available online: http://isotp.metro.net/MetroRidership/Index.aspx (accessed on 1 September 2017).
  15. Romann, E. Transit Civil Rights and Economic Survival in Los Angeles: A Case for Federal Intervention in LA Metro. Available online: http://www.thestrategycenter.org/sites/www.thestrategycenter.org/files/MTA_civil_rights_report_11-11-11.pdf (accessed on 10 October 2017).
  16. Gomez-Ibanez, J.A. A dark side to light rail? The experience of three new transit systems. J. Am. Plan. Assoc. 1985, 51, 337–351. [Google Scholar]
  17. Allen, D.; Hufstedler, G. Bus-and-rail and all-bus transit systems: Experience in Dallas and Houston, Texas, 1985 to 2003. Transp. Res. Rec. J. Transp. Res. Board 2006, 1986, 127–136. [Google Scholar] [CrossRef]
  18. Gomez-Ibanez, J.A. Big-city transit rider snip, deficits, and politics: Avoiding reality in Boston. J. Am. Plan. Assoc. 1996, 62, 30–50. [Google Scholar] [CrossRef]
  19. Kain, J.; Liu, Z. Ridership Models for San Diego and Houston: Prepared for the Federal Transit Administration; US Department of Transportation: Washington, WA, USA, 1995.
  20. Syed, S.J.; Khan, A.M. Factor analysis for the study of determinants of public transit ridership. J. Public Transp. 2000, 3, 1–17. [Google Scholar]
  21. Kim, D.; Ahn, Y.; Choi, S.; Kim, K. Sustainable mobility: Longitudinal analysis of built environment on transit ridership. Sustainability 2016, 8, 1016. [Google Scholar] [CrossRef]
  22. Ding, C.; Wang, D.; Ma, X.; Li, H. Predicting short-term subway ridership and prioritizing its influential factors using gradient boosting decision trees. Sustainability 2016, 8, 1100. [Google Scholar] [CrossRef]
  23. Stanley, R. Continuing Examination of Successful Transit Ridership Initiatives; TCRP Research Results Digest: Washington, DC, USA, 1998. [Google Scholar]
  24. Yoh, A.; Haas, P.; Taylor, B. Understanding transit ridership growth: Case studies of successful transit systems in the 1990s. Transp. Res. Rec. J. Transp. Res. Board 2003, 1835, 111–120. [Google Scholar] [CrossRef]
  25. Hickey, R. Impact of transit fare increase on ridership and revenue: Metropolitan transportation authority, New York city. Transp. Res. Rec. J. Transp. Res. Board 2005, 1927, 239–248. [Google Scholar] [CrossRef]
  26. Zhang, J.; Yan, X.; An, M.; Sun, L. The impact of Beijing subway’s new fare policy on riders’ attitude, travel pattern and demand. Sustainability 2017, 9, 689. [Google Scholar] [CrossRef]
  27. Li, M.; Dong, L.; Shen, Z.; Lang, W.; Ye, X. Examining the interaction of taxi and subway ridership for sustainable urbanization. Sustainability 2017, 9, 242. [Google Scholar] [CrossRef]
  28. Zhang, D.; Wang, X.C. Transit ridership estimation with network Kriging: A case study of Second Avenue Subway, NYC. J. Transp. Geogr. 2014, 41, 107–115. [Google Scholar] [CrossRef]
  29. Los Angeles County Metropolitan Transportation Authority. Maps and Timetables. Available online: http://www.metro.net/riding/maps/ (accessed on 1 September 2017).
  30. Newton, D.; Linton, J. Do Gas Prices Impact Transit Ridership? Sure. But There’s More. Available online: http://cal.streetsblog.org/2015/10/28/do-gas-prices-impact-transit-ridership-sure-but-theres-more/ (accessed on 5 December 2015).
  31. Federal Transit Administration. Before-And-After Studies of New Starts Projects. Available online: https://www.transit.dot.gov/sites/fta.dot.gov/files/docs/FY2013_Before_and_After_Studies_Report_to_Congress_Final.pdf (accessed on 18 August 2016).
  32. Chester, M.; Pincetl, S.; Elizabeth, Z.; Eisenstein, W.; Matute, J. Infrastructure and automobile shifts: Positioning transit to reduce life-cycle environmental impacts for urban sustainability goals. Environ. Res. Lett. 2013, 8, 1–10. [Google Scholar] [CrossRef]
  33. Nelson, L.J.; Reyes, E.A. Metro Agrees to Buy 95 Electric Buses, in the First Step toward an Emissions-Free Fleet. Available online: http://www.latimes.com/local/lanow/la-me-ln-metro-electric-buses-20170727-story.html (accessed on 18 August 2016).
  34. Cao, X.J.; Schoner, J. The influence of light rail transit on transit use: An exploration of station area residents along the Hiawatha line in Minneapolis. Transp. Res. Part A Policy Pract. 2014, 59, 134–143. [Google Scholar] [CrossRef]
  35. Spears, S.; Boarnet, M.G.; Houston, D. Driving reduction after the introduction of light rail transit: Evidence from an experimental-control group evaluation of the Los Angeles Expo Line. Urban Stud. 2017, 54, 2780–2799. [Google Scholar] [CrossRef]
  36. Lane, B.W. The relationship between recent gasoline price fluctuations and transit ridership in major US cities. J. Transp. Geogr. 2010, 18, 214–225. [Google Scholar] [CrossRef]
Figure 1. Expo Line Phase 1 and Gold Line Extension vicinity map.
Sustainability 09 01827 g001
Figure 2. Half-mile-radius (0.8 km) buffer areas of Expo Line Phase 1 stations.
Sustainability 09 01827 g002
Figure 3. Half-mile-radius (0.8 km) buffer areas of Gold Line Extension stations.
Sustainability 09 01827 g003
Figure 4. Bus lines traversing the Expo Line corridor.
Sustainability 09 01827 g004
Figure 5. Change in average weekday ridership in the Expo Line corridor by Month, 2011–2013. Note: Source: LA County Metropolitan Transportation Authority. “Metro Ridership.” http://isotp.metro.net/MetroRidership/IndexSys.aspx.
Sustainability 09 01827 g005aSustainability 09 01827 g005bSustainability 09 01827 g005c
Figure 6. Bus lines traversing Gold Line extension corridor.
Sustainability 09 01827 g006
Figure 7. Change in average weekday ridership in the Gold Line extension corridor by Month, 2009–2011. Source: LA County Metropolitan Transportation Authority. “Metro Ridership”. http://isotp.metro.net/MetroRidership/IndexSys.aspx.
Sustainability 09 01827 g007aSustainability 09 01827 g007bSustainability 09 01827 g007c
Figure 8. Route service changes of bus lines traversing the Expo Line corridor. Source: Metro’s Shakeup GIS files (Post June 2011, Post June 2012).
Sustainability 09 01827 g008
Figure 9. Route Service Changes of Bus Lines Traversing Gold Line extension corridor. Source: Metro’s Shakeup GIS files (Post June 2009, Post June 2010).
Sustainability 09 01827 g009
Table 1. Average weekday ridership and ridership changes in the Expo Line corridor.
Expo Line CorridorSystem-Wide
BusExpo LineTransitBusTransit
Average b RidershipChange
(∆)
Average RidershipChange
(∆)
Average RidershipChange
(∆)
Average RidershipChange
(∆)
Average RidershipChange
(∆)
2011Boarding a752,175------752,175--1,133,182--1,450,971--
2012Boarding750,583−1592
(−0.2%)
20,412--770,99618,821
(2.5%)
1,138,4795297
(0.5%)
1,495,50144,530
(3.0%)
2013Boarding744,623−5960
(−0.8%)
27,3486936
(34.0%)
771,971975
(0.1%)
1,152,53414,055
(1.2%)
1,521,45625,955
(1.7%)
2014Boarding711,392−33,231
(−4.5%)
31,4304082
(14.9%)
742,822−29,149
(−3.8%)
1,099,831−52,703
(−4.6%)
1,455,822−65,634
(−4.3%)
2015Boarding674,941−36,451
(−5.1%)
30,443−987
(−3.1%)
705,384−37,438
(−5.0%)
1,043,255−56,576
(−5.1%)
1,377,239−78,583
(−5.4%)
2016Boarding612,568−62,373
(−9.2%)
43,52413,081
(43.0%)
656,092−49,292
(−7.0%)
945,807−97,448
(−9.3%)
1,302,465−74,774
(−5.4%)
2011–2016Total Change (∆)−139,607
(−18.6%)
43,524
(-)
−96,083
(−12.8%)
−187,375
(−16.5%)
−148,506
(−10.2%)
Note: a Boardings on bus represent unlinked trips for the entire bus routes traversing one-mile service area of the Expo Line (see Appendix A Table A1). b Average ridership represents five-month average weekday ridership for each year (July–November 2011, July–November 2012, July–November 2013, July–November 2014, July–November 2015, and July–November 2016). Source: LA County Metropolitan Transportation Authority. “Metro Ridership”. http://isotp.metro.net/MetroRidership/IndexSys.aspx.
Table 2. Average weekday ridership and ridership changes in the Gold Line extension corridor.
Extended Gold Line CorridorSystem-Wide
BusGold LineTransitBusTransit
Average b RidershipChange
(∆)
Average RidershipChange
(∆)
Average RidershipChange
(∆)
Average RidershipChange
(∆)
Average RidershipChange
(∆)
2009Boarding a634,711--22,260--656,970--1,166,340--1,458,882--
2010Boarding570,341−64,370
(−10.1%)
34,90512,645
(56.8%)
605,246−51,724
(−7.9%)
1,122,758−43,582
(−3.7%)
1,427,349−31,533
(−2.2%)
2011Boarding543,794−26,547
(−4.7%)
39,3054400
(12.6%)
583,099−22,147
(−3.7%)
1,131,1608402
(0.7%)
1,455,11622,767
(1.9%)
2012Boarding540,912−2882
(−0.5%)
43,0563751
(9.5%)
583,968869
(0.1%)
1,162,98631,826
(2.8%)
1,498,74143,625
(3.0%)
2013Boarding539,408−1504
(−0.3%)
44,2541198
(2.8%)
583,661−307
(−0.1%)
1,157,626−5360
(−0.5%)
1,525,83627,095
(1.8%)
2014Boarding507,819−31,589
(−5.9%)
43,692−562
(−1.3%)
551,511−32,150
(−5.5%)
1,099,563−58,063
(−5.0%)
1,455,459−70,377
(−4.6%)
2015Boarding482,650−25,169
(−5.0%)
44,7391047
(2.4%)
527,338−24,123
(−4.4%)
1,049,210−50,353
(−4.6%)
1,382,515−72,944
(−5.0%)
2016Boarding434,930−47,720
(−9.9%)
51,2486509
(14.5%)
486,178−41,210
(−7.8%)
949,226−99,984
(−9.5%)
1,306,117−76,398
(−5.5%)
2009–2016Total Change (∆)−199,781
(−31.5%)
28,988
(130.2%)
−170,792
(−26.0%)
−217,114
(−18.6%)
−152,765
(−10.5%)
Note: a Boardings on bus represent unlinked trips for the entire bus routes traversing one-mile service area of the Gold Line (see Appendix A Table A2). b Average Ridership represents four-month average ridership for each year (July–October 2009, July–October 2010, July–October 2011, and July–October 2012). Source: LA County Metropolitan Transportation Authority. “Metro Ridership”. http://isotp.metro.net/MetroRidership/IndexSys.aspx.
Table 3. Service changes for system-wide bus lines and bus lines traversing Expo Line corridor.
DateAM PeakBasePM PeakOwlTotal
RunsPercent Change
2011–2012
RunsPercent Change
2011–2012
RunsPercent Change
2011–2012
RunsPercent Change
2011–2012
RunsPercent Change
2011–2012
System-Wide aJune 201118470.1%10080.6%1940−2.2%60−1.7%4855−0.8%
June 2012184810141897594818
Expo Line Area bJune 20111188−1.6%6471.9%1223−2.2%51−2.0%3109−1.1%
June 201211696591196503074
Note: a System-wide bus line service change, June 2011–June 2012; b Service changes for individual bus lines traversing Expo Line corridor (within one mile of the line) June 2011–June 2012. Source: Service performance analysis from Metro (Scheduled service operating cost factors report No. 4–24, June 2011, June 2012).
Table 4. Service changes for system-wide bus Lines and bus lines traversing Expo Line corridor.
DateVehicle HoursVehicle Miles
RevenuePercent Change
2011–2012
RevenuePercent Change
2011–2012
System-Wide aJune 201119,690.0−0.1%220,372.8−0.9%
June 201219,677.6 218,475.4
Expo Line Area bJune 201112,751.4−0.3%137,363.5−1.5%
June 201212,709.3 135,356.1
Note: a System-wide bus line service change, June 2011–June 2012; b Service changes for individual bus lines traversing Expo Line corridor (within one mile of the line) June 2011–June 2012. Source: Service performance analysis from Metro (Scheduled service operating cost factors report No. 4–24, June 2011, June 2012).
Table 5. Service changes for system-wide bus line and bus lines traversing Gold Line extension corridor.
DateAM PeakBasePM PeakOwlTotal
RunsPercent Change
2009–2010
RunsPercent Change
2009–2010
RunsPercent Change
2009–2010
RunsPercent Change
2009–2010
RunsPercent Change
2009–2010
System-Wide aJune 20092206−5.4%1125−6.0%2333−3.7%61−3.3%5725−4.8%
June 2010208710572247595450
Gold Line Area bJune 20091214−14.3%636−10.8%1285−13.0%45−4.4%3180−13.0%
June 201010405671118432768
Note: a System-wide bus line service change, June 2009–June 2010; b Service changes for individual bus lines traversing Gold Line area (within one mile of the line) June 2009–June 2010. Source: Service performance analysis from Metro (Scheduled service operating cost factors report No. 4–24, June 2009, June 2010).
Table 6. Service changes for system-wide bus line and bus lines traversing Gold Line Area.
DateVehicle HoursVehicle Miles
RevenuePercent Change
2009–2010
RevenuePercent Change
2009–2010
System-Wide aJune 200922,138.25.5%257,463.4−6.1%
June 201020,916.1 241,663.1
Gold Line Area bJune 200912,668.1−12.9%142,768.3−15.9%
June 201011,035.0 120,070.6
Note: a System-wide bus line service change, June 2009–June 2010; b Service changes for individual bus lines traversing Gold Line area (within one mile of the line) June 2009–June 2010. Source: Service performance analysis from Metro (Scheduled service operating cost factors report No. 4–24, June 2009, June 2010).
Table 7. Service changes for individual bus lines traversing Expo Line corridor (within one mile of line), June 2011–June 2012.
Bus #DateNumber of Runs for the Route (2011–2012)Ridership Change
AM PeakBasePM PeakOwlAverage Difference% Difference
# 30June 20111510192579144.4%
June 20122319252
# 102June 2011333 86052.7%
June 2012666
# 550June 2011759 −1527−47.4%
June 2012525
# 740June 201117716 −3760−48.1%
June 201212613
Note: The table shows the bus routes with the largest changes, not all bus lines in the corridor. Source: Service performance analysis from Metro (Scheduled service operating cost factors report No. 4–24).
Table 8. Service Change for Individual Bus Lines Traversing Gold Line extension corridor (within one mile of line), June 2009–June 2010.
Bus #DateNumber of Runs for the Route (2009–2010)Ridership Change
AM PeakBasePM PeakOwlAverage Difference% Difference
# 30June 20092013242−3555−21.5%
June 20101610192
# 444June 200916411-−3010-
June 2010----
# 445June 2009738-−142-
June 2010----
# 484June 2009261025-−7324--
June 2010----
# 490June 200923624-−6010--
June 2010----
Note: The table shows the bus routes with the largest changes, not all bus lines in the corridor. Source: Service performance analysis from Metro (Scheduled service operating cost factors report No. 4–24).

