Article

The Role of Large and Small Scale Hydropower for Energy and Water Security in the Spanish Duero Basin

1
Geodynamics Department, Complutense University of Madrid, Madrid 28040, Spain/TNT Department, International Institute for Applied Systems Analysis, 2361 Laxenburg, Austria
2
Water Planning Department, Duero Basin Authority (Confederación Hidrográfica del Duero), Valladolid 47004, Spain
3
Geodynamics Department, Complutense University of Madrid, Madrid 28040, Spain
4
ICatalist, Calle Borni 20, Madrid 28232, Spain/University of Leeds, Leeds LS2 9JT, UK
*
Author to whom correspondence should be addressed.
Sustainability 2017, 9(10), 1807; https://doi.org/10.3390/su9101807
Submission received: 19 August 2017 / Revised: 27 September 2017 / Accepted: 29 September 2017 / Published: 6 October 2017
(This article belongs to the Special Issue Energy Security and Sustainability)

Abstract

:
Hydropower has been increasingly seen as a two-fold solution to the provision of renewable energy and water storage. However, the massive deployment of both large and small scale hydropower projects has been reported to cause important environmental impacts at the basin scale. This study assesses the differential contributions to regional energy and water security of large (LHP) and small (SHP) scale hydropower deployment in the Spanish Duero basin, as well as associated cumulative environmental impacts. This is performed through a selection of indicators measured in absolute and relative terms. The results suggest that LHP deployment contributes more to energy and water security, performing better in 10 of the 12 indicators. It also shows higher absolute environmental impacts on flow regime and habitat loss. Meanwhile, when analyzed in relative terms, SHP shows greater impacts in all categories as a result of cumulative effects cascading along the rivers system. These findings suggest that optimizing the use of existing hydropower infrastructure would be beneficial for energy, water and environmental security. This could be implemented by substantially reducing the number of low capacity plants with almost no impact on final energy generation, while enhancing the pumping and storage potential of higher capacity plants.

1. Introduction

The water and energy nexus is increasingly becoming a central concern at scientific, institutional and user levels [1,2]. It is estimated that global demand for energy will increase by 30% by 2040, requiring a boost in global power production [3]. Meanwhile, demands for water are projected to increase some 55% by 2050, as compared to 2000 levels, with the highest increase coming from manufacturing (+400%), electricity (+140%) and the domestic sector (+130%) [4]. As water scarcity becomes increasingly acute and widespread due to climate change, future projections predict that an increase in storage capacity equivalent to 3600 km3, or 40% of current capacity, will be needed to reach the water and energy goals of 2030 [5].
In this context, hydropower has been increasingly seen as a two-fold solution: first, it provides renewable, low carbon and endogenous energy; and second, it increases water storage capacity.
After a golden age during the 1940s, 1950s and 1960s, when hydropower was considered the revelation of clean energies, a series of large scale hydropower projects (LHP) were deployed worldwide. However, ever since, the range of associated environmental and social impacts have become increasingly evident, marking the start of a wide debate over its value [6]. More recently, a countertrend towards small scale hydropower (SHP) projects has emerged, each providing similar benefits to the larger infrastructures, but with reduced impacts due to their smaller size, land and infrastructure requirements. This new panacea has prompted both emerging economies with high untapped hydropower potential and countries with limited capacity for large hydropower technology to deploy a mosaic of SHP projects along river and sub basins. Several examples can be found in China, which has developed a strong hydropower basis in recent decades [7,8], particularly in the Yunnan [9,10] and Tibet regions [11]. Other examples in Asia are found in Turkey [12,13], India [14], Thailand [15] and the transboundary Mekong River region [16]. This trend has also played out in Latin America, where SHP deployments are spreading in countries such as Brazil [17,18] and Colombia [19]. Europe has not lagged behind, with around 21,800 operating small hydropower plants [20] primarily concentrated in 10 European countries: Germany (7512), Italy (2427), France (1935), Sweden (1901), Spain (1047), Poland (722), Romania (274), Portugal (155), and the UK (120) [21]. However, several studies have raised concerns over the cumulative environmental impacts posed by a large deployment of small hydropower projects [22,23], which can match or outweigh those of large hydropower projects providing an equivalent energy output [6,8,9,12,24,25,26]. As such, debate centers around whether or not hydropower should be further promoted and, if so, whether industries should discriminate based on the size of development, and thus their impacts on the environment and short and long term economic sustainability [27,28]. Governments face difficult decisions to balance the pros and cons of continued hydropower development. On the one hand, the continued promotion of multipurpose dams could be essential to meeting future water and energy challenges [5,29], and, on the other hand, there is strong opposition to further development based on environmental and social concerns. Overall, there is need for more evidence-based studies to help guide decision making.
In Europe, deployment of SHP will lead to an 11% increase in energy production and a 38% increase in installed capacity from 2005 to 2020, according to the National Renewable Energy Action Plans (NREAPs). For the same period, an overall 16% rise in installed capacity will result in a 5% increase in electrical generation from LHP stations [30]. In the particular case of Spain, this issue is gaining attention and special relevance since reservoirs play a key role in water, food and energy security, e.g., for hydroelectricity and irrigation. In Spain, a strong pro-dams policy was implemented during the second half of the 20th century, leading to the construction of more than 1300 dams [31]. This involved enhancing the surface supply capacity from 9% to 38%, providing a total water storage capacity of around 53,000 hm3 [31,32]. At present, surface water represents around 62% of total water use [32]. From this 62%, up to 50% is supplied to irrigated agriculture [33], which constitutes the main water consumer with a 68% share of total water withdrawals. Estimates of hydropower energy production and water storage are provided at the national and basin levels by Spanish energy and water planning. However, there are few, if any, assessments of the cumulative effects on water and energy security within the Spanish basins, or of the environmental impacts of each type of hydropower development.
This study aims to supply one of these knowledge gaps by analyzing the differential contributions of large and small scale hydropower to regional water and energy security within the Spanish part of the Duero basin, the largest transboundary basin in the Iberian Peninsula. It also aims to compare the cumulative impacts of each type of development on the river system and surrounding ecosystems. Finally, the authors provide reflection upon potential avenues for reducing the impacts and enhancing the value and future resilience of the hydropower scheme.

2. Materials and Methods

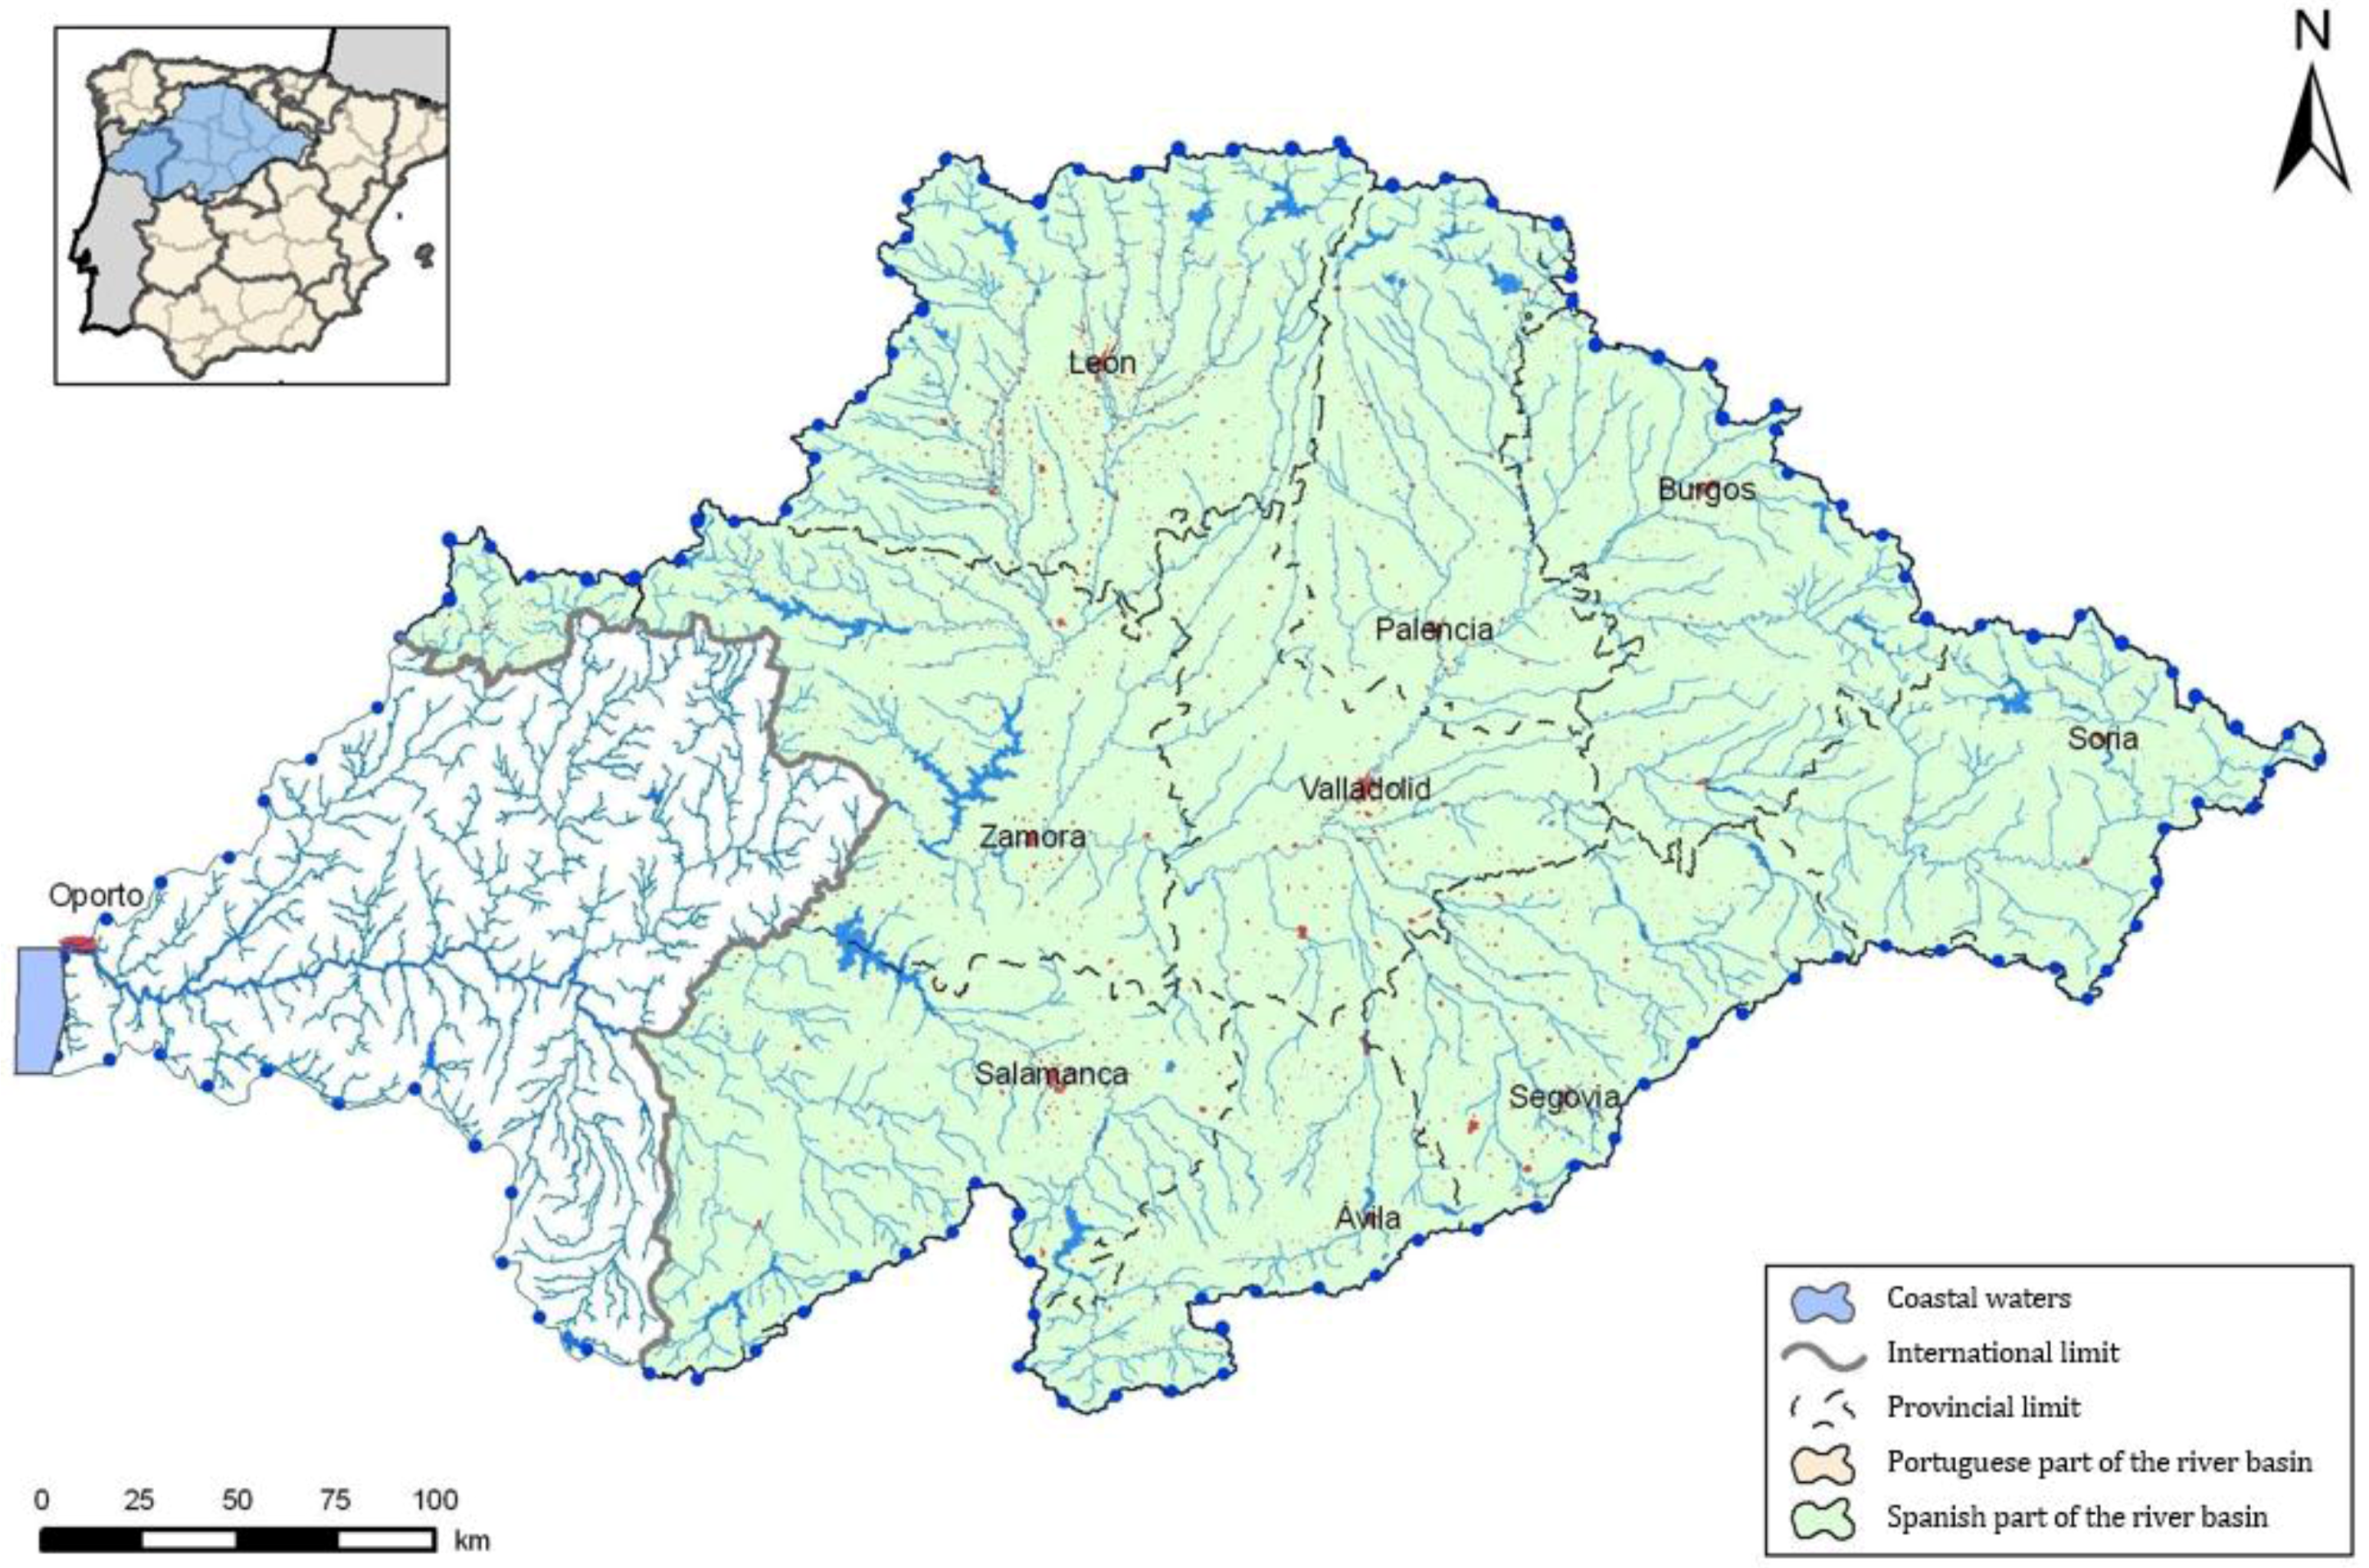
2.1. Study System Description

The Duero Basin is the largest transboundary system in the Iberian Peninsula, covering an area of 98,073 km2 [34]. The longest river, the Duero, is born in the Iberian Mountains and runs through 770 km in Spain and 143 km in Portugal before reaching the Atlantic Ocean at the Portuguese city of Porto [35]. The upstream part of the river flows through sedimentary, metamorphic and plutonic rocks along the Iberian and Central Mountains. Further downstream, it crosses a wide Cenozoic basin formed from terrigenous and evaporite deposits laid down during the Tertiary and Quaternary periods. It reaches depths of over 2000 m and encompasses a complex groundwater system [34]. The catchment is formed by a dendritic drainage network 83,200 km long. The main tributaries come from the Cantabric and Leon Mountains, which flow down into the right bank of the Duero. Especially relevant are the Pisuerga and the Esla Rivers, which provide the greatest flow contributions to the basin [36]. On its way down to the Portuguese frontier, the Duero River forms the Arribes canyon along a 100 km stretch. This study will focus on the Spanish part of the basin, holding 80% of the surface (78,859 km2) and supplying a population of 2,200,000 inhabitants [35]. The study area encompasses eight provinces (some of them only partially), although 98% of its surface and population fall within the Castilla Leon region as shown in Figure 1.
The Spanish Duero basin has a continental Mediterranean climate. The average rainfall is 625 mm/year, providing a total 13,600 Mm3 of available water annually. However, rainfall patterns are characterized by erratic inter-annual and intra-annual spatial and time variability. This is mainly due to a changing climate, with typical Mediterranean summer droughts alternated with cold and hot Atlantic fronts that result in intense precipitation and flooding episodes [36]. These characteristic and long-standing summer droughts triggered the creation of the first dams for irrigation purposes during the 19th Century [31].
The Spanish part of the Duero River has 75 large reservoirs associated with significant dams, and several small reservoirs associated with minor dams or irrigation diversion structures. Eighteen of these 75 large reservoirs are owned and operated by the state for purposes including river flow regulation, water supply and recreation, and 40 are used for hydropower generation, either as single purpose or combined with other purposes such as irrigation or recreation.
The total consumptive (consumptive use of water is defined as “water use that permanently withdraws water from its source; water that is no longer available because it has evaporated, been transpired by plants, incorporated into products or crops, consumed by people or livestock, or otherwise removed from the immediate water environment” [37]) water demand in the basin is 4529 hm3 [36]. Agriculture and hydropower production are the most important water users, concentrating over 85% of consumptive water demand and over 90% of non-consumptive water demand, respectively. The basin plays an important role in national energy and food production. Hydropower supplies almost 25% of the national energy demand, while local agricultural production of grain contributes 24% of the national total grain [35]. However, such demands have led to competition for water resources, particularly in dry periods, with unavoidable impacts on aquatic ecosystems. This has resulted in stricter regulations for maintaining minimum ecological flows [38,39].
In terms of ecosystems, the basin holds considerable ecological richness with 97 areas declared as Sites of Community Interest (SIC) under the Habitat Directive—from which 86 are water related, and 54 Special Protection Areas exist under the Birds Directive [36].

2.2. Study Design and Data Procurement

The Spanish part of the Duero basin contains 164 hydropower stations with installed capacities ranging from 8 to 855 MW [40]. In Spain and most European and non-European countries, the distinction between high scale and small scale hydropower depends on the installed capacity. The limits for “small scale” are generally set to 10 MW in Europe [6], 25 MW in the United States and up to 50 MW in China [8]. However, despite these generalizations, there is no consensual definition of large and small scale hydropower, nor of the threshold to separate them [8,41,42]. In this study, the European and Spanish definition of large scale hydropower installed capacities above 10 MW and small scale hydropower as capacities below 10 MW will be adopted. Nevertheless, the rationality and appropriateness of using the installed capacity as the standard to differentiate between both technologies will be further analyzed in the discussion section of the paper.
In 2011, the Duero River Basin Agency carried out a revision and update of all hydropower concessions, their production characteristics and compliance with environmental standards—such as the presence of fish passes and the minimum environmental flow—through a series of field visits and on-site data collection. The outcomes of the revision were compiled in a General Report [40] and a set of fact sheets containing information for each hydropower project, which have served as the main data source for this study. According to this information, there are currently 23 large scale and 141 small scale hydropower plants operating in the Spanish part of the Duero basin, with total installed capacity of 3,923.42 MW. In terms of plant typology, 122 of the 164 plants have a Run-of-River (RoR) (Run-of-River (RoR) plant: a plant that harnesses energy for electricity production mainly from the available flow of the river [43]) configuration, and the remaining 42 are associated with large dams and reservoirs (hereinafter referred to as Reservoir Hydropower (RHP)) (Reservoir Hydropower (RHP) plant: a plant associated with artificial reservoirs created by building a dam to control the natural river flow [43]). Amongst the latter, 27 are state-owned and operated. Amongst the RoR plants, 118 have diversion points associated with a small dam with average heights between 5 and 10 m, 12 benefit from a waterfall created by a canal, and one utilizes the emerging water from a spring. Figure 2 shows the distribution of small and large scale hydropower plants along the basin.
The methodology used to evaluate the LHP and SHP cumulative environmental impacts and contributions to regional water and energy security consists of a set of assessment indicators. Water and energy security indicators have been selected from existing conceptualizations. The selection of impact categories and indicators has been based upon literature review and adapted to data availability. The outline of categories and indicators designed for the study is presented in Table 1 and described here below.

2.2.1. Impact Category 1: Contribution to Energy Security

Energy security has been defined and characterized in many different ways, and multiple indicators have been proposed for its assessment. In general, the concept of “energy security” applied to a region or country refers to the vulnerability of its energy supply to economic, geopolitical, environmental and performance influences [54,55]. International debate surrounds the conceptualization of the different dimensions integrating energy security. Different categorizations have been proposed by several authors and institutions [55,56,57,58], which mostly present a common base (availability, economic and stewardship aspects) with slight variations depending on the additional external factors included (social, climate change, health, and geopolitical, amongst others). In this study, the conceptualization proposed by Sovacool and Brown (2010) [57] will be considered and adapted for the regional river basin scale. These authors define energy security using four base components: resource availability (independence, diversification and continuity of supply), affordability (affordable prices, stability of prices, and quality of supply), efficiency (production costs, demand behavior and practices) and environmental stewardship (control of environmental externalities and shift towards renewables). The cumulative contributions of currently operating LHP and SHP to these in the basin will be assessed through the following indicators:
Resource availability is evaluated by considering the existing potential for energy production, continuity of supply and diversification. Since focus is placed on two particular energy sources and not on the full mix, diversification will be assessed in terms of physical or spatial diversification of production. Meanwhile, it is assumed that the contribution to independence of both LHP and SHP sources is equal, as both are endogenous energy sources utilizing local resources. The indicators chosen for this category are the following:
-
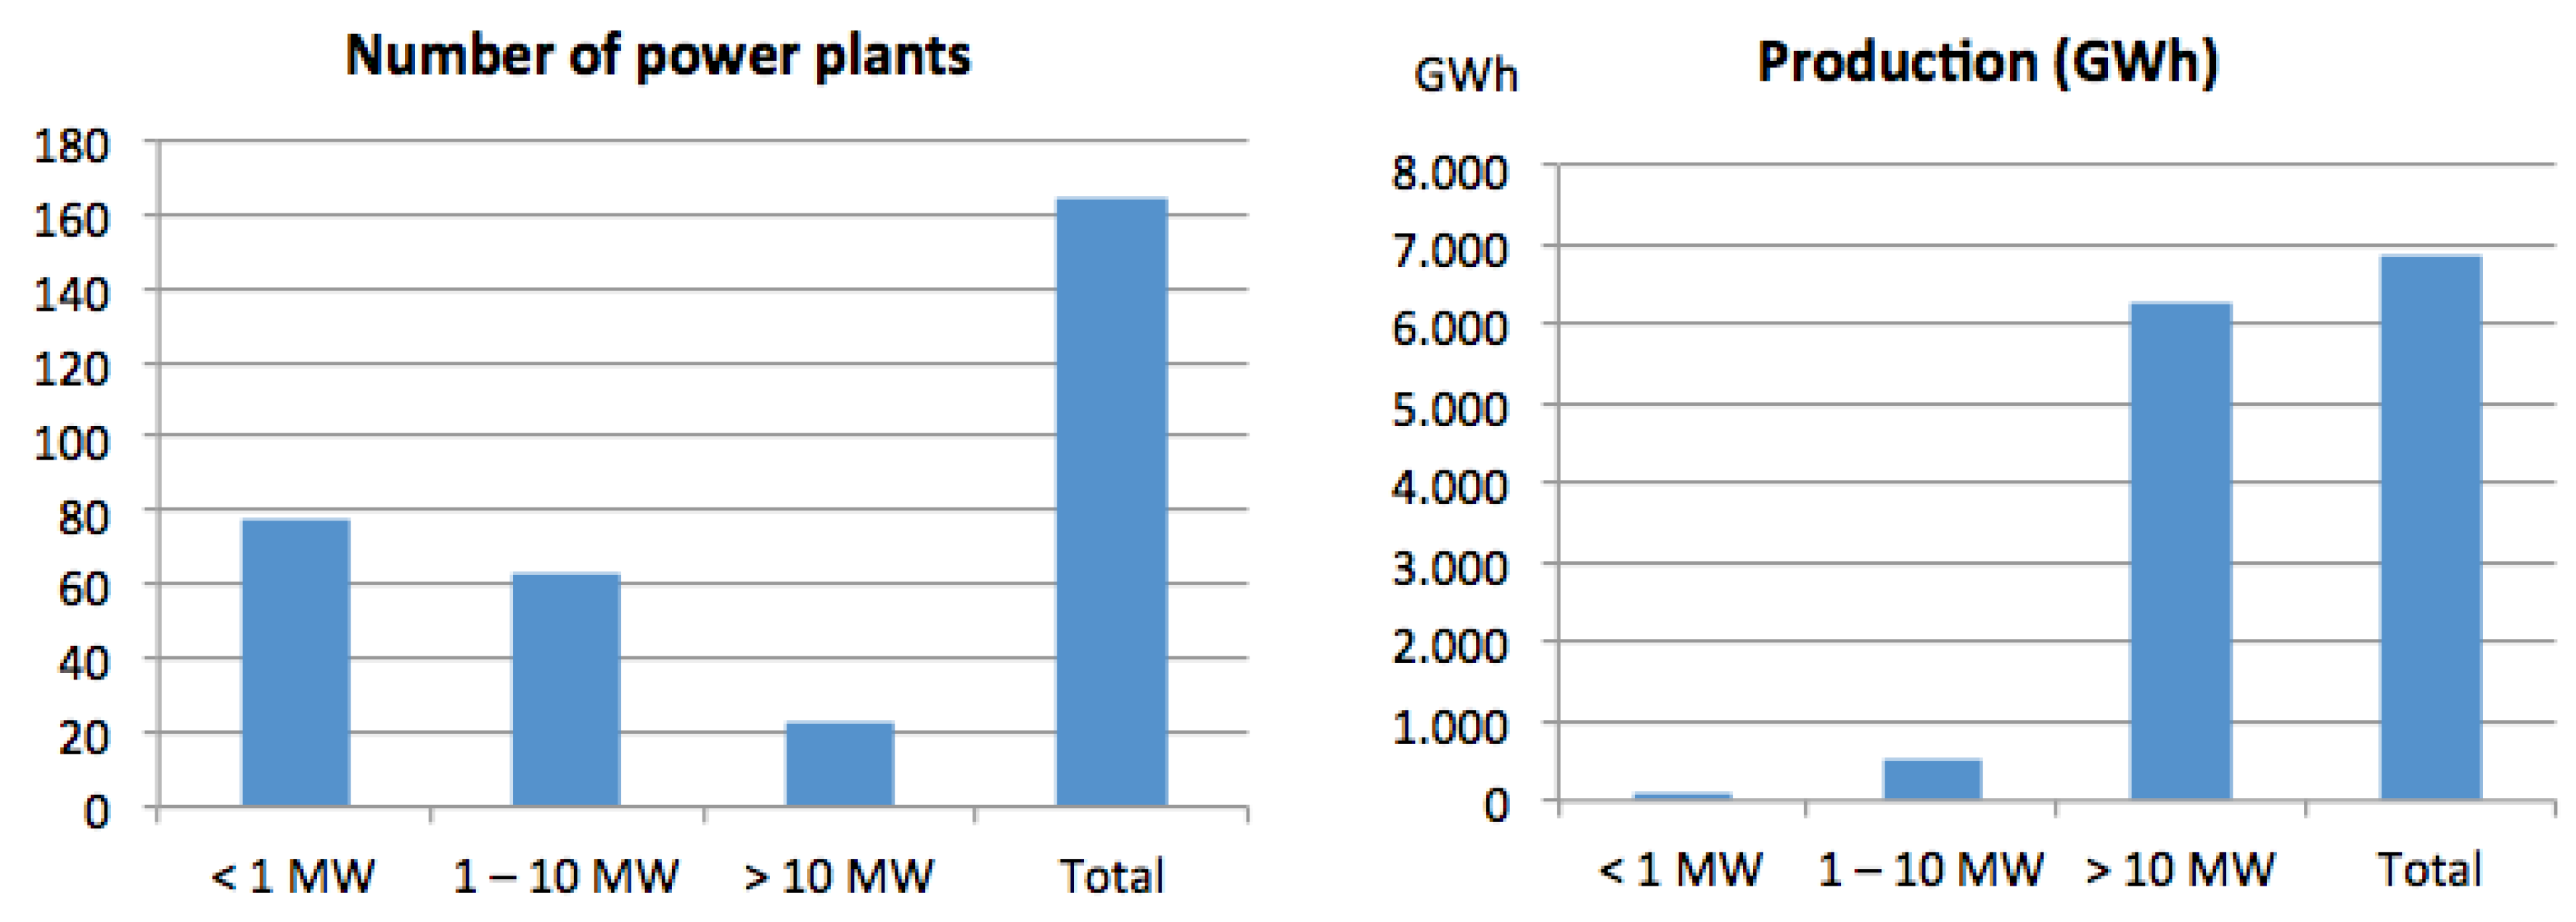
Number of installed units (number): The number of installed units—in this case, hydropower plants—is frequently used in technology and engineering literature as a measure of the extent of technological deployment [44]. The physical distribution of units along the river will also provide information about the spatial diversification of energy production.
-
Installed capacity (MW): Another measure of technological deployment [44] is the cumulative installed capacity for operating small and large scale hydropower plants in MW. The installed capacity for power plants refers to the maximum electrical output of the generator, and is usually measured in Watts (W) [45]. Data were obtained from the Duero River Basin Revision Report [39].
-
Annual power generation (GWh/year): The annual power generation is the cumulative amount of power produced over a year. It is usually expressed in GWh/year and calculated as a product of the installed capacity and number of operating hours [45]. For the purpose of this study, data from empirical estimations were selected over theoretical production values, when available, as they provide more accurate cumulative estimations. Data were obtained from the Duero River Basin Revision Report [40].
-
Contribution to supply security: This contribution will be assessed from estimates of the share of installed capacity that enables energy production control and adaptation to demand fluctuations, thus providing supply stability [46].
-
Regulated capacity (%): This is expressed as a percentage of total installed capacity, and allows for time-controlled energy production, mainly through the presence of a dam that regulates capacity [46].
-
Reversible capacity (%): This represents the percentage of installed capacity coupled to pumping or reversible systems. These systems do not only enable control over the timing of energy production, but also help offset production peaks generated by other energy sources while restoring water volume in the reservoir [46].
Affordability: Given that hydropower energy production does not directly depend on the use of (often imported) fuels and thus on their price, it is assumed that the main technological factor influencing the final price of electricity is the cost of energy production [59]. Meanwhile, the quality of energy provided (such as access to electricity, fuels or primary biomass as defined by Sovacool and Brown (2010) [57]) is assumed to be equal for LHP and SHP, since in both cases the final output is electricity that is injected into the grid and cannot be distinguished from electricity coming from other energy sources. Affordability is assessed through the following indicator:
-
Normalized energy cost (c€/kWh): Average normalized energy costs for power stations are calculated for units below 10 MW and above 25 MW [46]. Data for Spain were obtained from IDAE (2011) [46].
Efficiency: The efficiency of the energy supply will be assessed using its capacity to cover the existing energy demand in the region. Impacts related to demand behavior are not considered, since the assessment focuses upon supply.
-
Energy demand covering capacity (%): This indicator represents the percentage of regional energy demand that is covered by each type of hydropower production. It is obtained as a fraction of the total annual energy production to regional energy demand. Data for regional energy demand were approximated to the Castilla and León region, which occupies 98% of the territory of the basin. This indicator has been defined at a regional scale to maintain coherence within the study and provide a perspective of the region. However, it should be noted that Spain has an integrated energy system that is regulated and managed upon a national scale.
Environmental stewardship: Environmental stewardship is assessed in the section on environmental impacts, where the cumulative extent of impacts from each type of technological development is estimated for certain variables. The impact of environmental stewardship is presented separately since it influences and is influenced by both energy and water security.

2.2.2. Impact Category 2: Contribution to Water Security

Water security, as in the case of energy security, has been extensively conceptualized in the literature. In line with key conceptual frameworks, Lautze and Manthrithilake (2012) [60] proposed an indicator that evaluates water security using five components: water availability to meet household demand, water availability for food production, preservation of environmental flows, risk management, and independence. As in the case of energy security, the independence factor is considered equal for both types of hydropower developments. Indicators for the other components have been defined as follows.
Water access and supply
-
Water storage capacity (hm3): Water storage capacity of dams is an indicator of the available supply for human needs [47]. This indicator shows the amount of water stored in dams associated with hydropower plants.
-
Water demand covering capacity (%): Expressed as the ratio between water supplied by hydropower dams to total water demand, this indicator shows the contribution of hydropower dams to regional water demands.
Irrigation supply
-
Hydropower plants connected to infrastructure providing irrigation services (%): Hydropower plants can contribute to the supply of water for irrigation when they entail the construction or contribute to the maintenance of associated infrastructure that provides water for irrigation [43,48]. This indicator reflects the percentage of hydropower plants with associated infrastructure, including multipurpose dams, canals and small ponds that currently provide water for irrigation in the basin.
-
Water storage capacity of dams with energy-irrigation purposes (hm3): Dams have traditionally ensured that water is available for human supply and irrigation in periods of scarce rainfall and river flow declines [49]. Thus, a variation to the water storage capacity indicator [50] is proposed, depicting the water storage capacity of dams with irrigation purposes. This indicator would therefore assess the water availability for irrigation from dams with shared energy-irrigation purposes.
Environmental flows
-
Hydropower plants not meeting environmental flows (%): Hydropower plants can threaten the maintenance of environmental flows if the amount of flow released downstream of the dam, or left in the stretch between the diversion and restitution points, does not meet minimum ecological requirements [38,39]. The Spanish Water Plan defines ecological flows as “the minimum flow [needed] to allow a sustainable maintenance of the functionality and structure of aquatic ecosystems and related terrestrial ecosystems, helping to achieve the good ecological status of rivers” [35]. The proposed indicator shows the percentage of hydropower plants where insufficient flows were identified in certain periods of the year and a special regime of environmental flows had to be applied, as reported by the technical documentation supporting the last review of the Duero Water Plan [36]. The indicator reflects the relative contribution of each type of hydropower development to disrupted environmental flows in the basin where, as a consequence, additional regulation and management measures are required.
Flood risk reduction
-
Hydropower plants enabling flood regulation (%): Dams with regulation capacity reduce the risk of extreme floods [41,48]. Severe floods can cause important economic and human losses—factors that will be considered in the analysis of water security. The cumulative contribution of small and large scale hydropower capacity to flood risk mitigation will be assessed as a percentage of hydropower plants associated with dams with flood regulation functions. Data were obtained from the last update to the Duero Water Plan [36].
It should be noted that dams also mitigate periodic regular flooding, which performs important functions including river morphology and flood plain configuration, spatial heterogeneity—a basis for biodiversity—aquifer recharge and natural fertilization of the alluvial soil. This has allowed humans to settle in sites close to the riverbed which were not previously viable, but has also engendered negative consequences to the river ecosystem and increased the risk of flooding for those communities [61].

2.2.3. Impact Category 3: Environmental impacts

Hydropower plants have several environmental impacts, including impacts on river hydrologic variables, water quality, aquatic and connecting ecosystems, land occupation and emissions to the atmosphere [30,41,48]. The selection of impact categories for this study has been strongly influenced by the availability of data, time and resources, and is oriented towards river hydrology and ecosystems. However, the authors acknowledge the importance of other categories such as greenhouse gas emissions or water pollution, and recommend the evaluation of these impacts in further studies.
This assessment will focus on the cumulative impacts on river flow and water balance, riverine protected habitats, river connectivity, and aquatic ecosystems, through the following indicators:
Flow regime
-
Water withdrawal (hm3): Water withdrawal refers to the total water flow through the turbines annually [35]. This is estimated using the following equation:
WW = QI x h
where QI is the mean input flow coming into the turbines (m3/h) and h is the number of operating hours per year.
-
Water consumption (hm3): Consumptive water use accounts for evaporation losses from the surface of artificial reservoirs that feed hydropower plants [51,52]. Although the authors acknowledge that a more complex indicator would provide a more accurate assessment of the water footprint of reservoirs [48,51], for the purpose and conditions of this study, this method was regarded as optimal. Due to data limitations, only evaporation from reservoirs over 0.5 hm3 has been considered. Evaporation from smaller reservoirs or river enlargements caused by small dams can be considered negligible, according to the Duero Water Plan estimations [35].
-
Length of river with disturbed natural flows (km): The retention of water in dams and its diversion into lateral channels impact natural river flow [8,53]. This indicator estimates the cumulative length of river stretches with modified natural flow as a result of lateral diversion or the presence of dams. The indicator is obtained as a sum of the distances between the catchment and the release points for each hydropower project. In the case of hydropower plants associated with a dam, the length of river occupied by the reservoir is also included. Distances were measured on aerial photographs, using geographical coordinates of the catchment and release points from CHD (2011) [40].
Connectivity
-
Number of dams (number): Dams reduce the natural river flow velocity, retain transported sediments and cause disturbances to water temperatures [30,42], thus disrupting the upstream-downstream connectivity. This indicator shows the number of dams—either large dams storing water in reservoirs or small dams for water diversion—associated with hydropower plants as an indicator of cumulative river segmentation.
-
Percentage of non scalable dams (%): Dams can constrain habitat connectivity [8,24,62] and hinder the migration of certain fish species [63]. The number of dams not including effective fish ladders is used as an indicator of cumulative segmentation and barriers to fish migration. Due to data availability limitations, only the effects on fish have been considered. However, it should be noted that the river biota is composed of a far more complex network of organisms that are affected by disruptions to river connectivity.
Habitat loss
-
Reservoir surface area (ha): The creation and filling of a reservoir involves the occupation of land and the transformation of original habitats [64,65], which in the case of large reservoirs can affect hundreds of hectares of native ecosystems. To assess this impact, the cumulative surface occupied by reservoirs associated with each type of hydropower plant is used as an indicator of habitat loss [8].
For water security and impact indicators, absolute and relative values are provided, except for those already expressed as a percentage. The absolute value arises from the sum of individual values from the different plants of each type of hydropower development and provides a macro-perspective. The relative value expresses the normalized values per kWh, enabling a balanced comparison [8].
Initially, an additional impact category to assess the disturbance effect of hydropower projects on conservation areas was to be included. This was based on the premise that dams and water flow disturbances might indirectly influence off-site habitats and thus cause negative effects on nearby protected areas [66]. This appeared relevant since the Duero basin has remarkable ecological value, with around 16.3% of its surface designated as Sites of Community Interest (SIC) by the Habitats Directive, and 18.35% as Special Protected Areas (SPA) by the Birds Directive, such that 23.06% of the total surface holds some kind of protected legal status, after accounting for overlap [36]. Moreover, it was found that 70% of LHP and 52% of SHP were located within these areas. However, it was also noted that most of these SIC were created to protect riverine vegetation formations that had developed subsequent to the installation of the dams and reduction of river flows downstream, which allowed vegetation to expand and colonize the flood plain. Meanwhile, the large number of reservoirs and lentic ecosystems resulting from the installation of the dams also attracted a number of bird species, especially from the mallard group, which motivated their declaration as SPAs. The subsequent debate over “who was first” renders the assessment of disturbance by hydropower projects paradoxical for natural sites that had artificially emerged as a consequence of hydropower installation. It was thus decided not to include this impact category in the study. Nevertheless, the authors found it relevant to include a mention, since it may apply to other European basins, and highlights the problem of overvaluing certain ecosystems—sometimes as a result of poorly understood conservation currents—to the detriment of the original though maybe less “idyllic” habitats.
Data for indicators for which a source has not been explicitly mentioned in the description were obtained from the Duero River Basin Revision Report [40]. A summary of the data used in the assessment is provided in Tables S1 and S2.

3. Results

3.1. Contributions to Energy Security

Table 2 presents the results for the energy security indicators.
The analysis of resource availability shows that the number of plants is almost seven times higher for SHP than for LHP. Figure 2 also demonstrates how SHP developments are more evenly distributed along the river, whereas LHP tend to concentrate in the downstream part of the basin. This suggests that SHP provides higher physical diversification of energy production, reducing vulnerability to localized weather or human-related disasters, such as regional droughts, floods, overflowing or breakage of dams, because of the spatial decentralization of production.
Both the larger installed capacity and energy generation capacity of LHP outweigh SHP by one order of magnitude. When it comes to supply security, 100% of LHP energy production is time controllable, and almost 35% of its installed capacity, enabling energy storage through hydraulic pumping. Meanwhile, 20% of SHP installed capacity is time controllable, and it accounts for no hydraulic pumping and storage capacity. This illustrates the greater role played by LHP in grid stability, balancing production peaks from other intermittent sources such as solar and wind renewable energies, both of which are abundant in the Castilla Leon region.
In terms of affordability, both sources show similar production costs, with an average 0.1 c€/kWh difference. These costs may vary for different projects.
In terms of efficiency, LHP production alone covers almost 70% of the regional energy demand, whereas SHP barely reaches 5%.

3.2. Contributions to Water Security

Table 3 presents the results for the water security indicators. Results are presented in absolute and relative terms (normalized by cumulative energy production for each hydropower deployment). In the indicator column, absolute units (AU) and relative units (RU) are provided for each. As mentioned in Section 2, indicators measured as a percentage are not normalized since they already express a relative value.
Within water access and supply, the results show that total water storage capacity by LHP associated dams is 12 times higher than SHP dams. However, relative water storage per kWh of energy produced is slightly higher for SHP, with a difference of 0.1 m3/kWh. In terms of demand covering capacity, water stored by LHP dams can cover 120% of regional water demands, whereas coverage by water stored in SHP only reaches 20% of regional demands. These results suggest that, from a macro perspective, LHP serves a more important role and contributes more to water supply in the basin. However, relative contributions demonstrate that SHP provides a greater water storage capacity per unit of energy produced.
In terms of irrigation supply, the percentage of LHP power plants associated with infrastructure providing water for irrigation is almost double that for SHP. However, looking deeper into the numbers and the type of hydropower facilities that provide this service, it was observed that all the LHP developments were associated with a large multipurpose dam, which together summed a storage capacity of 2638 hm3, around 60% of total water storage capacity in the basin. Meanwhile, among the SHP providing irrigation services, 32% were located in canals (either built mainly for irrigation purposes or for other purposes including urban water supply or recreation), 14% were RHP with regulation capacity and 11% were RoR plants associated with small dams and ponds connected to irrigation canals. The cumulative storage capacity associated with SHP dams with irrigation purposes is 504 hm3. In relative terms, SHP sustains slightly higher water storage levels per kW generated than LHP. Although exact volumes of irrigation water supply associated with each type of hydropower development have not been estimated due to data availability constraints, the information above seems to support the initial conclusion that LHP makes a larger contribution to water supply for food production than SHP.
The results for environmental flow in Table 2 show that the percentage of power plants identified as not complying with minimum environmental flow requirements during the 2015 water plan update revision was slightly higher for LHP, at 34% compared to 27%.
The authors also explored the composition of the group of SHP not meeting environmental flow requirements via type of technology (RHP or RoR). The aim of this was to investigate whether there were a predominance of RHP, which are mainly associated with large dams. It was observed that from those 27% that did not meet environmental flows, 27% were RHP plants, whereas almost 68% were RoR (the remaining 5% associated with a canal). Thus RHP plants did not seem to dominate in non-compliance with environmental flows. This is logical given the overwhelming majority of RoR plants within the SHP development in the basin, with a share of 88% compared to 10% RHP (the remaining 2% associated with a canal). However, further analysis of this aspect with statistical tools is required, and is planned as follow up to this work.
In terms of flood risk reduction, the percentage of power plants associated with a dam with a specific function and capacity for flood regulation is higher in the case of LHP, at 34%, compared to 5% for SHP. In the case of SHP, this characteristic is only present in RHP plants. However, in both cases, the performance of a regulation capacity function is not inherent to the presence of a large regulation dam and depends instead upon whether it is operated to fulfil this function. This is an important finding, since it demonstrates that there is further room for management that can unlock potential to minimize impact on environmental flows. These results indicate that LHP makes a higher contribution to water security in terms of flood regulation.

3.3. Environmental Impacts

The results for the environmental impact indicators are summarized in Table 4. As in the case of water security, both absolute and relative values (normalized by cumulative energy production for each hydropower deployment) are provided for all the indicators except for those measured as a percentage. Following the same structure as Table 2, the indicator column provides the absolute units (AU) and relative units (RU).
The results for the flow regime component suggest that the total amount of water flowed through turbines for energy production annually is four times higher for LHP than for SHP. Furthermore, in relative terms, water withdrawals per kWh produced by SHP are three times higher, indicating that lower volumes of water are less efficient in terms of energy production.
In terms of water consumption and river length, the cumulative evaporation from dams associated with LHP exceeds that of dams associated to SHP by a threefold difference. It should be noted, though, that most of the evaporation from SHP comes from dams associated with RHP plants, which have on average wider surfaces. In terms of relative consumption, SHP shows in turn higher water consumption per kWh produced, with a difference of 0.07 m3/kWh. This difference arises from the presence of power plants with relatively low capacities associated with relatively large reservoirs. The length of river affected is twice as large for LHP than for SHP, but, once more, the relative impact per kWh is greater for SHP.
Analysis of connectivity shows that the number of dams or obstacles to river flow associated with each type of hydropower development is by far higher for SHP, which accounts for 139 dams compared to 17 dams associated with LHP. In relative terms, SHP also has a larger number of dams per kWh produced, outnumbering LHP by two orders of magnitude.
In terms of scalability of obstacles, SHP accounts for 51% of partially scalable dams due to the installation of effective fish passes, whereas all the dams associated with LHP are completely unscalable. However, despite these fish passes, the higher total number of SHPs means that the number of unscalable obstacles is still four times higher than for LHP. Therefore, it can be concluded that SHP has considerably greater impacts on river and ecosystems connectivity than LHP in the Duero Basin.
Finally, for habitat loss, the cumulative surface of land occupied by the reservoirs is higher for LHP than for SHP, with almost a threefold difference. In turn, SHP shows higher relative impacts, with a surface occupation per kWh outweighing that of LHP by an order of magnitude.
Overall, the results suggest that LHP has considerably higher absolute impacts on flow regime and habitat loss, whereas SHP has higher impacts per unit of output in all environmental impact indicators.

4. Discussion

The results of this study suggest that, in overall terms, LHP contributes more to energy and water security in the basin than SHP, with performing better in 10 of the 12 indicators assessed. In absolute terms, LHP generates higher cumulative impacts on flow regime and habitat loss, mainly driven by its greater magnitude, whereas SHP shows higher cumulative impacts on river connectivity. Meanwhile, in relative terms, SHP shows higher impacts per unit of energy produced in all the impact categories, showing lower efficiency in terms of impact/energy performance ratio.

4.1. Potential to Increase Energy Security

Within the context of energy security, some potential aspects of each type of energy development are worth highlighting.
First, diversification is important in the context of climate change. The share and physical distribution of energy production is increasingly relevant given future predictions of climate change, which forecast average reductions in rainfall of up to 5% in a scenario where the country experiences a 1 °C temperature increase, leading to river flow reductions between 5% and 14%, and between 8% and 13% for the Duero basin [67]. However, diversification should go hand in hand with minimization of impacts. In the case of the Duero basin, the concentration of LHP in the downstream part of the river makes it highly vulnerable to possible extreme events or localized attacks. SHP, in turn, is more widespread, thus reducing the risks of a multiple collapse caused by localized events. Nevertheless, the number of SHP power plants required for a comparable energy supply capacity is so large that, even outnumbering LHP by seven to one, they will not supply 5% of regional energy demand. Furthermore, they have considerable cumulative impacts on the river system, as also concluded by several studies in different regions such as Abbasi and Abbasi (2011) [6], Bakken et al. (2012) [24], Kibler and Tullos (2013) [8], Hennig et al. (2013) [9], Skinner and Haas (2014) [25] and Konak and Sungu-Eryilmaz (2016) [12]. In particular, the extensive development of up to 22 cascading SHP plants that can be found in the Pisuerga tributary (see Figure 2) does not reduce risks from climate events, since the SHP developments do not account for flood regulation capacity. In turn, the continuous reduction in river flow velocity, almost transforming the lotic system into a lentic one in some stretches, favors an increase in evaporation, and can exacerbate water stress and water quality degradation in drought periods [68]. Meanwhile, individual LHP developments present less vulnerability to rainfall variability due to the flexibility of the storage and regulation capacity, and the potential to function as a flood barrier [46,48].
Second, when it comes to supply security, given the large regulation capacity already in place, the authors think that pumping and storage technologies offer a great potential to drive the Duero region and the whole of Spain towards a higher share of renewable and endogenous energy. Hydropower plants with regulation capacity allow control over the timing of energy production, providing grid stability and offsetting the intermittent production of other renewables. Meanwhile, hydraulic pumping systems enable energy storage, avoiding the loss of surplus production experienced during solar and wind peaks, while providing a spillway for torrential flow during flood events. Currently, only three of the 23 LHP plants have hydraulic pumping systems installed, but physical potential and political intentions exist to promote the necessary refurbishment to these systems in all the Spanish basins, as reflected by the Spanish Renewable Energy Plan 2011–2020 [46].
In strategic terms, tapping the potential to couple low water footprint renewables to hydraulic pumping systems could help foster their expansion and competitiveness in the region, while offsetting production drawbacks [48]. Furthermore, hydraulic pumping systems could help reduce energy costs for irrigation by the provision of completely endogenous energy at a price that, free of the energy price volatility risks inherent to energies using imported fossil fuels, can remain stable. Additionally, the promotion of hydraulic pumping coupled to low water footprint renewables could contribute positively to water security by reducing the pressures on water resources from other local energy generators, such as thermal power and especially bioenergy [69]. This would help reduce the water-energy trade-offs in the region that have been the subject of previous studies [70,71].

4.2. The Potential for Improvement on Water Security and Environmental Sustainability

In terms of water security, this study´s results suggest that LHP contributes more to regional water security than SHP. However, it has been observed that the contributions do not depend upon the size or production capacity of the plants, but rather upon the type (RoR or RHP) and the additional functions of their associated infrastructure and management. When it comes to water storage, for instance, a few low capacity SHP plants are located at the foot of big dams that provide a considerable water supply. The irrigation water supply function is not performed by all large reservoirs, only by those with multiple purposes, whereas the canals and small dams that host some SHP plants are also used as diversion points for irrigation and even urban supply (e.g., Canal de Castilla). Meanwhile, the flood control function has to be balanced with other interests for hydropower production, e.g., maintaining the highest possible water level. In the Duero basin, water level is controlled by periodic release mandates from the “Commission on Dam Water Releases”, which are adapted to seasonal and river flow conditions. The balance between these benefits is readily obtained for projects within one country. Nevertheless, Biba (2016) claims that in more complex cases, such as those of large transboundary projects, conflicting interests can lead to tensions and negative trade-offs that affect water, energy and food security [16].
When examining environmental performance, LHP shows larger cumulative impacts on flow regime and habitat loss due to the extensive space occupied by its reservoirs, and thus the loss of water via surface evaporation or excessive withdrawal. These problems have also been reported in other areas with massive deployments, such as the Yunnan region [9], and challenge the assumption that hydropower is a non-consumptive use of water. Indeed, it may only be non-consumptive in those cases where the hydropower project has been built onto a previously existing dam, such that the main water losses from the reservoir can be attributed to other priority users (such as urban supply and irrigation) and hydropower only profits from the water released. Although research into methods to delimitate and assess the differential water footprint of each user in these cases is being conducted, there is not yet a fully consensual and validated approach [51]. Where the hydropower project includes the creation of its own reservoir, and water is laterally diverted downstream to the turbine once the desired height difference is achieved, or when water is piped and transferred to another basin, the source water is subject to consumptive use.
The results obtained for river connectivity impacts are coherent with those found in other basins worldwide. Similar results were obtained by Kibler and Tullos (2013) [8], Zhao et al. (2012) [66], Bakken et al. (2012) [24], and Konak and Sungu-Eryilmaz (2016) [12]. The identified impacts on fish migrations and thus their reproductive capacity are also highlighted by Xiaocheng et al. (2008) [22], and Bracken (2013) [72]. An extensive deployment of SHP plants seriously impacts river connectivity and intrusion into natural protected areas. Even though none of the LHP have fish passes installed and SHP accounts for ~50% of plants with functional fish passes, the number of unscalable barriers to fish migration posed by SHP plants still exceeds those of LHP plants by four.
Given previous reflections, two trends reported in the literature for the Duero region and the whole of Spain may be particularly relevant. First is the fact that most recent hydropower additions in Spain are not creating significant increases in hydropower production due to water resource limitations [73]. Second is the insignificance of the role played by many SHP developments (especially those below 1 MW capacity) compared to the total hydropower production in the Duero, as reported in the Duero Water Plan (see Figure 3).
Large dams with high capacity hydropower plants associated with them contribute significantly towards energy security in the Duero basin, and have the potential to provide valuable services including water supply, extreme flood reduction and recreation. In fact, multipurpose dams are being increasingly claimed as an important element in the move towards a green and sustainable economy [5,29]. However, these projects must be appropriately managed to maximize their potential services yet minimize their infrastructure and environmental and social impacts. Only a few of the large dams operating in the Duero basin—which are state-owned and operated—have a multipurpose function, while many of them are only used for hydropower production, irrigation or water supply. Usually only those large hydropower projects that are purely private initiatives from electricity companies have been built as single purpose dams for hydropower generation. Reducing the number of small hydropower projects and concentrating energy production to better tap the potential created by already existing infrastructure could help reduce cumulative impacts along the river, while maximizing the value-benefit/impact ratio of the projects. The importance of appropriate operation and management of hydropower projects, especially small ones, has been also claimed by Cheng et al. (2014) as a crucial and underestimated limitation in China [75].
Meanwhile, small capacity RoR projects could better contribute to decentralized production at irrigation canals or distribution pipe works, where energy can be produced using existing infrastructure without introducing additional disturbance to the river system. This potential is also highlighted by Ansar et al. (2014) [28].
However, undertaking an ex-post optimization of the hydropower scheme could have several feasibility constraints. First, there are considerable costs required to refurbish and transform the hydropower system. Second, there may be legal constraints to revoking SHP concessions that were already granted and are within their validity period, and/or the associated relocation cost. When it comes to infrastructure deployment, reversing decisions is a complex and costly process that requires time, investment and negotiations with stakeholders.

4.3. Reconsidering the Definition of Large and Small Hydropower

It has already been suggested by several studies that installed capacity may not be the most appropriate standard for differentiating between large and small scale hydropower, since it is a poor indicator of biophysical impacts [8,76,77]. That is, it fails to distinguish a boundary line between small and large technologies or account for environmental and sustainability performance characteristics. Thus, installed capacity provides a poor measure by which to inform decision making on future energy technology roadmaps. Other standards have been proposed as division criteria, including height of the head, project design, type of diversion device, or type of turbine [6,8]. The analysis in this study suggests that the type of plant (RHP or RoR) is a more functional and significant indicator, since it creates two categories encompassing homogeneous technology designs that exert similar types of impacts and usually cover similar ranges of installed capacity and energy production.
When installed capacity is used to differentiate between hydropower developments, this study augments other previously published work by showing that a comparison of absolute impacts can provide a general picture of the global contributions and impacts at the basin scale. However, it also suggests the need to be cautious in using it as the only basis upon which to compare the extent of impact and environmental suitability [6,8,24]. An energy performance based comparison of cumulative impacts per unit of energy produced is required to attain consistent and scalable results. Furthermore, this study has not included macro socio-economic impacts, which are often determinant.

4.4. Study Limitations

This study was limited by the need to adjust to available data. This has strongly influenced and limited the type of indicators and impact categories selected. Some important impact aspects such as GHG gas emissions, impacts on water quality, solid sediment flows and a broader estimation of effects on aquatic biota could not be assessed due to lack of data and/or methodologies to evaluate their impact, but should, if possible, be included in future evaluations. Meanwhile, a more detailed analysis of the economic and social impacts related to the development of each type of hydropower scheme would provide a more complete and reliable evaluation of the performance in terms of energy security.
In addition, the indicators selected for energy and water security assessments aim to provide a big picture of the differential contributions from each type of hydropower development, and some of them are expressed as relative values (%). For more accurate estimations, a greater variety of indicators would be ideal, and is proposed for further research studies.
Finally, the indicators selected for the Connectivity and Disturbance of ecosystems categories provide only theoretical analyses of potential impacts based on the number of plants and devices installed. Due to time and resource limitations, no fieldwork estimations could be performed. The authors recommend further research with more complex indicators and primary fieldwork measurements to generate a more accurate assessment of impacts.

5. Conclusions

This paper has shown that the sound and apparently logic-based assumption that small hydropower provides an alternative to tap the renewable hydropower potential—with lower and more spatially dispersed impacts than large hydropower due to its smaller size and decentralized location—is not so evident when massively deployed along a river system. In this case, the cumulative effects of a whole series of small plants cascading along thousands of kilometers, hugely disrupting the river flow and transforming the lotic system into a lentic one, may reach or even outweigh the impacts of a few large scale projects. This was the case in some of the tributaries of the Duero River, such as the Pisuerga River, where a cascade of 22 small hydropower projects has consistently reduced the connectivity and the river flow speed, while dramatically increasing the cases (or risk) of eutrophication. Cascading deployment patterns have led to similar results in other basins in Norway, China, Colombia, India and Brazil, yet some countries such as China are continuously pushing forward additional multi-hydropower projects. In the lower Mekong tributaries, 89 new hydropower plants are currently planned or under construction, which will add to the 40 existing ones [16]. Impact assessment evaluations are usually performed at the individual project level, leaving out the cumulative effects. However, carrying out ex-ante studies of the cumulative implications of such developments to the river system and local ecosystems from an aggregated perspective, then comparing them to the anticipated increases in water and energy security, could be critical to preventing further natural degradation and planning sustainable energy-water systems. Furthermore, reversing decisions when it comes to infrastructural deployment is a complex and costly process, which highlights the importance of upfront consideration of these aspects during the hydropower scheme planning stage.
In the case of the Duero basin, large hydropower performs a critical role in ensuring regional water and energy security. Furthermore, it holds an inestimable potential to lead Spain towards a low carbon, low water footprint, and less dependent energy system. Enhanced hydraulic pumping systems coupled to intermittent renewables could help achieve this. Currently, SHP generates higher cumulative impacts per unit of power generated in the basin for all three impact categories considered, mainly due to the massive number of existing plants. In absolute terms, LHP shows higher values for the impact indicators on Disturbance of the river regime and Habitat loss, whereas SHP shows higher impacts on Connectivity. Based on the analysis, the authors recommend the hydropower system be optimized by tapping all possible services provided by existing reservoirs—most of which are single purpose—and concentrating hydropower production around existing infrastructure (existing reservoirs or irrigation or distribution canals). This would reduce impacts relative to the current extended development of small individual projects that require their own diversion device.
Finally, an emerging lesson from the Duero and Spanish experience that could be scalable and transferable to water planning in other basins is the importance of maximizing value while minimizing alteration of natural conditions. When applied to basins in an early stage of hydropower development, this concept involves strategically planning the number, capacity and location of projects to minimize the extent and maximize the spatial dispersion of infrastructure required to achieve the desired energy output and water storage. When it comes to basins with a high degree of hydropower deployment, the principle suggests a re-assessment of the hydropower scheme to evaluate the aggregated impacts as well as the potential need for, and feasibility of, optimization. In the presented case of the Duero basin, some interventions to dismantle infrastructure that provides no essential value—mainly old unused irrigation dams and dikes—have been put in place as a first step under the frame of the “Estrategia de actuaciones en cauces para la mejora del estado de las masas de agua y de la conectividad fluvial en la cuenca del Duero”. As a result of this initiative, the original status of certain river stretches has been restored. Other actions may include tapping and maintaining all the potential services provided by certain infrastructures such as dams, which can prevent the need (and cost) of additional developments, thus reducing cumulative impacts and maximizing the economic and sustainability value of the projects. Meanwhile, fair estimations of available resources and projections for their future evolution (real available potential for hydropower production) should underpin any political decisions about infrastructure development to prevent falling into the misconception that “the more quantity, the higher the value and greater final output”. Instead, the conviction should be “the more quality, the higher the value and variety of benefits”.

Supplementary Materials

The following are available online at https://www.mdpi.com/2071-1050/9/10/1807/s1, Table S1: Metrics for large scale hydropower plants; Table S2: Metrics for small scale hydropower plants.

Acknowledgments

This research received funds to publish in open access from iCatalist and Complutense University of Madrid.

Author Contributions

Beatriz Mayor selected and defined the indicators, compiled and analyzed the data and wrote the paper; Ignacio Rodríguez gathered and provided all the data sources from the Duero River Basin Authority as well as expert information on the area; Elena López Gunn contributed to guide and shape the research and performed an edition and improvement of the writing; and Fermín Villarroya and Esperanza Montero contributed to guide and shape the research and reviewed and edited the document.

Conflicts of Interest

The authors declare no conflict of interest.

References

  1. Hoff, H. Understanding the Nexus. In Background Paper in: Bonn2011 Conference The Water, Energy and Food Security Nexus, Solutions for the Green Economy; Stockholm Environment Institute: Stockholm, Sweden, 2011. [Google Scholar]
  2. United Nations World Water Assessment Programme (WWAP). The United Nations World Water Development Report 2014: Water and Energy; UNESCO: Paris, France, 2014. [Google Scholar]
  3. IEA. World Energy Outlook 2016; International Energy Agency: Paris, France, 2016. [Google Scholar]
  4. OECD. OECD Environmental Outlook to 2050; Organization for Economic Co-operation and Development: Paris, France, 2012. [Google Scholar]
  5. Berga, L. Water Storage and United Nations Sustainable Development Goals (SDG). In Proceedings of the 7th World Water Forum 2015, Daegu & Gyeongbuk, Korea, 1–17 April 2015. [Google Scholar]
  6. Abbasi, T.; Abbasi, S.A. Small hydro and the environmental implications of its extensive utilization. Renew. Sustain. Energy Rev. 2011, 15, 2134–2143. [Google Scholar] [CrossRef]
  7. Chen, Y.B.; Li, S.R. Environmental impacts and environmental protection progress of Three Gorges Hydroelectric Project on the Yangtze River. Des. Hydroelectr. Power Stn. 2001, 17, 65–70. [Google Scholar]
  8. Kibler, K.M.; Tullos, D.D. Cumulative biophysical impact of small and large hydropower development in Nu River, China. Water Resour. Res. 2013, 49, 1–15. [Google Scholar] [CrossRef]
  9. Hennig, T.; Wang, W.; Feng, Y.; Ou, X.; He, D. Review of Yunnan’s hydropower development. Comparing small and large hydropower projects regarding their environmental implications and socio-economic consequences. Renew. Sustain. Energy Rev. 2013, 27, 585–595. [Google Scholar] [CrossRef]
  10. Hennig, T.; Wang, W.; Magee, D.; He, D. Yunnan’s Fast-Paced Large Hydropower Development: A Powershed-Based Approach to Critically Assessing Generation and Consumption Paradigms. Water 2016, 8, 476. [Google Scholar] [CrossRef]
  11. Zhang, L.; Pang, M.; Wang, C.; Ulgiati, S. Environmental sustainability of small hydropower schemes in Tibet: An emergy-based comparative analysis. J. Clean. Prod. 2016, 135, 97–104. [Google Scholar] [CrossRef]
  12. Capik, M.; Osman Yılmaz, A.; Cavusoglu, İ. Hydropower for sustainable energy development in Turkey: The small hydropower case of the Eastern Black Sea region. Renew. Sustain. Energy Rev. 2012, 16, 6160–6172. [Google Scholar] [CrossRef]
  13. Konak, N.; Sungu-Eryilmaz, Y. Does Small Run-of-River Hydro Power Development in Turkey Deliver on Its Sustainability Premise? Soc. Nat. Resour. 2016, 29, 807–821. [Google Scholar] [CrossRef]
  14. Sharma, N.K.; Tiwari, P.K.; Sood, Y.R. A comprehensive analysis of strategies, policies and development of hydropower in India: Special emphasis on small hydro power. Renew. Sustain. Energy Rev. 2013, 18, 460–470. [Google Scholar] [CrossRef]
  15. Aroonrat, K.; Wongwises, S. Current status and potential of hydro energy in Thailand: A review. Renew. Sustain. Energy Rev. 2015, 46, 70–78. [Google Scholar] [CrossRef]
  16. Biba, S. The goals and reality of the water–food–energy security nexus: The case of China and its southern neighbours. Third World Q. 2016, 37, 51–70. [Google Scholar] [CrossRef]
  17. White, S. Small means big in Brazil. Int. Water Power Dam Constr. 2008, 60, 5–19. [Google Scholar]
  18. Ferreira, J.H.I.; Camacho, J.R.; Malagoli, J.A.; Camargo Guimarães, S., Jr. Assessment of the potential of small hydropower development in Brazil. Renew. Sustain. Energy Rev. 2016, 56, 380–387. [Google Scholar] [CrossRef]
  19. Morales, S.; Álvarez, C.; Acevedo, C.; Diaz, C.; Rodriguez, M.; Pacheco, L. An overview of small hydropower plants in Colombia: Status, potential, barriers and perspectives. Renew. Sustain. Energy Rev. 2015, 50, 1650–1657. [Google Scholar] [CrossRef]
  20. EC SETIS. Hydropower Technology Information Sheet; European Commission SETIS: Brussels, Belgium, 2013. [Google Scholar]
  21. Manzano-Agugliaro, F.; Taher, M.; Zapata-Sierra, A.; del Juaidi, A.; Montoya, F.G. An overview of research and energy evolution for small hydropower in Europe. Renew. Sustain. Energy Rev. 2016, 75, 476–489. [Google Scholar] [CrossRef]
  22. Xiaocheng, F.; Tao, T.; Wanxiang, J.; Fengqing, Li.; Naicheng, W.; Shuchan, Z.; Qinghua, C. Impacts of small hydropower plants on macroinvertebrate communities. Acta Ecol. Sin. 2008, 28, 45–52. [Google Scholar] [CrossRef]
  23. Thoradeniya, B.; Ranasinghe, M.; Wijesekera, N.T.S. Social and Environmental Impacts of a Mini-hydro Project on the Ma Oya Basin in Sri Lanka. In Proceedings of the International Conference on Small Hydropower—Hydro Sri Lanka, Kandy, Sri Lanka, 22–24 October 2007. [Google Scholar]
  24. Bakken, T.H.; Sundt, H.; Ruuda, A.; Harby, A. Development of small versus large hydropower in Norway comparison of environmental impacts. Energy Procedia 2012, 20, 185–199. [Google Scholar] [CrossRef]
  25. Skinner, J.; Haas, L.J. Watered down? A Review of Social and Environmental Safeguards for Large Dam Projects; Natural Resource Issues, No. 28; IIED: London, UK, 2014. [Google Scholar]
  26. Manders, T.N.; Höffken, J.I.; van der Vleuten, E.B.A. Small-scale hydropower in the Netherlands: Problems and strategies of system builders. Renew. Sustain. Energy Rev. 2016, 59, 1493–1503. [Google Scholar] [CrossRef]
  27. Aggidis, G.A.; Luchinskaya, E.; Rothschild, R.; Howard, D.C. The costs of small-scale hydro power production: Impact on the development of existing potential. Renew. Energy 2010, 35, 2632–2638. [Google Scholar] [CrossRef]
  28. Ansar, A.; Flyvbjerg, B.; Budzier, A.; Lunn, D. Should we build more large dams? The actual costs of hydropower megaproject development. Energy Policy 2014, 69, 43–56. [Google Scholar] [Green Version]
  29. Branche, E. Sharing the Water Uses of Multipurpose Hydropower Reservoirs. In Proceedings of the 7th World Water Forum 2015, Daegu & Gyeongbuk, Korea, 12–17 April 2015. [Google Scholar]
  30. Arcadis. Hydropower Generation in the Context of the EU WFD; EC DG Environment Project number 11418; ARCADIS Deutschland GmbH: Brussels, Belgium, 2011. [Google Scholar]
  31. Martinez-Cortina, L. Physical and Hydrological Characteristics. In Water Policy in Spain; Garrido, A., Llamas, M.R., Eds.; Taylor and Francis: London, United Kingdom, 2009; Chapter 2; pp. 11–20. [Google Scholar]
  32. Hardy, L.; Garrido, A. Análisis y Evaluación de las Relaciones Entre el Agua y la Energía Papeles de Agua Virtual; Virtual Water Papers; Botín Foundation: Santander, Spain, 2010. [Google Scholar]
  33. López-Gunn, E.; Zorrilla, P.; Prieto, F.; Llamas, M.R. Lost in translation? Water efficiency in Spanish agriculture. J. Agric. Water Manag. 2012, 108, 83–95. [Google Scholar]
  34. De Miguel, A.; Kallache, M.; García-Calvo, E. CWU Model: A Water Balance Model to Estimate the Water Footprint in the Duero River Basin; Zhang, G.P., Hoekstra, A.Y., Tickner, D., Eds.; Value of Water Research Report Series; UNESCO-IHE: Delft, The Netherlands, 2012. [Google Scholar]
  35. CHD. Plan Hidrológico de la Parte Española de la Demarcación Hidrográfica del Duero; Confederación Hidrográfica del Duero: Valladolid, Spain, 2012. [Google Scholar]
  36. CHD. Propuesta de Proyecto de Revisión del Plan Hidrológico de la Parte Española de la Demarcación Hidrográfica del Duero (2015–2021); Anejo 5. Demandas de Agua; Confederación Hidrográfica del Duero: Valladolid, Spain, 2014. [Google Scholar]
  37. Vickers, A. Handbood of Water Use and Conservation; WaterPlow Press: Amherst, MA, USA, 2001; p. 446. [Google Scholar]
  38. Morán-Tejeda, E.; Lorenzo-Lacruz, J.; López-Moreno, J.I.; Ceballos-Barbancho, A.; Zabalza, J.; Vicente-Serrano, S.M. Reservoir Management in the Duero Basin (Spain): Impact on River Regimes and the Response to Environmental Change. Water Resour. Manag. 2012, 26, 2125–2146. [Google Scholar] [CrossRef]
  39. Paredes, J.; Martinez-Capel, F.; Solera, A.; Aguilella, V. Implementing Environmental Flows in Complex Water Resources Systems—Case Study: The Duero River Basin, Spain. In River Research and Applications; Published online in Wiley Online Library (wileyonlinelibrary.com): Oxford, UK, 2011. [Google Scholar] [CrossRef]
  40. CHD. Consultoría y Asistencia para la Inspección y Vigilancia del Cumplimiento del Condicionado de las Concesiones de Aprovechamientos Hidroeléctricos en la Confederación Hidrográfica del Duero; Confederación Hidrográfica del Duero: Valladolid, Spain, 2011. [Google Scholar]
  41. IPCC. IPCC Special Report on Renewable Energy Sources and Climate Change Mitigation; Prepared by Working Group III of the Intergovernmental Panel on Climate Change; Edenhofer, O., Pichs-Madruga, R., Sokona, Y., Seyboth, K., Matschoss, P., Kadner, S., Zwickel, T., Eickemeier, P., Hansen, G., Schlömer, S., et al., Eds.; Cambridge University Press: Cambridge, UK; New York, NY, USA, 2011; p. 1075. [Google Scholar]
  42. ESHA. Environmental Barometer on Small Hydropower; Sherpa Project; European Small Hydropower Association: Brussel, Belgium, 2009. [Google Scholar]
  43. IEA. Hydropower Technology Roadmap 2050; International Energy Agency: Paris, France, 2012. [Google Scholar]
  44. Grubler, A. Technology and Global Change; Cambridge University Press: Cambridge, UK, 1998. [Google Scholar]
  45. EIA. Electricity Generation Capacity and Electricity Generation. US Energy Information Administration. 2013. Available online: http://www.eia.gov/tools/faqs/faq.cfm?id=101&t=3 (accessed on 21 July 2014).
  46. IDAE. Plan de Energías Renovables 2011–2020; Instituto para la Diversificación y Ahorro de la Energía: Madrid, Spain, 2011. [Google Scholar]
  47. UN Water. Set of Key Indicators for the Water Sector. 2014. Available online: http://www.unwater.org/activities/task-forces/indicators/key-indicators/en/ (accessed on 15 January 2015).
  48. IHA. 2013 IHA Hydropower Report; International Hydropower Association: Sutton, UK, 2013. [Google Scholar]
  49. Polimon, J. Water Storage Infrastructures for UN Sustainable Development Goals. ICOLD. In Proceedings of the 7th World Water Forum 2015, Daegu & Gyeongbuk, Korea, 12–17 April 2015. [Google Scholar]
  50. Shiferaw, B.; Freeman, H.A.; Swinton, S.M. (Eds.) Natural Resources Management in Agriculture: Methods for Assessing Economic and Environmental Impacts; CAB International: Wallingford, UK, 2005; p. 382. [Google Scholar]
  51. Herath, I.; Deurer, M.; Horne, D.; Singh, R.; Clothier, B. The water footprint of hydroelectricity: A methodological comparison from a case study in New Zealand. J. Clean. Prod. 2011, 19, 1582–1589. [Google Scholar] [CrossRef]
  52. Mekonnen, M.M.; Hoekstra, A.H. The Water Footprint of Electricity from Hydropower; Value of Water Research Report Series n. 51; UNESCO-IHE: Delft, The Netherlands, 2011. [Google Scholar]
  53. Bunn, S.E.; Arthington, A.H. Basic principles and ecological consequences of altered flow regimes for aquatic biodiversity. Environ. Manag. 2011, 30, 492–507. [Google Scholar] [CrossRef]
  54. Brown, M.A.; Sovacool, B.K.; Wang, Y.; D’Agostino, A.L. Energy Security Dimensions and Trends in Industrialized Countries; Georgia Institute of Technology: Atlanta, GA, USA, 2011. [Google Scholar]
  55. Kruyt, B.; van Vuuren, D.P.; de Vries, H.J.M.; Groenenberg, H. Indicators for energy security. Energy Policy 2009, 37, 2166–2181. [Google Scholar] [CrossRef]
  56. Asia Pacific Energy Research Centre (APERC). A Quest for Energy Security in the 21st Century; Institute of Energy Economics: Tokyo, Japan, 2007.
  57. Sovacool, B.K.; Brown, M.A. Competing Dimensions of Energy Security: An International Perspective. Annu. Rev. Environ. Resour. 2010, 35, 77–108. [Google Scholar] [CrossRef]
  58. Löschel, A.; Moslener, U.; Rübbelke, D.T.G. Indicators of energy security in industrialised countries. Energy Policy 2010, 38, 1665–1671. [Google Scholar] [CrossRef]
  59. EIA. Many Factors Impact Electricity Prices. Energy Information Administration 2014. Available online: http://www.eia.gov/energyexplained/index.cfm?page=electricity_factors_affecting_prices (accessed on 15 December 2014).
  60. Lautze, J.; Manthrithilake, H. Water security: Old concepts, new package, what value? Nat. Resour. Forum 2012, 36, 76–87. [Google Scholar] [CrossRef]
  61. Richter, B.D.; Thomas, G.A. Restoring environmental flows by modifying dam operations. Ecol. Soc. 2007, 12, 12. [Google Scholar] [CrossRef]
  62. Ward, J.V.; Tockner, K.; Schiemer, F. Biodiversity of floodplain river ecosystems: Ecotones and connectivity. Regul. Rivers Restaur. Manag. 1999, 15, 125–139. [Google Scholar] [CrossRef]
  63. Northcote, T.G. Migratory Behavior of Fish and Movement through Fish Passage Facilities. In Fish Migration and Fish Bypass; Jungwirth, M.S., Schmutz, S., Weiss, S., Eds.; Fishing News Books, BlackWell Science: Oxford, UK, 1998; pp. 3–18. [Google Scholar]
  64. Oliver, W.H. Wildlife Problems Associated with Hydropower Reservoirs; Bulletin 3; Washington Game Department, Environmental Management Division: Olympia, WA, USA, 1974. [Google Scholar]
  65. Lewke, R.E.; Buss, I.O. Impacts of impoundment to vertebrate animals and their habitats along the Snake River Canyon, Washington. Northwest Sci. 1977, 51, 219–270. [Google Scholar]
  66. Zhao, Q.; Liu, S.; Deng, L.; Dong, S.; Yang, Z.; Liu, Q. Determining the influencing distance of dam construction and reservoir impoundment on land use: A case study of Manwan Dam, Lancang. River Ecol. Eng. 2012, 53, 235–242. [Google Scholar] [CrossRef]
  67. CEDEX. Evaluación del Impacto del Cambio Climático en los Recursos Hídricos en Régimen Natural; Centro de Estudios y Experimentación de Obras Públicas: Madrid, Spain, 2011. [Google Scholar]
  68. Bond, N.R.; Lake, P.S.; Arthington, A.H. The impacts of drought on freshwater ecosystems: An Australian perspective. Hydrobiologia 2008, 600, 3–16. [Google Scholar] [CrossRef]
  69. IRENA. Renewable Energy. In The Water, Energy & Food Nexus; International Renewable Energy Agency: Masdar City, UAE, 2015. [Google Scholar]
  70. Ballarín, D.; Rodríguez, I. Hidromorfología Fluvial. Algunos Apuntes Aplicados a la Restauración de Ríos en la Cuenca del Duero. MAGRAMA-CHD: Valladolid, Spain, 2013. [Google Scholar]
  71. Mayor, B.; López-Gunn, E.; Villarroya, F.; Montero, E. Application of a water-energy-food nexus framework for the Duero river basin in Spain. Water Int. 2015, 40, 791–808. [Google Scholar] [CrossRef]
  72. Bracken, F.S.A.; Lucas, M.C. Potential impacts of small-scale hydroelectric power generation on downstream moving lampreys. River Res. Appl. 2013, 29, 1073–1081. [Google Scholar] [CrossRef] [Green Version]
  73. Gómez, C.M. La Eficiencia en la Asignación del Agua: Principios Básicos y Hechos Estilizados en España. Economía y Medio Ambiente ICE 2009, 23, 847. [Google Scholar]
  74. Cheng, C.; Liu, B.; Chau, K.; Li, G.; Liao, S. China’s small hydropower and its dispatching management. Renew. Sustain. Energy Rev. 2015, 42, 43–55. [Google Scholar] [CrossRef]
  75. CHD. Datos Sobre Instalaciones Hidroeléctricas en la Cuenca Española del Duero; Authored by José María Rubio Polo, Comisaría de Aguas; Confederación Hidrográfica del Duero: Valladolid, Spain, 2013. [Google Scholar]
  76. Ziv, G.; Baran, E.; Nam, S.; Rodriguez-Iturbe, I.; Levin, S. Trading-off fish biodiversity, food security, and hydropower in the Mekong River Basin. Proc. Natl. Acad. Sci. USA 2012, 109, 5609–5614. [Google Scholar] [CrossRef] [PubMed]
  77. Gleick, P.H. Environmental consequences of hydroelectric development: The role of facility size and type. Energy 1992, 17, 735–747. [Google Scholar] [CrossRef]
Figure 1. Location of the Duero River Basin in the Iberian Peninsula. Source: Oficina de Planificación Hidrológica – Confederación Hidrográfica del Duero (OPH-CHD).
Sustainability 09 01807 g001
Figure 2. Distribution of large scale and small scale hydropower plants in the Spanish part of the Duero Basin.
Sustainability 09 01807 g002
Figure 3. Number of power plants and production by installed capacity range. Adapted from CHD, 2013 [74].
Sustainability 09 01807 g003
Table 1. Outline of categories and assessment indicators.
Impact CategoryComponentIndicatorUnitSource
Contributions to energy securityResource availabilityNumber of installed unitsNumber[44]
Installed capacityMW[44,45]
Annual power generationGWh/year[45]
Security of supplyRegulated capacity%[46]
Reversible capacity%[46]
AffordabilityNormalized energy costc€/kWh[46]
EfficiencyEnergy demand covering capacity%Authors’ own
Contribution to water securityWater access and supplyWater storage capacityhm3[47]
Water demand covering capacity%Author’s owned
Irrigation supplyHydropower plants connected to infrastructure providing irrigation services%[43,48]
Water storage capacity of dams with energy-irrigation purposeshm3[49,50]
Environmental flowsHydropower plants not meeting environmental flows%[38,39]
Flood risk reductionHydropower plants enabling flood regulation%[41,48]
Environmental impactsFlow regimeWater withdrawalhm3[35]
Water consumptionhm3[51,52]
Length of river with disturbed natural flowskm[8,53]
ConnectivityNumber of dams or obstaclesnumber[8]
Percentage of scalable dams%[30,42]
Habitat lossReservoir surface areaha[8]
Table 2. Contributions to energy security of the macro and micro hydropower schemes.
Contributions to Energy Security
ComponentIndicatorMacro Hydropower (LHP)Micro Hydropower (SHP)
Resource availabilityNumber of units (#)23140
Installed capacity (MW)3730205
Annual power generation (GWh/year)7988571
Timely controllable installed capacity (%)10020
Reversible installed capacity (%)34.850
AffordabilityEnergy generation cost (c€/kWh)0.650.75
EfficiencyDemand covering capacity (%)67.74.8
Table 3. Contributions to water security of the macro and micro hydropower schemes.
Contributions to Water Security
ComponentIndicatorMacro Hydropower (LHP)Micro Hydropower (SHP)
AbsoluteRelativeAbsoluteRelative
Water access and supplyWater storage capacity (AU: hm3); (RU: m3/kWh)6821.50.85555.80.97
Water demand covering capacity (%)176.2----20----
Irrigation supplyIrrigation water provision (%)43.5----24.3----
Water storage capacity of dams with energy-irrigation purposes (TU: hm3); (RU: m3/kWh)26383.3 × 10−75048.1 × 10−7
Environmental flowsNon compliance with environmental flows (%)34.8----27.14----
Flood risk reductionFlood risk regulation capacity (%)34.8----5.07----
Table 4. Cumulative environmental impacts of the macro and micro hydropower schemes.
Environmental Impacts
ComponentIndicatorMacro Hydropower (LHP)Micro Hydropower (SHP)
AbsoluteRelativeAbsoluteRelative
Flow regimeWater withdrawal (AU: hm3); (RU: m3/kWh)32,6834.0910,30016.7
Water consumption (evapotranspiration losses)
(AU: hm3); (RU: m3/kWh)
168.90.0254.00.09
Length of river with disturbed natural flows
(AU: m); (RU: m/kWh)
752,2799.41 × 10−5345,2305.52 × 10−4
ConnectivityNumber of dams or obstacles
(AU: units); (RU: units/kWh)
171.95 × 10−91391.94 × 10−7
Percent of scalable dams0-51-
Habitat lossReservoir surface area (AU: ha); (RU: ha/kWh)28,4763.56 × 10−610,9801.78 × 10−5

