Do Sustainable Stocks Offer Diversification Benefits for Conventional Portfolios? An Empirical Analysis of Risk Spillovers and Dynamic Correlations


Abstract
:1. Introduction
2. Literature Review
3. Methodology
4. Empirical Findings
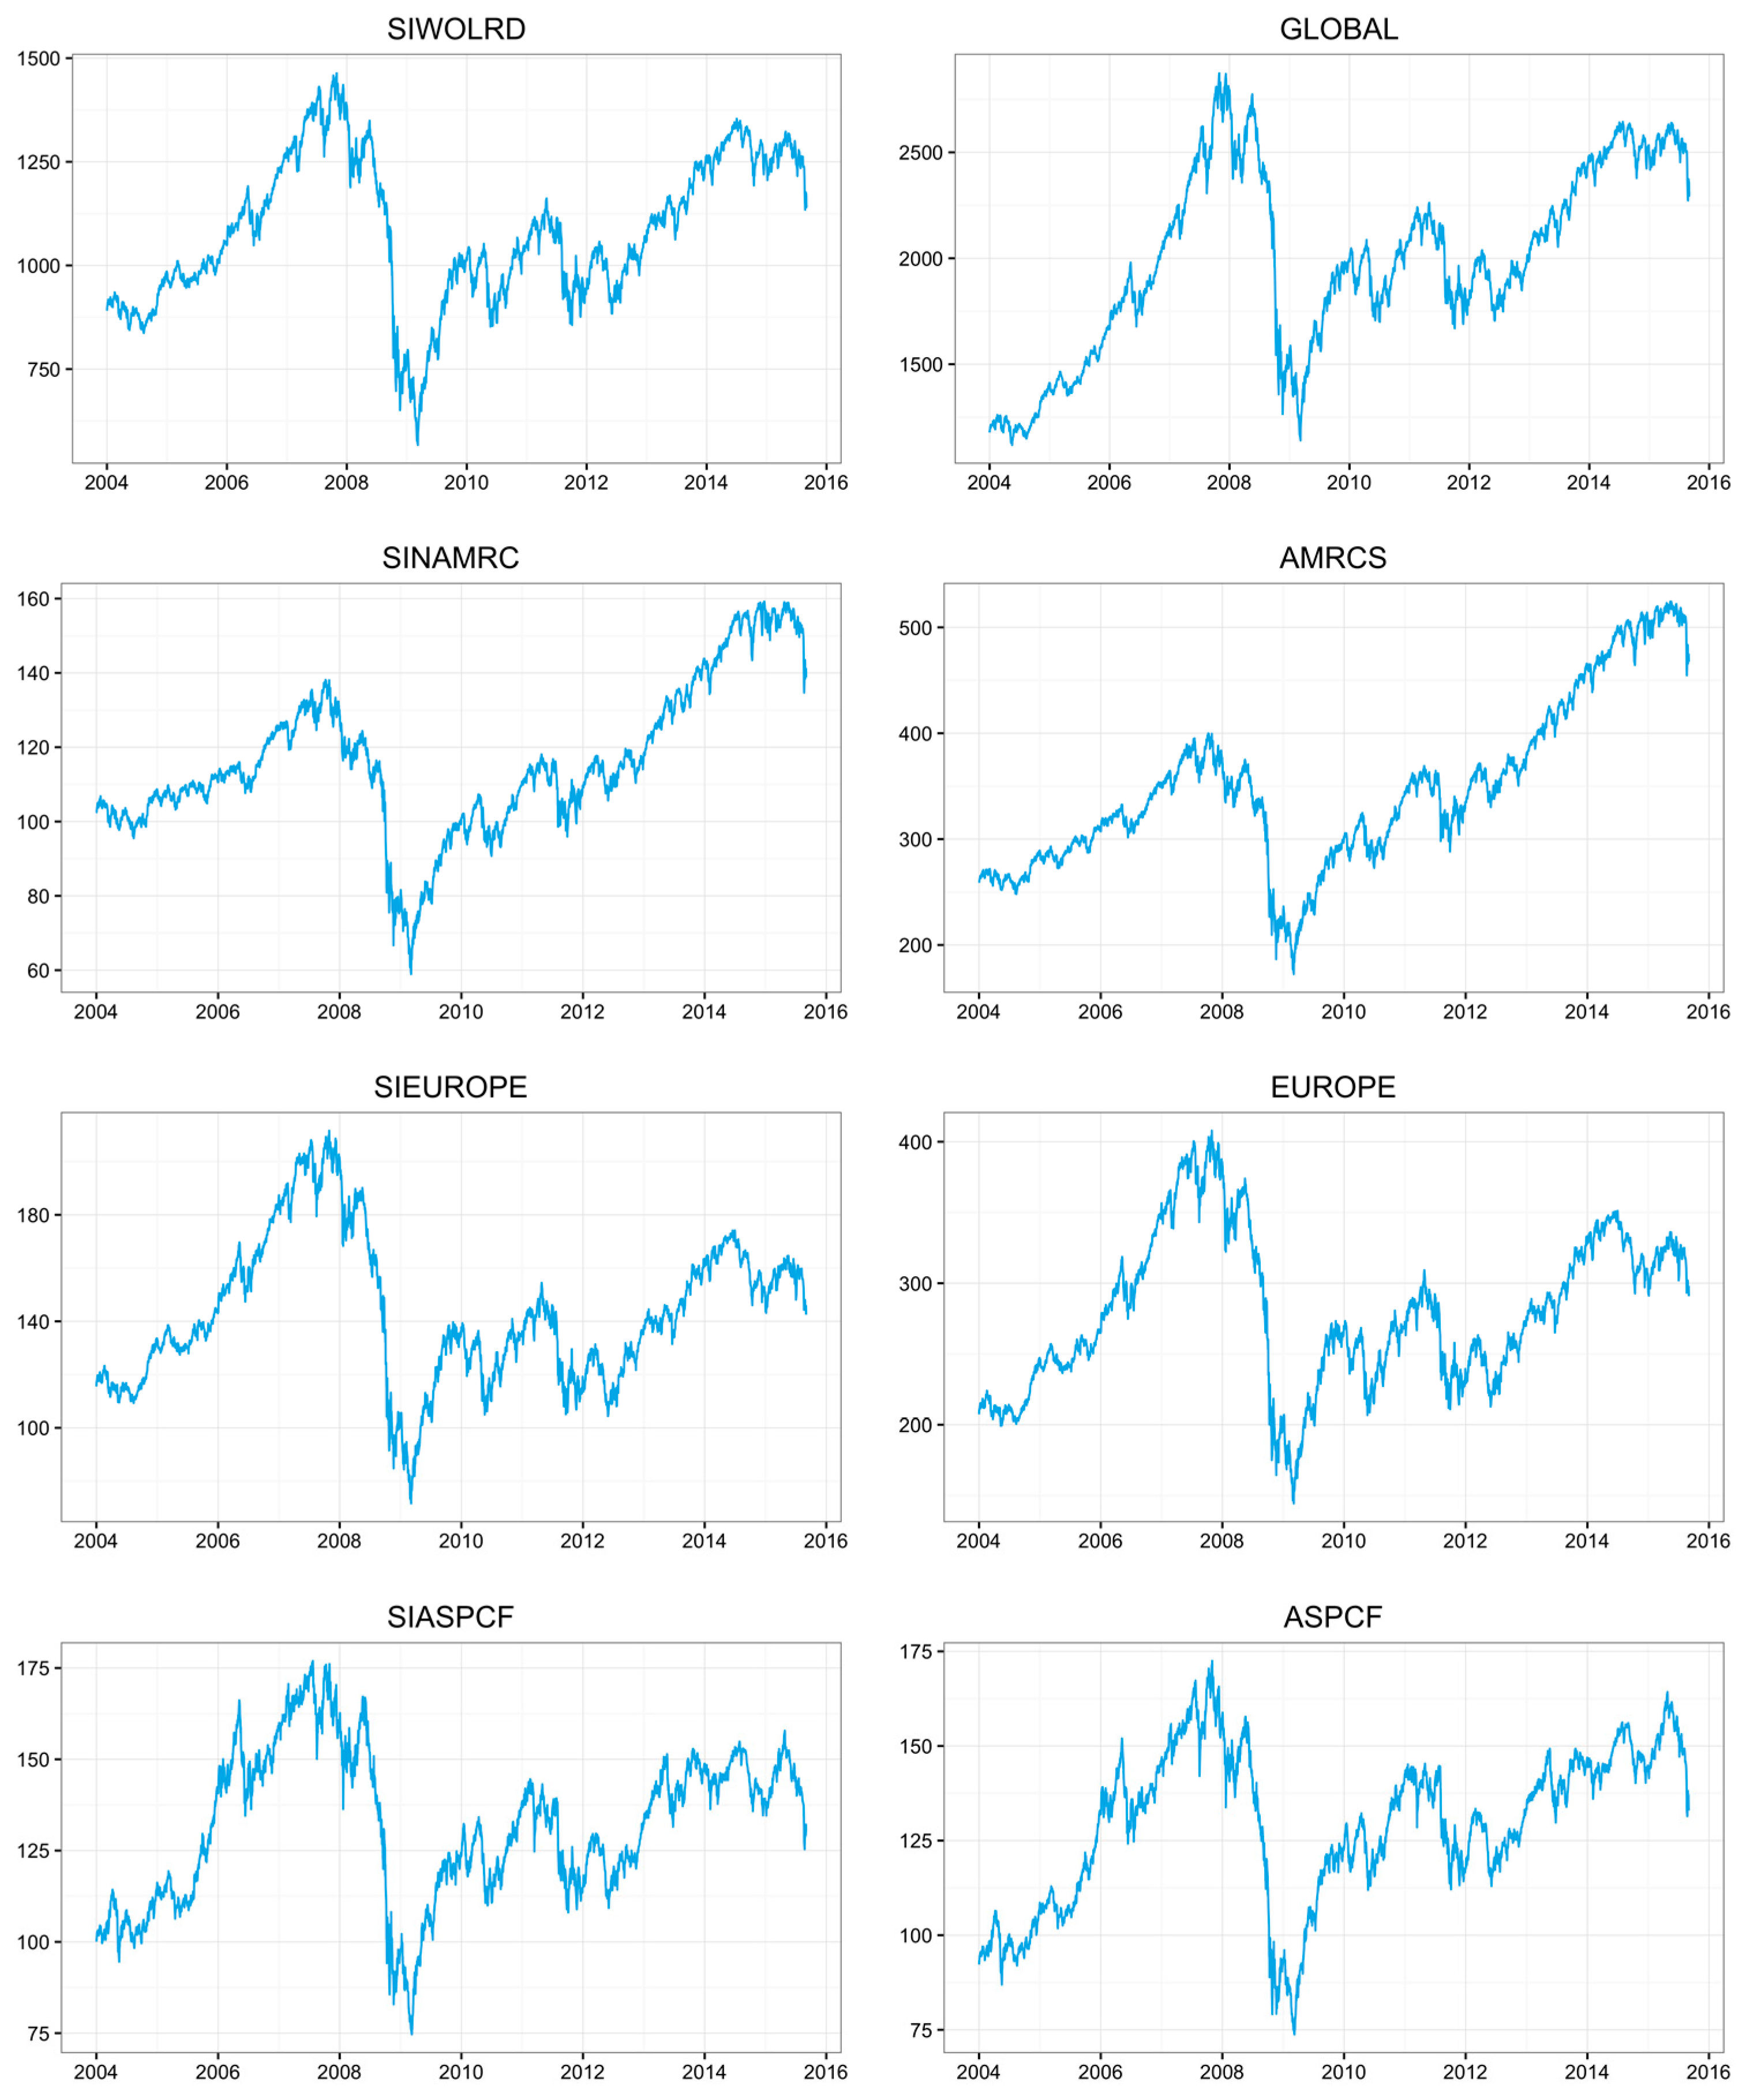
4.1. Data
4.2. Model Identification
4.3. Volatility Spillover Tests
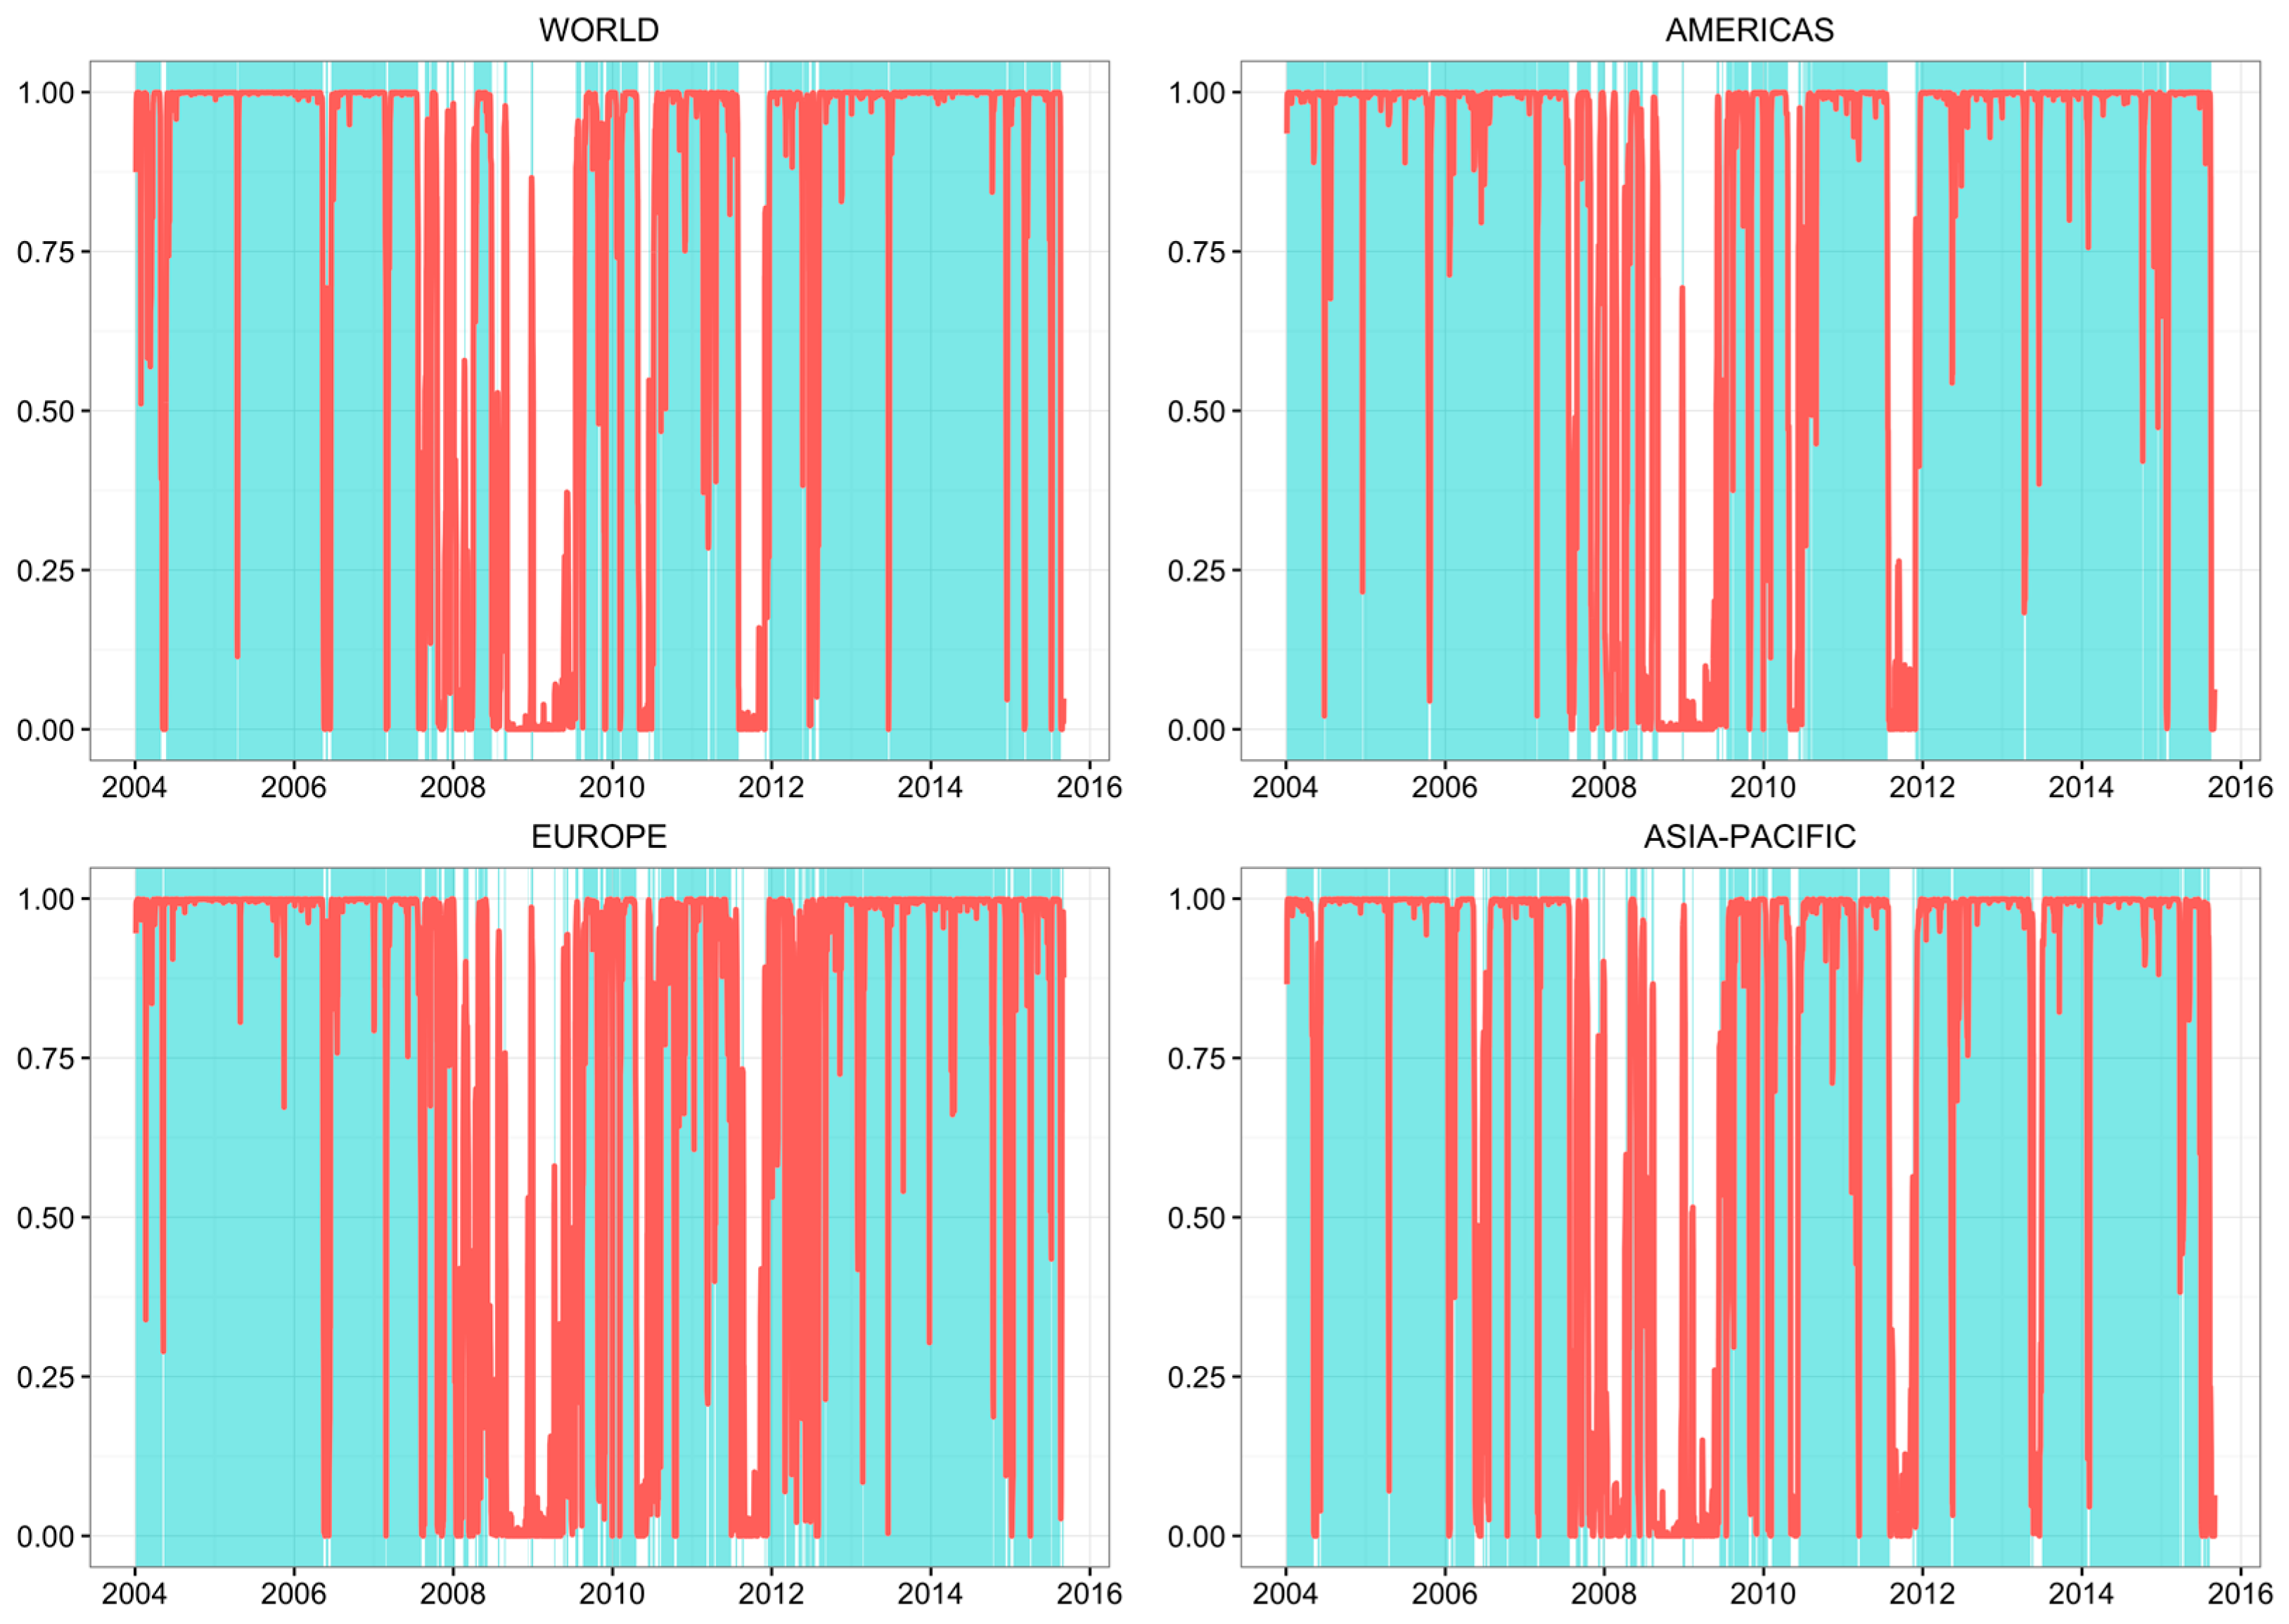
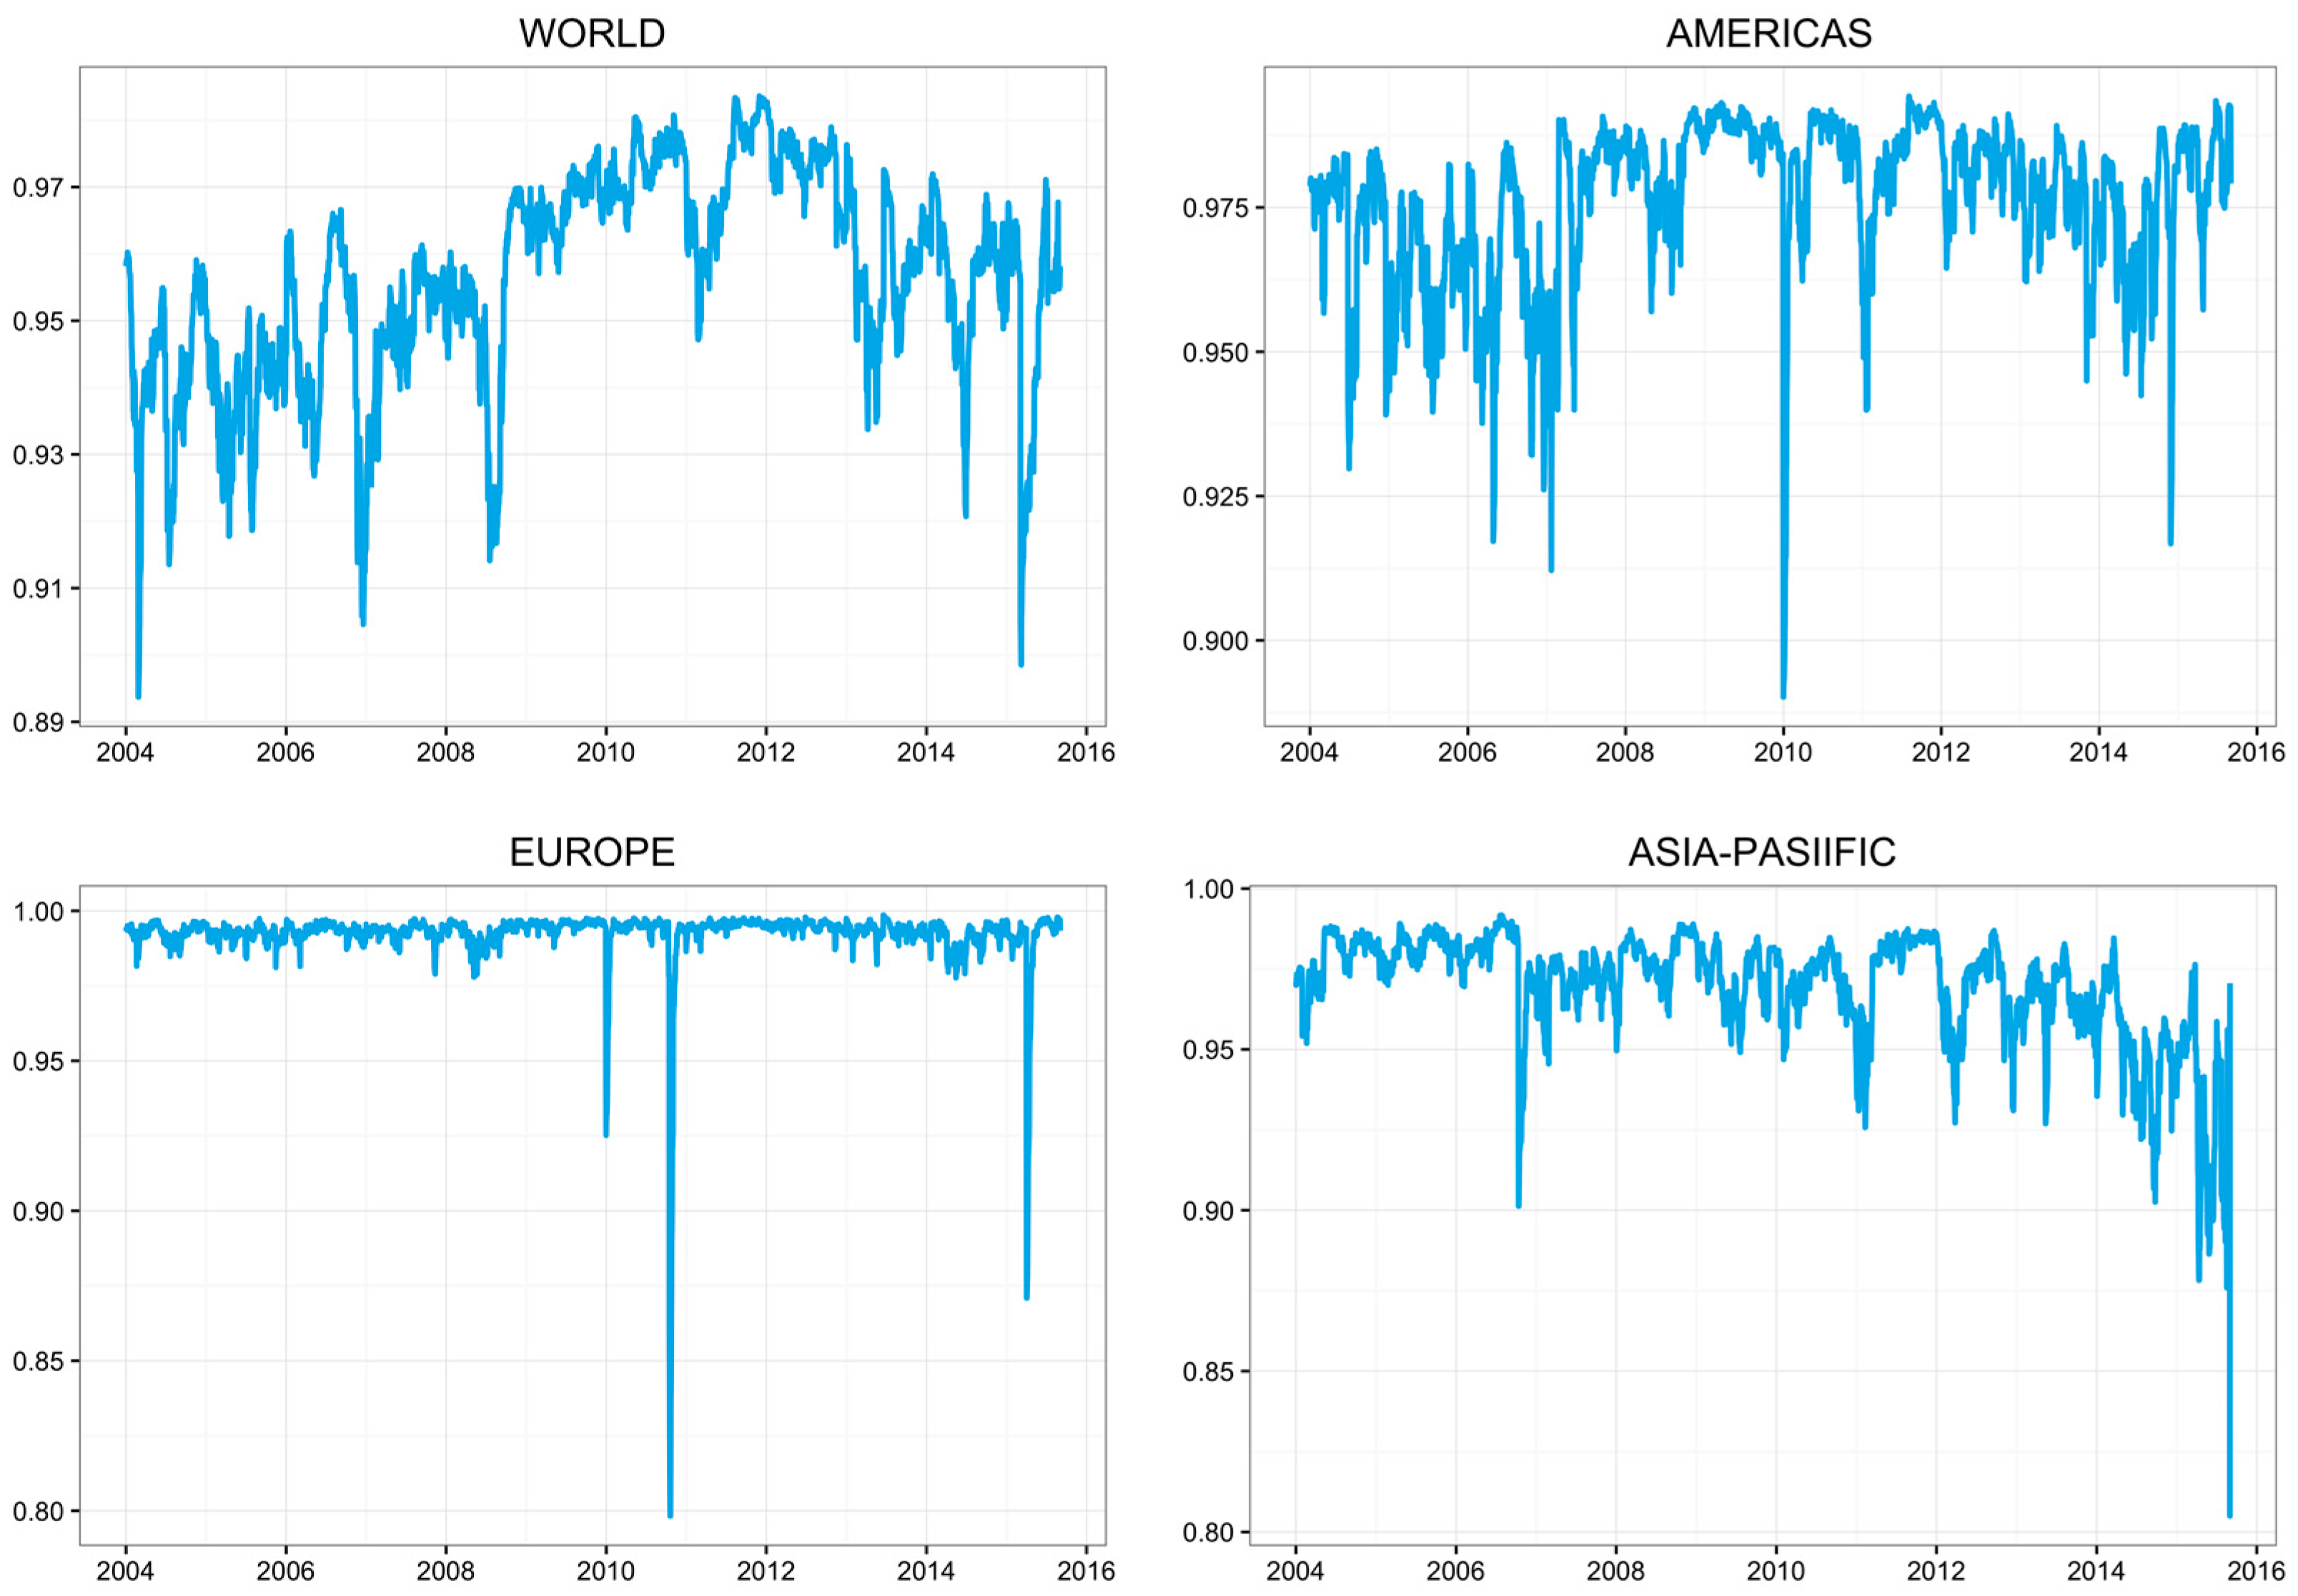
4.4. Dynamic Correlations
5. Portfolio Analysis
6. Conclusions
Acknowledgments
Author Contributions
Conflicts of Interest
References
- Roca, E.; Wong, V.S.; Anand, T.G. Are socially responsible investment markets worldwide integrated? Account. Res. J. 2010, 23, 281–301. [Google Scholar] [CrossRef]
- Global Sustainable Investment Association. Global Sustainable Investment Review 2014; Global Sustainable Investment Association (GSIA): Washington, DC, USA, 2014. [Google Scholar]
- Nofsinger, J.; Varma, A. Socially responsible funds and market crises. J. Bank. Financ. 2014, 48, 180–193. [Google Scholar] [CrossRef]
- Markowitz, H. Portfolio selection. J. Financ. 1952, 7, 77–91. [Google Scholar]
- Markowitz, H. Portfolio Selection: Efficient Diversification of Investments; Wiley: New York, NY, USA, 1959. [Google Scholar]
- Statman, M. What do investors want? J. Portf. Manag. 2004, 30, 153–161. [Google Scholar] [CrossRef]
- Bollen, N.P. Mutual fund attributes and investor behavior. J. Financ. Quant. Anal. 2007, 42, 683–708. [Google Scholar] [CrossRef]
- Benson, K.L.; Humphrey, J.E. Socially responsible investment funds: Investor reaction to current and past returns. J. Bank. Financ. 2008, 32, 1850–1859. [Google Scholar] [CrossRef]
- Renneboog, L.; Horst, T.J.; Zhang, C. Is ethical money financially smart? Nonfinancial attributes and money flows of socially responsible investment funds. J. Financ. Intermed. 2011, 20, 562–588. [Google Scholar] [CrossRef]
- Renneboog, L.; Horst, T.J.; Zhang, C. Is Ethical Money Financially Smart? ECGI-Finance Working Paper; European Corporate Governance Institute: Brussels, Belgium, 2006; Volume 117. [Google Scholar]
- Renneboog, L.; Ter Horst, J.; Zhang, C. The price of ethics and stakeholder governance: The performance of socially responsible mutual funds. J. Corp. Financ. 2008, 14, 302–322. [Google Scholar] [CrossRef]
- Renneboog, L.; Horst, T.J.; Zhang, C. Socially responsible investments: Institutional aspects, performance, and investor behavior. J. Bank. Financ. 2008, 32, 1723–1742. [Google Scholar] [CrossRef]
- Moskowitz, M. Choosing socially responsible stocks. Bus. Soc. Rev. 1972, 1, 71–75. [Google Scholar]
- Luther, R.G.; Matatko, J.; Corner, D.C. The Investment Performance of UK Ethical Unit Trusts. Account. Audit. Account. J. 1992, 5, 57–70. [Google Scholar] [CrossRef]
- Hamilton, S.; Jo, H.; Statman, M. Doing well while doing good? The investment performance of socially responsible mutual funds. Financ. Anal. J. 1993, 49, 62–66. [Google Scholar] [CrossRef]
- Luther, R.G.; Matatko, J. The performance of ethical unit trusts: Choosing an appropriate benchmark. Br. Account. Rev. 1994, 26, 77–89. [Google Scholar] [CrossRef]
- Mallin, C.A.; Saadouni, B.; Briston, R.J. The financial performance of ethical investment funds. J. Bus. Financ. Account. 1995, 22, 483–496. [Google Scholar] [CrossRef]
- White, M.A. The performance of environmental mutual funds in the United States and Germany: Is there economic hope for green investors. Res. Corp. Soc. Perform. Policy 1995, 1, 323–344. [Google Scholar]
- Kurtz, L.; DiBartolomeo, D. Socially screened portfolios: An attribution analysis of relative performance. J. Invest. 1996, 5, 35–41. [Google Scholar] [CrossRef]
- Gregory, A.; Matatko, J.; Luther, R. Ethical unit trust financial performance: Small company effects and fund size effects. J. Bus. Financ. Account. 1997, 24, 705–725. [Google Scholar] [CrossRef]
- Russo, M.V.; Fouts, P.A. A resource-based perspective on corporate environmental performance and profitability. Acad. Manag. J. 1997, 40, 534–559. [Google Scholar] [CrossRef]
- Sauer, D.A. The impact of social-responsibility screens on investment performance: Evidence from the Domini 400 Social Index and Domini Equity Mutual Fund. Rev. Financ. Econ. 1997, 6, 137–149. [Google Scholar] [CrossRef]
- DiBartolomeo, D.; Kurtz, L. Managing Risk Exposures of Socially Screened Portfolios; Northfield Information Services: Boston, MA, USA, 1999; pp. 1–17. [Google Scholar]
- Goldreyer, E.F.; Diltz, J.D. The performance of socially responsible mutual funds: Incorporating sociopolitical information in portfolio selection. Manag. Financ. 1999, 25, 23–36. [Google Scholar] [CrossRef]
- Statman, M. Socially responsible mutual funds. Financ. Anal. J. 2000, 56, 30–39. [Google Scholar] [CrossRef]
- Stone, B.K.; Guerard, J.B., Jr.; Gultekin, M.N.; Adams, G. Socially Responsible Investment Screening: Strong Evidence of No Significant Cost for Actively Managed Portfolios; Moskowitz Prize Honorable Mention: San Francisco, CA, USA, 2001. [Google Scholar]
- Garz, H.; Volk, C.; Gilles, M. More Gain than Pain, SRI: Sustainability Pays Off. West LB Panmure, 2002. Available online: http://www.westlbpanmure.com/sri/pdf/sri_nov2002.pdf (accessed on 27 September 2017).
- Kreander, N.; Gray, R.; Power, D.; Sinclair, C. The Financial Performance of European Ethical Funds 1996–1998. J. Account. Financ. 2002, 1, 3–22. [Google Scholar]
- Geczy, C.; Stambaugh, R.F.; Levin, D. Investing in Socially Responsible Mutual Funds, Wharton School Working Paper. 2005. Available online: http://finance.wharton.upenn.edu/~rlwctr/papers/0402.pdf (accessed on 27 September 2017).
- Orlitzky, M.; Schmidt, F.L.; Rynes, S.L. Corporate social and financial performance: A meta-analysis. Organ. Stud. 2003, 24, 403–441. [Google Scholar] [CrossRef]
- Bauer, R.; Koedijk, K.; Otten, R. International evidence on ethical mutual fund performance and investment style. J. Bank. Financ. 2005, 29, 1751–1767. [Google Scholar] [CrossRef]
- Shank, T.; Manullang, D.; Hill, R. Doing well while doing good revisited: A study of socially responsible firms’ short-term versus long-term performance. Manag. Financ. 2005, 31, 33–46. [Google Scholar] [CrossRef]
- Bauer, R.; Derwall, J.; Otten, R. The ethical mutual fund performance debate: New evidence from Canada. J. Bus. Eth. 2007, 70, 111–124. [Google Scholar] [CrossRef] [Green Version]
- Edmans, A. Does the stock market fully value intangibles? Employee satisfaction and equity prices. J. Financ. Econ. 2011, 101, 621–640. [Google Scholar] [CrossRef]
- Girard, E.C.; Rahman, H.; Stone, B.A. Socially responsible investments: Goody-two-shoes or bad to the bone? J. Invest. 2007, 16, 96–110. [Google Scholar] [CrossRef]
- Schröder, M. Is there a difference? The performance characteristics of SRI equity indices. J. Bus. Financ. Account. 2007, 34, 331–348. [Google Scholar] [CrossRef]
- Adler, T.; Kritzman, M. The cost of socially responsible investing. J. Portf. Manag. 2008, 35, 52–56. [Google Scholar] [CrossRef]
- Galema, R.; Plantinga, A.; Scholtens, B. The stocks at stake: Return and risk in socially responsible investment. J. Bank. Financ. 2008, 32, 2646–2654. [Google Scholar] [CrossRef]
- Derwall, J.; Guenster, N.; Bauer, R.; Koedijk, K. The eco-efficiency premium puzzle. Financ. Anal. J. 2005, 61, 51–63. [Google Scholar] [CrossRef]
- Kempf, A.; Osthoff, P. The effect of socially responsible investing on portfolio performance. Eur. Financ. Manag. 2007, 13, 908–922. [Google Scholar] [CrossRef]
- Hong, H.; Kacperczyk, M. The price of sin: The effects of social norms on markets. J. Financ. Econ. 2009, 93, 15–36. [Google Scholar] [CrossRef]
- Statman, M.; Glushkov, D. The wages of social responsibility. Financ. Anal. J. 2009, 65, 33–46. [Google Scholar] [CrossRef]
- Kim, I.; Venkatachalam, M. Are sin stocks paying the price for accounting sins? J. Account. Audit. Financ. 2011, 26, 415–442. [Google Scholar] [CrossRef]
- Guenster, N. Performance implications of SR investing: Past versus future. Soc. Responsib. Financ. Invest. 2012, 443–454. [Google Scholar] [CrossRef]
- Borgers, A.; Derwall, J.; Koedijk, K.; Ter Horst, J. Stakeholder relations and stock returns: On errors in investors’ expectations and learning. J. Empir. Financ. 2013, 22, 159–175. [Google Scholar] [CrossRef]
- Angel, J.J.; Rivoli, P. Does ethical investing impose a cost upon the firm? A theoretical perspective. J. Invest. 1997, 6, 57–61. [Google Scholar] [CrossRef]
- Lee, C.; Ng, D.T. Corruption and International Valuation: Does Virtue Pay? Working Paper; Cornell University: Ithaca, NY, USA, 2006. [Google Scholar]
- Guenster, N.; Bauer, R.; Derwall, J.; Koedijk, K. The economic value of corporate eco-efficiency. Eur. Financ. Manag. 2011, 17, 679–704. [Google Scholar] [CrossRef]
- Guerard, J.B., Jr. Is there a cost to being socially responsible in investing? J. Invest. 1997, 6, 11–18. [Google Scholar] [CrossRef]
- Lean, H.H.; Nguyen, D.K. Policy uncertainty and performance characteristics of sustainable investments across regions around the global financial crisis. Appl. Financ. Econ. 2014, 24, 1367–1373. [Google Scholar] [CrossRef]
- Antonakakis, N.; Babalos, V.; Kyei, C. Predictability of sustainable investments and the role of uncertainty: Evidence from a non-parametric causality-in-quantiles test. Appl. Econ. 2017, in press. [Google Scholar] [CrossRef] [Green Version]
- Apergis, N.; Babalos, V.; Christou, C.; Gupta, R. Identifying Asymmetries between Socially Responsible and Conventional Investments; Working Paper No. 201537; Department of Economics, University of Pretoria: Pretoria, South Africa, 2015. [Google Scholar]
- Engle, R.F. Dynamic conditional correlation: A new simple class of multivariate GARCH models. J. Bus. Econ. Stat. 2002, 20, 339–350. [Google Scholar] [CrossRef]
- Kim, C. Dynamic linear models with Markov-switching. J. Econ. 1994, 60, 1–22. [Google Scholar] [CrossRef]
- Ciner, C.; Gurdgiev, C.; Lucey, B. Hedges and safe havens: An examination of stocks, bonds, gold, oil and exchange rates. Int. Rev. Financ. Anal. 2013, 29, 202–211. [Google Scholar] [CrossRef]
- Jawadi, F.; Jawadi, N.; Louhichi, W. Conventional and Islamic stock price performance: An empirical investigation. Int. Econ. 2014, 137, 73–87. [Google Scholar] [CrossRef]
- Billio, M.; Caporin, M. Multivariate Markov switching dynamic conditional correlation GARCH representations for contagion analysis. Stat. Methods Appl. 2005, 14, 145–161. [Google Scholar] [CrossRef]
- Lee, H.-T. Regime switching correlation hedging. J. Bank. Financ. 2010, 34, 2728–2741. [Google Scholar] [CrossRef]
- Chang, C.-L.; McAleer, M.; Tansuchat, R. Crude oil hedging strategies using dynamic multivariate GARCH. Energy Econ. 2011, 33, 912–923. [Google Scholar] [CrossRef]
- Balcilar, M.; Demirer, R.; Hammoudeh, S.; Nguyen, D.K. Risk spillovers across the energy and carbon markets and hedging strategies for carbon risk. Energy Econ. 2016, 54, 159–172. [Google Scholar] [CrossRef]
- Ling, S.; McAleer, M. Asymptotic theory for a vector ARMA-GARCH model. Econ. Theory 2003, 19, 280–310. [Google Scholar] [CrossRef]
- Engle, R.F.; Sheppard, K. Theoretical and Empirical Properties of Dynamic Conditional Correlation Multivariate GARCH; Discussion Paper No. 2001-15; NBER Working Paper No. 8554; University of California: San Diego, CA, USA, 2001. [Google Scholar]
- Cai, J. A Markov model of switching-regime ARCH. J. Bus. Econ. Stat. 1994, 12, 309–316. [Google Scholar]
- Hamilton, J.D.; Susmel, R. Autoregressive conditional heteroskedasticity and changes in regime. J. Econ. 1994, 64, 307–333. [Google Scholar] [CrossRef]
- Gray, S.F. Modeling the conditional distribution of interest rates as a regime-switching process. J. Financ. Econ. 1996, 42, 27–62. [Google Scholar] [CrossRef]
- Caporin, M.; McAleer, M. Ten things you should know about the dynamic conditional correlation representation. Econometrics 2013, 1, 115–126. [Google Scholar] [CrossRef] [Green Version]
- Davies, R.B. Hypothesis testing when a nuisance parameter is present only under the alternative. Biometrika 1987, 74, 33–43. [Google Scholar]
- Nakatani, T.; Teräsvirta, T. An Alternative Test for Causality in Variance in the Conditional Correlation GARCH Models; Stockholm School of Economics: Stockholm, Sweden, 2010. [Google Scholar]
- Hafner, C.M.; Herwartz, H. A Lagrange multiplier test for causality in variance. Econ. Lett. 2006, 93, 137–141. [Google Scholar] [CrossRef]
- Kroner, K.F.; Sultan, J. Time dynamic varying distributions and dynamic hedging with foreign currency futures. J. Financ. Quant. Anal. 1993, 28, 535–551. [Google Scholar] [CrossRef]
- Kroner, K.; Ng, V. Modeling asymmetric comovements of asset returns. Rev. Financ. Stud. 1998, 11, 817–844. [Google Scholar] [CrossRef]
- Hammoudeh, S.; Yuan, Y.; McAleer, M.; Thompson, M. Precious metals-exchange rate volatility transmissions and hedging strategies. Int. Rev. Econ. Financ. 2010, 20, 633–647. [Google Scholar] [CrossRef]


| SIWOLRD | SINAMRC | SIEUROPE | SIASPCF | GLOBAL | AMRCS | EUROPE | ASPCF | |
| Mean | 0.01 | 0.01 | 0.01 | 0.01 | 0.02 | 0.02 | 0.01 | 0.01 |
| S.D. | 1.14 | 1.14 | 1.45 | 1.32 | 1.10 | 1.22 | 1.42 | 1.16 |
| Min | −7.77 | −8.99 | −9.93 | −10.33 | −7.89 | −9.74 | −10.13 | −9.11 |
| Max | 8.84 | 9.45 | 10.46 | 10.84 | 9.88 | 10.51 | 10.51 | 9.01 |
| Skewness | −0.30 | −0.42 | −0.09 | −0.34 | −0.44 | −0.48 | −0.12 | −0.47 |
| Kurtosis | 8.95 | 11.30 | 7.59 | 6.35 | 9.89 | 11.40 | 7.58 | 6.72 |
| JB | 10,227.42 *** | 16,313.24 *** | 7318.62 *** | 5190.91 *** | 12,516.18 *** | 16,620.02 *** | 7301.17 *** | 5855.89 *** |
| Q(1) | 34.07 *** | 16.53 *** | 1.14 | 0.96 | 85.75 *** | 9.92 *** | 0.10 | 1.32 |
| Q(5) | 57.59 *** | 31.22 *** | 29.83 *** | 7.18 | 98.61 *** | 19.57 *** | 26.79 *** | 4.34 |
| ARCH(1) | 120.66 *** | 202.02 *** | 113.33 *** | 94.02 *** | 152.65 *** | 140.80 *** | 100.00 *** | 82.70 *** |
| ARCH(5) | 798.47 *** | 797.38 *** | 593.67 *** | 899.63 *** | 915.00 *** | 789.89 *** | 611.35 *** | 837.62 *** |
| n | 3044 | 3044 | 3044 | 3044 | 3044 | 3044 | 3044 | 3044 |
| Pearson Correlation Coefficient Estimates | ||||||||
| World | Americas | Europe | Asia-Pacific | |||||
| Full sample | 0.966 | 0.987 | 0.995 | 0.976 | ||||
| Subprime Crises Period | 0.967 | 0.992 | 0.996 | 0.985 | ||||
| ARCH-LM(1) | JB | Q(10) | Q(20) | p | |
|---|---|---|---|---|---|
| SIWOLRD | 2.724 | 197.383 *** | 5.454 | 19.214 | 4 |
| (0.010) | (<0.001) | (0.793) | (0.443) | ||
| SINAMRC | 5.277 ** | 427.863*** | 6.409 | 17.684 | 2 |
| (0.022) | (<0.001) | (0.698) | (0.544) | ||
| SIEUROPE | 0.122 | 230.330 *** | 4.802 | 16.135 | 0 |
| (0.727) | (<0.001) | (0.851) | (0.648) | ||
| SIASPCF | 0.001 | 92.166 *** | 4.638 | 11.789 | 4 |
| (0.980) | (<0.001) | (0.865) | (0.895) | ||
| GLOBAL | 2.160 | 244.572 *** | 4.439 | 19.661 | 4 |
| (0.142) | (<0.001) | (0.880) | (0.415) | ||
| AMRCS | 5.790 | 436.193 *** | 7.645 | 18.204 | 2 |
| (0.016) | (<0.001) | (0.570) | (0.509) | ||
| EUROPE | 0.294 | 220.475 *** | 4.543 | 16.985 | 0 |
| (0.588) | (<0.001) | (0.872) | (0.591) | ||
| ASPCF | 0.311 | 160.252 *** | 7.192 | 16.732 | 4 |
| (0.577) | (<0.001) | (0.617) | (0.608) |
| Parameters | Models | |||
|---|---|---|---|---|
| World | Americas | Europe | Asia-Pasiific | |
| Panel A: Spillover parameters | ||||
| 0.0033 (0.0139) | 0.0159 (0.0099) | 0.0052 (0.0371) | 0.0319 (0.0289) | |
| 0.0159 (0.0305) | 0.0176 (0.0378) | 0.0202 (0.0672) | 0.0168 (0.0317) | |
| 0.0358 (0.0304) | 0.0162 (0.0303) | 0.0189 (0.0821) | 0.0173 (0.0562) | |
| 0.0633 (0.7564) | 0.0249 (1.9827) | 0.0082 (2.8751) | 0.0110 (2.8601) | |
| 0.0252 (0.8179) | 0.0582 (1.7571) | 0.0593 (2.9988) | 0.1014 (3.7029) | |
| 0.0337 *** (0.0106) | 0.0786 *** (0.0092) | 0.0772 ** (0.0365) | 0.0945 *** (0.0192) | |
| 0.1266 *** (0.0265) | 0.1496 *** (0.0388) | 0.2183 *** (0.0590) | 0.1549 *** (0.0229) | |
| 0.4627 *** (0.0253) | 0.6228 *** (0.0306) | 0.4593 *** (0.0721) | 0.3965 *** (0.0526) | |
| 0.8503 (0.6626) | 0.6612 (2.3041) | 0.7239 (2.9214) | 0.9425 (2.1682) | |
| 0.4003 (0.7189) | 0.3353 (2.0511) | 0.4324 (3.0450) | 0.3686 (2.8084) | |
| Panel B: DCC parameters | ||||
| 0.0181 *** (0.0036) | 0.0427 *** (0.0040) | 0.0880 *** (0.0054) | 0.0361 *** (0.0060) | |
| 0.9750 *** (0.0063) | 0.9430 *** (0.0058) | 0.8528 *** (0.0102) | 0.9553 *** (0.0147) | |
| 0.0677 *** (0.0250) | 0.0839 *** (0.0108) | 0.1073 *** (0.0301) | 0.0778 * (0.0444) | |
| 0.7769 *** (0.0999) | 0.8730 *** (0.0172) | 0.8095 *** (0.0602) | 0.8314 *** (0.1668) | |
| Panel C: Regime Inference | ||||
| log L of MS-DCC | −4029.247 | −3084.625 | −2785.198 | −4495.000 |
| log L of DCC | −5103.762 | −4034.694 | −3898.901 | −5275.907 |
| AIC of MS-DCC | 2.661 | 2.041 | 1.844 | 2.968 |
| AIC of DCC | 3.360 | 2.658 | 2.569 | 3.474 |
| LR linearity Test | 2149.030 *** | 1900.138 *** | 2227.405 *** | 1561.813 *** |
| 0.982 | 0.984 | 0.969 | 0.979 | |
| 0.935 | 0.930 | 0.889 | 0.930 | |
| 2387.100 | 2478.600 | 2377.700 | 2352.100 | |
| 655.900 | 564.400 | 665.300 | 690.900 | |
| Prob(Regime 1) | 0.781 | 0.812 | 0.781 | 0.770 |
| Prob(Regime 2) | 0.219 | 0.188 | 0.219 | 0.230 |
| Duration of Regime 1 | 55.140 | 61.670 | 32.080 | 47.740 |
| Duration of Regime 2 | 15.420 | 14.320 | 8.980 | 14.220 |
| Test Type | Wald | NT-R | NT-NR | HH |
|---|---|---|---|---|
| Panel A: Unidirectional volatility spillovers from conventional to sustainable | ||||
| GLOBAL SIWORLD | 26.0335 *** | 33.5088 *** | 9.9801 *** | 7.9773 ** |
| AMRCS SINMARC | 3.9563 | 1.7234 | 5.2534 | 2.3548 |
| EUROPE SIEUROPE | 6.9236 | 3.9381 | 5.1069 | 9.6125 ** |
| ASPCF SIASPCF | 7.2269 | 5.2085 | 4.9439 | 7.6233 |
| Panel B: Unidirectional volatility spillovers from sustainable to conventional | ||||
| SIWORLD GLOBAL | 5.7180 * | 9.9768 *** | 13.6846 *** | 3.0029 |
| SINMARC AMRCS | 1.8908 | 1.1614 | 5.285 | 2.1588 |
| SIEUROPE EUROPE | 4.4583 | 2.2569 | 3.0597 | 0.338 |
| SIASPCF ASPCF | 4.7144 | 3.1005 | 2.1225 | 0.3585 |
| Panel C: Bi-directional volatility spillovers between sustainable and conventional | ||||
| GLOBAL SIWORLD | 19.4387 *** | 0.2948 | 32.5822 *** | 42.6304 *** |
| AMRCS SINMARC | 5.847 | 2.8848 | 10.5384 ** | 4.5136 |
| EUROPE SIEUROPE | 11.3819 ** | 6.195 | 8.1666 * | 9.9505 ** |
| ASPCF SIASPCF | 11.9413 ** | 8.3090 * | 7.0664 | 7.9818 * |
| Mean | S.D. | Min | Max | HE | Sharpe Ratio | |
|---|---|---|---|---|---|---|
| Panel A: World Market | ||||||
| Undiversified Portfolio Return | 0.028 | 1.154 | −7.886 | 9.883 | -- | 0.024 |
| MS-DCC-GARCH Hedged Portfolio Return | 0.018 | 0.295 | −1.928 | 1.961 | 93.567 | 0.061 |
| DCC-GARCH Hedged Portfolio Return | 0.017 | 0.293 | −1.931 | 2.026 | 93.478 | 0.058 |
| MS-DCC-GARCH Optimal Portfolio Return | 0.034 | 1.012 | −8.413 | 7.775 | 23.082 | 0.034 |
| DCC-GARCH Optimal Portfolio Return | 0.024 | 0.940 | −6.590 | 9.883 | 33.664 | 0.026 |
| MS-DCC-GARCH Optimal Hedge Ratio | 0.929 | 0.070 | 0.780 | 1.209 | -- | -- |
| DCC-GARCH Optimal Hedge Ratio | 0.935 | 0.059 | 0.814 | 1.122 | -- | -- |
| MS-DCC-GARCH Optimal Portfolio Weight | 0.618 | 0.417 | 0.000 | 1.000 | -- | -- |
| DCC-GARCH Optimal Portfolio Weight | 0.635 | 0.407 | 0.000 | 1.000 | -- | -- |
| Panel B: Americas Market | ||||||
| Undiversified Portfolio Return | 0.022 | 1.268 | −9.736 | 10.515 | -- | 0.017 |
| MS-DCC-GARCH Hedged Portfolio Return | 0.010 | 0.199 | −1.177 | 0.959 | 97.533 | 0.050 |
| DCC-GARCH Hedged Portfolio Return | 0.009 | 0.201 | −1.177 | 1.068 | 97.478 | 0.045 |
| MS-DCC-GARCH Optimal Portfolio Return | 0.009 | 0.458 | −9.453 | 8.993 | 16.666 | 0.020 |
| DCC-GARCH Optimal Portfolio Return | 0.009 | 0.472 | −9.453 | 8.993 | 14.638 | 0.019 |
| MS-DCC-GARCH Optimal Hedge Ratio | 1.047 | 0.053 | 0.828 | 1.221 | -- | -- |
| DCC-GARCH Optimal Hedge Ratio | 1.042 | 0.015 | 0.960 | 1.080 | -- | -- |
| MS-DCC-GARCH Optimal Portfolio Weight | 0.078 | 0.216 | 0.000 | 1.000 | -- | -- |
| DCC-GARCH Optimal Portfolio Weight | 0.002 | 0.027 | 0.000 | 1.000 | -- | -- |
| Panel C: European Market | ||||||
| Undiversified Portfolio Return | 0.019 | 1.476 | −10.130 | 10.512 | -- | 0.013 |
| MS-DCC-GARCH Hedged Portfolio Return | 0.006 | 0.149 | −1.804 | 1.601 | 98.987 | 0.040 |
| DCC-GARCH Hedged Portfolio Return | 0.005 | 0.149 | −1.804 | 1.601 | 98.979 | 0.034 |
| MS-DCC-GARCH Optimal Portfolio Return | 0.038 | 1.429 | −10.130 | 10.512 | 6.342 | 0.027 |
| DCC-GARCH Optimal Portfolio Return | 0.015 | 1.466 | −10.130 | 10.512 | 1.354 | 0.010 |
| MS-DCC-GARCH Optimal Hedge Ratio | 0.977 | 0.028 | 0.865 | 1.088 | -- | -- |
| DCC-GARCH Optimal Hedge Ratio | 0.977 | 0.006 | 0.956 | 0.996 | -- | -- |
| MS-DCC-GARCH Optimal Portfolio Weight | 0.744 | 0.409 | 0.000 | 1.000 | -- | -- |
| DCC-GARCH Optimal Portfolio Weight | 0.980 | 0.073 | 0.295 | 1.000 | -- | -- |
| Panel D: Asia-Pacific Market | ||||||
| Undiversified Portfolio Return | 0.017 | 1.218 | −9.114 | 9.008 | -- | 0.014 |
| MS-DCC-GARCH Hedged Portfolio Return | 0.005 | 0.239 | −1.431 | 1.434 | 96.135 | 0.021 |
| DCC-GARCH Hedged Portfolio Return | 0.003 | 0.240 | −1.340 | 1.295 | 96.104 | 0.013 |
| MS-DCC-GARCH Optimal Portfolio Return | 0.016 | 1.094 | −9.114 | 9.008 | 3.775 | 0.015 |
| DCC-GARCH Optimal Portfolio Return | 0.017 | 1.192 | −9.114 | 9.008 | 0.000 | 0.014 |
| MS-DCC-GARCH Optimal Hedge Ratio | 0.854 | 0.052 | 0.700 | 1.052 | -- | -- |
| DCC-GARCH Optimal Hedge Ratio | 0.851 | 0.005 | 0.837 | 0.868 | -- | -- |
| MS-DCC-GARCH Optimal Portfolio Weight | 0.977 | 0.130 | 0.000 | 1.000 | -- | -- |
| DCC-GARCH Optimal Portfolio Weight | 1.000 | 0.000 | 1.000 | 1.000 | -- | -- |
| Mean | S.D. | Min | Max | HE | Sharpe Ratio | |
|---|---|---|---|---|---|---|
| Panel A: World Market | ||||||
| Undiversified Portfolio Return | −0.015 | 0.686 | −3.986 | 2.119 | -- | -0.022 |
| MS-DCC-GARCH Hedged Portfolio Return | 0.008 | 0.219 | −1.154 | 1.369 | 89.818 | 0.037 |
| DCC-GARCH Hedged Portfolio Return | 0.008 | 0.220 | −1.206 | 1.375 | 89.712 | 0.036 |
| MS-DCC-GARCH Optimal Portfolio Return | 0.018 | 0.525 | −2.284 | 3.038 | 41.380 | 0.034 |
| DCC-GARCH Optimal Portfolio Return | 0.010 | 0.566 | −2.284 | 2.488 | 32.011 | 0.018 |
| MS-DCC-GARCH Optimal Hedge Ratio | 0.916 | 0.069 | 0.760 | 1.071 | -- | -- |
| DCC-GARCH Optimal Hedge Ratio | 0.927 | 0.041 | 0.844 | 1.025 | -- | -- |
| MS-DCC-GARCH Optimal Portfolio Weight | 0.648 | 0.390 | 0.000 | 1.000 | -- | -- |
| DCC-GARCH Optimal Portfolio Weight | 0.734 | 0.299 | 0.000 | 1.000 | -- | -- |
| Panel B: Americas Market | ||||||
| Undiversified Portfolio Return | 0.002 | 0.792 | −3.988 | 3.438 | -- | 0.003 |
| MS-DCC-GARCH Hedged Portfolio Return | 0.006 | 0.141 | −0.661 | 0.458 | 96.830 | 0.043 |
| DCC-GARCH Hedged Portfolio Return | 0.006 | 0.152 | −0.649 | 0.500 | 96.287 | 0.039 |
| MS-DCC-GARCH Optimal Portfolio Return | 0.005 | 0.700 | −2.903 | 3.438 | 21.883 | 0.007 |
| DCC-GARCH Optimal Portfolio Return | 0.003 | 0.800 | −3.552 | 3.853 | −2.088 | 0.004 |
| MS-DCC-GARCH Optimal Hedge Ratio | 0.995 | 0.050 | 0.864 | 1.161 | -- | -- |
| DCC-GARCH Optimal Hedge Ratio | 1.037 | 0.011 | 0.994 | 1.073 | -- | -- |
| MS-DCC-GARCH Optimal Portfolio Weight | 0.370 | 0.421 | 0.000 | 1.000 | -- | -- |
| DCC-GARCH Optimal Portfolio Weight | 0.001 | 0.011 | 0.000 | 0.153 | -- | -- |
| Panel C: European Market | ||||||
| Undiversified Portfolio Return | −0.040 | 0.917 | −3.182 | 3.122 | -- | −0.044 |
| MS-DCC-GARCH Hedged Portfolio Return | −0.001 | 0.132 | −1.067 | 1.181 | 97.930 | −0.008 |
| DCC-GARCH Hedged Portfolio Return | −0.002 | 0.132 | −1.095 | 1.181 | 97.928 | −0.015 |
| MS-DCC-GARCH Optimal Portfolio Return | −0.032 | 0.827 | −2.911 | 3.122 | 18.625 | −0.039 |
| DCC-GARCH Optimal Portfolio Return | −0.039 | 0.891 | −3.182 | 3.122 | 5.500 | −0.044 |
| MS-DCC-GARCH Optimal Hedge Ratio | 0.975 | 0.029 | 0.840 | 1.060 | -- | -- |
| DCC-GARCH Optimal Hedge Ratio | 0.981 | 0.006 | 0.967 | 0.997 | -- | -- |
| MS-DCC-GARCH Optimal Portfolio Weight | 0.734 | 0.393 | 0.000 | 1.000 | -- | -- |
| DCC-GARCH Optimal Portfolio Weight | 0.933 | 0.165 | 0.200 | 1.000 | -- | -- |
| Panel D: Asia-Pacific Market | ||||||
| Undiversified Portfolio Return | −0.019 | 0.708 | −4.425 | 2.146 | -- | −0.027 |
| MS-DCC-GARCH Hedged Portfolio Return | 0.003 | 0.328 | −4.267 | 0.851 | 78.579 | 0.009 |
| DCC-GARCH Hedged Portfolio Return | 0.002 | 0.332 | −4.370 | 0.886 | 78.034 | 0.006 |
| MS-DCC-GARCH Optimal Portfolio Return | −0.007 | 0.639 | −2.305 | 2.146 | 18.430 | −0.011 |
| DCC-GARCH Optimal Portfolio Return | −0.019 | 0.708 | −4.425 | 2.146 | 0.000 | −0.027 |
| MS-DCC-GARCH Optimal Hedge Ratio | 0.824 | 0.063 | 0.686 | 1.080 | -- | -- |
| DCC-GARCH Optimal Hedge Ratio | 0.845 | 0.005 | 0.835 | 0.861 | -- | -- |
| MS-DCC-GARCH Optimal Portfolio Weight | 0.928 | 0.222 | 0.000 | 1.000 | -- | -- |
| DCC-GARCH Optimal Portfolio Weight | 1.000 | 0.000 | 1.000 | 1.000 | -- | -- |
© 2017 by the authors. Licensee MDPI, Basel, Switzerland. This article is an open access article distributed under the terms and conditions of the Creative Commons Attribution (CC BY) license (http://creativecommons.org/licenses/by/4.0/).
Share and Cite
Balcilar, M.; Demirer, R.; Gupta, R. Do Sustainable Stocks Offer Diversification Benefits for Conventional Portfolios? An Empirical Analysis of Risk Spillovers and Dynamic Correlations. Sustainability 2017, 9, 1799. https://doi.org/10.3390/su9101799
Balcilar M, Demirer R, Gupta R. Do Sustainable Stocks Offer Diversification Benefits for Conventional Portfolios? An Empirical Analysis of Risk Spillovers and Dynamic Correlations. Sustainability. 2017; 9(10):1799. https://doi.org/10.3390/su9101799
Chicago/Turabian StyleBalcilar, Mehmet, Riza Demirer, and Rangan Gupta. 2017. "Do Sustainable Stocks Offer Diversification Benefits for Conventional Portfolios? An Empirical Analysis of Risk Spillovers and Dynamic Correlations" Sustainability 9, no. 10: 1799. https://doi.org/10.3390/su9101799
APA StyleBalcilar, M., Demirer, R., & Gupta, R. (2017). Do Sustainable Stocks Offer Diversification Benefits for Conventional Portfolios? An Empirical Analysis of Risk Spillovers and Dynamic Correlations. Sustainability, 9(10), 1799. https://doi.org/10.3390/su9101799