Article

Siting of Carsharing Stations Based on Spatial Multi-Criteria Evaluation: A Case Study of Shanghai EVCARD

1
The Key Laboratory of Road and Traffic Engineering, Ministry of Education, Shanghai 201804, China
2
College of Transportation Engineering, Tongji University, Shanghai 201804, China
*
Author to whom correspondence should be addressed.
Sustainability 2017, 9(1), 152; https://doi.org/10.3390/su9010152
Submission received: 25 November 2016 / Revised: 11 January 2017 / Accepted: 16 January 2017 / Published: 20 January 2017

Abstract

:
Carsharing is one of the effective ways to relieve the problems of traffic jams, parking difficulties, and air pollution. In recent years, the numbers of carsharing services and their members have remarkably increased around the world. The project of electric carsharing in Shanghai, called EVCARD, has also developed rapidly with very large demand and supply. Aiming to determine the optimal locations of future stations of the EVCARD, this research employs a novel method combining the analytic hierarchy process (AHP) and geographical information system (GIS) with big data. Potential users, potential travel demand, potential travel purposes, and distance from existing stations are selected as the decision criteria. A siting decision system is established, consisting of 15 evaluation indicators which are calculated from multi-source data on mobile phones, taxi trajectory, point of interests (POI), and the EVCARD operation. The method of the AHP is used to determine the indicator weights, and the “Spatial Analyst” tool of ArcGIS is adopted to generate the indicator values for every 1 km × 1 km decision unit. Finally, synthetic scores are calculated to evaluate the candidate sites of EVCARD stations. The results of the case study verify the effectiveness of the proposed method, which can provide a more scientific and feasible method for carsharing operators to site stations, avoiding aimless and random decisions.

1. Introduction

With the development of the automotive industry, the problems of traffic jams, parking difficulties, and air pollution become more and more serious. Carsharing, which aims to reduce vehicle ownership, vehicle kilometers traveled (VMT), and greenhouse gas (GHG) emissions, is considered to be one of the effective ways to relieve the problems [1,2,3]. As of October 2010, carsharing was operated in more than 1100 cities, in 26 countries, on five continents (Asia, Australia, Europe, North American, and South America) [2]. By 2014, the number of members reached 4.94 million and the number of shared vehicles reached 92,200 [4].
In a broad sense of meaning, carsharing refers to an innovative type of business based on the shared use of cars, which provides access to cars without actual ownership [5]. Although there are different kinds of options for carsharing, most carsharing systems are often designed for shorter time and shorter distance trips as an extension of the transportation network. From the perspective of parking location, carsharing systems can be divided into free-floating systems and station-based systems. Free-floating systems allow vehicles to be picked up and left anywhere within a designated operating area, while station-based systems require users to return vehicles to an available station [6]. Furthermore, station-based carsharing systems are also classified into one-way and round-trip types, according to whether users should return a rented vehicle at a different location or at the station they picked it up. Comparing both systems, free-floating systems are more flexible but cannot be reserved in advance, whereas station-based systems provide users with the ability to make reservations but require more planning and consciousness [7].
This paper mainly focuses on the one-way station-based carsharing systems, where station siting is one of the greatest challenges and long-term decisions, because it has direct impact on the quality, efficiency, and cost of the service, and also affects profits and market competitiveness [8,9]. Therefore, the objective of this paper is to establish a station siting decision system supporting the electric carsharing program EVCARD in Shanghai, China. Since multi-criteria decision making (MCDM) methods are widely used in the site selection process, the following studies can make contributions to this problem.
MCDM is a branch of a general class of operations research models which deal with decision problems under the presence of a number of decision criteria [10]. It can be implemented by various techniques such as weighted sum method (WSM), weighted product method (WPM), analytical hierarchy process (AHP), preference ranking organization method for enrichment evaluation (PROMETHEE), elimination and choice translating reality (ELECTRE), technique for order preference by similarity to ideal solutions (TOPSIS), compromise programming (CP), and multi-attribute utility theory (MAUT) [10]. Recently, to address the uncertainty and complexity arising in the decision-making, some new methods have been developed combining MCDM with fuzzy logic theory, like fuzzy AHP, fuzzy comprehensive assessment, and fuzzy TOPSIS [5,11].
Among these methods above, AHP is the most popular method and the most widely-used multi-criteria tool in transportation planning [12]. The strength of this approach is that it organizes tangible and intangible factors in a systematic way, and provides a structured, yet relatively simple, solution to the decision-making problem [13]. Awasthi et al. present a multi-criteria evaluation approach based on the AHP for carsharing station selection [13,14]. The population density, parking difficulty and cost, mix of land use, presence of target groups, transit/multimodal access, and vehicle ownership are chosen as decision criteria. However, the limitation of this method is that the candidate stations must be selected at first. Normally, it is very difficult for carsharing operators to determine candidate stations. For example, Celsor and Millard-Ball assess the market potential of carsharing in urban neighborhoods by analyzing neighborhood characteristics of existing carsharing locations, which can be used for determining candidate stations [15]. To sum up, the studies above cannot directly output an optimal location of a carsharing station without candidate solutions.
On the other hand, there are some researchers using mathematical optimization models to obtain the optimal solution. Correia and Antunes propose the mixed-integer programming (MIP) models to depot locations in a one-way carsharing system [16]. The objective here is to maximize the profits of a carsharing organization considering all revenues and costs involved. Advanced branch-and-cut algorithms are employed to solve the MIP problems. Further, the solutions are tested using a simulation model which considers demand variability and a vehicle relocation policy [17]. The results reveal that both demand variability and relocation operations have significant impact on solutions. In addition, Kumar and Bierlaire build a multi-linear regression model to identify drivers of carsharing demand and then use a mixed-integer programming model to optimize the station location [18]. Although these optimization models can provide some optimal locations, they are not applicable to large-scale planning since finding solutions takes a lot of time, and global optimal solutions are hard to obtain.
In summary, most previous works are based on theoretical models or simulations without taking real demand into account. To predict carsharing demand and determine station locations, Zhu et al. propose a deep learning approach using three data sources consisting of taxi GPS data, points of interests (POIs), and road networks in Beijing [8]. Taxi origin and destination (OD) points are used to represent the potential demand, and POIs determine candidate stations. This approach seems to be more efficient and scientific for siting decisions using real data. However, trip ODs corresponding to different distances and POIs with different categories have different impact on the demand for carsharing, and this fact is ignored in their study. In addition, using single criterion to determine candidate sites is inadequate.
To cover the shortages of existing research, this paper employs a method combining the analytic hierarchy process (AHP) and geographical information system (GIS) to determine the location of carsharing stations. This method can be applied as a multi-criteria decision analysis instrument in different fields, such as engineering and planning [19]. It is proved to be efficient and practical for location selection of landfills [20,21,22,23,24], solar farms [25], incineration plants [26], transit alignment [27], and purpose-built offices [28]. However, it has not been adopted for carsharing station siting yet. Therefore, we introduce this method in a case study of the Shanghai EVCARD to verify its effectiveness for carsharing station siting. More specially, big data mining is incorporated in this method.

2. Case Description

This research considers the EVCARD, China’s first electric carsharing program, operated by Shanghai International Automobile City Corporation as the case study. It is a one-way station-based carsharing system. Three types of cars can be rented currently, namely, Roewe E50, Chery EQ, and Zinoro 1Es. Registered members of the EVCARD can check the availability of electric cars nearby and book one via an application on a smart-phone. Then, the booked car can be unlocked by swiping a smartcard or issuing an order in the application. Recharging services are available at every station. The rental period can be as short as several minutes. Each minute costs 0.5 CNY for Roewe E50 or Chery EQ, with the daily maximum of 180 CNY, and 1 CNY for Zinoro 1Es with the maximum of 360 CNY per day.
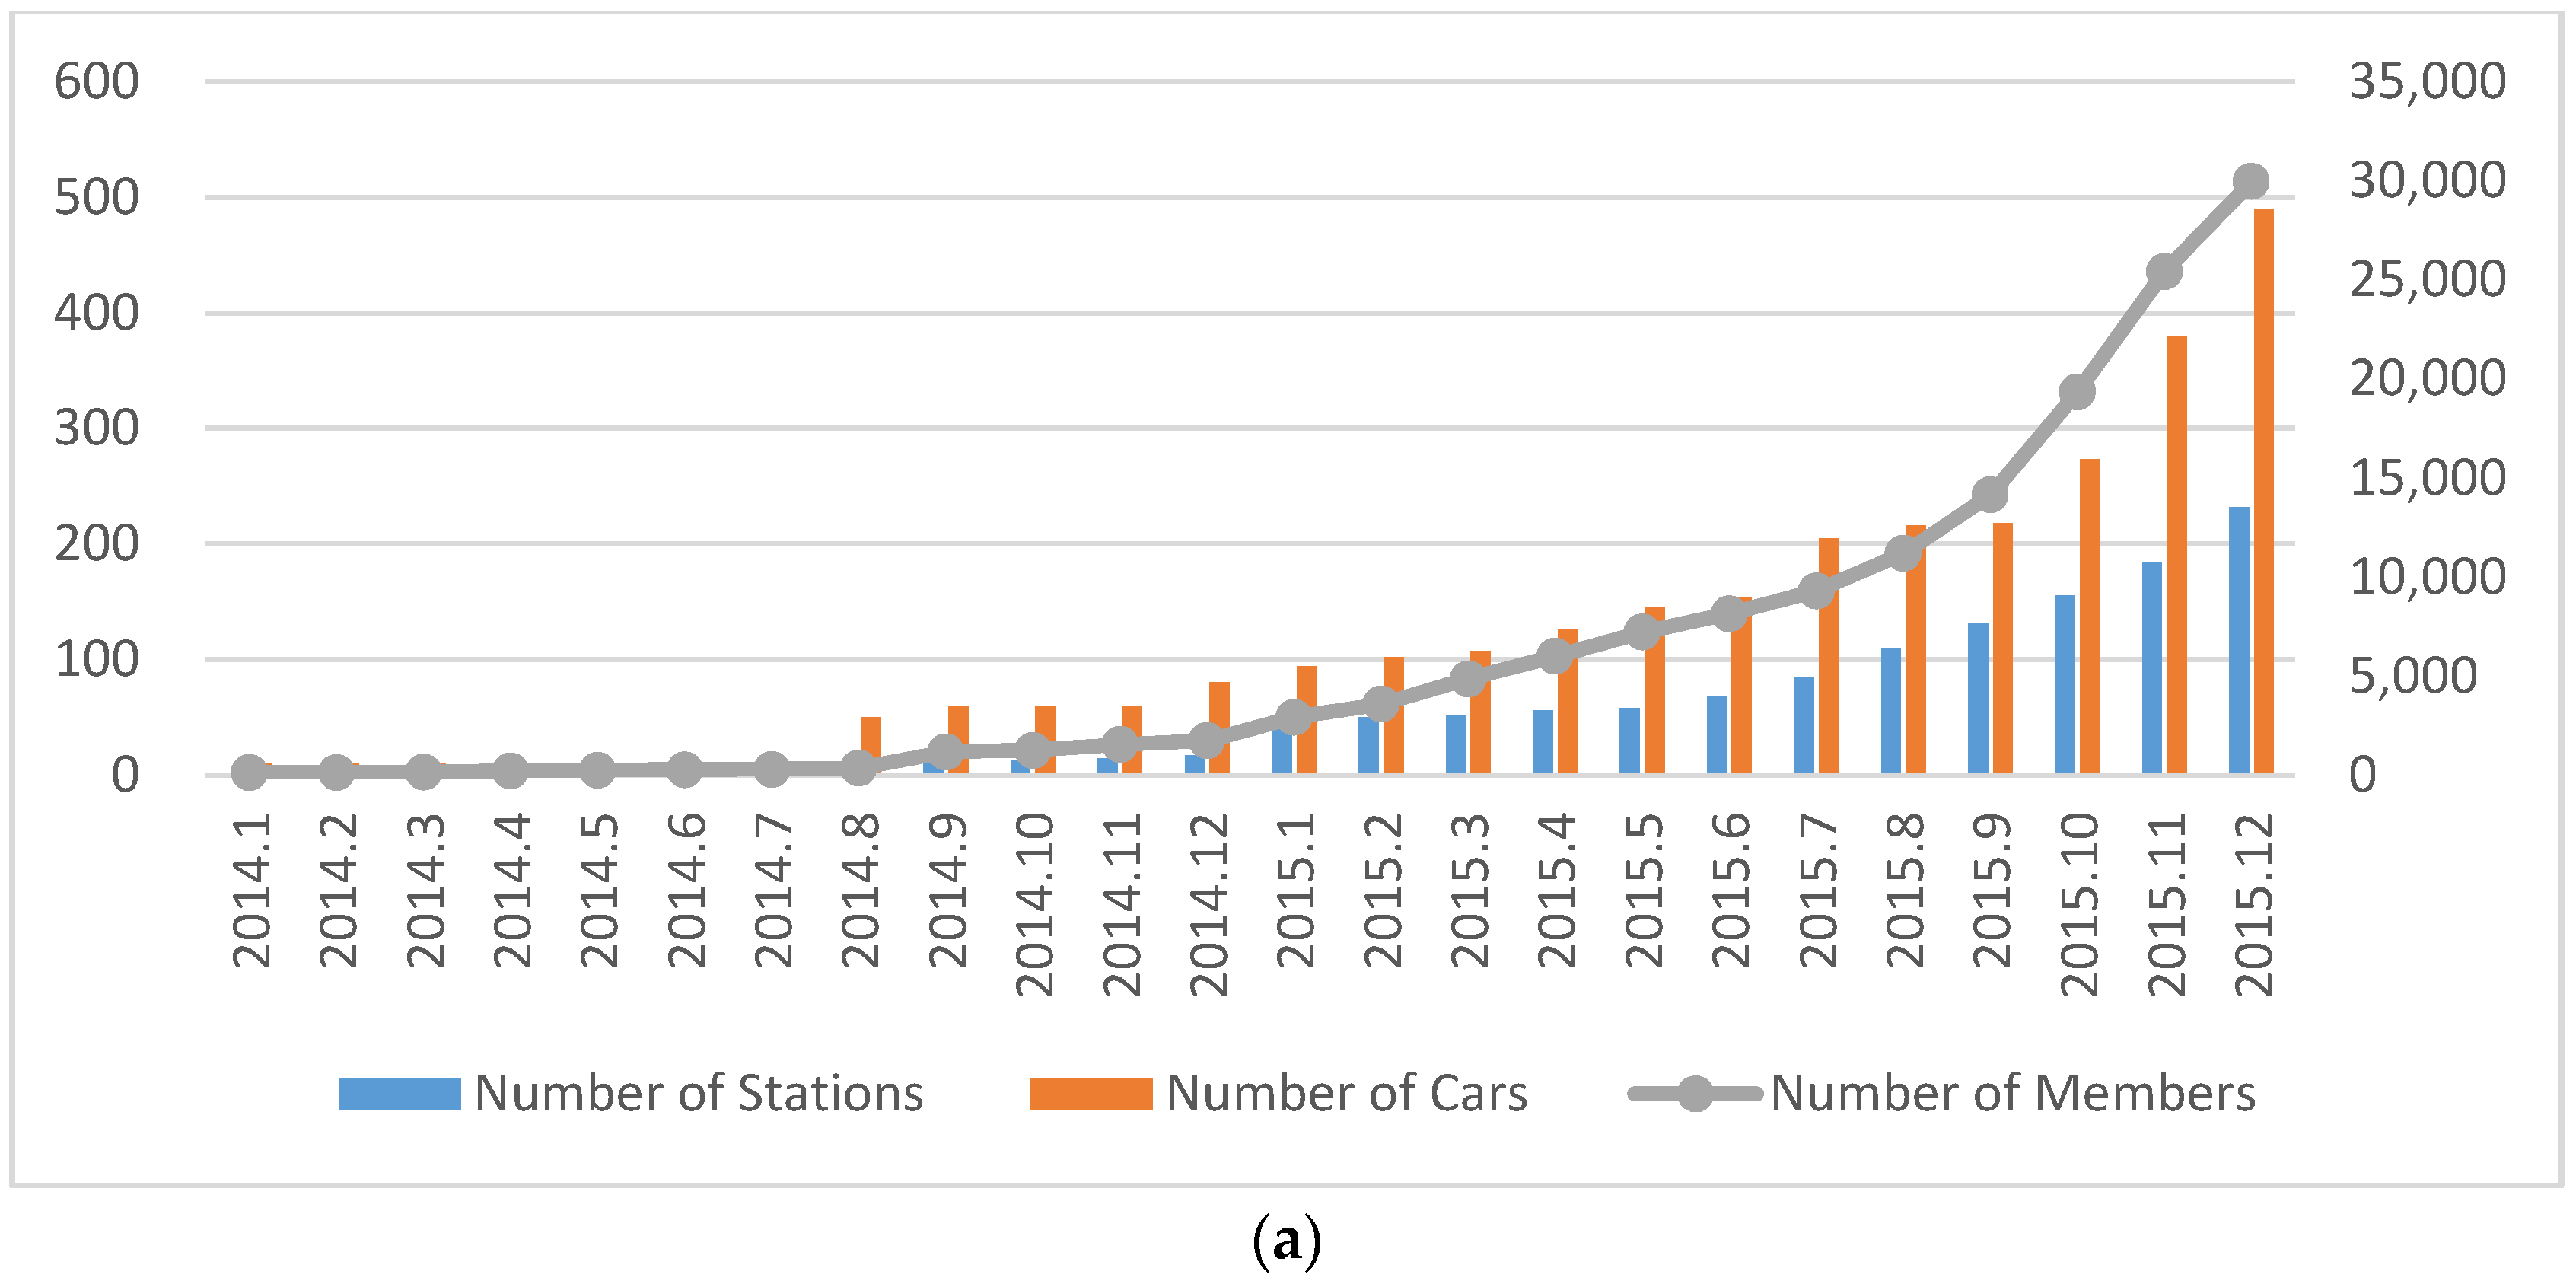
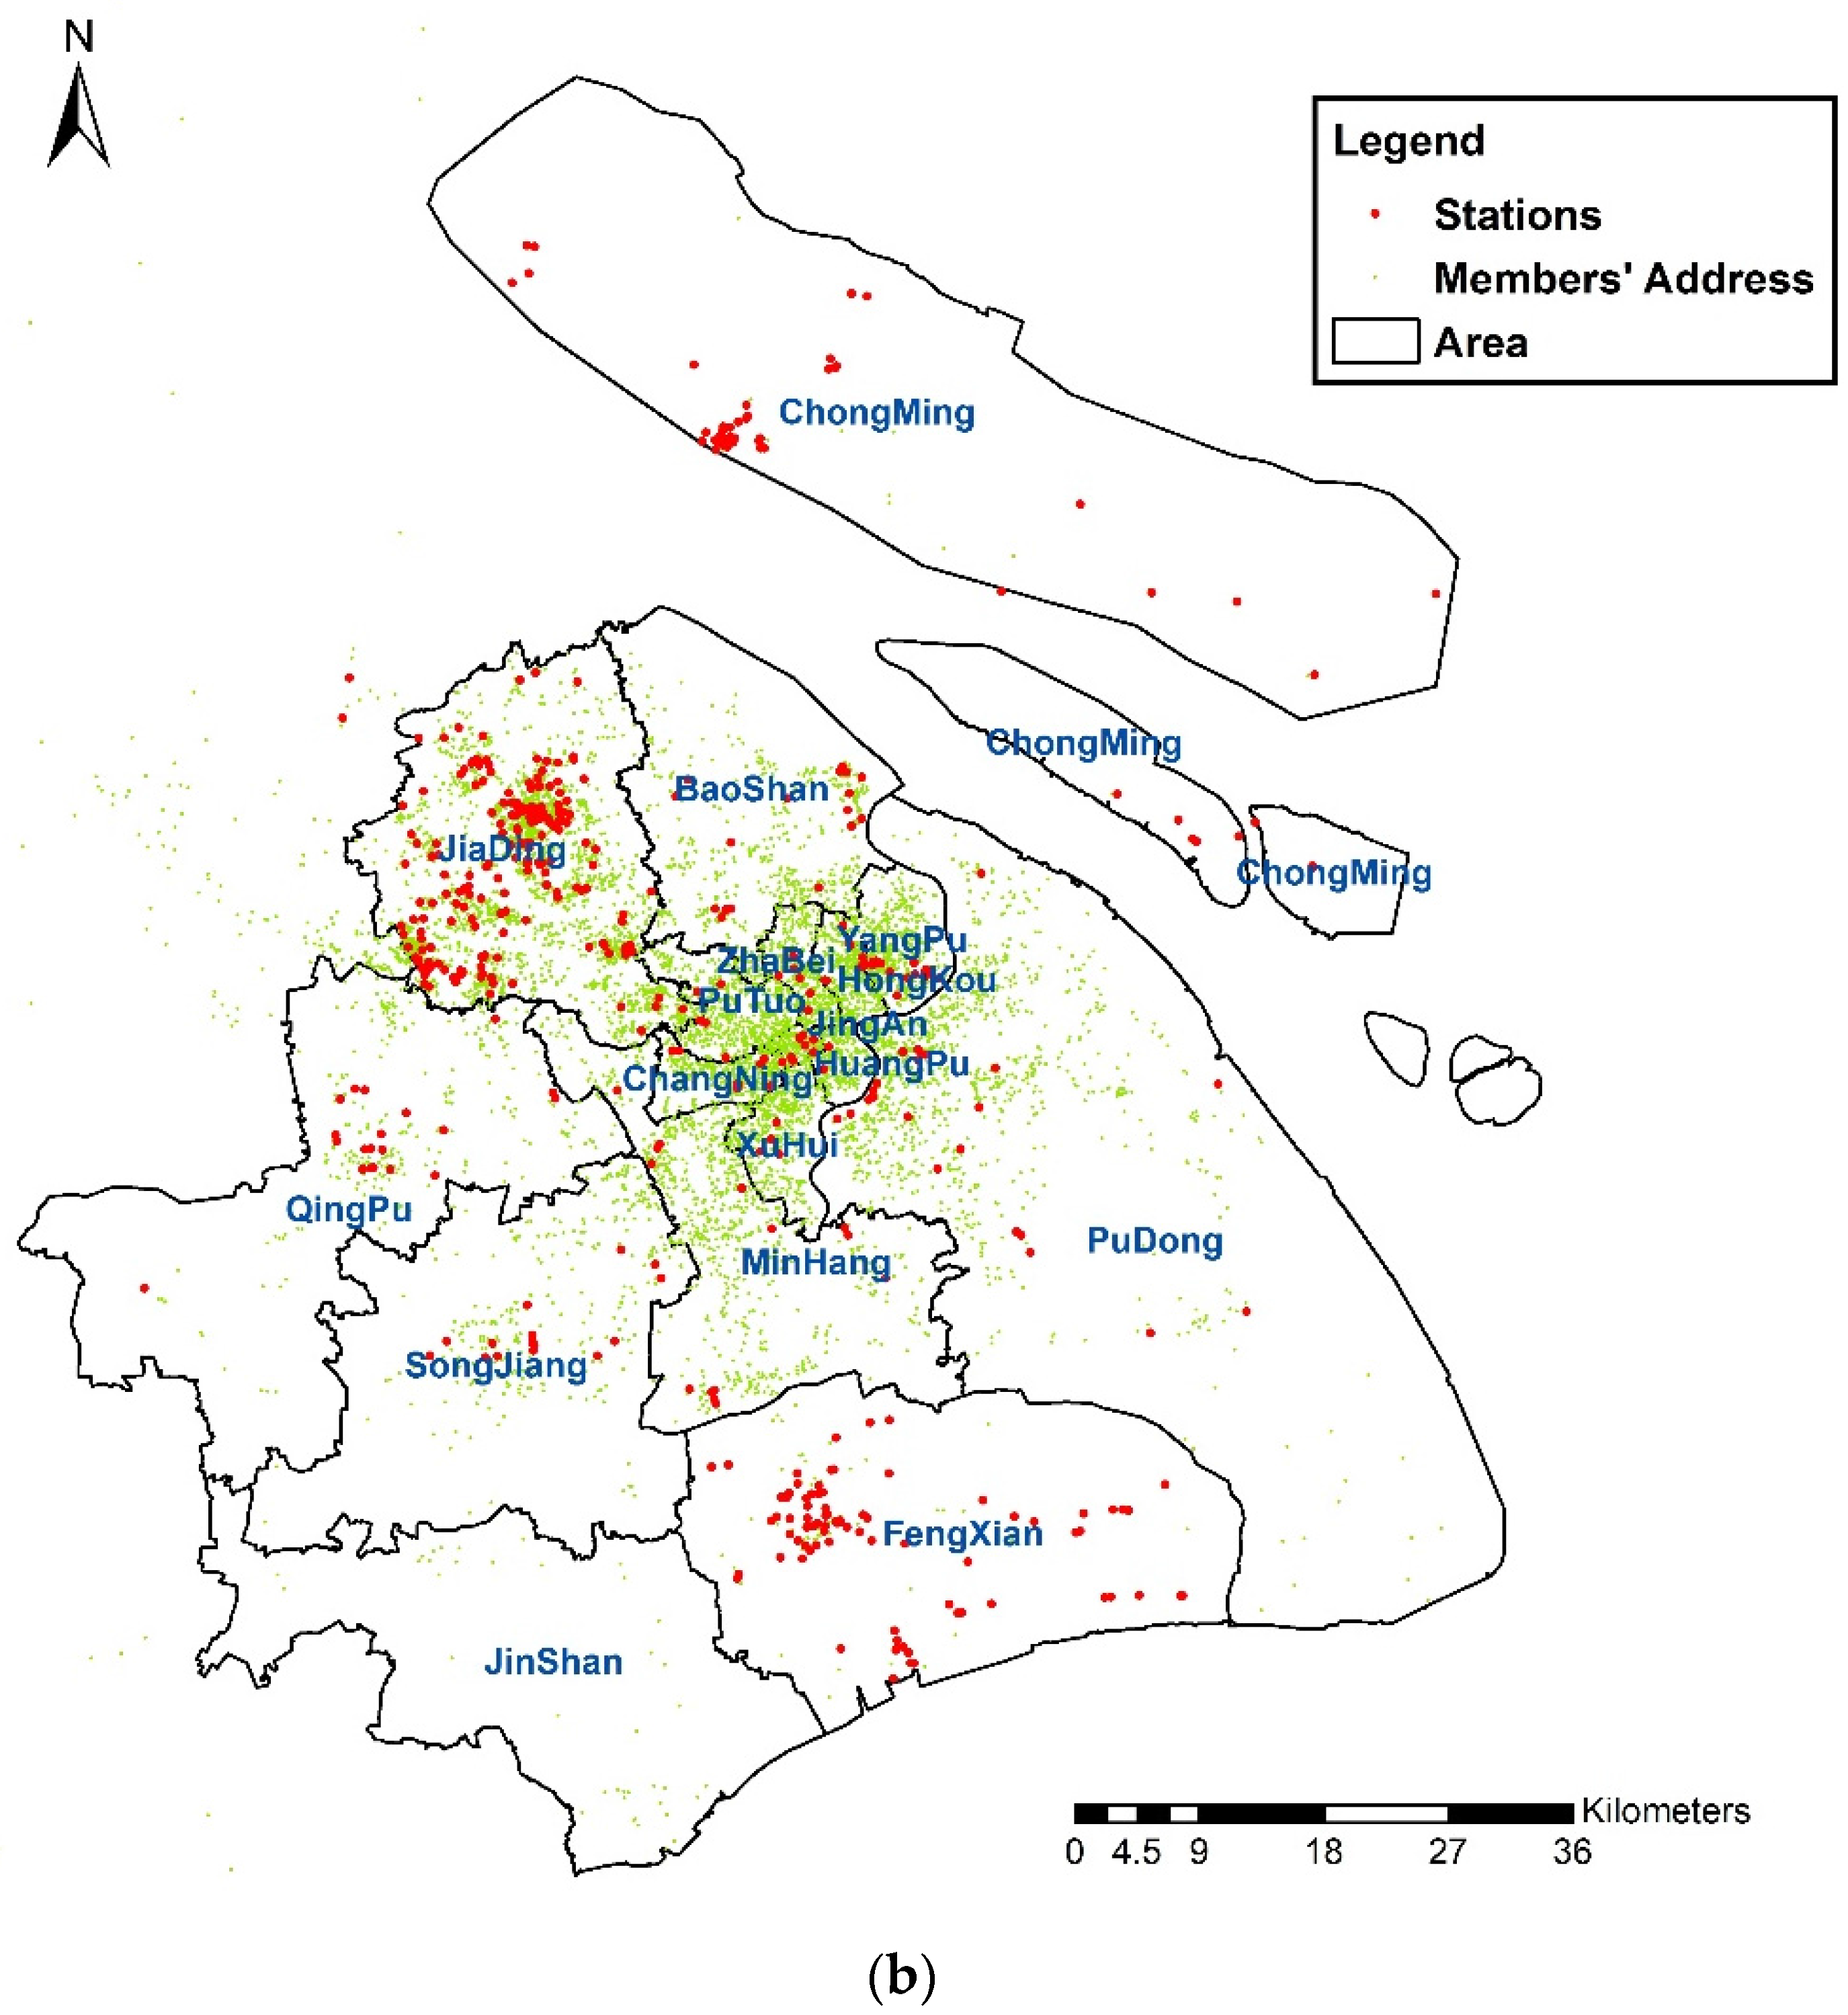
Since the project launched in December 2013, both the demand and supply of the EVCARD developed rapidly. The growth trends of stations, cars and members during 2014–2015 are shown in Figure 1a. The cars-to-station ratio is around 2:1. However, the members-to-cars (or stations) ratio is increasing. By June 2016, the number of registered members has reached 89,129, while only 474 stations have been set up in Shanghai. The spatial distributions of members’ addresses and stations are shown in Figure 1b. It can be seen that most of the stations are in JiaDing District and FengXian District, far away from center area of the city. At the same time, the growth of membership is limited by the stations’ locations, where most members gather around the existing stations. Therefore, the EVCARD is expected to expand its service area towards the center district of Shanghai to attract more users and meet higher demand. How to properly site future stations is the problem addressed in this paper.

3. Method and Data

3.1. Establishment of the Siting Decision System

3.1.1. Selection of Decision Criteria

In order to make the carsharing system more efficient and beneficial, the following criteria should be addressed when siting stations. First, station locations should cover as many potential users as possible so that more people can be attracted by this kind of transportation mode. Second, station locations should cover potential travel demand as much as possible so that shared cars can be used more frequently. Third, station locations should cover different properties of land-use so that travelers with different purposes can be satisfied. Additionally, future stations should not be too close to the existing stations, considering the equilibrium of the distribution. To sum up, (1) the potential users; (2) potential travel demand; (3) potential travel purposes; and (4) distances from existing stations are selected as the decision criteria of this system.

3.1.2. Selection of Evaluation Indicators

Based on the decision criteria stated above, 15 evaluation indicators are selected for quantitative analysis. Each of them is related to the decision criteria.
  • Potential users. A place where more people live may have more carsharing users. Therefore, the first indicator is the density of the resident population (denoted by C1). However, only registered members can use the carsharing system. The more members live around a station, the higher the use rate of the shared cars. Therefore, the density of members (denoted by C2) is another important indicator.
  • Potential travel demand. According to a survey [29], 62.8% of carsharing members are from zero-vehicle households. Taxi riders without cars are more likely to shift to carsharing since it provides an equivalent accessibility and convenience at a relatively low price. Therefore, the taxi trip origin-destination (OD) can be used to estimate the potential travel demand for carsharing. However, the demand varies depending on the trip distance [30]. Based on the urban spatial scale of Shanghai, the densities of taxi trip ODs of 0–5 km (denoted by C3), 5–10 km (denoted by C4), 10–20 km (denoted by C5), 20–50 km (denoted by C6), 50–100 km (denoted by C7), and above 100 km (denoted by C8) are selected as the indicators representing the potential travel demand.
  • Potential travel purposes. It is reported that trips with different purposes have different use rates of carsharing [29]. Accordingly, the densities of points for different purposes are selected as evaluation indicators, including points for shopping (denoted by C9), business and work (denoted by C10), social recreation (denoted by C11), medical service (denoted by C12), education (denoted by C13), and transportation (denoted by C14), such as metro stations, airport, railway station, etc.
  • Distance from existing stations. One kilometer is considered to be the largest distance to a station that most members would be willing to walk [9]. That is, the coverage of the carsharing system is the area within 1 km of all stations. If a new station is too close to the existing stations, within 1 km, the coverage cannot be expanded effectively. Therefore, a station is not suggested to be set up when the distance from an existing station (denoted by C15) is less than 1 km.

3.1.3. Siting Decision Framework

Given the evaluation indicator system, a technique of data mining on mobile phone, taxi GPS, POIs, and EVCARD data is adopted to obtain effective datasets of the 15 evaluation indicators. Since the data volume is so large that a personal computer cannot handle it, we employ Apache Spark, a fast and general-purpose cluster computing system, to process the data. Further, the AHP is used to determine the weights, and the spatial analyst in ArcGIS (Esri, Redlands, CA, USA) is used to calculate the values of the indicators. Finally, the synthetic scores of all 1 km × 1 km decision units are visualized in a heat map which can evaluate the locations of candidate stations. The flowchart of the siting decision system is shown in Figure 2.

3.2. Data Preparation

3.2.1. Analysis of Mobile Phone Data

Mobile phone data is generated through the usage and physical movement of mobile phones. Information about the location of mobile phones is needed to keep the mobile phone network working properly. This information is obtained not from the phones but rather from the network itself. Chen et al. developed a procedure to identify activity locations using mobile phone data, and verified that the distribution of the region resident population can be accurately estimated by analyzing mobile phone data [31].
For the purposes of this research, we obtained the mobile phone data from China Mobile Communications Corporation of Shanghai. The dataset was collected between 13 April 2015 and 19 April 2015 with 1.1 billion records per day. In total, 37,450 base stations were found in the dataset with the spatial resolution of 500–1000 m. However, the raw data included many needless fields and exceptional data which were filtered out and cleaned. Then, we obtained the effective dataset as shown in Table 1.
Having the effective dataset, an algorithm was developed to identify the home locations of residents based on the following assumptions: (1) most people stay at home before dawn (00:00–6:00); (2) the most frequent location recorded at midnight is the home address; (3) users whose home addresses remain unchanged for more than four days during one week are inhabitants of this area. As a result, 14,951,503 inhabitants were identified, accounting for 62% of the total resident population in Shanghai. Home addresses of all people can be used to estimate the density of the resident population (C1).

3.2.2. Analysis of Taxi GPS Data

Most taxis are equipped with a global position system (GPS), which can record the location, speed, direction, and other information of the taxi. We obtained taxi GPS data from Shanghai Qiangsheng Taxi Corporation, which owns about 13,000 taxis. To match this data with the mobile phone data, the taxi data between 13 April 2015 and 19 April 2015 was selected.
The raw dataset includes many fields, such as CARID, ALERT, EMPTYCAR, TOPLIGHT, ELEVATEDROAD, RECEIVETIME, TIMESTAMP, LONGTITUDE, LATITUDE, SPEED, DIRECTION, and SATELLITE. EMPTYCAR represents the passenger state of the taxi. When EMPTYCAR = 0, there are passengers in the car; otherwise EMPTYCAR = 1. Based on changes in EMPTYCAR, we can identify pick-up points and drop-off points of every taxi trip. Using TIMESTAMP, LONGTITUDE, and LATITUDE recorded every 10 s, the travel time and distance of every trip can be calculated by Spark. The details on every taxi trip are shown in Table 2. Then taxi trip ODs are divided into six groups based on the trip distance to obtain the effective dataset of indicators C3C8.

3.2.3. Analysis of POI Data

A point of interest (POI) is a specific point location that someone may find useful or interesting, including businesses, hospitals, hotels, residences, educational buildings, shopping malls, etc. POI data is usually described by a name, address, category, and a set of geospatial coordinates. For example, the data record (bff8fa7ddad436a1c9213da4’, ‘Old Shanghai Restaurant’, ‘Shanghai’, ‘Huangpu’, ‘300 East Nanjing Road’, ‘Chinese Restaurant’, ‘021-33767922’, ‘121.49099’, ’31.24345) represents the item ID, name, province, region, address, category, telephone, longitude and latitude, respectively.
In this paper, we consider POIs as potential travel destinations of different purposes. Based on the criteria and indicators above, data on more than 120,000 POIs in Shanghai covering 10 categories was collected using the API of Baidu Map. The points of shopping malls represent the purpose of shopping (C9); the points of companies and governments represent the purposes of business and work (C10); the points of restaurants, hotels and scenic spots represent the purposes of social-recreation (C11); the points of hospitals represent the medical purposes (C12); the points of schools represent the education purposes (C13), and the points of transportation junctions (e.g., metro stations, railway stations, airports, and ports) represent the purposes of transportation (C14).

3.2.4. Analysis of EVCARD Data

Transaction data is one kind of the EVCARD operational data, which includes the transaction code, member’s name, car’s number, order time, pick-up time, drop-off time, pick-up station, drop-off station, trip time length, trip distance, rental fee, etc. We obtained all transaction data of the EVCARD since it was launched. There are more than 300,000 transaction records since 2014. After removing all invalid data, the trip distance distribution and trip time distribution were generated using statistical analysis (as shown in Figure 3a,b).
To better understand the users’ behavior related to carsharing, a web-based questionnaire was designed for EVCARD members. Eventually, 208 valid responds were obtained for analysis. The questionnaire includes user profiles, trip patterns and purposes, car preferences, walk distances, and substitutes for the EVCARD. In this paper, only the purposes of using the EVCARD are concerned. The distribution of trip purposes is shown in Figure 3c.
Since there are three decision criteria and 15 evaluation indicators in the decision system, it is necessary to employ multi-criteria analysis methods, which can be used to solve problems with multiple objectives by assessing multiple solutions, yielding results that are more effective, clear, and logical than the corresponding single-criteria approaches [12]. AHP is one of the best-known and most widely used multi-criteria analysis approaches, which can help decision-makers evaluate the importance of different indicators for a specific issue when lacking quantitative ratings. Therefore, the AHP method was applied to determine the weight of each evaluation indicator in this section.

3.3.1. Establishment of a Hierarchic Structure

Based on the decision framework presented above, three layers of the structure were established, including the objective layer (A), criteria layer (B), and indicator layer (C). The objective layer represents the main goal of the decision system, which is the optimal location of carsharing stations. The criteria layer represents the three main criteria, which emphasize the potential users (B1), potential travel demand (B2) and potential travel purposes (B3). The indicator layer includes the 14 indicators (C1–C14) described above, except for the distance from existing stations (C15).

3.3.2. Construction of Comparison Matrix

To rate the indicators, a set of pairwise comparison matrices (n × n) was constructed for each of the lower levels with one matrix for each element in the level immediately above it. The values of the matrices were obtained based on the nine-point rating system proposed by Saaty [32] (Table 3).
For the criteria (B1, B2, B3) and indicators of the first criterion (C1, C2), the relative levels of importance were analyzed using expert scoring method. We invited 10 experts from carsharing operators and researchers to decide the relative importance of each indicator. In consequence, most experts give equal importance to B1, B2, and B3, while C2 is thought to be moderately more important than C1.
For the indicators of the second criterion (C3, C4, C5, C6, C7, C8), the relative levels of importance were determined based on Figure 3a. The larger the frequency of the indicator, the more important the indicator. As a result, C6 has the highest importance, followed by C3, C4, and C5 which have equivalent importance, while C7 and C8 are relatively less important.
For the indicators of the third criterion (C9, C10, C11, C12, C13, C14), the relative levels of importance were determined based on Figure 3c, where C11 ranks the first and C12 is the last.
Then, the pairwise comparison matrices of all indicators are summarized in Table 4. Further, the consistencies of the matrices are evaluated, where all consistency ratios (CR) were found to be below the threshold level (0.1). Thus, the results can be accepted.

3.3.3. Determine Weights of Indicators

By calculating the eigenvectors corresponding to the largest eigenvalues of the comparison matrices, the single weights and total weights of the indicators were determined as following steps.
(a)
Obtain the product of every element in row Ci (or Bi) in the pairwise comparison matrix:
c i = i n c i j , b i = i n b i j
(b)
Obtain the root of ci (or bi):
w c i ¯ = c i n , w b i ¯ = b i n
(c)
Calculate the single weight of Ci (or Bi) by normalization:
w c i = w c i ¯ i = 1 n w c i ¯ , w b i = w b i ¯ i = 1 n w b i ¯
(d)
Calculate the total weight of Ci
w i = w c i × w b i
The results are shown in Table 5.

3.4. Spatial Evaluation Based on GIS

The prepared data on indicators was imported into ArcGIS as point features, which can be processed using the “Spatial Analyst” toolbox.

3.4.1. Calculation of Indicator Values

For C1C14, we employed the “Kernel Density” tool to calculate the density of features in their neighborhoods. Based on the default search radius algorithm, the indicators’ values for each 50 m × 50 m raster cell are calculated. With colors representing density values, the heat maps of these 14 indicators are shown in Figure 4.
For C15, circle buffers with radius of 1 km should be generated to identify the areas where stations cannot be located. The “Euclidean Distance” tool was used to calculate the distances from the existing stations to each raster cell. The values are reclassified into two groups, which are 0–1km and above 1 km, respectively, as shown in Figure 4.

3.4.2. Normalization of Indicator Values

It can be seen that the 14 indicators (C1C14) have different ranges of values. In order to make the weights above effective, the indicators were normalized to the same range. Using the raster calculator, the indicator values were divided by their maximum value and multiplied by 100. After that, all of these indicators were between 0 and 100. Since the distance from existing stations is an external constraint, 0–1 dummy values are assigned to C15.

3.4.3. Scoring of Decision Unit

Based on the results above, the synthetic scores for siting decision can be obtained using the following formula:
S = C 15 × i = 1 14 w i C i
where S is the synthetic score, Ci is the value of indicator i, and wi is the weight of indicator i. Then, the score of every 50 m × 50 m raster cell can be calculated using the “Raster Calculator” of ArcGIS. However, the size of each raster cell is too small to make a decision. Considering that the covering radius of a station is 1 km, we created a fishnet of 1 km × 1 km square cells on the map of Shanghai using ArcGIS. These cells were chosen as the decision unit because they are independent locations without crossed coverage areas. Accordingly, the average values of raster cells are aggregated in these decision units, which can be regarded as candidate sites of carsharing stations.

4. Results and Discussion

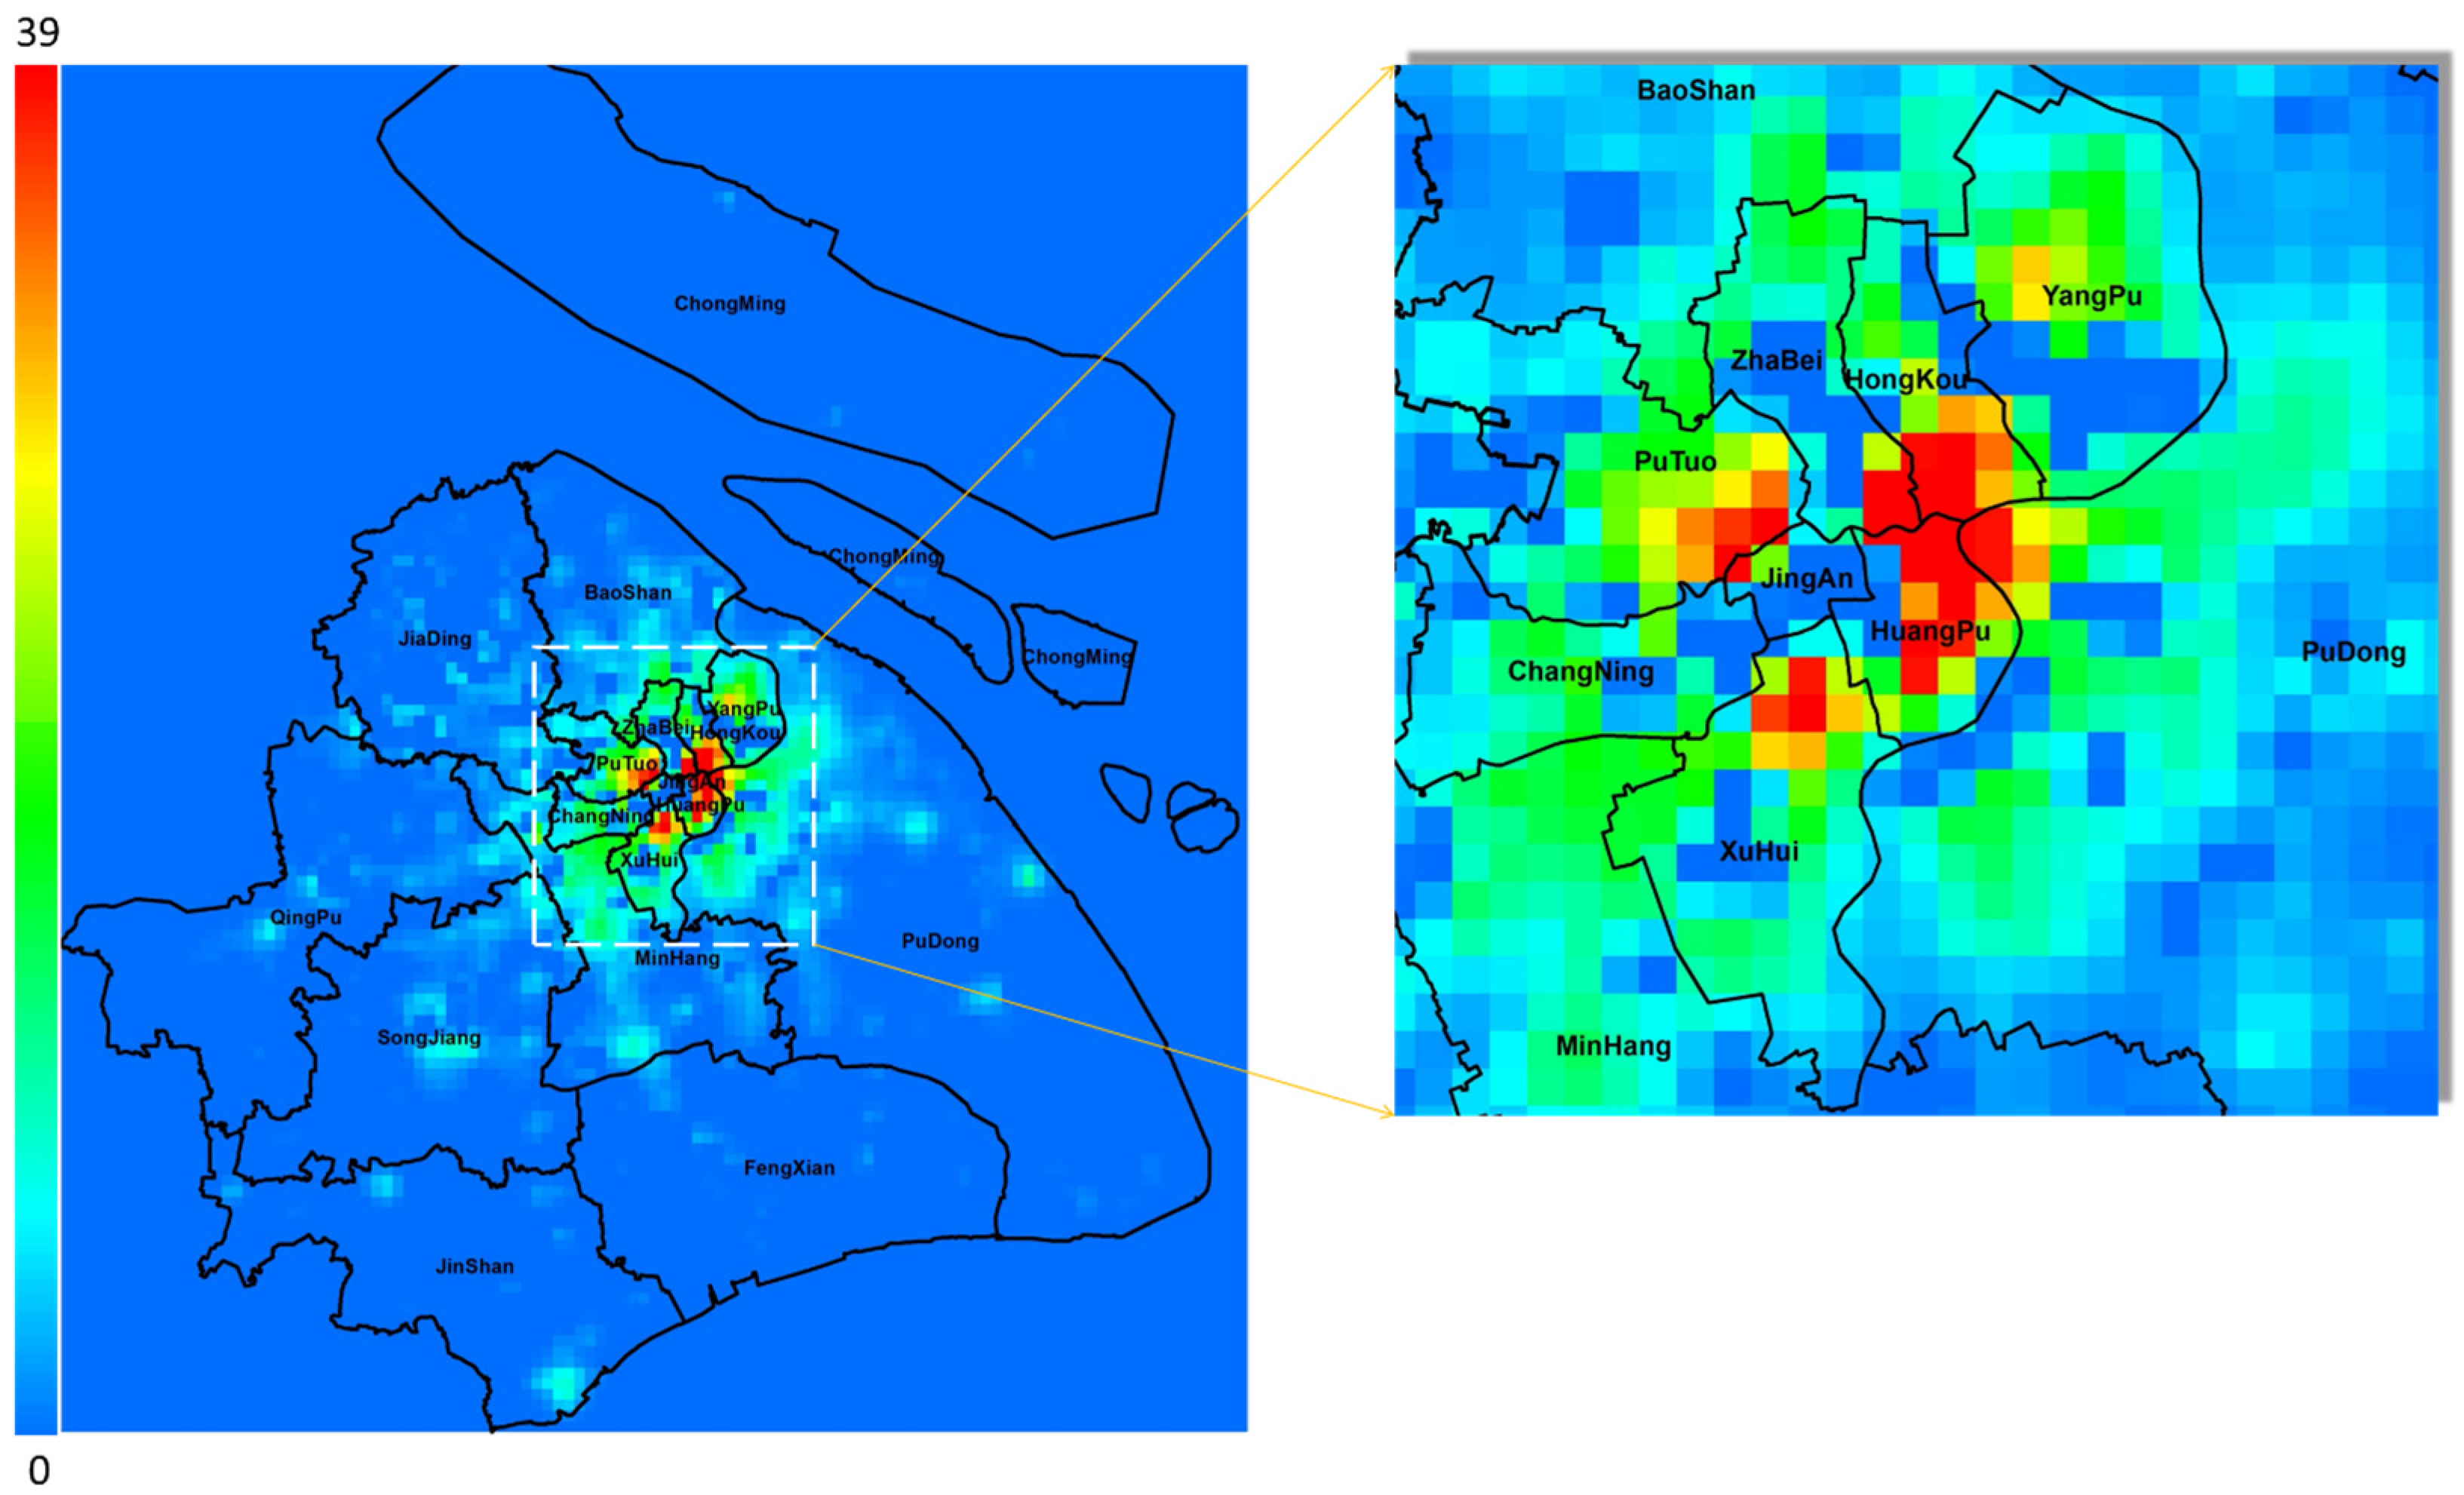
Applying the method and data presented above, the synthetic scores of every decision unit for the siting of carsharing stations are presented in Table 6. Based on the mapping relation between UID and the location of decision unit in GIS, the scores of the decision units can be visualized using a heat map where the red color represents the highest scores and the blue color represents the lowest scores, as shown in 
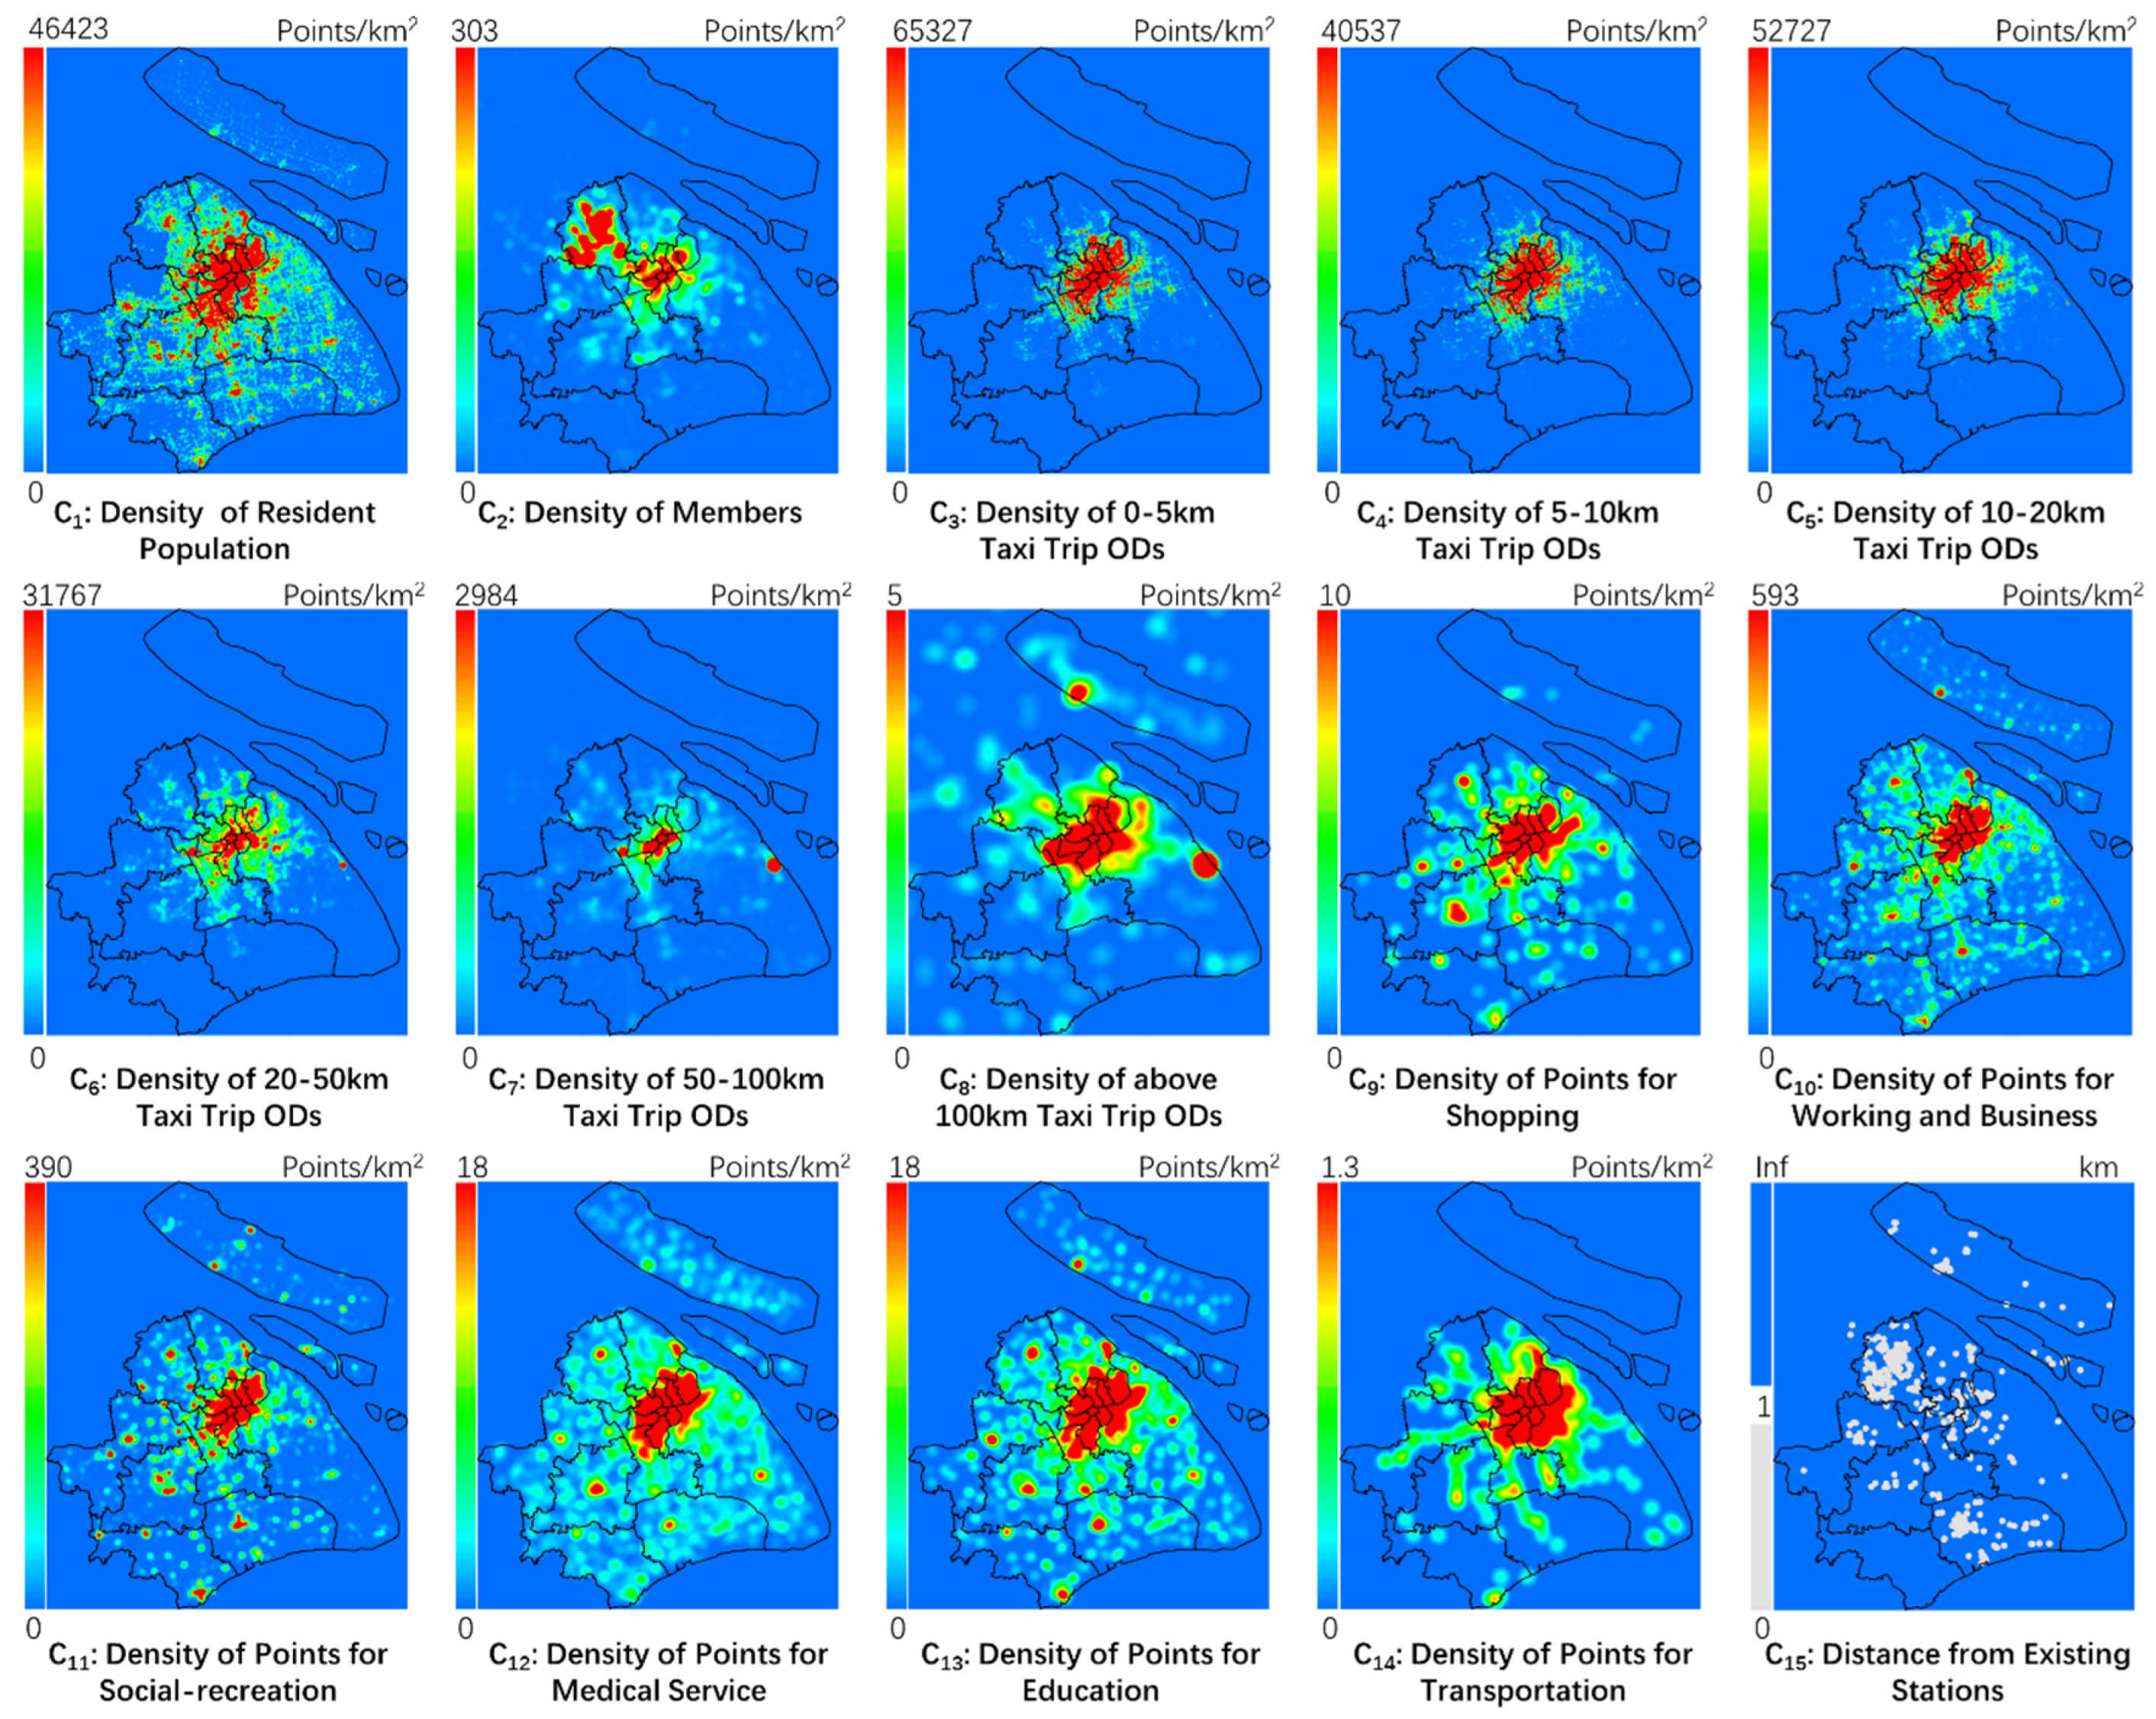
Figure 5. The results show that high-score units are distributed in the center of the city, mainly in the north of HuangPu District, south of HongKou District, north of XuHui District, and east of PuTuo District, where there are more potential users, higher potential travel demand, and more points attracting people with different purposes according to Figure 4. Therefore, these areas are the prior locations for siting of EVCARD stations. However, there are some exceptions in JingAn District, which is considered to be the downtown area. Since JingAn District already has seven stations located in an area of 8 km2, there is less need to set up new stations in this area.
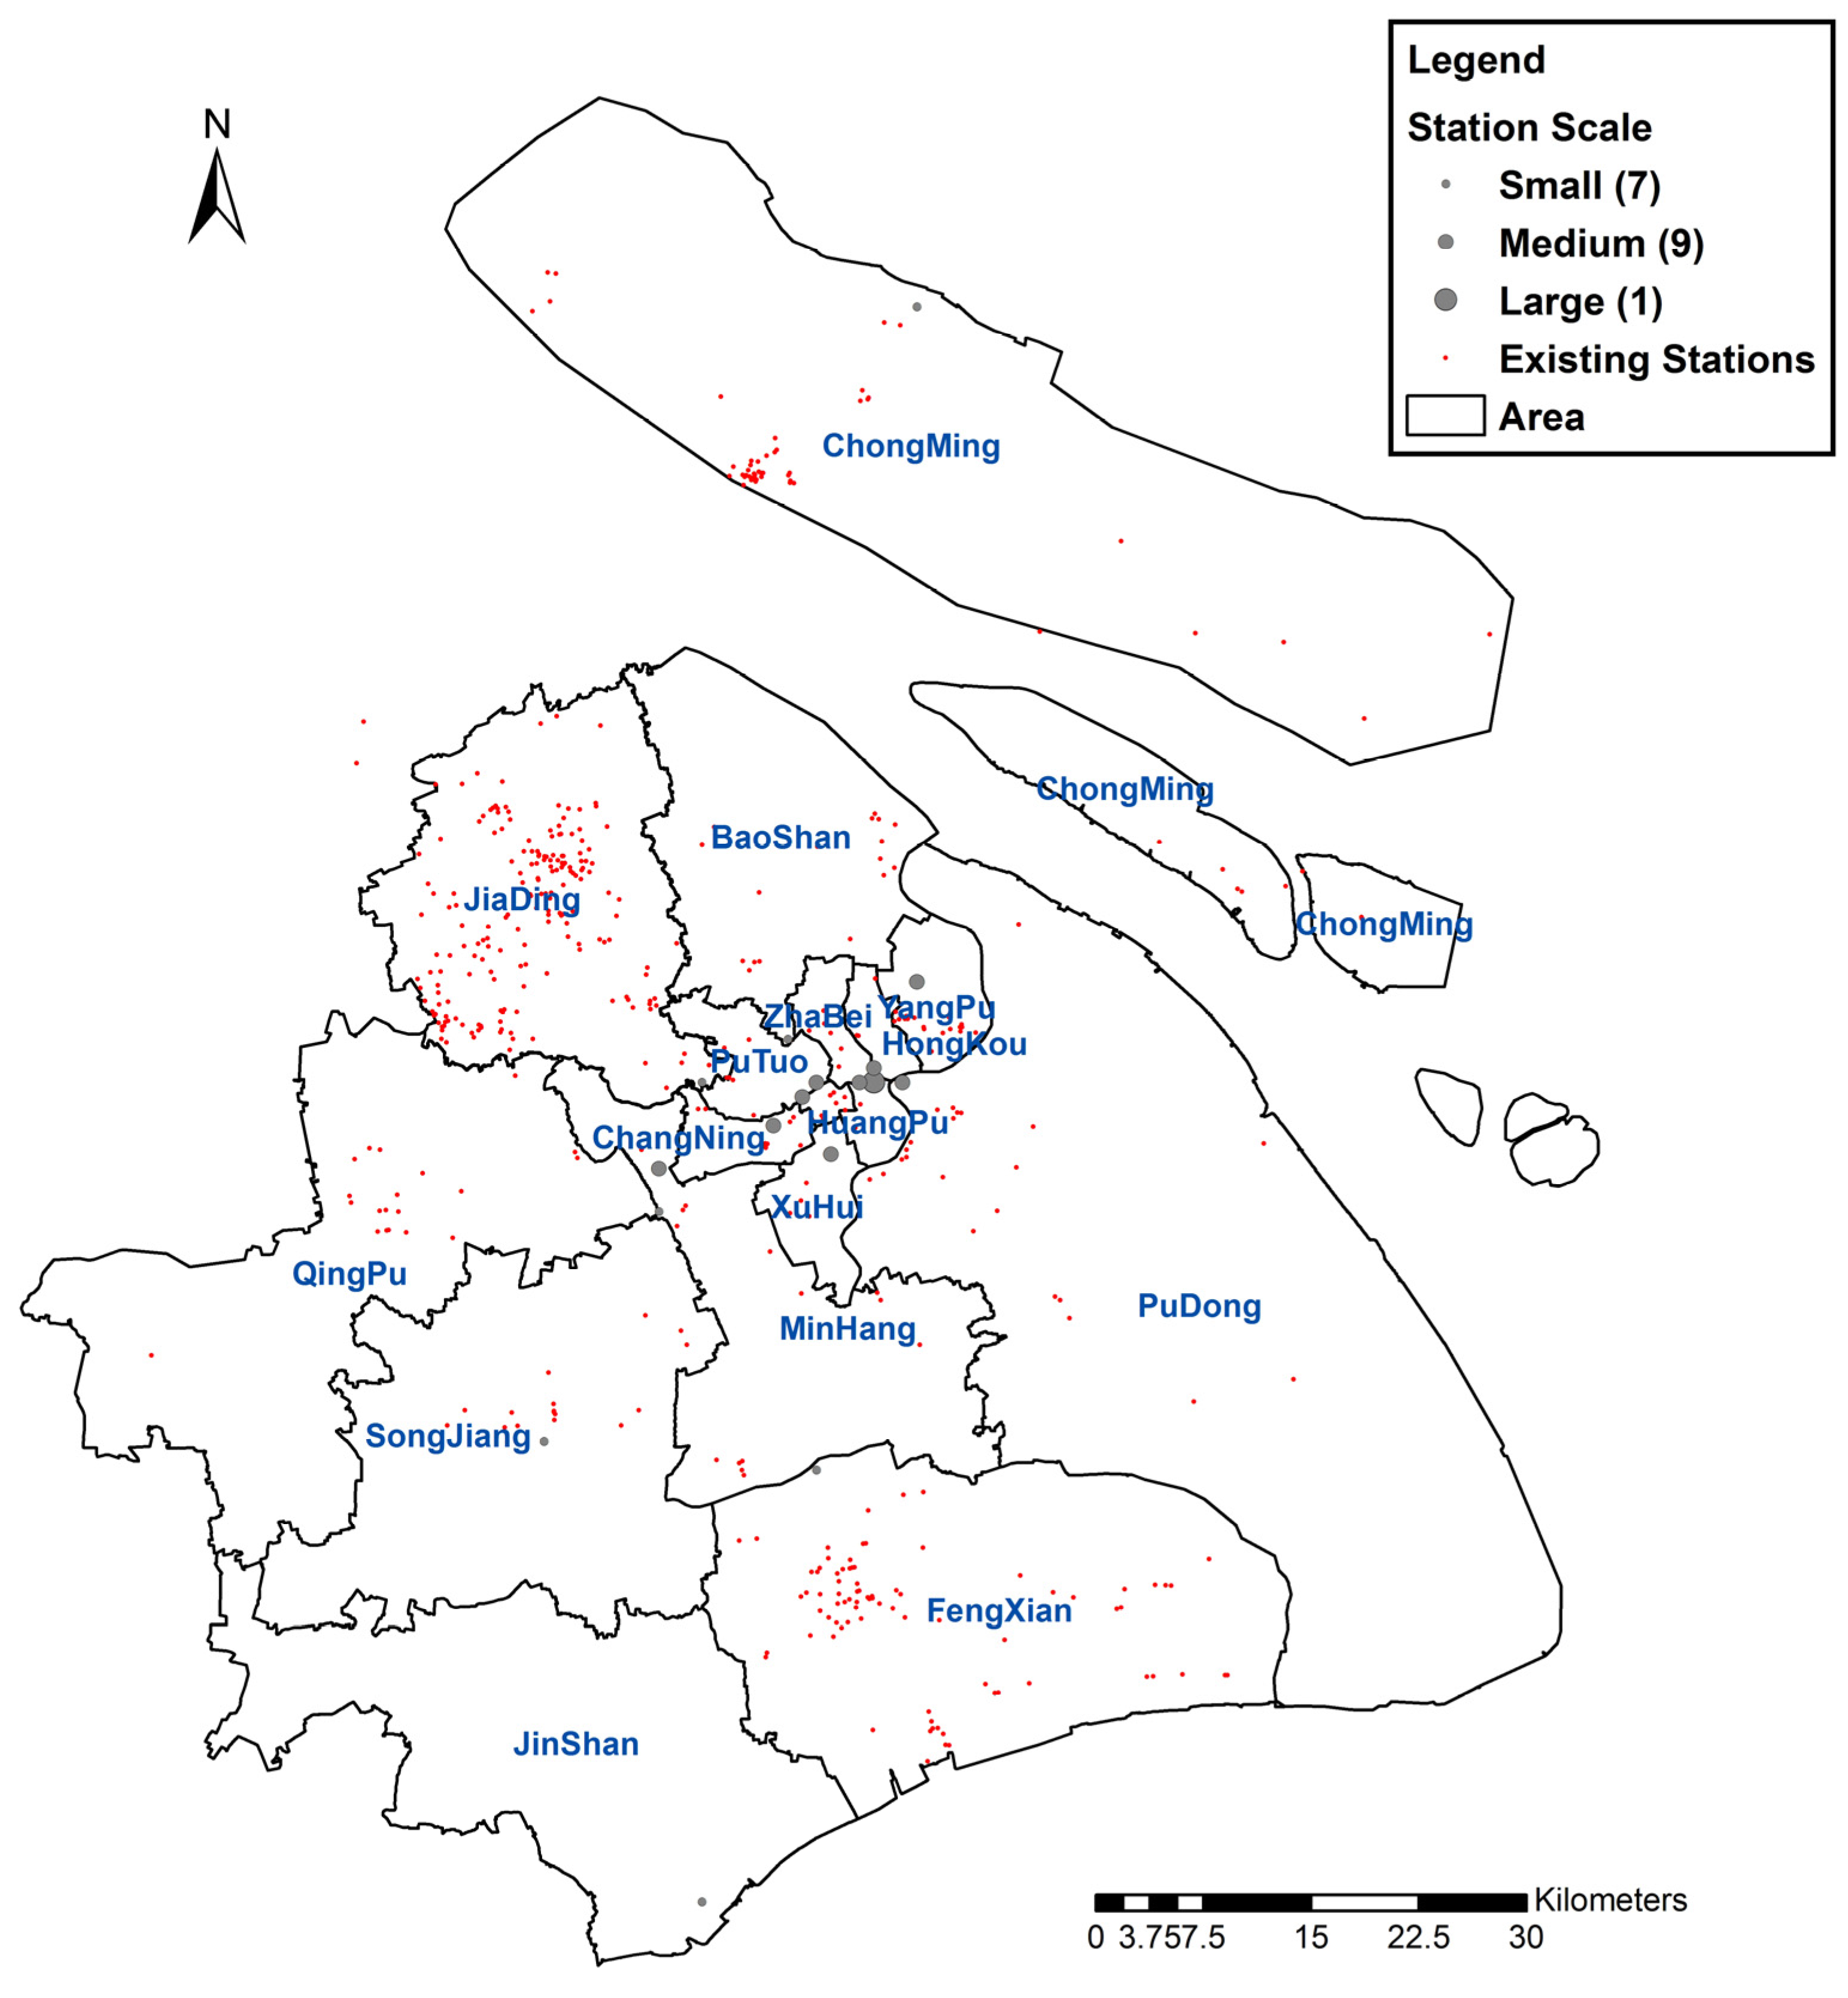
On the other hand, to expand the coverage and improve accessibility of carsharing, stations should be distributed more dispersedly instead of just in the center district of the city. There are 17 administrative districts in Shanghai. The operators of EVCARD usually consider how to add a station to each district separately. Given the scores and locations of all decision units in Table 6 and Figure 5, the top-score unit of each administrative district can be selected. For example, the top score of HuangPu district is 40.4039, which links to the No. 4225 unit. Then the carsharing operator should give priority to available land in this unit for building the next station. Accordingly, the stations proposed to be set up in the 17 districts of Shanghai can be marked in the map as shown in Figure 6. Further, we divide the stations into three classes based on the score of the decision unit: small stations with 3–5 parking lots, medium stations with 5–10 parking lots, and large stations with 10–20 parking lots. As Figure 6 illustrates, the size of the point on the map represents the scale of the station. It is suggested that a large station should be set up in the north of HuangPu District, 9 medium stations be distributed in downtown districts, and 7 small stations are needed in suburban districts. Furthermore, the dataset of indicator C15 can be updated after applying the 17 stations to the locations of existing stations. In consequence, new stations can be planned continually.
We also analyzed the sensitivity of the results by changing the weights of the criteria and indicators. Within the change range of ±30%, the variations of score distribution were found to be very small. The center areas discussed above are always the prior locations for siting of carsharing stations, which indicates that the results of our method are stable and reliable. However, the areas selected by our method are ideally optimal locations for carsharing without considering parking spaces and land prices, which are changeable. In practical applications, more data regarding land use should be included. It is certain that the results can provide effective candidate sites for carsharing systems. If there is enough land for parking near a candidate site and the cost is acceptable, then the candidate site will be selected. This can save much time for decision-makers when siting stations for carsharing.

5. Conclusions

This paper is a case study of Shanghai EVCARD, an electric carsharing program in China. To determine the optimal locations of stations, a novel approach based on the AHP and GIS using multi-source data is proposed.
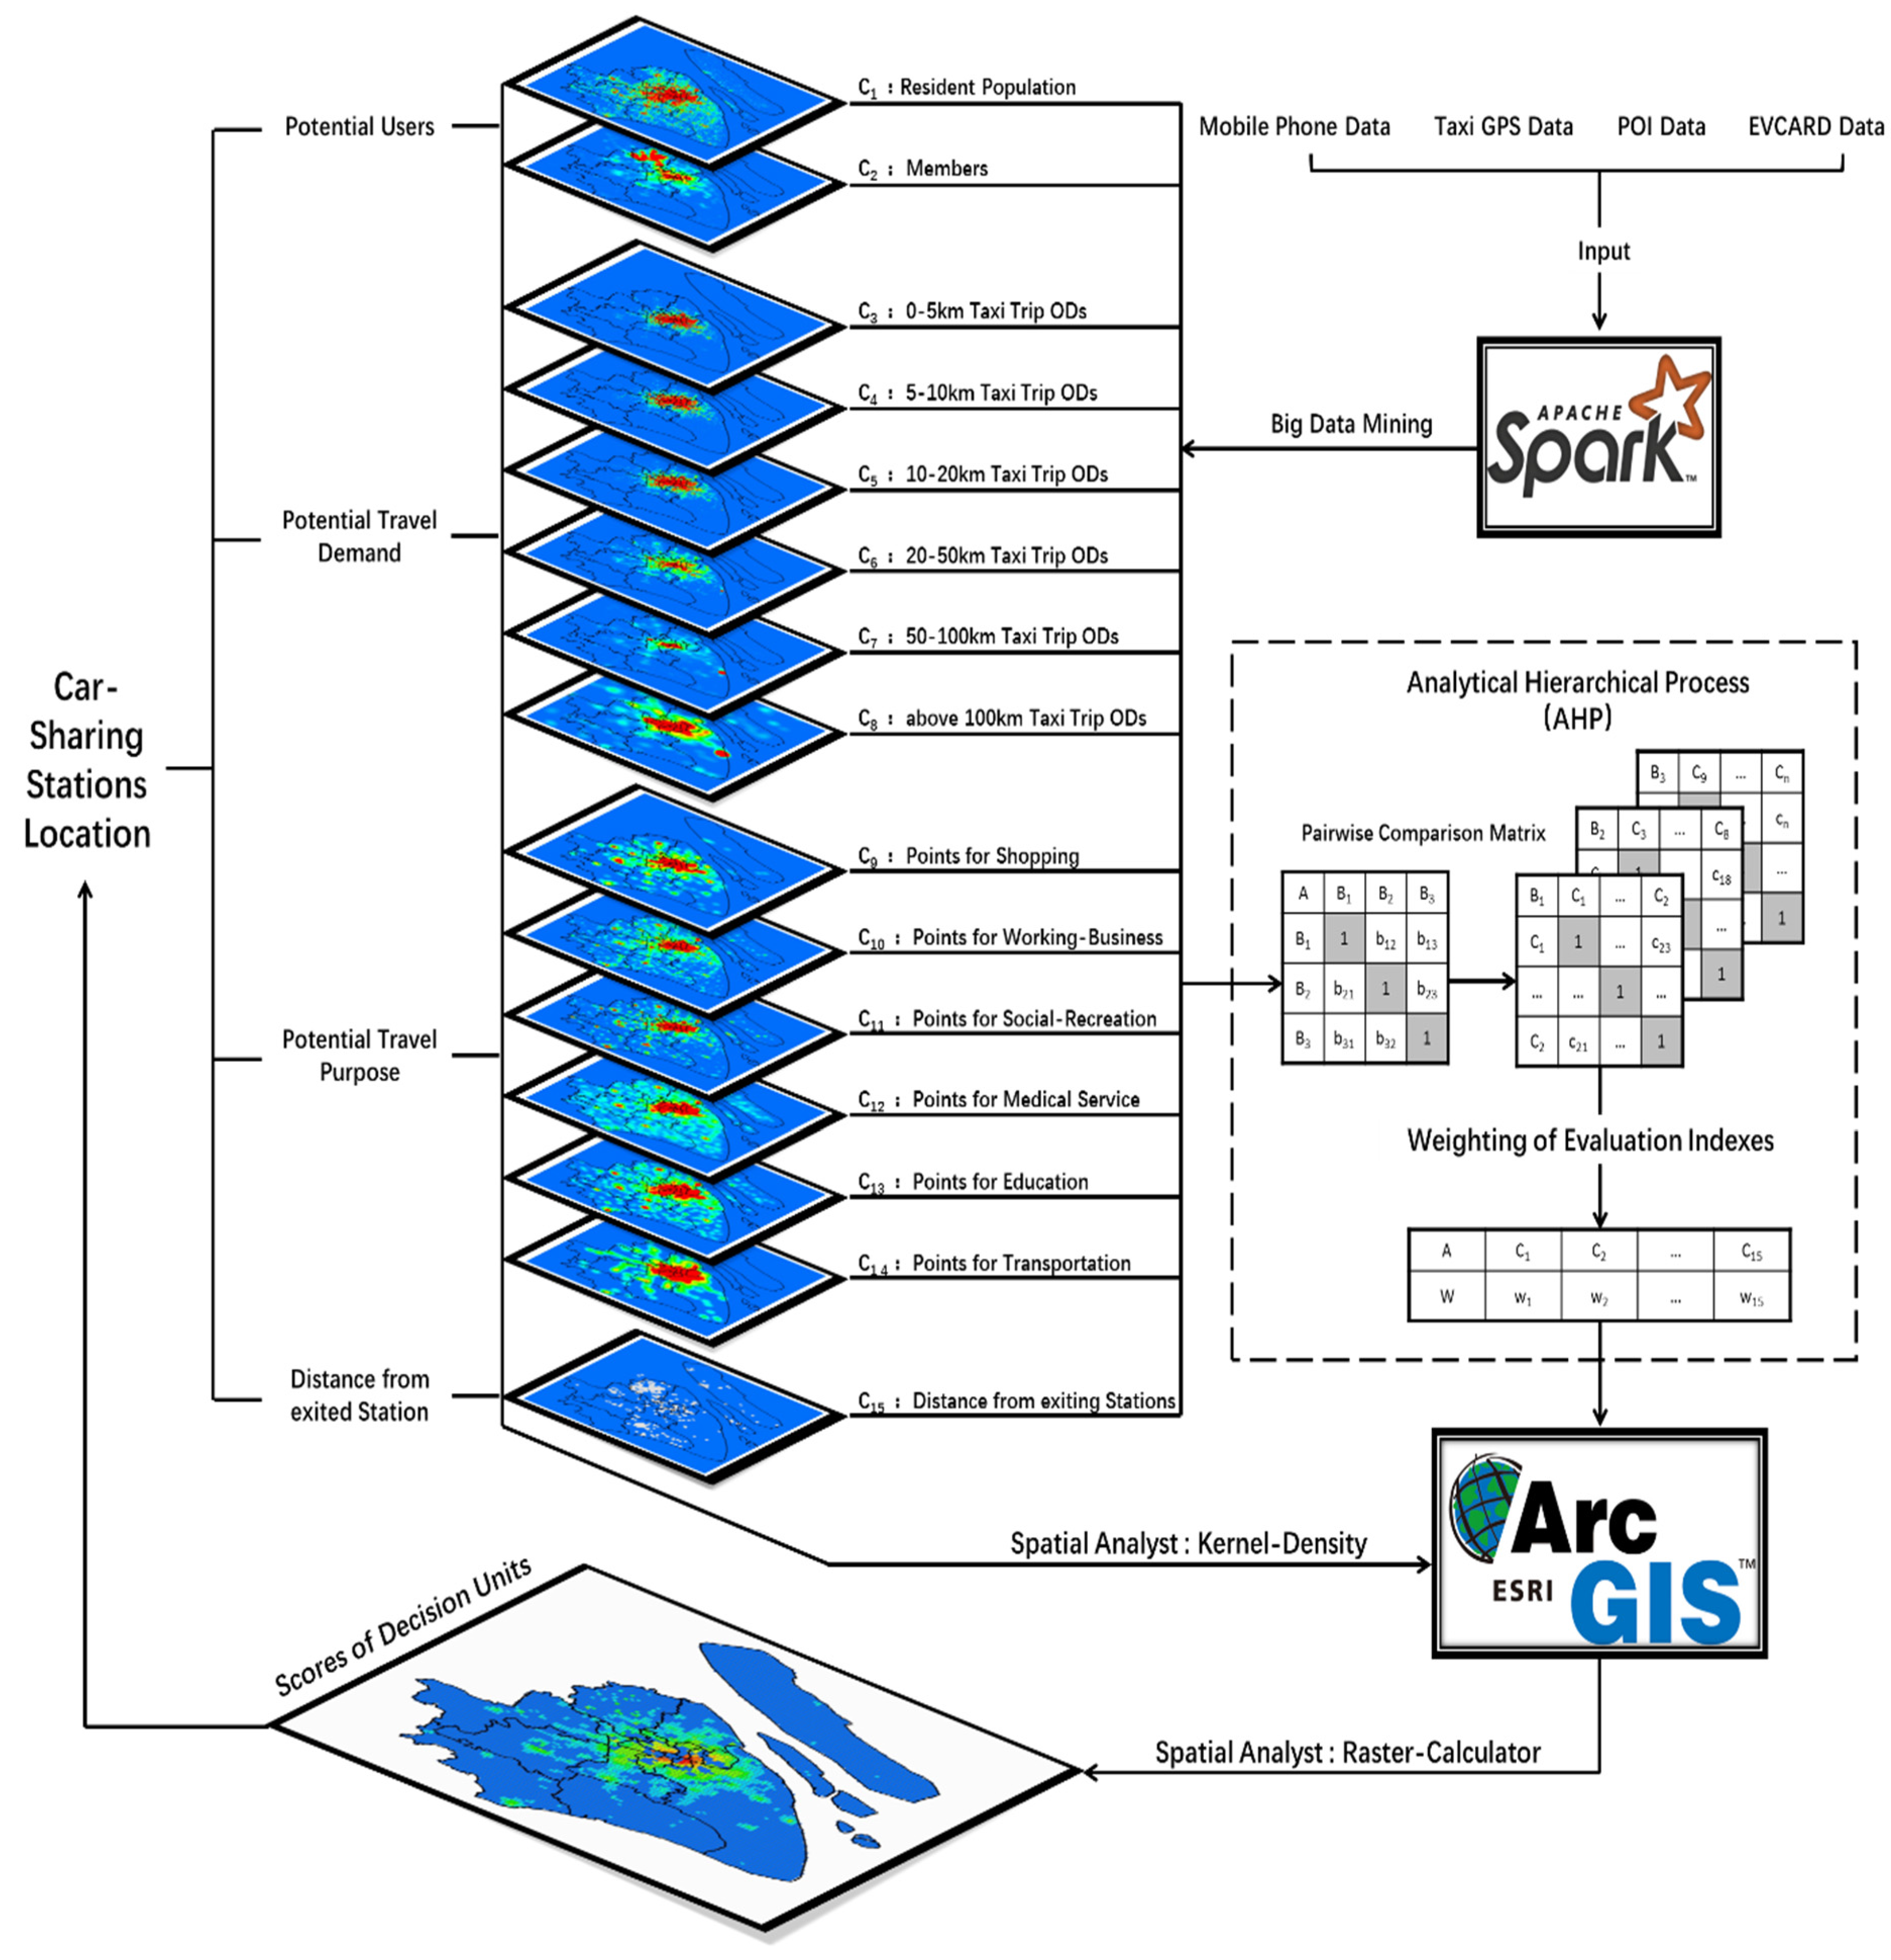
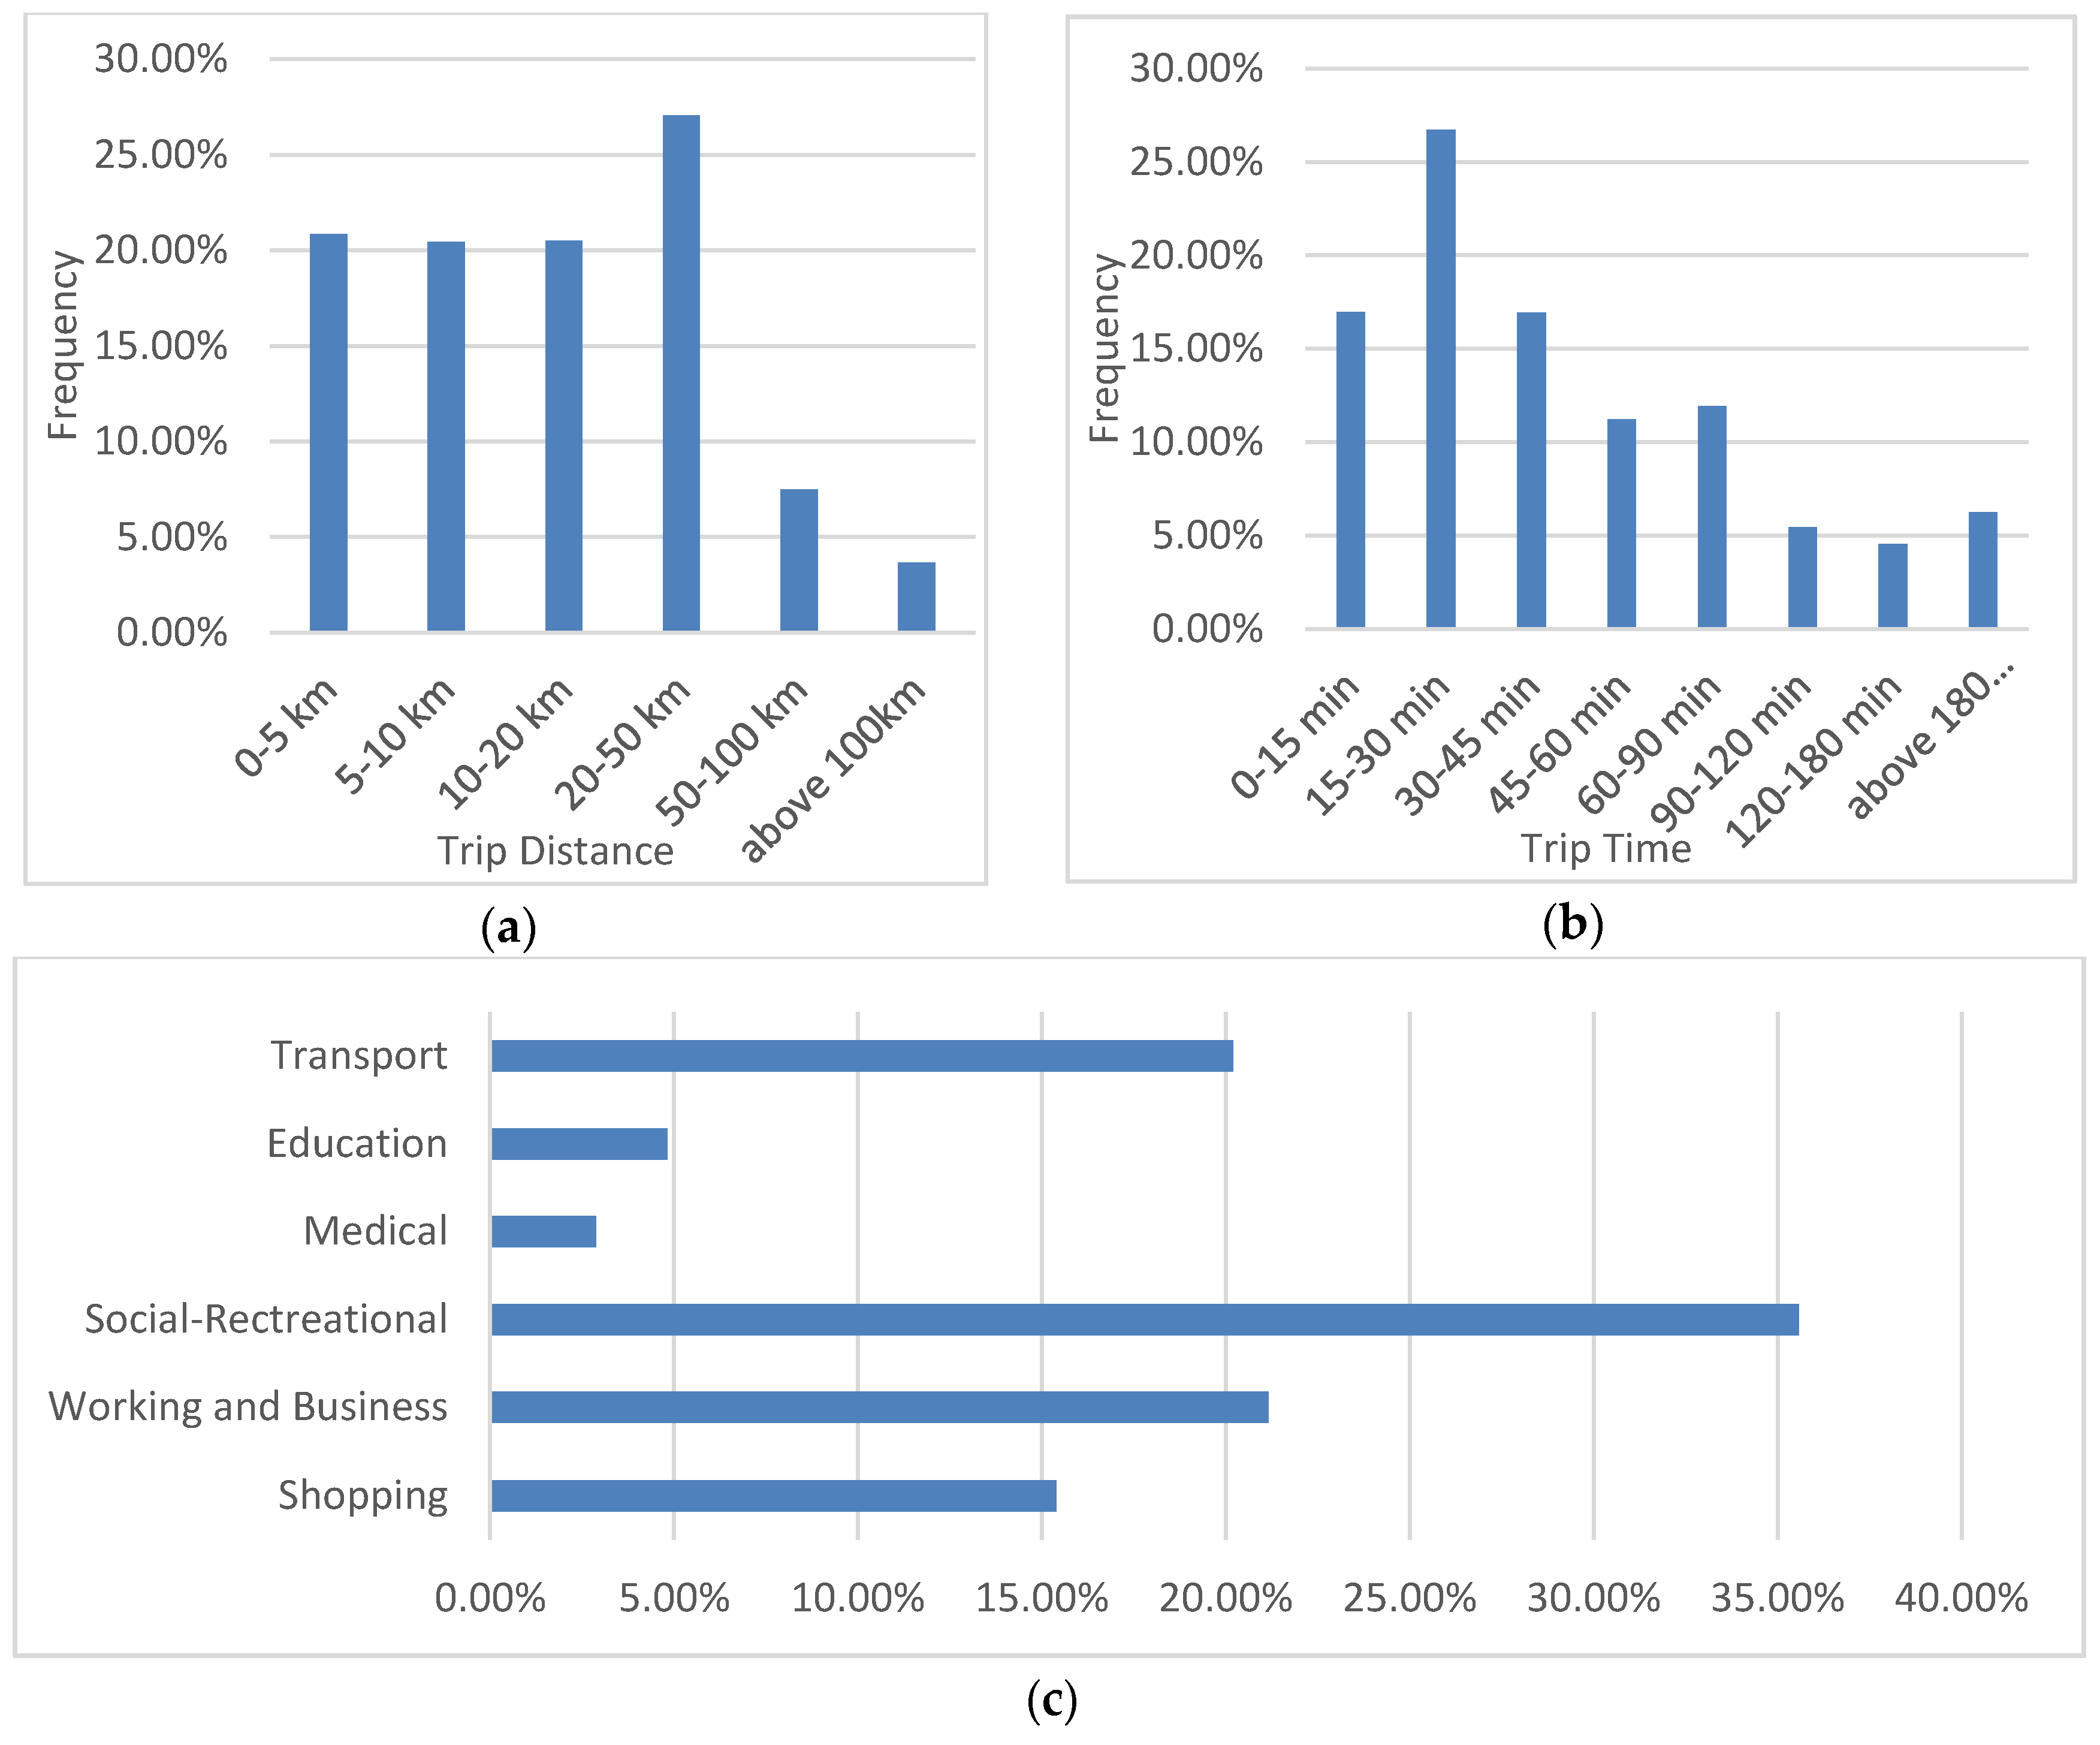
Firstly, this research selects potential users, potential travel demand, potential travel purposes and distances from existing stations as the decision criteria, and establishes a decision system with 15 evaluation indicators including the densities of resident population, members, travel ODs corresponding to different distances, and different categories of POIs. Second, data mining and preprocessing of mobile phone data, taxi GPS data, POI data, and EVCARD data are adopted to calculate effective values of the 15 indicators. Then, the AHP method is used to determine the weights of these indicators. The density of members turned out to be the most important indicator determining the location of the station. Additionally, the range of 20–50 km is the most frequently used distance in carsharing. In addition, the points for social recreation have a higher impact on carsharing than other POIs, while the points for medical purposes have the least attraction, since people tend not to choose carsharing in emergencies. Finally, the indicator values and synthetic score of every 1 km × 1 km decision unit are calculated using the spatial analysis based on ArcGIS. The results show that future stations should be set up in central areas of the city where there are more potential users and more potential travel demand with mixed purposes.
By integrating the methods of big data mining, multi-criteria evaluation, and spatial analysis, this research overcomes three obstacles of traditional location models, namely, that it is hard to obtain an optimal solution, select candidate sites and apply results in practice. This paper provides a more scientific, effective, and feasible way for carsharing operators to site stations, avoiding aimless and random decisions.
However, this research also has a few limitations. Due to the lack of land use data, the availability and cost of land to implement the station are not included in the decision system, which can be crucial aspects when deciding the locations. Additionally, travel demand of taxis may not perfectly represent the potential travel demand of carsharing, though they have many similar characteristics. With more data collected, other appropriate evaluation indicators can be added in the future. Furthermore, the number of shared cars deployed in each station should be discussed in future studies.

Acknowledgments

This study is supported by the major research plan of the National Natural Science Foundation of China called Big Data Driven Paradigm Shift of Management and Decision on Sharing Transport (91546115) and the project of Science and Technology Commission of Shanghai Municipality (15DZ1203805).

Author Contributions

Ye Li proposed the research direction of this manuscript. Wenxiang Li analyzed the data, established the model, and wrote the main part of the manuscript. Jing Fan collected and preprocessed part of the data. Haopeng Deng contributed the analysis tools.

Conflicts of Interest

The authors declare no conflict of interest.

Notation

Aobjective: optimal location of carsharing station
B1criteria: potential users
B2criteria: potential travel demand
B3criteria: potential travel purposes
biproduct of every element in row Bi in pairwise comparison matrix
C1indicator: density of the resident population
C2indicator: density of members
C3indicator: densities of taxi trip ODs of 0–5 km
C4indicator: densities of taxi trip ODs of 5–10 km
C5indicator: densities of taxi trip ODs of 10–20 km
C6indicator: densities of taxi trip ODs of 20–50 km
C7indicator: densities of taxi trip ODs of 50–100 km
C8indicator: densities of taxi trip ODs above 100 km
C9indicator: densities of points for shopping
C10indicator: densities of points for business and work
C11indicator: densities of points for social recreation
C12indicator: densities of points for medical service
C13indicator: densities of points for education
C14indicator: densities of points for transportation
C15indicator: distance from existing stations (dummy variable)
ciproduct of every element in row Ci in pairwise comparison matrix
wbisingle weight of criteria Bi
wcisingle weight of indicator Ci
witotal weight of Ci
Ssynthetical score of decision unit

References

  1. Martin, E.; Shaheen, S.; Lidicker, J. Impact of Carsharing on Household Vehicle Holdings: Results from North American Shared-Use Vehicle Survey. Transp. Res. Record. 2010, 2143, 150–158. [Google Scholar] [CrossRef]
  2. Shaheen, S.A.; Cohen, A.P. Carsharing and Personal Vehicle Services: Worldwide Market Developments and Emerging Trends. Int. J. Sustain. Transp. 2013, 7, 5–34. [Google Scholar] [CrossRef]
  3. Klincevicius, M.G.Y.; Morency, C.; Trepanier, M. Assessing Impact of Carsharing on Household Car Ownership in Montreal, Quebec, Canada. Transp. Res. Record. 2014, 2416, 48–55. [Google Scholar] [CrossRef]
  4. Frost Sullivan. Strategic Insight of the Global Carsharing Market. Report #ND90-01-00-00-00. 2014. Available online: http://www.frost.com/sublib/display-report.do?id=ND90-01-00-00-00 (accessed on 19 January 2017).
  5. Qu, M.; Yu, S.; Yu, M. An improved approach to evaluate car sharing options. Ecol. Indic. 2017, 72, 686–702. [Google Scholar] [CrossRef]
  6. Alfian, G.; Rhee, J.; Kang, Y.; Yoon, B. Performance Comparison of Reservation Based and Instant Access One-Way Car Sharing Service through Discrete Event Simulation. Sustainability 2015, 7, 12465–12489. [Google Scholar] [CrossRef]
  7. Boyacı, B.; Zografos, K.G.; Geroliminis, N. An optimization framework for the development of efficient one-way car-sharing systems. Eur. J. Oper. Res. 2015, 240, 718–733. [Google Scholar] [CrossRef] [Green Version]
  8. Zhu, X.; Li, J.; Liu, Z.; Yang, F. Optimization approach to depot location in car sharing systems with big data. In Proceedings of the 2015 IEEE International Congress on Big Data, Santa Clara, CA, USA, 29 October–1 November 2015.
  9. Ciari, F.; Weis, C.; Balac, M. Evaluating the influence of carsharing stations’ location on potential membership: A Swiss case study. Eur. J. Transp. Logist. 2016, 5, 345–369. [Google Scholar] [CrossRef]
  10. Pohekar, S.D.; Ramachandran, M. Application of multi-criteria decision making to sustainable energy planning—A review. Renew. Sustain. Energy Rev. 2004, 8, 365–381. [Google Scholar] [CrossRef]
  11. Awasthi, A.; Chauhan, S.S.; Omrani, H. Application of fuzzy TOPSIS in evaluating sustainable transportation systems. Expert Syst. Appl. 2011, 38, 12270–12280. [Google Scholar] [CrossRef]
  12. Javid, R.; Nejat, A.; Hayhoe, K. Selection of CO2 mitigation strategies for road transportation in the United States using a multi-criteria approach. Renew. Sustain. Energy Rev. 2014, 38, 960–972. [Google Scholar] [CrossRef]
  13. Awasthi, A.; Breuil, D.; Chauhan, S.S.; Parent, M.; Reveillere, T. A Multi-criteria Decision Making Approach for Carsharing Stations Selection. J. Decis. Syst. 2007, 16, 57–78. [Google Scholar] [CrossRef]
  14. Awasthi, A.; Chauhan, S.S.; Hurteau, X.; Breuil, D. An analytical hierarchical process-based decision-making approach for selecting car-sharing stations in medium size agglomerations. Inter. J. Inf. Decis. Sci. 2008, 1, 66–97. [Google Scholar] [CrossRef]
  15. Celsor, C.; Millard-Ball, A. Where Does Carsharing Work?: Using Geographic Information Systems to Assess Market Potential. Transp. Res. Record. 1992, 1992, 61–69. [Google Scholar] [CrossRef]
  16. Correia, G.H.D.A.; Antunes, A.P. Optimization approach to depot location and trip selection in one-way carsharing systems. Transp. Res. Part E Logist. Transp. Rev. 2012, 48, 233–247. [Google Scholar] [CrossRef]
  17. Jorge, D.; Correia, G.; Barnhart, C. Testing the Validity of the MIP Approach for Locating Carsharing Stations in One-way Systems. Procedia Soc. Behav. Sci. 2012, 54, 138–148. [Google Scholar] [CrossRef]
  18. Kumar, V.P.; Bierlaire, M. Optimizing Locations for a Vehicle Sharing System. In Proceedings of the 12th Swiss Transport Research Conference, Ascona, Swiss, May 2012.
  19. Chandio, I.A.; Matori, A.N.B.; WanYusof, K.B.; Talpur, M.A.H.; Balogun, A.; Lawal, D.U. GIS-based analytic hierarchy process as a multi-criteria decision analysis instrument: A review. Arab. J. Geosci. 2013, 6, 3059–3066. [Google Scholar] [CrossRef]
  20. Kara, C.; Doratli, N. Application of GIS/AHP in siting sanitary landfill: A case study in Northern Cyprus. Waste Manag. Res. 2012, 30, 966–980. [Google Scholar] [CrossRef] [PubMed]
  21. Şener, S.; Şener, E.; Nas, B.; Karagüzel, R. Combining AHP with GIS for landfill site selection: A case study in the Lake Beyşehir catchment area (Konya, Turkey). Waste Manag. 2010, 30, 2037–2046. [Google Scholar] [CrossRef] [PubMed]
  22. Moeinaddini, M.; Khorasani, N.; Danehkar, A.; Darvishsefat, A.A.; Zienalyan, M. Siting MSW landfill using weighted linear combination and analytical hierarchy process (AHP) methodology in GIS environment (case study: Karaj). Waste Manag. 2010, 30, 912–920. [Google Scholar] [CrossRef] [PubMed]
  23. Wang, G.; Qin, L.; Li, G.; Chen, L. Landfill site selection using spatial information technologies and AHP: A case study in Beijing, China. J. Environ. Manag. 2009, 90, 2414–2421. [Google Scholar] [CrossRef] [PubMed]
  24. Chang, N.; Parvathinathan, G.; Breeden, J.B. Combining GIS with fuzzy multi-criteria decision-making for landfill siting in a fast-growing urban region. J. Environ. Manag. 2008, 87, 139–153. [Google Scholar] [CrossRef] [PubMed]
  25. Uyan, M. GIS-based solar farms site selection using analytic hierarchy process (AHP) in Karapinar region, Konya/Turkey. Renew. Sustain. Energy Rev. 2013, 28, 11–17. [Google Scholar] [CrossRef]
  26. Tavares, G.; Zsigraiová, Z.; Semiao, V. Multi-criteria GIS-based siting of an incineration plant for municipal solid waste. Waste Manag. 2011, 31, 1960–1972. [Google Scholar] [CrossRef] [PubMed]
  27. Brunner, I.; Kim, K.; Yamashita, E. Analytic Hierarchy Process and Geographic Information Systems to Identify Optimal Transit Alignments. Transp. Res. Record. 2011, 2215, 59–66. [Google Scholar] [CrossRef]
  28. Mohd Safian, E.E.; Nawawi, A.H. Combining AHP with GIS in the Evaluation of Locational Characteristics Quality for Purpose-Built Offices in Malaysia. MPRA Paper. 2012. Available oneline: https://mpra.ub.uni-muenchen.de/39546/ (accessed on 19 January 2017).
  29. Cervero, R.; Golub, A.; Nee, B. San Francisco City CarShare: Longer-Term Travel-Demand and Car Ownership Impacts; Working Paper 2006-07; Institute of Urban and Regional Development, University of California: Berkeley, CA, USA, 2006. [Google Scholar]
  30. Costain, C.; Ardron, C.; Habib, K.N. Synopsis of users’ behaviour of a carsharing program: A case study in Toronto. Transp. Res. Part A Policy Pract. 2012, 46, 421–434. [Google Scholar] [CrossRef]
  31. Chen, C.; Bian, L.; Ma, J. From traces to trajectories: How well can we guess activity locations from mobile phone traces? Transp. Res. Part C Emerg. Technol. 2014, 46, 326–337. [Google Scholar] [CrossRef]
  32. Saaty, T.L. How to make a decision: The analytic hierarchy process. Eur. J. Oper. Res. 1990, 48, 9–26. [Google Scholar] [CrossRef]
Figure 1. Development of the EVCARD. (a) Growth trends of demand and supply of the EVCARD; and (b) spatial distribution of stations and members in Shanghai.
Sustainability 09 00152 g001aSustainability 09 00152 g001b
Figure 2. Flowchart of the siting decision for carsharing.
Sustainability 09 00152 g002
Figure 3. EVCARD data presentation. (a) Trip distance distribution of EVCARD; (b) trip time distribution of EVCARD; and (c) trip purpose distribution of EVCARD.3.3. Weighting of Evaluation Indicators Based on AHP.
Sustainability 09 00152 g003
Figure 4. Heat maps of all indicators.
Sustainability 09 00152 g004
Figure 5. Synthetic scores of decision units for carsharing.
Sustainability 09 00152 g005
Figure 6. Proposed stations for 17 districts of Shanghai.
Sustainability 09 00152 g006
Table 1. Format of effective dataset of mobile phones.
MSIDTIMESTAMPLONLATAREAN
00041D68BD8A156454F95EF9A39F45DC2015/4/13 0:22:12121.4791431.22088HuangPu1
00041D68BD8A156454F95EF9A39F45DC2015/4/13 2:22:33121.4819231.22311HuangPu2
00041D68BD8A156454F95EF9A39F45DC2015/4/13 4:22:34121.4819231.22311HuangPu3
00041D68BD8A156454F95EF9A39F45DC2015/4/13 22:43:32121.4791431.22088HuangPu18
0011F8CD5820D4152CAF37FE239687BF2015/4/13 0:42:17121.5231731.27719YangPu1
0011F8CD5820D4152CAF37FE239687BF2015/4/13 1:05:57121.5231731.27719YangPu2
0011F8CD5820D4152CAF37FE239687BF2015/4/13 2:05:24121.5231731.27719YangPu3
0011F8CD5820D4152CAF37FE239687BF2015/4/13 23:42:45121.5226131.27640YangPu62
Note. MSID is the mobile identification number of the user, TIMESTAMP is the time when the data record was collected, LON and LAT are the longitude and latitude of the user location, respectively, AREA is the district where the mobile phone user is located, and N is the serial number of the user’s data.
Table 2. Format of effective dataset of taxi trips.
CARIDOTIMEDTIMEOLONOLATDLONDLATDISTIME
128742015/4/17 13:34:352015/4/17 13:50:34121.424831.20402121.453731.214584451.77909
137192015/4/17 23:29:022015/4/17 23:38:36121.472531.27244121.502331.284354375.57581
220542015/4/17 14:21:192015/4/17 14:37:23121.518131.2312121.502531.235083440.5969
Note. CarID is the identification number of the taxi; OTIME and DTIME are the pick-up and drop-off times of one trip, respectively; OLON and OLAT are the longitude and latitude of the trip origin, respectively; DLON and DLAT are the longitude and latitude of the trip destination, respectively; DIS is the trip distance (in meter); and TIME is the trip duration (in minutes).
Table 3. Pairwise comparison values for AHP.
Relative ImportanceDefinition
1Equal importance
3Moderate importance
5Strong importance
7Very strong importance
9Extreme importance
2, 4, 6, 8Intermediate values between the two adjacent judgments
Table 4. Pairwise comparison matrices for all indicators.
CR = 0CR = 0.02588 CR = 0.0351
AB1B2B3B2C3C4C5C6C7C8B3C9C10C11C12C13C14
B1111C31111/357C911/21/4751/2
B2111C41111/357C10211/3751
B3111C51111/357C11431973
CR = 0B1C1C2C6333179C121/71/71/911/21/7
C111/3C71/51/51/51/713C131/51/51/7211/5
C231C81/71/71/71/91/31C14211/3751
Table 5. Weights of all indicators.
Objective LayerCriterion LayerSingle WeightIndicator LayerSingle WeightTotal Weight
AB10.3333C10.25000.0833
C20.75000.2500
B20.3333C30.17300.0577
C40.17300.0577
C50.17300.0577
C60.40850.1362
C70.04640.0155
C80.02610.0087
B30.333C90.13210.0440
C100.18940.0631
C110.42070.1402
C120.02690.0090
C130.04140.0138
C140.18940.0631
Table 6. Scores of decision units.
DistrictUIDScore
HuangPu422540.4039
HuangPu429739.9945
HuangPu429832.7188
HuangPu414932.3255
HuangPu422631.8065
.........
XuHui392025.1277
XuHui399722.1677
XuHui392122.1171
XuHui399621.8324
XuHui399520.6642
.........
Note. UID is the identity number of the decision unit in GIS, by which the location can be determined.

