Abstract
Grazing and cultivation are two important management practices worldwide that can cause significant soil organic carbon (SOC) losses. However, it remains elusive how soil microbes have responded to soil carbon changes under these two practices. Based on a four-decade long field experiment, this study investigated the effects of grazing and cultivation on SOC stocks and microbial properties in the semi-arid grasslands of China. We hypothesize that grazing and cultivation would deplete SOC and depress microbial activities under both practices. However, our hypotheses were only partially supported. As compared with the adjacent indigenous grasslands, SOC and microbial biomass carbon (MBC) were decreased by 20% or more under grazing and cultivation, which is consistent with the reduction of fungi abundance by 40% and 71%, respectively. The abundance of bacteria and actinomycetes was decreased under grazing but increased under cultivation, which likely enhanced microbial diversity in cultivation. Invertase activity decreased under the two treatments, while urease activity increased under grazing. These results suggest that nitrogen fertilizer input during cultivation may preferentially favor bacterial growth, in spite of SOC loss, due to rapid decomposition, while overgrazing may deteriorate the nitrogen supply to belowground microbes, thus stimulating the microbial production of nitrogen acquisition enzymes. This decade-long study demonstrated differential soil microbial responses under grazing and cultivation and has important applications for better management practices in the grassland ecosystem.
1. Introduction
Grassland covers approximately 20% of the earth’s land surface area [1] and contains 12% of global soil organic carbon (SOC) [2]. This implies that modest changes in C storage in grassland ecosystems have the potential to modify the global C cycle. In China, grasslands account for 40% of the national land surface area and ~30% of total SOC [3]. About 313 million ha (~78%) of the grasslands are located in the northern arid or semi-arid temperate zone. However, this region was subject to an increasing demand for natural resources and animal products due to a human population increase, which has resulted in a 34% overload in livestock carrying capacity, and approximately 5% of the total area of the existing grassland has been cultivated for cropland [4,5]. Due to the tremendous pressures exerted on this fragile ecosystem, both livestock grazing and agricultural cultivation have become two primary human activities that affect the SOC storage in this region. It is imperative to monitor SOC change and develop appropriate management and conservation polices in order to improve soil productivity and ecosystem sustainability.
Grazing may have a strong effect on grassland ecosystems, majorly through the following three aspects; vegetation removal, livestock trampling, and external nutrition amendment [6]. Vegetation removal by livestock changes the quantity and quality of plant carbon input to soil and changes the relative allocation of C between above- and below-ground biomass [7]. Livestock trampling compacted soil and hence increased soil bulk density and decreased soil porosity and hydraulic conductivity [8]. External nutrition amendment in the form of urine and dung from herbivores changed the quality of the soil substrate and altered the availability of nitrogen nutrients [9]. These complicated grazing-induced modifications on the plant community and soil properties may trigger considerable changes in SOC storage. For instance, SOC varied from a decrease of 58% to an increase of 170% in different grasslands under moderate grazing pressure [10]. While such gains and losses have been well documented, fewer studies have investigated how these SOC stock changes, induced by grazing, can affect soil microbial communities in the semi-arid steppe of China.
Cultivation is another one of the most important human activities affecting the grassland ecosystem, besides grazing. A conversion from native perennial herb grasslands to annual croplands will significantly reduce C input, owing to the decrease of litter and the removal of the aboveground part of crops after harvest [11]. In addition, cultivation practices like tillage, ploughing, and harrowing will accelerate the SOC mineralization due to the strong destroy of soil aggregate structure, as well as the modified soil temperature and soil water content [12]. In addition, considerable losses of essential soil nutrients under cultivation-induced water runoff and wind erosion are another effect of cultivation that relies on grassland ecosystems [13]. Thus, the cultivation of grassland soil leads to the depletion of SOC and affects related soil properties such as soil microbial properties. So far, the literature about the impact of cultivation on SOC and soil microbial community properties was less available in the semi-arid steppe of China.
Soil microbial communities play a critical role in regulating ecosystem function and soil biogeochemistry. Changes in microbial community composition and function may alter the rate of SOC turnover and decomposition, soil nutrient transformation, and cycling, and consequently affect soil productivity and the sustainability of ecosystems. Therefore, there is a need to explore the effects of grazing and cultivation on soil microbial communities’ characteristics to elucidate the underlying microbial mechanisms of SOC changes under the two management practices. The objectives of this study were to investigate the effects of grazing and cultivation on (1) SOC contents and SOC stocks changes, and (2) soil microbial communities’ characteristics (biomass, composition, and function). We hypothesize that, as compared with the control grassland, grazing and cultivation would deplete SOC and depress microbial activities. This study is expected to elucidate the underlying microbial mechanisms of soil carbon changes under intensive management practices and help identify recommended practices in intensive managed grassland ecosystems in the world.
2. Materials and Methods
2.1. The Study Area
The study site was located in the Inner Mongolia Grassland Ecosystem Research Station (IMGERS; Chinese Academy of Sciences) in the Xilin River Basin, Inner Mongolia, China. The Xilin River Basin is the major base of livestock husbandry in China. There was practically no human activity in this region before the 1950s, and the first extensive cultivation started in 1953 [14]. Meanwhile, the grazing intensity was at a very low level until the grasslands were thrown open to private use in 1978. In past decades, the grassland in this region was exposed to over-grazing and irrational reclamation, which has resulted in pasture degradation and desertification, with the area even becoming an important sand source for the sandstorm of Beijing. In this study, four vegetation sites, an enclosed Leymus chinensis and its neighborhood free-grazing field, a Stipa baicalensis steppe, and a spring wheat field, were selected. The habitat characteristics of the four sampling sites are listed in Table 1.

Table 1.
The site characteristics in the semi-arid steppe in Inner Mongolia, China.
2.2. Plot Description and Soil Sampling
The L. chinensis steppe lies in the middle of the Xilin River, used for raising sheep and goats. The constructive species of the steppe is L. chinensis and the dominant species are Stipa grandis and Cleistogenes squarrosa. The steppe has 86 species of flowering plant, with coverage of about 40%–50% and a height of 40–50 cm in July and August. Meanwhile, it has a 20–30 cm organic soil layer with a texture comprised of 60% sand, 21% clay, and 19% silt. The ungrazing treatment plot, with an area of 24 ha, was fenced and excluded from grazing in 1979. The grazing treatment plot was about 200 m outside of the fenced plot. The grazing pressure was at 2–3.7 sheep·ha−1, according to the native herders, which was regarded as moderate grazing intensity, although the stocking rate given by the local government was 1 sheep·ha−1. The ungrazing plot and the grazing plot were formerly floristically and topographically similar.
The S. baicalensis steppe lies in the upper Xilin River. It is utlilized as a mowing pasture and the frequency of mowing is once a year, always in mid- or late August. The indicator of the steppe is S. baicalensis; the density of plant is 29–39 species·m−2, with coverage of about 50%–90% and a 50 cm humus layer. The cultivation treatment plot of the spring wheat field was adjacent to the S. baicalensis grassland treatment area and had been established as part of the S. baicalensis steppe in 1972. It has similar topography, precipitation, and temperature conditions to the S. baicalensis steppe. The tillage system was spring wheat-fallow rotation, and spring wheat is usually sown in early April and harvested in late August. A fertilizer with 150 kg·ha−1 diammonium phosphate, and 60 kg·ha−1 special fertilizer for wheat containing 18% N, 16% P2O5, and 6% K2O, and 37.5 kg·ha−1 urea was applied as the base fertilizer before sowing in each cropping year, and there was no irrigation applied during the period of the study.
Before the growing season in 2010, three random plots (100 m × 100 m) within each (240,000 m2) of the 4 sampling sites were selected to serve as replicates. The plots were at least 50 m apart from each other and from the edge of the sampling sites to avoid edge effects. We established 1 quadrat with 1 m × 1 m at each sampling plot and investigated aboveground and belowground plant biomass. The aboveground plant biomass was clipped at ground level by hand with all of the plant species in a quadrat combined. The belowground biomass from 0–20 cm was measured by soil auger (9.7 cm in diameter), with 9 auger cores in each quadrat for one composite sample. The plant biomass was measured 7 times during the growing season; once in May, June, and September, and twice in July and August.
The soil samples were collected during the growing season (from May to September) of 2010 from the four sites, with a sampling frequency of four times and about 50 days for one sampling. Within each quadrat, three soil cores (5 cm in diameter), comprising one complete sample, were randomly collected at depths of 0–10 or 10–20 cm in an S-shaped pattern; from the same layer of each plot, a total of nine samples were collected for three composite samples, which were designated as duplicates, considering that the sampling size was large (240,000 m2) and the heterogenetic nature of soil characteristics. After removing the plant roots and large stones by sieving (2 mm), all the composite samples were stored in an icebox and transferred to the laboratory. Each composite sample was then divided into three subsamples. One of them was stored at 4 °C prior to the analysis for microbial community carbon sources utilization, microbial biomass, plate counts of culturable microorganisms, and activities of urease and invertase; another one was air-dried and ground prior to the determination of SOC, total N (TN), and soil pH; and the last one was stored at −20 °C for mineral N concentration analysis and the soil water content determination. Results are presented in the per unit weight of oven-dry soil (105 °C).
2.3. Soil Microbial Biomass Carbon
Microbial biomass carbon (MBC) was determined by the chloroform fumigation extraction method [15]. A 25-g fresh soil sample was fumigated with ethanol-free CHCl3 for 24 h at 25 °C. Then the fumigated and non-fumigated soil samples were extracted by shaking with 100 ml of 0.5 M K2SO4 for 30 min, and the extracts was vacuum filtered through a 0.45 μm polycarbonate filter membrane. The amount of total organic C in the extracts was measured using an automatic total organic carbon analyzer (Elementar High TOCII, Germany). MBC was calculated from the differences between the amount of organic C extracted from fumigated and non-fumigated samples, using a conversion factor (KEC) of 0.45.
2.4. Soil Microbial Community Carbon Sources Utilization Pattern
Soil microbial community carbon source utilization was constructed using Biolog EcoPlates (Biolog Inc., Hayward, CA, USA). Briefly, 10 g soil was suspended in 100 mL 0.145 M NaCl, and then the soil suspension was shaken at 200 rpm for 20 min on a reciprocal shaker. After setting for 30 min, the soil suspensions were diluted to 10−3, and a 150 μL aliquot of the soil solution was dispensed into each well of the Biolog EcoPlate using an 8-Channel Repeating Pipette. The plates were then incubated at 25 °C in the dark for 10 days. The color development was measured as absorbance at 590 nm every 24 h using the Microlog Rel 4.20 software (Biolog Inc., Hayward, CA, USA). Microbial community carbon utilization activity was expressed as average well-color development (AWCD), calculated using the 96 h incubated data as follows [16]:
where xi is the optical density value measured at 590 nm in substrate i in the Ecoplates, c is the value measured in the control well, and 31 is the number of carbon sources.
The functional diversity as measured by the Shannon index (H), defining the species richness, was calculated as follows [17]:
where pi is the ratio of the corrected absorbance value of each well to the sum of the absorbance value of all wells and n is the total number of carbon sources.
2.5. Plate Counts of Culturable Microorganisms and Enzyme Analysis
The total number of cultivable bacteria, fungi, and actinomyces were determined as colony forming units (CFUs) on agar plates by dilution plate methods. The mediums used for the number of bacteria, fungi, and actinomyces were beef extract peptone medium, Czapek’s medium, and Gause’s No. 1 synthetic medium, respectively. The invertase activity and urease activity were assayed as described by Guan et al. [18].
2.6. Soil Properties Analysis
Soil pH was measured by glass electrode using a soil to water ratio of 1:2.5. The soil samples were oven dried for 24 h at 105 °C to determine soil water content. The NO3−-N and NH4+-N content was measured by a continuous-flow ion auto-analyzer (AA3 Bran + Luebbe, Germany). The SOC and the total N contents were determined by wet oxidation with K2Cr2O7 and the Semi-micro Kjeldahl methods using air-dried soil samples [19]. Soil bulk density was determined by the core method (100 cm3 volume). The carbon stock (Mg·ha−1) in the top 20 cm was calculated by the following equation:
where BD is the soil bulk density (g·cm−3) and H is the depth of the sampling soil (m).
Cstock = SOC × BD × H × 10
The aboveground plant biomass was measured by hand clipping, and the belowground biomass was measured by wet sieving soil cores collected using a soil auger (9.7 cm diameter).
2.7. Statistical Analyses
The treatment effects on soil, microbial properties and plant biomass were tested by the paired samples t-test, and a one-way ANOVA was performed on the data from different soil depths. Multivariation analysis was used to indicate the interaction among treatments, sampling time, and soil depth. Stepwise multiple regression analysis was applied to determine the key factors affecting microbial parameters. The absorbance data in the Biolog eco analysis were normalized and principal components analysis (PCA) was undertaken to identify the principal patterns between the treatments. Statistically significant differences were judged using p < 0.05. Graphs were prepared using Origin 8.0 (OriginLab Inc., Northampton, MA, USA). All the statistical analyses were conducted using SPSS Statistics 17.0 (Spss Inc., Chicago, IL, USA).
3. Results
3.1. Effects of Grazing and Cultivation on SOC Stock and Plant Biomass
Grazing significantly (p < 0.001) decreased the SOC contents (SOC% of dry soil) at 0–10 cm and 10–20 cm and the differences of the SOC content between the two depths were significant (p < 0.001) (Table 2). The SOC contents in the grazing plot were 24% and 20% lower than those in the ungrazing plot at the two soil layers, respectively, while the SOC stocks were decreased by 4.57 Mg·ha−1 and 4.90 Mg·ha−1 at both soil depths after 30 years of grazing. Cultivation significantly (p < 0.01) decreased the SOC content by 19% at 0–10 cm and 29% at 10–20 cm, similarly the SOC stocks were reduced by 6.23 Mg·ha−1 and 7.42 Mg·ha−1 at the two soil depths after the native grassland had been cultivated for 38 years.
Table 2.
Soil organic carbon (SOC) stock and soil physiochemical properties (means ± SE, n = 3) at the grazing and cultivation plots in Inner Mongolia, China. Soil collection was conducted in 2010.
Grazing significantly decreased plant biomass, with an 83% (p < 0.001) and a 16% (p < 0.01) reduction in aboveground and belowground biomass, respectively, at a depth of 0–20 cm (Table 3). However, cultivation from grassland to spring wheat significantly (p < 0.05) increased aboveground plant biomass by 48% and significantly (p < 0.001) decreased the belowground biomass by approximately 98%.
Table 3.
Mean (±SE, n = 3) of aboveground and belowground plant biomass at the grazing and cultivation plots during the growing season in Inner Mongolia, China. Plant collection was conducted in 2010.
3.2. The Effects of Grazing and Cultivation on Soil Microbial Biomass Carbon, Colony Forming Units, and Urease and Invertase Activities
Grazing significantly decreased MBC by 24% at 0–10 cm (p < 0.05) and by 40% at 10–20 cm (p < 0.01) (Figure 1). In addition, significant differences in MBC were found between the two depths in the grazing plot (p < 0.001) and the ungrazing plot (p < 0.01). However, cultivation only significantly (p < 0.05) reduced MBC at the top soil layer of 0-10 cm, and there is no difference in MBC between the two soil depths. Stepwise regression analysis showed that, among the factors shown in Table 2, MBC was significantly correlated with SOC, soil pH at 0–10 cm, and soil water content at 10–20 cm under grazing treatment, but only correlated with SOC at 0–10 cm under cultivation treatment (Table 4).
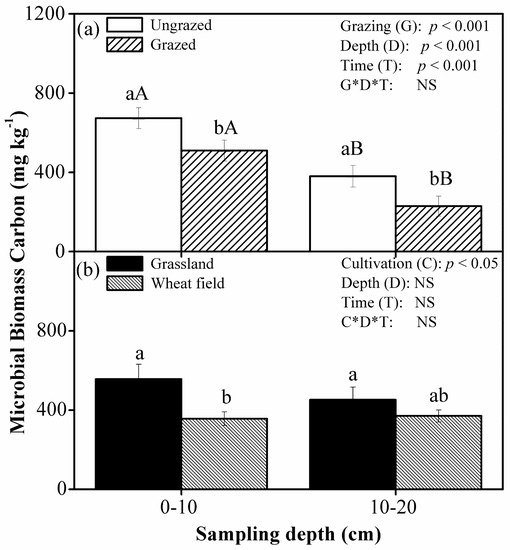
Figure 1.
Mean (±SE, n = 3) soil microbial biomass (mg·kg−1), as affected by grazing (a) and cultivation (b), at 0–10 and 10–20 cm depths in 2010 in Inner Mongolia, China. Grazing (G): grazing treatment; Cultivation (C): cultivation treatment; Depth (D): sampling depth; Time (T): sampling time; NS: not significant. Under ‘grazing’ or ‘cultivation’, different lowercase letters in the same soil depth designate significant differences between treatments, and different uppercase letters in the same treatment designate significant differences between soil depths at the level of p < 0.05.
Table 4.
Correlation coefficients by stepwise regression analysis between soil microbial properties under the effects of grazing and cultivation.
Grazing significantly decreased the numbers of colony forming units of bacteria (p < 0.001), fungi (p < 0.001), and actinomycetes (p < 0.01), while cultivation increased the number of actinomycetes (p < 0.001) and bacteria (p < 0.01) but decreased the number of fungi significantly (p < 0.05) at both soil depths (Table 5). Stepwise regression analysis showed that the numbers of bacteria, fungi, and actinomycetes were correlated mainly with water content, NO3−, NH4+, and pH under grazing treatment but with SOC, water content, and pH under cultivation treatment (Table 4).
Table 5.
Mean (±SE, n = 3) number of the soil microbial communities and significant test results at the grazing and cultivation plots in Inner Mongolia, China. Soil collection was conducted in 2010.
Grazing significantly (p < 0.01) decreased the activity of invertase at both soil depths, while it increased urease activity only at the top soil of 0–10 cm (p < 0.01) (Figure 2). Cultivation significantly (p < 0.001) decreased invertase activity at the two depths but decreased urease activity only at the topsoil of 0–10 cm. Stepwise regression analysis showed that the activities of urease and invertase were correlated mainly with SOC, pH, water content, NO3−, and NH4+ under grazing treatment but with SOC, pH, and NO3− under cultivation treatment (Table 4).
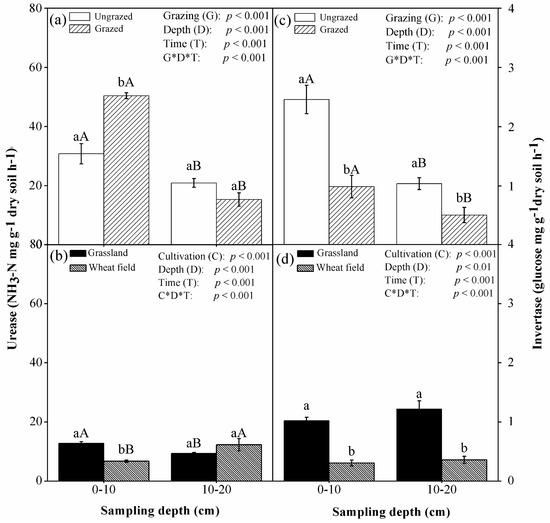
Figure 2.
Mean (±SE, n = 3) activities of soil urease (NH3-N mg·g−1 dry soil·h−1) and invertase (glucose mg·g−1 dry soil·h−1), as affected by grazing (a,c) and cultivation (b,d), at 0–10 and 10–20 cm depths in 2010 in Inner Mongolia, China. Grazing (G): grazing treatment; Cultivation (C): cultivation treatment; Depth (D): sampling depth; Time (T): sampling time. Under ‘grazing’ or ‘cultivation’, different lowercase letters in the same soil depth designate significant differences between treatments, and different uppercase letters in the same treatment designate significant differences between soil depths at the level of p < 0.05.
3.3. The Effects of Grazing and Cultivation on Soil Microbial Community Functional Diversity
Grazing significantly decreased 74% of AWCD (p < 0.01) and 27% of the Shannon index (H) (p < 0.05), while cultivation significantly increased them to the extent of 55% and 14% (p < 0.05) (Table 6). Stepwise regression analysis showed that NH4+-N concentration was the key variable that was significantly correlated with AWCD and H under grazing treatment, while NO3−-N concentration and pH have a combined effect on AWCD and H under cultivation treatment (Table 4).
Table 6.
Mean (±SE, n = 3) carbon substrate utilization and diversity index of the soil microbial community in grazing and cultivation plots in Inner Mongolia, China. Soil collection was conducted in 2010.
Principal coordinate analysis indicated that the first and second principal components (PC1 and PC2) accounted for 46.6% and 19.7% of the total variance in microbial carbon source utilization under grazing treatment, respectively, as well as 52.5% and 20.7% under cultivation treatment (Figure 3). Under grazing treatment, the substrate utilization patterns of the grazing plot were significantly separated from the ungrazing plot along the PC1 axis, but no differences were found along the PC2 axis. Under cultivation treatment, the same pattern was found, i.e. the substrate utilization patterns were not well separated along the PC2 axis though a significant difference existed along the PC1 axis.
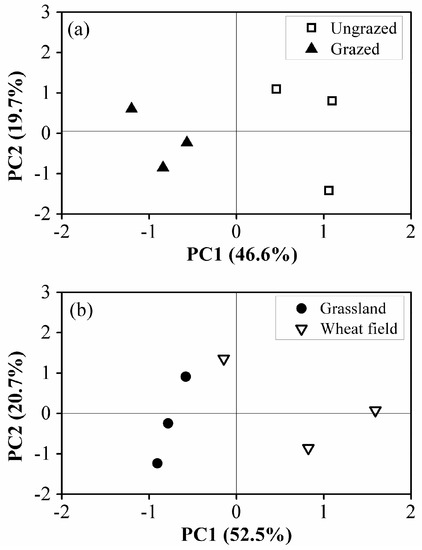
Figure 3.
Principal coordinate analysis of soil microbial communities’ carbon source utilization patterns after 30 years of grazing (a) and 38 years of cultivation (b).
4. Discussion
Our results showed that grazing and cultivation significantly affected SOC stock and soil microbial community composition and function. SOC stocks and MBC at depths of 0–10 cm and 10–20 cm were significantly decreased under grazing and cultivation. In addition, grazing decreased AWCD; the Shannon index; the number of colony forming units of bacteria, fungi, and actinomycetes; and the activity of invertase. The carbon utilization pattern demonstrated significant differences between the ungrazing and grazing treatments. However, cultivation increased soil microbial community functional diversity and the number of fungi.
4.1. Effects of Grazing and Cultivation on SOC Stock
SOC stocks were reduced by 17.62% and 23.37% after 30 years of grazing and by 22.93% and 23.60% after 38 years of cultivation in both soil depths, respectively. This agrees with the results of He et al. [20] in Inner Mongolian grassland and other studies in grassland ecosystems [12,21,22]. The decreased input of organic matter from aboveground biomass and roots were proposed to contribute mainly to the losses of SOC stocks [23]. In this study, livestock grazing decreased aboveground and belowground plant biomass concurrently, especially significantly removing the aboveground plant biomass to an extent of 83%, which may be responsible for the decrease of SOC stock to a great degree. Aboveground biomass in cropland was significantly increased; however, almost all of the straw and grain were removed out of field after harvesting, leading to a great loss of plant litter return to soil compared with the native grassland. The belowground biomass of the spring wheat field decreased by 98%, which mainly accounts for the loss of SOC under cultivation treatment. Additionally, the amount of SOC stock was also decided by the balance between the decomposition of SOC and the input of organic carbon to the soil from the plant residues or litter [14]. In this study, with plant biomass being harvested or removed, the total nitrogen content of the soil significantly declined, leading to a lower C:N ratio at both soil depths under grazing and cultivation treatments. A lower C:N ratio can accelerate the decomposition process [24], which indicated that more SOC was breaking down, leaving less SOC in grazing and cropland plots.
4.2. Effects of Grazing and Cultivation on MBC
The decrease of MBC under grazing treatment could be attributed to reduced SOC, which is the carbon and energy source for soil microorganisms [25]. In this study, the higher SOC content in the ungrazing pasture and the significant positive correlations of MBC with SOC (Table 4) showed that MBC is strongly affected by SOC. Higher MBC values in the ungrazed than grazed soils also suggest that an ungrazing management practice may promote enrichment of the soil carbon pool. Another line of exploration for the decline of MBC under grazing treatment was that the soil water content plays an essential role in shaping microbial biomass [26]. In this study, the grazing plot was characterized by both low vegetation coverage and plant biomass, which may induce the lower water holding capacity and increase the evaporative water losses. The significant decline of soil water content at both soil depths and the significantly positive correlations of MBC with soil water content under grazing steppes strongly indicated the important contribution of water content to the change of MBC in this semi-arid steppe ecosystem [27].
The decrease of MBC after cultivation was mainly from the extensive decrease of belowground plant biomass [28]. Globally, temperate grasslands have on average more than nine times greater root biomass than cropland [11]. In the current study, root biomass was significantly greater in the perennial grassland than the annual cropland, and root biomass was reduced by 98% in the cropland compared with that of the native grassland. This demonstrated that the large allocation of belowground carbon resources, through root exudates and the root death, may support more MBC in native grasslands, relative to their annual counterparts [29]. Meanwhile, the significant decline of soil pH in cropland may also contribute to the decline of MBC in the topsoil [30]. In this study, chemical fertilizer was applied as the base fertilizer each year. After 38 years if fertilization, both significantly increased NO3− and decreased soil pH were observed in the cropland, compared with the native grassland. Lower pH can suppress microbial activities and the growth of soil microorganisms [31], which consequently results in a decline of MBC in cropland.
4.3. The Effects of Grazing and Cultivation on Soil Microbial Community Functional Diversity
The lower carbon utilization activity (AWCD) and the Shannon diversity index (H) under grazing treatment may be explained by plant community biomass, as it plays an important role in determining microbial community function since vegetation can select soil microbes with which to be associated [32]. In this study, the aboveground and belowground plant biomass and the number of bacteria, fungi, and actinomycetes were all significantly decreased under grazing treatment, which lead to the decline of AWCD and H. In addition, both AWCD and H showed a significant relationship with soil NH4+-N concentration (Table 4). Our results were in line with the finding of Yang et al. [6] in a Tibetan alpine meadow in China. This finding suggested that grazing-induced N cycling had a strong relationship with microbial community functions under grazing treatment.
The present study found that AWCD and the Shannon index tended to increase following the conversion of native grassland to cropland, which was different from other reports that the function of soil microbial communities declines or does not change after cultivation [33,34]. The higher AWCD and H in the cropland in this study were mainly due to the changes in soil properties caused by the addition of chemical fertilizer. The native grassland never received any fertilizer, while urea and diammonium phosphate were applied to cropland annually. The effects of fertilization increased aboveground plant biomass, which may supply more diverse plant carbon sources for soil microbial communities. On the other hand, the significant relationship between AWCD, the Shannon index, soil NO3−-N concentration, and pH also indicated that the acid micro-environment generated by chemical fertilizers maybe be beneficial for microbial functional diversity [35]. Nautiyal et al. [36] also found an improvement of functional microbial diversity due to 14 years of conversion of grassland to organic cultivated fields. Additionally, the conversion from grassland to cropland leads to a significantly increased number of soil bacteria and antinomecetes but a decreased number of fungi. This result further emphasized the improved environment for soil microbial communities under cropland sites, as low soil pH was believed to favor the growth of fungi.
4.4. The Implications of the Findings
Our results suggested that the rapid carbon losses diminished SOC stocks under grazing via aboveground biomass removal and, under cultivation, via harvest and plow. This implied that moderate grazing pressure was a key point in maintaining or improving soil productivity. It has been estimated that 0.91 sheep·ha−1 may be the best grazing pressure in the typical grassland of Inner Mongolia [37], which is far lower than the 2–3.7 sheep·ha−1 in this study. Thus, decreasing the grazing pressure to around 1 sheep·ha−1 or ungrazing the grassland by exclosure could both be optional practices to restore SOC for the study region. In addition, to give up cultivation might be a suitable practice to renew the soil productivity, as the grassland in this region and in the whole of China has undergone serious degeneration and desertification.
The differential responses of soil microbial communities from converted grasslands under decade-long periods of grazing and cultivation highlighted the importance of understanding microbial mechanisms when grassland is converted to other management practices for the sake of soil carbon sequestration and the sustainability of semi-arid grassland regions in Inner Mongolia, China or around the world.
5. Concluding Remarks
Our results highlighted that the two grassland management practices, namely grazing and cultivation, could have strong effects on SOC accumulation and the properties of soil microbial communities. Both grazing and cultivation significantly decreased the production of aboveground and belowground plant biomass, and thus SOC accumulation, while the deterioration of soil quality was largely attributed to the losses of SOC.
Grazing and cultivation also significantly decreased MBC at soil depths of 0–10 cm and 10–20 cm. The lower SOC and soil moisture accounted for lower MBC under grazing, yet the decreased belowground biomass caused the lower MBC in cropland compared to the native grassland.
Grazing decreased AWCD, the Shannon index, and the carbon utilization pattern. The lower aboveground biomass production and its close relationship with soil NH4+-N under grazing could be the cause of such deduction. However, cultivation increased soil microbial community functional diversity. The chemical fertilization effect as well as the variation of soil microbial community composition might jointly account for the response of soil microbial functional diversity to cultivation.
It is concluded that both ungrazing by exclosure and the abandonment of cultivation to let the cropland be restored to native grassland have high potential to mitigate the effects of grazing and cultivation on plant communities and soil properties, leading to a win-win recovery of plant and soil microbial communities and then to a sustainable grassland in semi-arid areas.
Acknowledgments
This work was financially supported by the National Natural Science Foundation of China (No. 41330528, 41373084, 41573131) and the Special Fund for Agro-scientific Research in the Public Interest (No. 201203012). We gratefully thank the Inner Mongolia Grassland Ecosystem Research Station (IMGERS) for their field assistance and Daniel Murphy (University of Western Australia, Australia) for his assistance in an early version of this manuscript.
Author Contributions
Yating He framed the paper idea and wrote the paper. Yuchun Qi, Xinhua He, and Jianwei Li revised the manuscript. Yunshe Dong and Minggang Xu revised the manuscript and supervised the overall work. Xinchao Liu and Liangjie Sun analyzed the data. All authors read and approved the manuscript.
Conflicts of Interest
The authors have declared no conflict of interest. The founding sponsors had no role in the design of the study; in the collection, analyses, or interpretation of data; in the writing of the manuscript; and in the decision to publish the results.
References
- Scurlock, J.; Hall, D. The global carbon sink: A grassland perspective. Glob. Chang. Biol. 1998, 4, 229–233. [Google Scholar] [CrossRef]
- Schlesinger, W.H. Biogeochemistry: An Analysis of Global Change; Academic Press: New York, NY, USA, 1997; p. 44. [Google Scholar]
- Yang, Y.; Fang, J.; Ma, W.; Smith, P.; Mohammat, A.; Wang, S.; Wang, W. Soil carbon stock and its changes in northern China’s grasslands from 1980s to 2000s. Glob. Chang. Biol. 2010, 16, 3036–3047. [Google Scholar] [CrossRef]
- Huang, Y.; Sun, W.J.; Zhang, W.; Yu, Y.Q.; Wei, Y.R. Study on carbon budget in grassland of China: Progress and perspectives. Quatern. Sci. 2010, 30, 456–465. [Google Scholar]
- Su, Y.Z.; Li, Y.L.; Cui, H.Y.; Zhao, W.Z. Influences of continuous grazing and livestock exclusion on soil properties in a degraded sandy grassland, Inner Mongolia, northern China. Catena 2005, 59, 267–278. [Google Scholar]
- Yang, Y.F.; Wu, L.W.; Lin, Q.Y.; Yuan, M.T.; Xu, D.P.; Yu, H.; Hu, Y.G.; Duan, J.C.; Li, X.Z.; He, Z.L. Responses of the functional structure of soil microbial community to livestock grazing in the Tibetan alpine grassland. Glob. Chang. Biol. 2013, 19, 637–648. [Google Scholar] [CrossRef] [PubMed]
- Raiesi, F.; Riahi, M. The influence of grazing exclosure on soil c stocks and dynamics, and ecological indicators in upland arid and semi-arid rangelands. Ecol. Ind. 2014, 41, 145–154. [Google Scholar] [CrossRef]
- Wang, Q.L.; Wang, C.T.; Du, Y.G.; Cao, G.M. Grazing impact on soil microbial biomass carbon and relationships with soil environment in alpine Kobresia meadow. Acta Pratacult. Sin. 2008, 17, 39–46. [Google Scholar]
- Zhu, G.Y.; Deng, L.; Zhang, X.B.; Shang, Z.P. Effects of grazing exclusion on plant community and soil physicochemical properties in a desert steppe on the Loess Plateau, China. Ecol. Eng. 2016, 90, 372–381. [Google Scholar] [CrossRef]
- Conant, R.T.; Paustian, K.; Elliott, E.T. Grassland management and conversion into grassland: Effects on soil carbon. Ecol. Appl. 2001, 11, 343–355. [Google Scholar] [CrossRef]
- Jackson, R.B.; Canadell, J.; Ehleringer, J.R.; Mooney, H.A.; Sala, O.E.; Schulze, E.D. A global analysis of root distributions for terrestrial biomes. Oecologia 1996, 108, 389–411. [Google Scholar] [CrossRef]
- Jones, M.B.; Donnelly, A. Carbon sequestration in temperate grassland ecosystems and the influence of management, climate and elevated CO2. New Phytol. 2004, 164, 423–439. [Google Scholar] [CrossRef]
- Su, Y.Z.; Zhao, H.L.; Zhang, T.H.; Zhao, X.Y. Soil properties following cultivation and non-grazing of a semi-arid sandy grassland in northern China. Soil Tillage Res. 2004, 75, 27–36. [Google Scholar] [CrossRef]
- Qi, Y.C.; Dong, Y.S.; Peng, Q.; Xiao, S.S.; He, Y.T.; Liu, X.C.; Sun, L.J.; Jia, J.Q.; Yang, Z.J. Effects of a conversion from grassland to cropland on the different soil organic carbon fractions in Inner Mongolia, China. J. Geogr. Sci. 2012, 22, 315–328. [Google Scholar] [CrossRef]
- Vance, E.D.; Brookes, P.C.; Jenkinson, D.S. An extraction method for measuring soil microbial biomass C. Soil Biol. Biochem. 1987, 19, 703–707. [Google Scholar] [CrossRef]
- Garland, J.L. Analytical approaches to the characterization of samples of microbial communities using patterns of potential c source utilization. Soil Biol. Biochem. 1996, 28, 213–221. [Google Scholar] [CrossRef]
- Zak, J.C.; Willig, M.R.; Moorhead, D.L.; Wildman, H.G. Functional diversity of microbial communities: A quantitative approach. Soil Biol. Biochem. 1994, 26, 1101–1108. [Google Scholar] [CrossRef]
- Guan, S.Y.; Zhang, D.S.; Zhang, Z.M. Soil Enzymes and Its Methodology; Agricutural Press: Beijing, China, 1986. [Google Scholar]
- Lu, R.K. Soil and Agro-Chemical Aalytical Methods; China Agricultural Science and Technology Press: Beijing, China, 1999. [Google Scholar]
- He, N.P.; Zhang, Y.H.; Dai, J.Z.; Han, X.G.; Yu, G.R. Losses in carbon and nitrogen stocks in soil particle-size fractions along cultivation chronosequences in Inner Mongolian grasslands. J. Environ. Qual. 2012, 41, 1507–1516. [Google Scholar] [CrossRef] [PubMed]
- Xie, Z.B.; Zhu, J.G.; Liu, G.; Cadisch, G.; Hasegawa, T.; Chen, C.M.; Sun, H.F.; Tang, H.Y.; Zeng, Q. Soil organic carbon stocks in China and changes from 1980s to 2000s. Glob. Chang. Biol. 2007, 13, 1989–2007. [Google Scholar] [CrossRef]
- Beniston, J.W.; DuPont, S.T.; Glover, J.D.; Lal, R.; Dungait, J.J. Soil organic carbon dynamics 75 years after land-use change in perennial grassland and annual wheat agricultural systems. Biogeochemistry 2014, 120, 37–49. [Google Scholar] [CrossRef]
- Ingram, L.J.; Stahl, P.D.; Schuman, G.E.; Buyer, J.S.; Vance, G.F.; Ganjegunte, G.K.; Welker, J.M.; Derner, J.D. Grazing impacts on soil carbon and microbial communities in a mixed-grass ecosystem. Soil Sci. Soc. Am. J. 2008, 72, 939–948. [Google Scholar] [CrossRef]
- Shang, Z.H.; Cao, J.J.; Guo, R.Y.; Long, R.J.; Deng, B. The response of soil organic carbon and nitrogen 10 years after returning cultivated alpine steppe to grassland by abandonment or reseeding. Catena 2014, 119, 28–35. [Google Scholar] [CrossRef]
- Sarathchandra, S.U.; Ghani, A.; Yeates, G.W.; Burch, G.; Cox, N.R. Effect of nitrogen and phosphate fertilisers on microbial and nematode diversity in pasture soils. Soil Biol. Biochem. 2001, 33, 953–964. [Google Scholar] [CrossRef]
- Frazão, L.A.; Piccolo, M.C.; Feigl, B.J.; Cerri, C.C.; Cerri, C.P. Inorganic nitrogen, microbial biomass and microbial activity of a sandy Brazilian Cerrado soil under different land uses. Agric. Ecosyst. Environ. 2010, 135, 161–167. [Google Scholar] [CrossRef]
- Liu, W.X.; Zhang, Z.; Wan, S.Q. Predominant role of water in regulating soil and microbial respiration and their responses to climate change in a semiarid grassland. Glob. Chang. Biol. 2009, 15, 184–195. [Google Scholar] [CrossRef]
- Xu, X.F.; Thornton, P.E.; Post, W.M. A global analysis of soil microbial biomass carbon, nitrogen and phosphorus in terrestrial ecosystems. Glob. Ecol. Biogeogr. 2013, 22, 737–749. [Google Scholar] [CrossRef]
- Paterson, E. Importance of rhizodeposition in the coupling of plant and microbial productivity. Eur. J. Soil Sci. 2003, 54, 741–750. [Google Scholar] [CrossRef]
- Kemmitt, S.J.; Wright, D.; Goulding, K.W.; Jones, D.L. Ph regulation of carbon and nitrogen dynamics in two agricultural soils. Soil Biol. Biochem. 2006, 38, 898–911. [Google Scholar] [CrossRef]
- Wang, A.S.; Angle, J.S.; Chaney, R.L.; Delorme, T.A.; McIntosh, M. Changes in soil biological activities under reduced soil pH during Thlaspi caerulescens phytoextraction. Soil Biol. Biochem. 2006, 38, 1451–1461. [Google Scholar] [CrossRef]
- Bardgett, R.D.; Wardle, D.A. Herbivore-mediated linkages between aboveground and belowground communities. Ecology 2003, 84, 2258–2268. [Google Scholar] [CrossRef]
- Bissett, A.; Richardson, A.E.; Baker, G.; Thrall, P.H. Long-term land use effects on soil microbial community structure and function. Appl. Soil Ecol. 2011, 51, 66–78. [Google Scholar] [CrossRef]
- Murugan, R.; Loges, R.; Taube, F.; Sradnick, A.; Joergensen, R.G. Changes in soil microbial biomass and residual indices as ecological indicators of land use change in temperate permanent grassland. Microb. Ecol. 2014, 67, 907–918. [Google Scholar] [CrossRef] [PubMed]
- Wallenstein, M.D.; McNulty, S.; Fernandez, I.J.; Boggs, J.; Schlesinger, W.H. Nitrogen fertilization decreases forest soil fungal and bacterial biomass in three long-term experiments. For. Ecol. Manag. 2006, 222, 459–468. [Google Scholar] [CrossRef]
- Nautiyal, C.S.; Chauhan, P.S.; Bhatia, C.R. Changes in soil physico-chemical properties and microbial functional diversity due to 14 years of conversion of grassland to organic agriculture in semi-arid agroecosystem. Soil Tillage Res. 2010, 109, 55–60. [Google Scholar] [CrossRef]
- Liu, N.; Zhang, Y.J.; Chang, S.J.; Kan, H.M.; Lin, L.J. Impact of grazing on soil carbon and microbial biomass in typical steppe and desert steppe of Inner Mongolia. PLoS ONE 2012, 7, e36434. [Google Scholar] [CrossRef] [PubMed]
© 2017 by the authors; licensee MDPI, Basel, Switzerland. This article is an open access article distributed under the terms and conditions of the Creative Commons Attribution (CC-BY) license (http://creativecommons.org/licenses/by/4.0/).