Article

Sustainable Development in China’s Coastal Area: Based on the Driver-Pressure-State-Welfare-Response Framework and the Data Envelopment Analysis Model

1
Center for Studies of Marine Economy and Sustainable Development, Liaoning Normal University, 850 Huanghe Road, Dalian 116029, China
2
School of Foreign Languages, Liaoning Normal University, 850 Huanghe Road, Dalian 116029, China
*
Author to whom correspondence should be addressed.
Sustainability 2016, 8(9), 958; https://doi.org/10.3390/su8090958
Submission received: 12 May 2016 / Revised: 12 September 2016 / Accepted: 16 September 2016 / Published: 21 September 2016
(This article belongs to the Section Social Ecology and Sustainability)

Abstract

:
The economic development of China’s coastal areas is being constrained by resources and the environment, with sustainable development being the key to solving these problems. The data envelopment analysis (DEA) model is widely used to assess sustainable development. However, indicators used in the DEA model are not selected in a scientific and comprehensive manner, which may lead to unrepresentative results. Here, we use the driver-pressure-state-welfare-response (DPSWR) framework to select more scientific and comprehensive indicators for a more accurate analysis of efficiency in China’s coastal area. The results show that the efficiencies of most provinces and cities in China’s coastal area have a stable trend. In the time dimension, efficiency was rising before 2008, after which it decreased. In the spatial dimension, China’s coastal provinces and cities are divided into three categories: high efficiency, low efficiency, and greater changes in efficiency. By combining DPSWR and DEA, we produce reliable values for measuring efficiency, with the benefit of avoiding the incomplete selection of DEA indicators.

1. Introduction

With rapid economic development exhausting land resources, people have begun focusing on the sea [1], which is becoming increasingly important for sustaining the economy [2,3], especially in China [4]. The Marine Society of China is in a stage of all-round development; however, is remains subject to certain problems, such as insufficiency in the basic strength of the sea, the imbalance of regional development, and the deterioration of the marine ecological environment [5]. To realize the sustainable development of the sea, it is necessary to understand the current status of sustainable development of the marine environment. The data envelopment analysis (DEA) model constructs the objective function skillfully, and transforms the fractional programming problem to a linear programming problem through the Charnes-Cooper transform (C2—Transform), without the requirement of the dimension of a uniform index and input-output weights. This capability improves the objectivity of the evaluation of decision-making units. Thus, the DEA model is suitable for assessing the sustainable development of marine ecological economy, which has both environmental and economic problems [6].
Many studies on marine efficiency have applied the DEA model, with most studies focusing on fisheries, shipbuilding, and port logistics. Zheng and Zhou measured the fishing capacity of Chinese marine fleets through peak-to-peak (PTP) and DEA methods [7]. Griffin and Woodward determined policy-efficient management strategies in fisheries by DEA [8]. Vázquez and Tyedmers identified the importance of the “skipper effect” for sources of measured inefficiency in fisheries by DEA [9]. Pham et al. analyzed the relationship between capacity efficiency and the economic performance of gillnet fisheries in Da Nang, Vietnam [10]. Thøgersen and Pascoe calculated the efficiency of Danish North Sea demersal trawlers by combining the DEA with the multi-output distance function (DFA) [11]. González-García et al. analyzed cross-vessel eco-efficiency by combining DEA and lifecycle assessment (LCA) [12]. Lee analyzed the efficiency of Korean small- and medium-sized (SMS) shipyards by DEA and the Malmquist index [13]. Park et al. evaluated the performance of the block manufacturing process (BMP) by integrating DEA with process mining (PM) [14]. Huang and Peng measured the efficiency between economic growth and port logistics by DEA in Zhejiang, China [15]. Birgun measured the efficiency of seaport container terminals by DEA [16].
However, the efficiency measured in these studies was highly dependent on the choice of indicators. If one indicator is changed, the whole efficiency value would noticeably alter; thus, it is important to select appropriate indicators for objective assessment. Zhao and Guo used grey relational analysis (GRA) to select indicators when calculating the marine economic efficiency of China’s coastal areas [17]. Yuan and Qiu used principal component analysis (PCA) to reduce the overlap of information between indicators when calculating the development efficiency of Tianjin, China [18]. These authors focused on the scientific nature of indicator selection, but overlooked comprehensiveness. Xu combined the driver-pressure-state-impact-response (DPSIR) framework with the DEA model, using driving force as the input, and pressure, state, impact, and response as the outputs to calculate the efficiency of agricultural industrialization [19]. This work inspired the development of the current study because the DPSIR framework selects indicators in a scientific and comprehensive way, and the research on DPSIR has become more and more mature.
Karageogis et al. analyzed the impact of 100-Year Human Interventions on the Deltaic Coastal Zone of the Inner Thermaikos Gulf in Greece by DPSIR [20]. Pacheco et al. developed a proposed coastal management program (CMP) based on DPSIR, for the management of channels [21]. Kohsaka analyzed developing biodiversity indicators for cities by applying DPSIR [22]. Atkins discussed the comprehensive problems of DPSIR in the management of the marine environment [23]. Gregory promoted a more systemic view of decision-making and policy development based on DPSIR and problem structuring methods (PSM) [24].
Here, we used the driver-pressure-state-welfare-response (DPSWR) framework as the basis of our analyses, which is an improved form of the DPSIR framework. Specifically, we re-constructed the relationships of input and output for each index in the DPSWR framework, and selected indicators according to the DPSWR framework, to achieve the goal of selecting indicators in a scientific and comprehensive manner. We used the DEA model to analyze the efficiency of the DPSWR framework, to produce more scientific and reliable evaluation results on the efficiency of sustainable development in China’s coastal area. We then used kernel density estimation and hierarchical clustering to analyze the time and space efficiency of 11 provinces and cities in China, to provide suggestions for management.

2. Materials and Methods
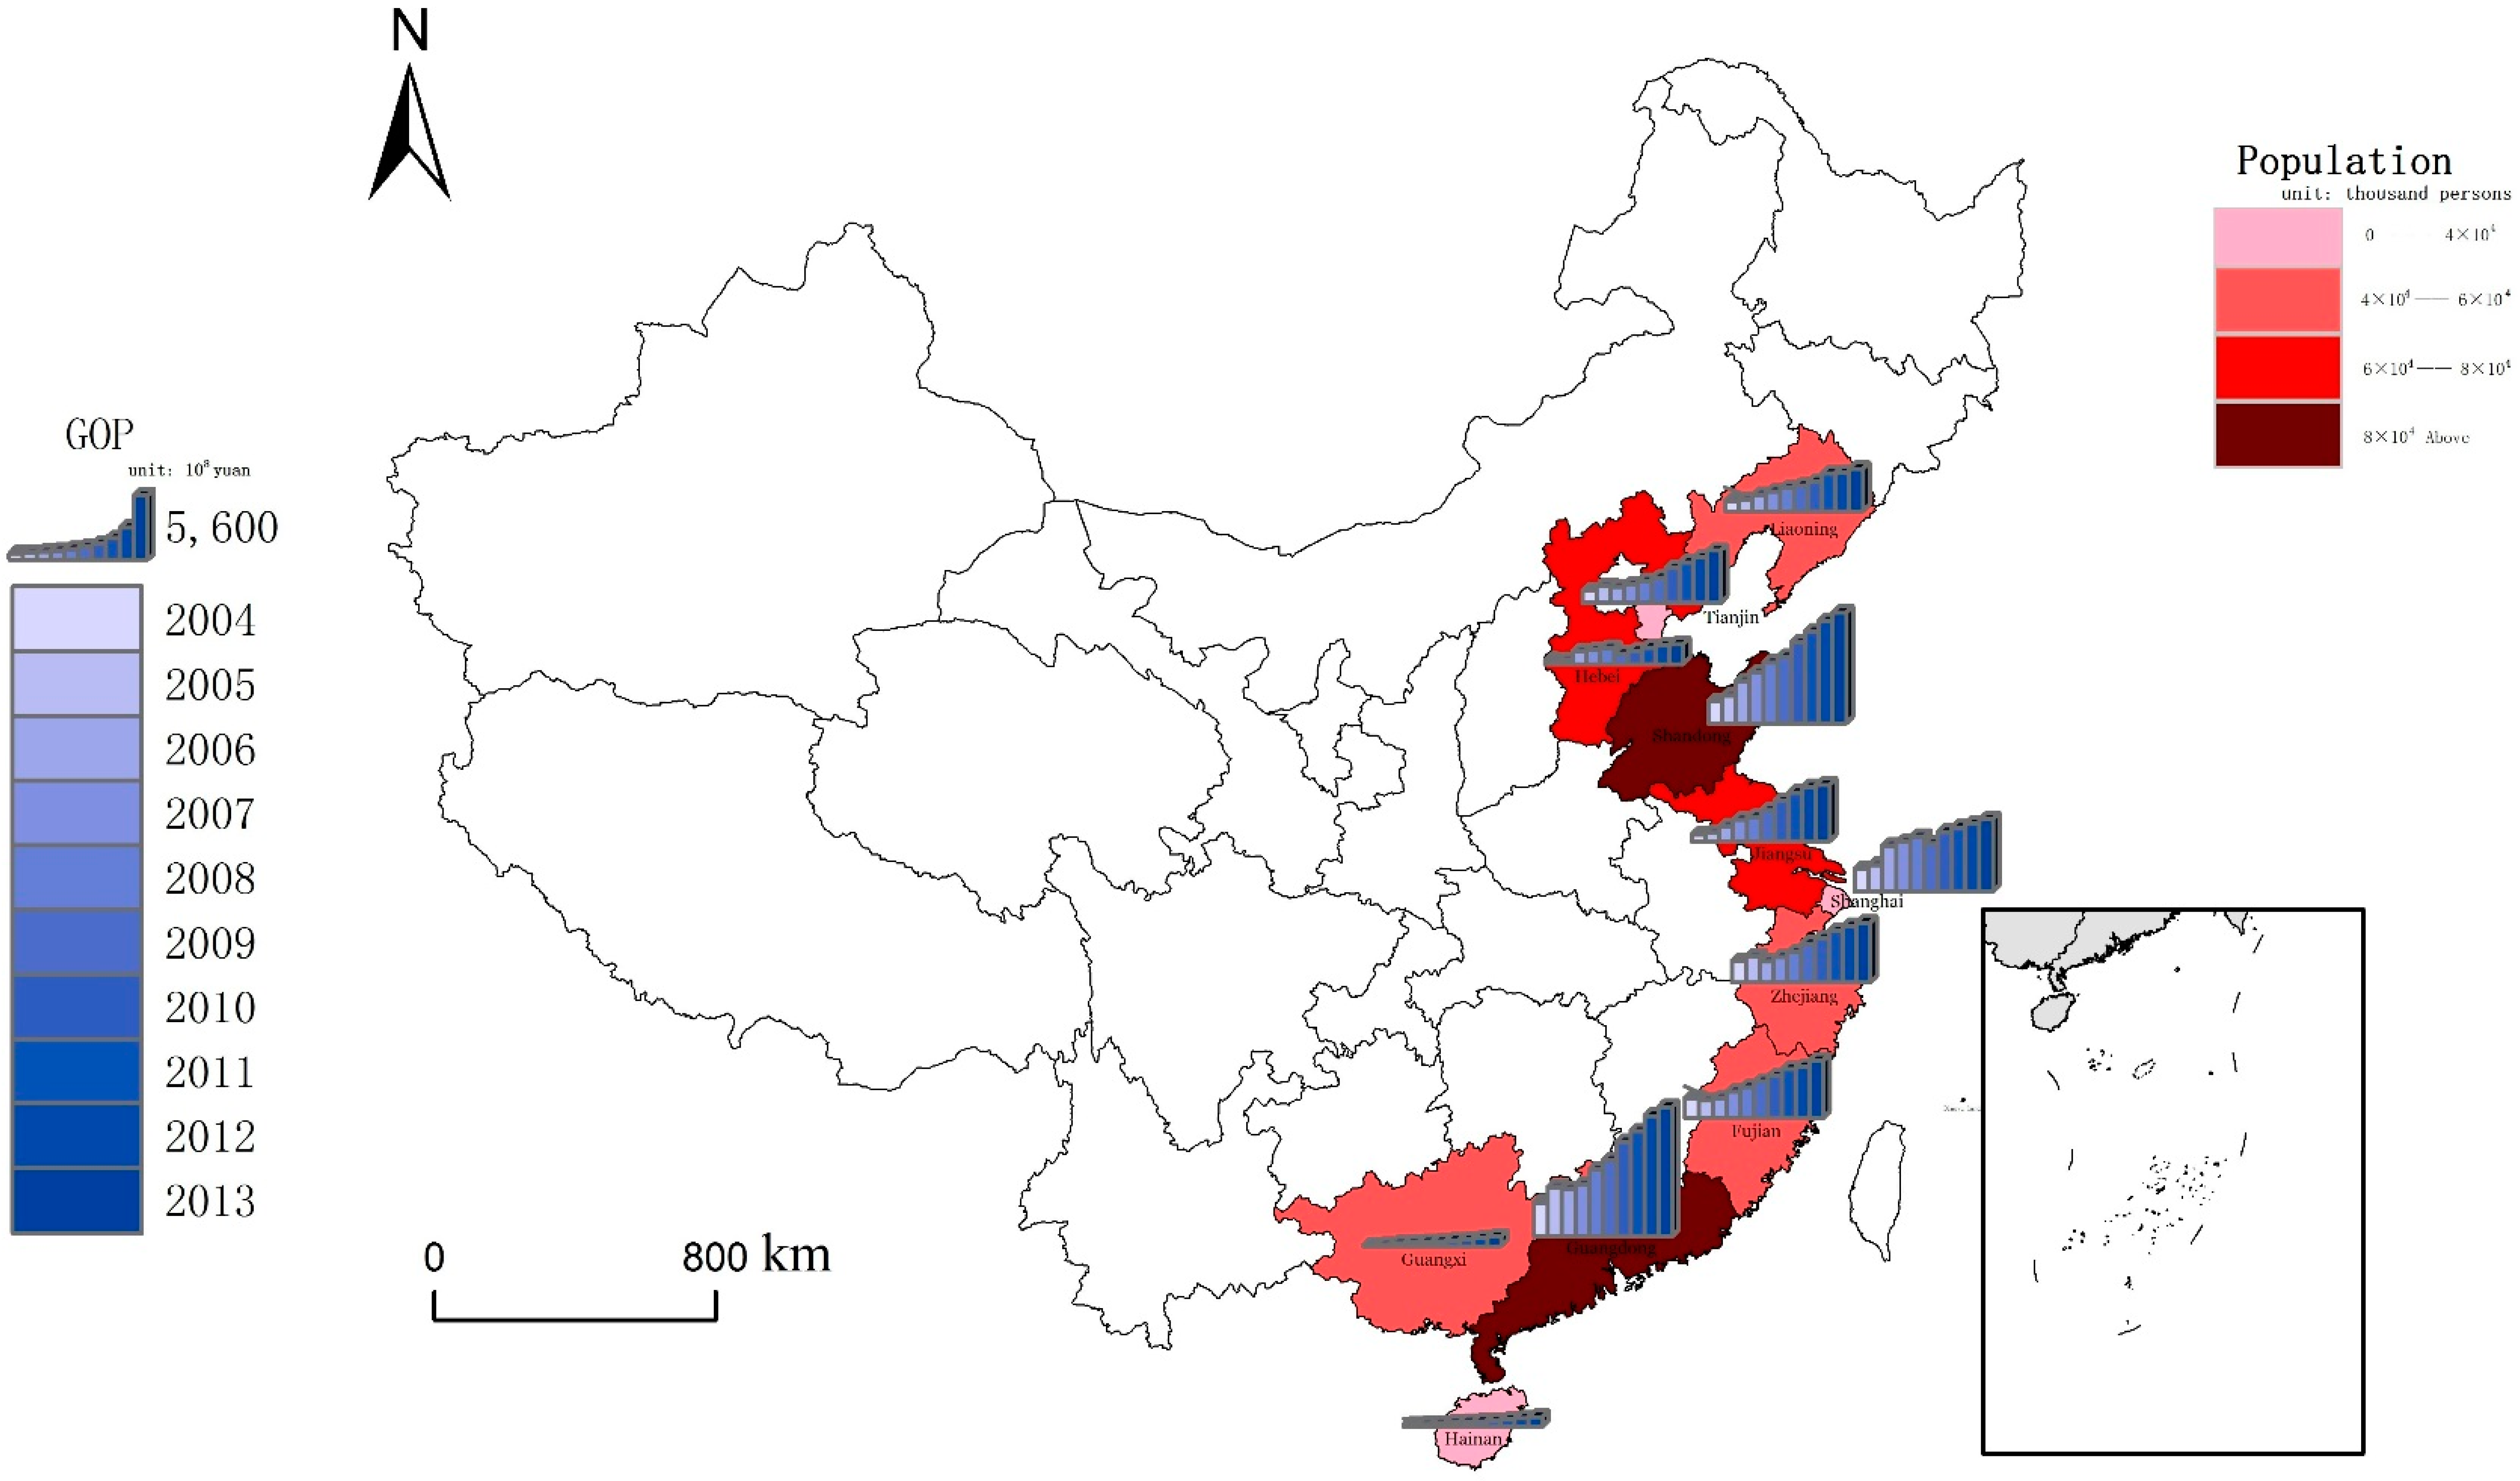
2.1. Study Area

Chinese coastal provinces, municipalities, and autonomous regions (excluding Hong Kong, Macao, and Taiwan), from north to south, include Liaoning, Hebei, Tianjin, Shandong, Jiangsu, Shanghai, Zhejiang, Fujian, Guangdong, Guangxi, and Hainan. The total area of these 11 coastal provinces and cities accounts for less than 14% of the total area of China; however, the development level of these areas is much higher than other regions. In 2014, the GDP of these 11 coastal provinces and cities reached 373 × 106 billion yuan, accounting for 58.6% of the country’s GDP. Additionally, the Gross Ocean Product (GOP) of these 11 coastal provinces and cities reached 5993.6 billion yuan in 2014, contributing 9.4% to China’s GDP [25] (Figure 1). In parallel, these 11 coastal provinces and cities contain 38% of the country’s population (Figure 1). Consequently, social, environmental, and other issues remain a problem.

2.2. Methods

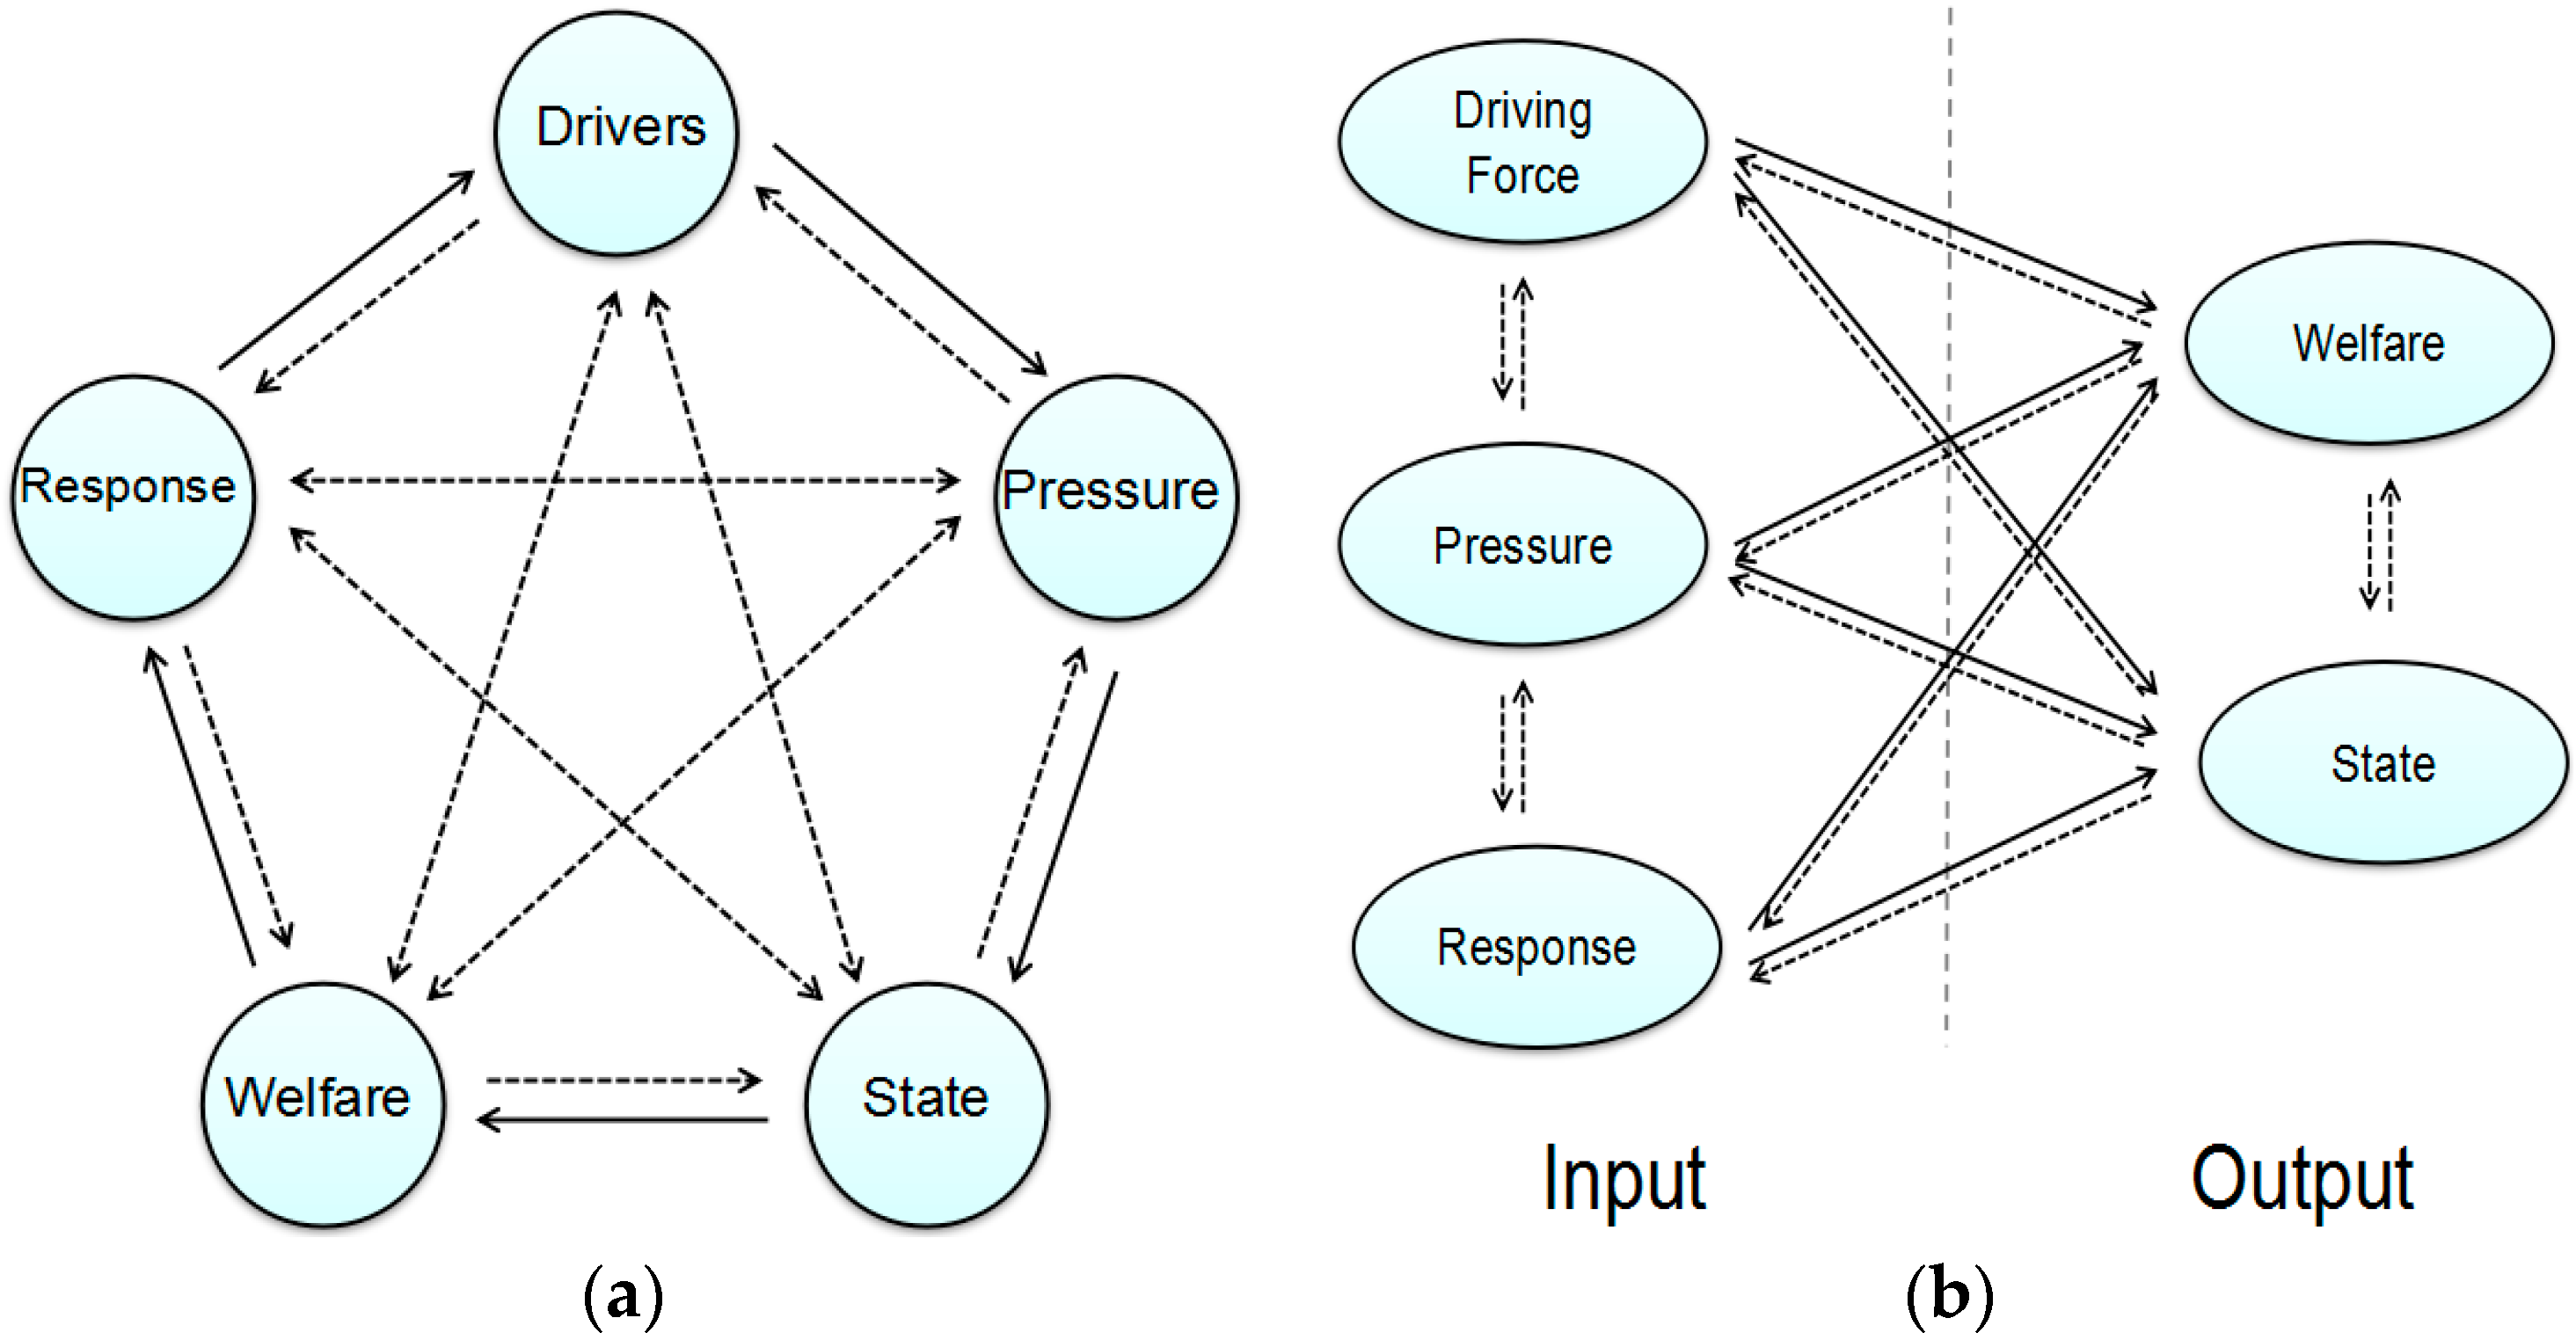
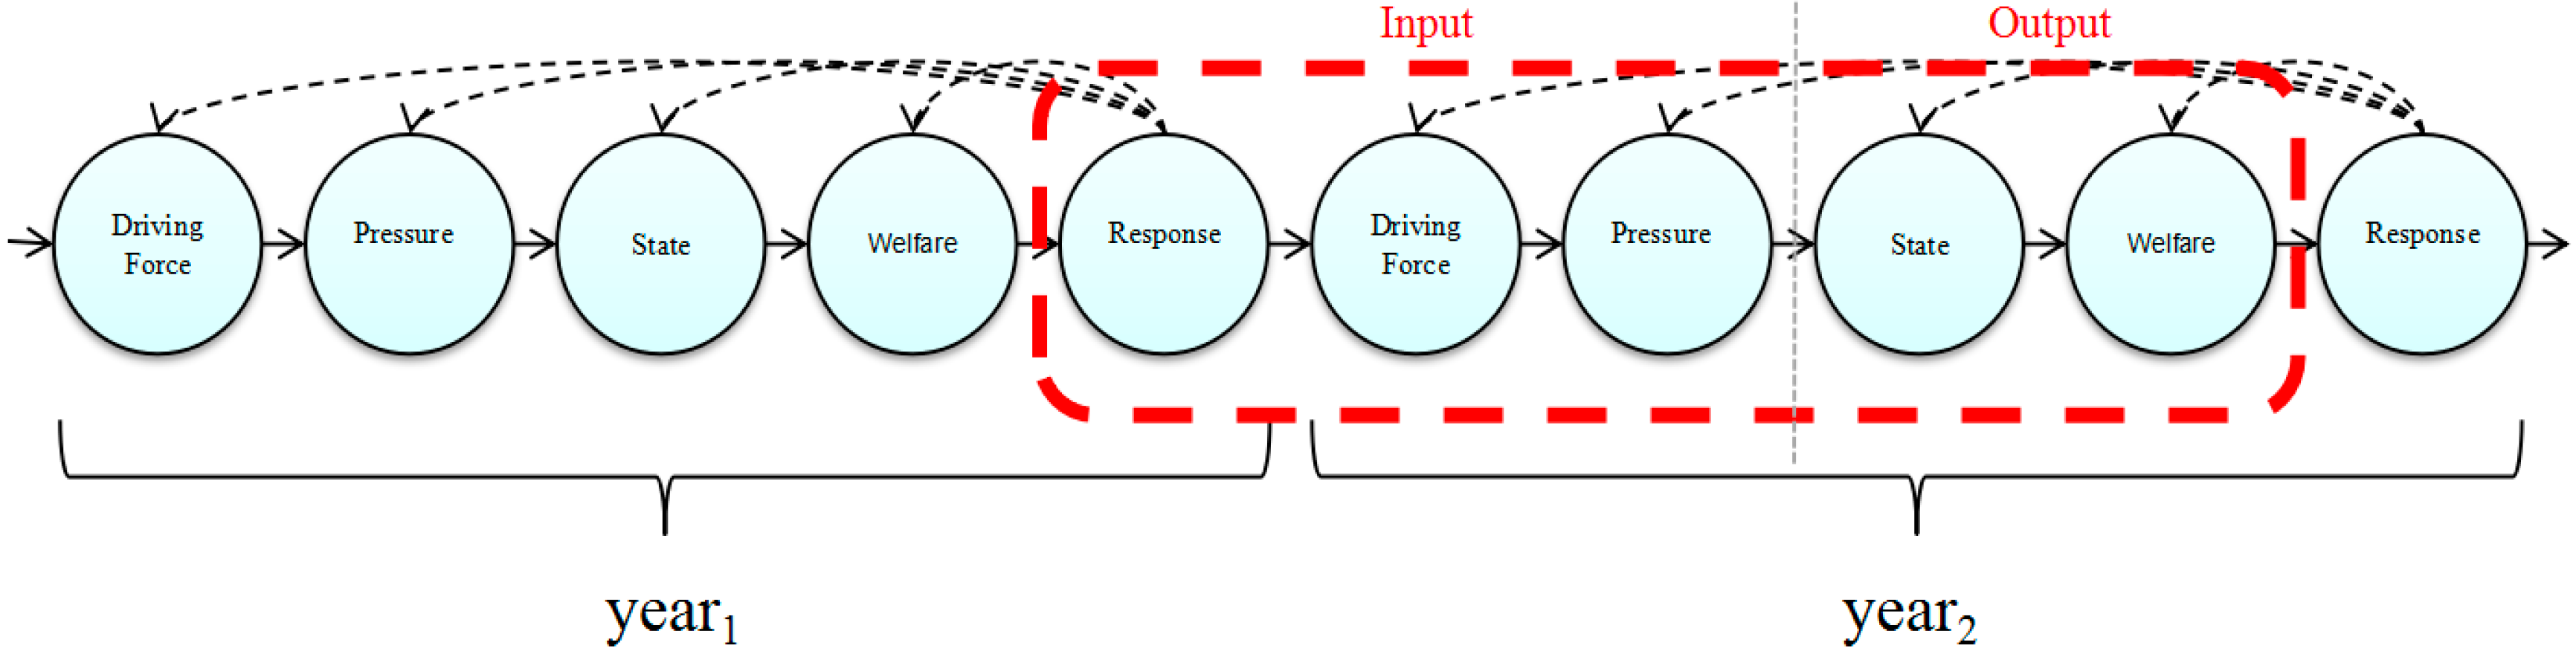
2.2.1. DPSWR Framework

The DPSWR framework was established based on the DPSIR framework, which was developed from the pressure-state-response (PSR) framework of the Organization for Economic Cooperation and Development [26] by the European Environmental Agency [27]. The DPSIR framework has been widely applied to structure information and identifying important relationships [28], due to its ability to capture the cause–effect relationships among the sectors of social, economic, and environmental systems [29,30,31,32,33]. Although the DPSIR framework has been applied to many parameters, defects have gradually emerged. For instance, it is difficult to understand the definition of its information level, and it is difficult to perform the economic interaction analysis between the social and ecological system [34]. Bowen and Riley suggested the inclusion of welfare in the DPSIR framework [35]. Subsequently, Cooper modified the DPSIR model, and proposed the DPSWR model [36]. Gilbert et al. analyzed marine spatial planning and good environmental status using spatial and temporal dimensions produced by the DPSWR framework [37]. The DPSWR framework assumes that its core five indicators have a “ring” relationship with a single direction; however, these five indicators are interrelated (see Figure 2a). Furthermore, the indicators also have a bidirectional relationship. Similar to DPSWR, one of the main aims of the DPSIR framework is to evaluate efficiency [27,28]. Therefore, in the present study, we constructed the DPSWR efficiency framework based on inputs and outputs (see Figure 2b). The solid lines and dotted lines all represent the link between the various indicators; however, solid lines represent the direction, which is based on the direction of input–output relationships, and has been discussed in this paper. We can consider that Figure 2b is the result of the change in Figure 2a, and the solid lines in Figure 2b highlight the contents of this study.
To understand the rationality combining the DPSWR framework with the DEA model, along with the selection of inputs and outputs, we deconstructed the DPSWR framework from the ring structure to form a linear structure, and we connected annual DPSWR together (Figure 3). State and welfare represent the final results of the DPSWR, while driving force, pressure, and the response of the previous year represent necessary input elements for the final results.
In the DPSWR framework, driving force represents changes to the economy and ecological environment; pressure represents the resources consumed by humans; response represents the positive policies and measures formulated by humans to address economic and ecological environment changes. Thus, we selected driving force, pressure, and response as inputs. State represents the status of the economic and ecological environment, and welfare represents the final results of economic changes. Thus, we selected state and welfare as outputs.

2.2.2. DEA Model

The DEA model was proposed by two American operation researchers, A. Charnes and W. W. Cooper, in 1978 to assess relative efficiency [38]. DEA is being increasingly used in a wide range of fields, because it provides a simple way to deal with the relative efficiency of inputs and outputs [39]. However, classical DEA methods measure efficiency based on the CCR model and BCC model suggested by Farrell [40]. These models belong to the radial and linear segment measurement theory, and do not consider the effect of relaxation, which may lead to errors in the measures of efficiency. In comparison, the classical DEA method does not incorporate the external environment and random error of the main body; consequently, the resulting efficiency score may underestimate or overestimate the actual level of efficiency [41]. Subsequently, Tone, Fukuyama, and Weber proposed a non-radial and non-angle efficiency evaluation model, by introducing input and output slack in the objective function [42,43]. Based on environmental production technology, Tone constructed the slacks-based measure (SBM) model, which contains the unexpected output [42]. The main difference between this model and the classical CCR and BCC models is that the objective function contains the slack variables. Therefore, the problem of non-zero relaxation of input or output was solved, and the unexpected output of the production process was also solved [44]. However, these changes failed to resolve the problem of effectively distinguishing the efficiency of the decision making unit (DMU). Based on the SBM model, Tone proposed the Super–SBM efficiency model [45], with the following mathematical expression:
ρ * = min ρ = min 1 ( 1 N n = 1 N s n x x n k ) 1 + [ 1 M + I ( m = 1 M s m y y m k ) + i = 1 I s i b b i k ]
s . t . { k = 1 K z k y y m k s m y = y m k , m = 1 , , M ; k = 1 K z k b b i k + s i b = b i k , i = 1 , , I ; k = 1 K z k x x n k + s n x = x n k , n = 1 , , N ; z k i 0 , s m y 0 , s i b 0 , s n x 0 , k = 1 , K
where ρ represents the efficiency value, while N, M, and I represent the number of inputs, expected outputs, and unexpected outputs, respectively. ( s m y , s i b , s n x ) represents the slack variables of the inputs and outputs, and ( y m k , b i k , x n k ) represents the input–output value of the production unit k at time t. Finally, ( z k y , z k x ) represents the weights of each input and output. The objective function ρ is strictly monotone, decreasing with s m y , s i b , s n x , and 0 < ρ ≤ 1. The production unit is fully effective, whereby ρ = 1, while the production unit has efficiency loss when ρ < 1.

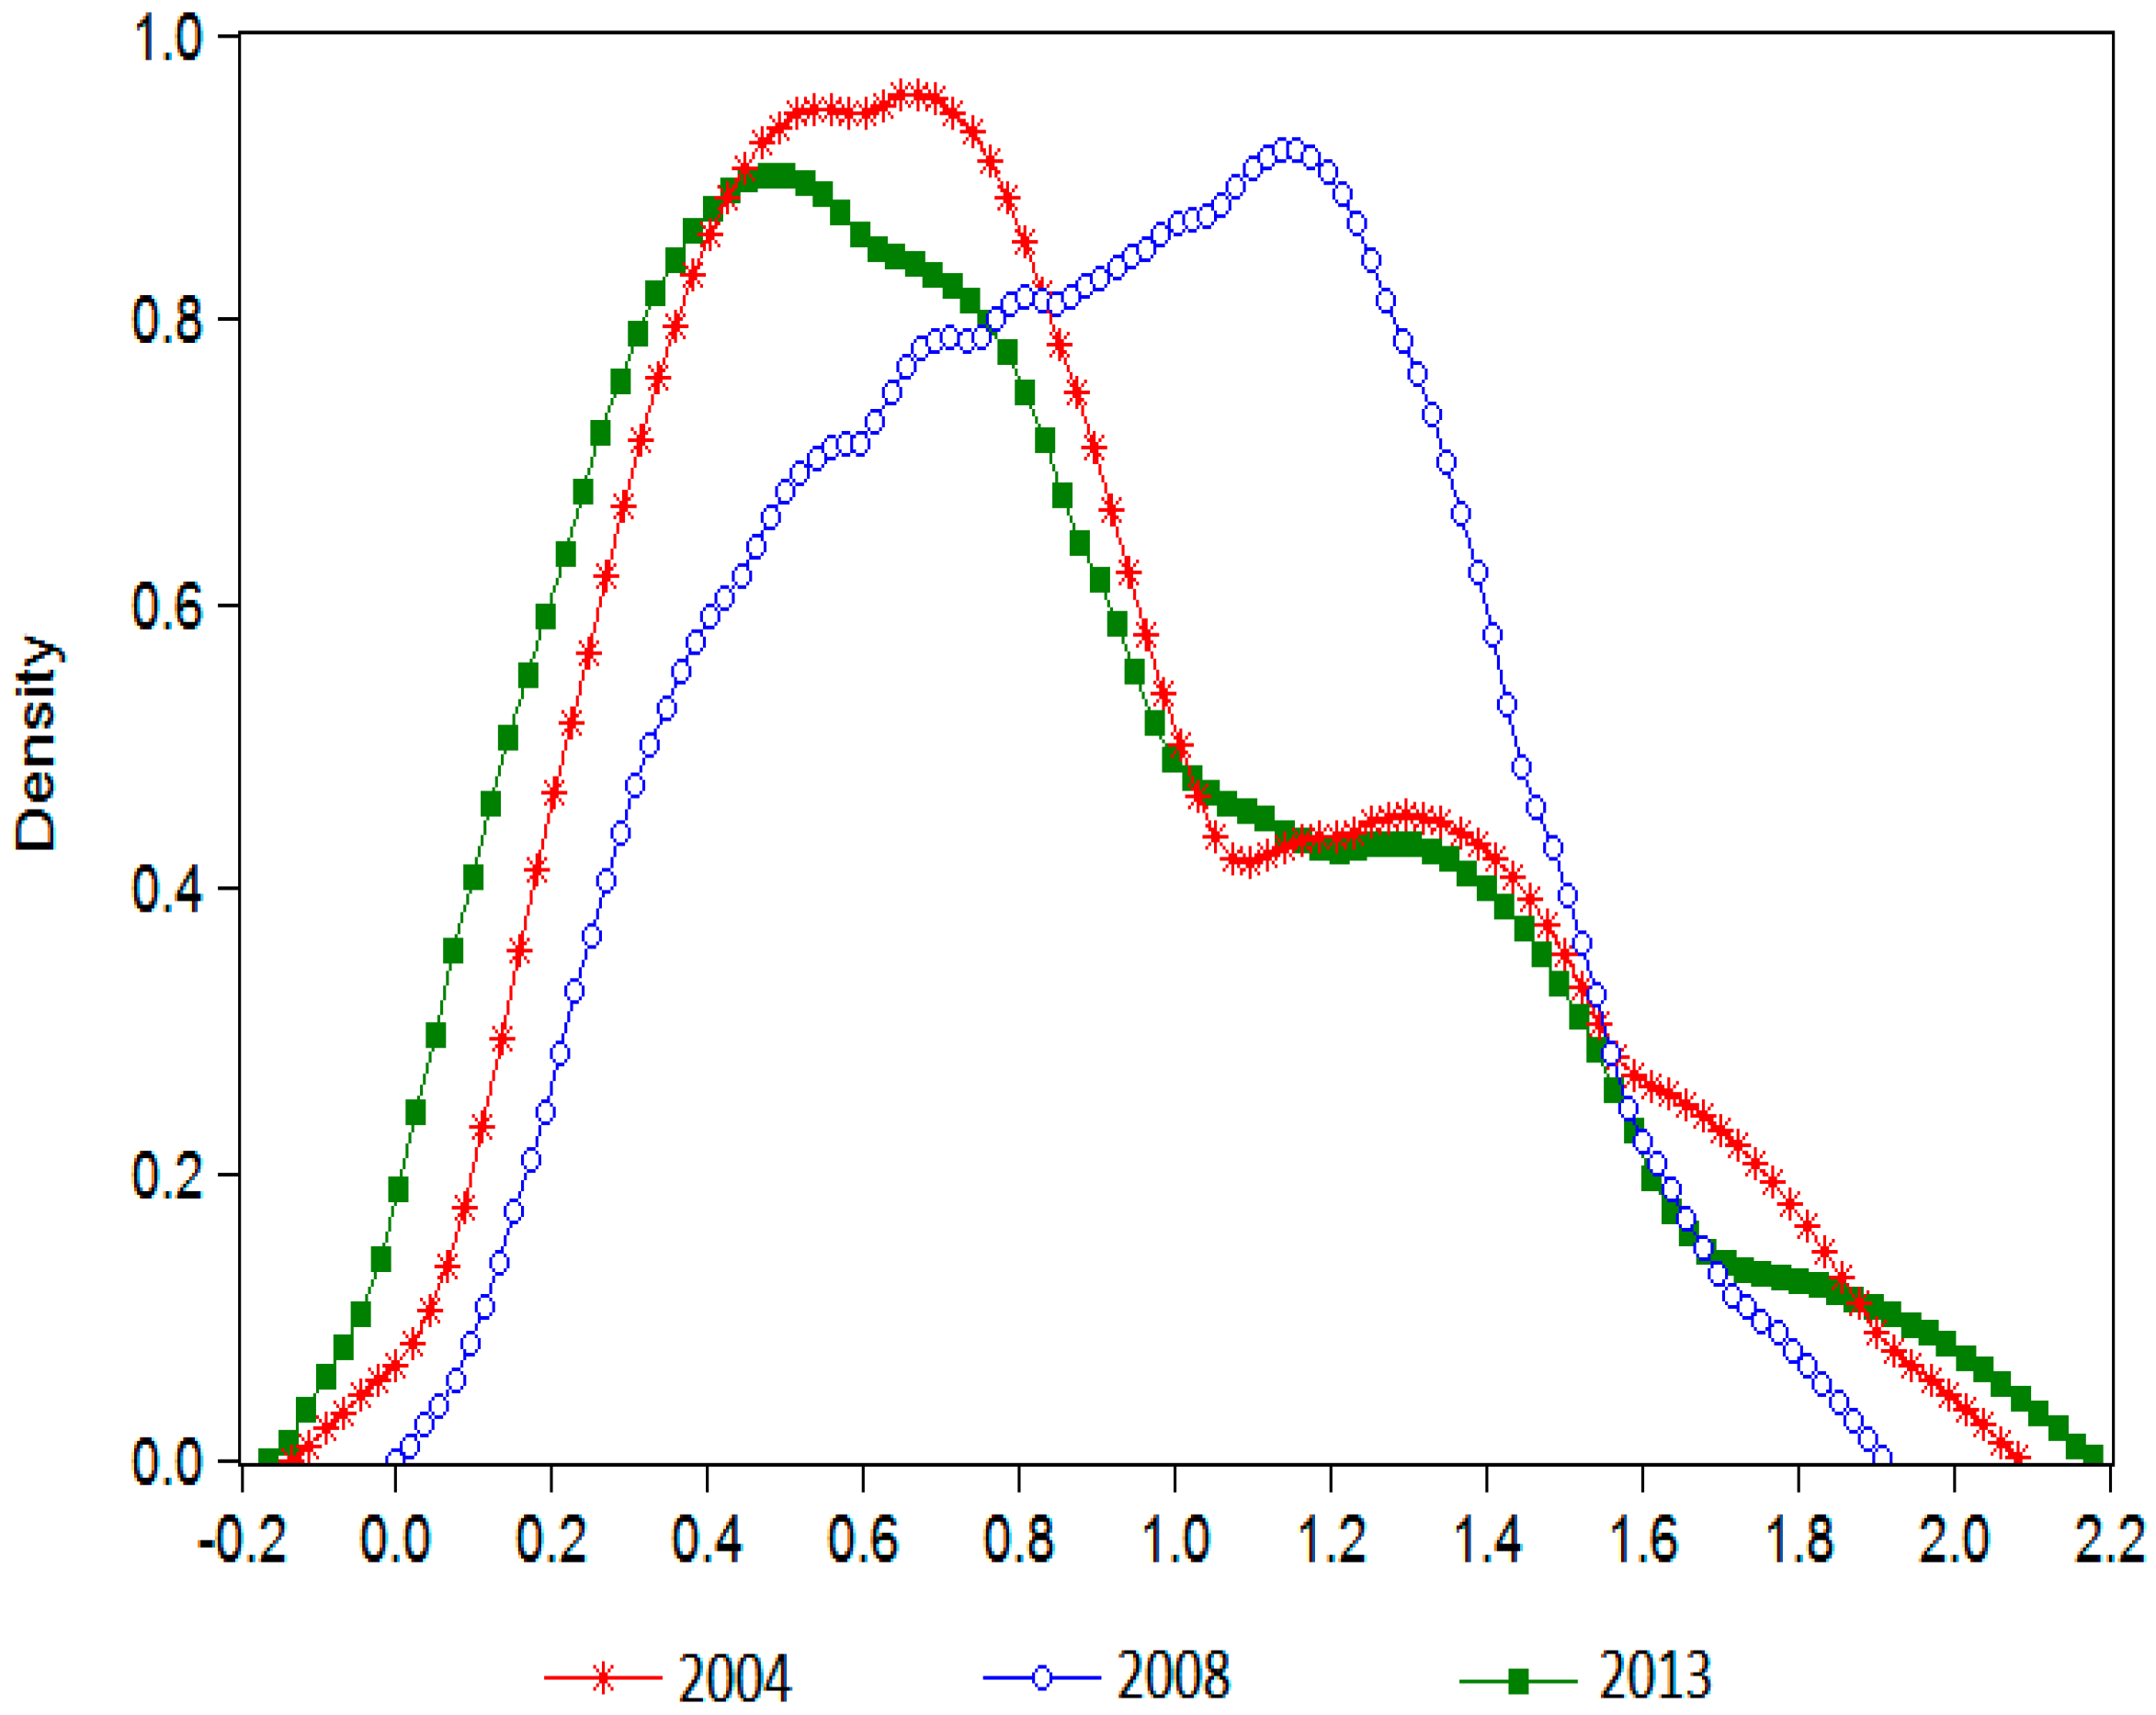
2.2.3. Kernel Density Estimation

For small sample events, it is not accurate to estimate the density function [46], with kernel density estimation representing a good solution to this problem as a non-parametric density estimation method [47,48,49]. For a random sample x1, x2, …, xn, the form of kernel density estimation is:
f ^ h ( x ) = 1 n h i = 1 n K ( x x i h )
In the formula, K ( x x i h ) is a weighted function, and the Gaussian kernel is used here according to the intensity of the packet data. The Gaussian kernel is expressed as 1 2 π e 1 2 t 2 . Based on Silverman [50], we choose the bandwidth, h, equals 0.9Sn − 0.8, which has greater versatility.

2.2.4. Hierarchical Cluster

The clustering process of hierarchical clustering, which is also called system clustering, is widely used [51], and is performed at a certain level. There are two types of hierarchical clustering: Q clustering and R clustering. Q clustering is used to cluster the samples, which are clustered together with similar characteristic values. R clustering is the clustering of variables, which are clustered together. Here, we used R clustering, with Euclidean distance as the fixed distance type variable:
d ( x i , x j ) = [ k = 1 p ( x i k x j k ) 2 ] 1 2
A distance matrix is formed when dij = d(xi, xj) and D = (dij)p×p:
[ 0 d 12 d 1 n d 21 0 d 2 n d 1 n d 2 n 0 ]
where dij = dji, and dij is the distance of i and j. According to the requirement of the Euclidean distance method, the Ward’s method which combined sum of squares of deviations together, is used for clustering. After Gp and Gq are combined into Gr, the recursive formula for the distance from the Gk is:
D r k 2 = n k + n p n r + n k D p k 2 + n k + n q n r + n k D q k 2 n k n r + n k D p q 2
where np, nk, nr, and nq are samples of Gp, Gk, Gr, and Gq, respectively.

2.3. Indicators

2.3.1. Selection of Indicators

Fourteen percent of the territorial area of China’s coastal areas support 38% of the country’s population, which is still increasing at a high rate. Thus, the high density and high growth rate of the coastal population is the main driving force for the development of marine economy and ecology. Here, we selected two indicators, natural population growth rate and population density, which reflect the problem of the high density of the population that we are currently facing. Since the population continues to increase, it must be addressed in coastal areas. In parallel, the population also reflects the situation of labor, corresponding to the use of labor as investment in the DEA model. Tourism and fisheries represent two other driving forces of development in coastal areas. Tourism, fisheries, and aquaculture reflect the driving force for natural resource endowment in various coastal provinces. China has always been committed to improving the level of urbanization, and urbanization reflects the momentum of economic development as a driving force.
Pressure originates from two sources, energy consumption and the destruction of the marine environment caused by human economic and social activities. Here, we selected three indicators to describe energy consumption; namely, per capita water use, per capita electricity consumption, and GDP energy intensity. Water and electricity consume most of the energy in agriculture and industry. GDP energy intensity is the main index to reflect the level of energy consumption and the condition of energy saving and consumption reduction. This indicator shows the extent of energy utilization in a country’s economic activities, and reflects the change of economic structure and energy use efficiency. We also selected two indicators to describe destruction; namely, wastewater discharge and solid waste discharge. Wastewater discharge, gas waste discharge, and solid waste discharge inform the industries formed the main pressure for the environment. The data on industrial waste gas emission are relatively lesser, so only wastewater discharge and solid waste discharge were selected for this study. Furthermore, energy consumption and destruction of the marine environment represent the energy and environmental capital input in the DEA model.
Under the influence of driving force and pressure, state describes the present situation of China’s coastal areas. Here, we selected four indicators to describe the economic situation; namely, marine secondary industry specific gravity, marine tertiary industry specific gravity, marine comparative labor productivity (CLP), and the proportion of the Gross Ocean Product in the Gross Regional Product. Marine secondary industry specific gravity and marine tertiary industry specific gravity can reflect the marine industrial structure in a coastal area. Marine comparative labor productivity (CLP) refers to the production capacity of each employee in the unit of time according to the value of production. It is an important indicator of the economic activity of an enterprise, and of the comprehensive performance of enterprise production, technology level, management level, technical proficiency, and labor enthusiasm of the workers. The formula for CLP is as follows:
C L P i = G O P i / i G O P i L A B O R i / i L A B O R i
In this formula, GOPi represents the GOP of the region i, and LABORi represents the number of jobs in the region i. The proportion of the Gross Ocean Product in the Gross Regional Product reflects the contribution of marine economy to regional economy. Its formula is as follows:
C M I i t = G O P i t G O P i t 1 G D P i t
In this formula, G O P i t G O P i t 1 represents the value added to the GOP of the region i in the year t, and G D P i t represents the GDP of this region.
We selected one indicator to describe the ecological situation; namely, water quality. We selected two indicators to describe the situation of society; namely, the Human Development Index (HDI) and Gini Coefficient. Good economic development has provided many favorable factors for the human society, and some of the most important factors are the healthy and long life, the acquisition of knowledge, and a decent living standard. HDI, which includes these three indicators, has been discussed by the United Nations in its 1990 human development report, and has gone through 25 years of continuous improvement. HDI was selected in this study to express the state of society, in order to show the general situation of human health, knowledge, and living standards. The Gini coefficient shows the fairness of social income distribution.
Affected by state, welfare selected the growth rate of the Gross Ocean Product to describe the situation of economic development, per capita Gross Ocean Product as social welfare status, and per capita marine ecosystem services and CO2 emissions as the ecological status. Gross Ocean Product is the final response to the all the ocean-related economic activities in the national economy. From the accounting framework, the accounting system of GOP is same with the GDP. Moreover, in view of this study being focused on the coastal area, it is more reasonable to choose GOP rather than GDP. The coastal area has been the fastest-growing region in China, which is vital to ocean contribution, and the growth rate of GOP has been greater than GDP in recent years in China. Therefore, in this study, the growth rate of GOP was selected to represent the economic development in coastal areas. However, when we selected the indicators to represent the level of social development, their statistical data reflecting the ocean-related per capita disposable income were unavailable. The principle that, under normal circumstances, greater per capita GDP means greater per capita disposable income is also true in coastal areas; thus, greater per capita GOP means greater ocean-related per capita disposable income. Therefore, we selected the per capita GOP to reflect the level of social welfare in coastal area. The marine ecosystem service is the benefit that people derive from the marine ecosystem directly or indirectly; therefore, the per capita marine ecosystem services were selected to represent the ecological benefits of coastal areas in this study.
Among these parameters, CO2 emissions represented negative indicators, representing the adverse effects caused by ecological destruction (e.g., vegetation damage) and the excessive use of fossil fuels. This paper regards CO2 emissions as a negative indicator, and takes the algorithm of negative indicator in the process of standardization of indicators. This means that when the value of CO2 emission is higher, the welfare level is poorer. Conversely, the lower the value of CO2 emission, the higher the welfare level. An important criterion for measuring the quality of people’s lives is the quality of the air. CO2 emission is directly related to air quality. Additionally, the negative indicators of CO2 emission can be used to measure the level of the welfare brought by the temperature, because CO2 emission is the main cause of the greenhouse effect and global warming.
For response, two indicators were selected to describe the change of economic development; namely, the degree of contribution of the marine industry and marine industrial structure change index. These parameters correspond to marine secondary industry specific gravity, marine tertiary industry specific gravity, and the proportion of the Gross Ocean Product in the Gross Regional Product in the state. Three indicators were selected to describe social progress with respect to the degree of openness, science and technology, and education; namely, international tourism (foreign exchange) income, revenue of marine scientific research institutions, and the status of education. Three indicators were selected to describe the response to poor ecological environment; namely, investment in environmental protection, marine reserves in coastal regions, and wastewater treatment rate.
Contribution degree of the marine industry. In May 2003, the strategic aim of “gradual establishment of powerful marine country” was definitely launched in “National Marine Economy Development Plan”, which guided China in the approach of implementing marine development and opening up of marine economy. In 2012, eighteen major reports of the Communist Party of China clearly proposed the strategic objectives of “improving the capacity of marine resource development and development of the marine economy”. A series of local documents also focus on the development of the ocean. These policy documents put the development of marine economy as the focus of future work, with the hope that the marine economy could promote regional economic development. The result of the implementation of these policies has been to improve the contribution rate of marine industry to regional economic development. Therefore, we selected the contribution degree of the marine industry to express the government’s support for the marine development.
Marine industrial structure change index. In the backdrop of the global economic crisis, China is adjusting and upgrading the industrial structure, and the marine industry is no exception. This industry adjustment is not simply to raise the proportion of the tertiary industries, which would have warranted selection of the proportion of tertiary industries as the indicator. For example, Hainan is an important tourist destination in China, and it has a high proportion of tertiary industries. The policy of reform of the industrial structure needs an increase in the proportion of the secondary industries in Hainan. That is the reason we chose marine industrial structure change index, rather than the proportion of the tertiary industries.
International tourism (foreign exchange) income. “China Ocean Agenda 21” and the “National Marine Economy Development Plan” proposed coastal tourism as a key for the marine industry. This indicator not only reflects the government’s support for coastal tourism, but also reflects the results of the government policy to improve the ecological environment. The government has introduced a number of policies for the ecological environment, but the extent to which these policies will improve the ecological environment is still unknown. As is obvious, a good ecological environment will attract more people to travel, especially in the coastal areas, which are based on the natural landscape rather than cultural landscape. Therefore, more tourism revenue also indicates a better ecological environment, indirectly. In addition, opening up to the outside world has been a basic national policy of China for a long time, especially in the coastal areas. This is the reason why we choose international tourism (foreign exchange) income, rather than the domestic tourism revenue. Moreover, international tourism (foreign exchange) income was selected as a response indicator because it can reflect the economic development, ecological environment, and the degree of opening to the outside world caused by the implementation of the policy.
Revenue of marine scientific research institutions. The marine economy has already been a new growth point of economic development. In this context, the developed countries in the world regard marine science and technology as the most important factor in accelerating the development of the marine economy, and China is no exception. Marine scientific research institutions are at the forefront of marine science and technology, and the country has invested a lot of money into such institutions. We would also like to include direct capital investment, which China provides to each province and city as an indicator but, unfortunately, reliable data in this regard are unavailable. Therefore, we choose revenue of marine scientific research institutions to reflect the government’s policy on marine science and technology.
The four indicators, the contribution degree of marine industry, the marine industrial structure change index, international tourism (foreign exchange) income, and the revenue of marine scientific research institutions, in response of Table 1 are the results of certain responses, rather than responses themselves. Most of the literature describes policy as indicators of response, and some reports directly used the number of policies as a response. There are some problems in this: the effectiveness of each policy is not same and the implementation of the policy has lagged behind. Therefore, if we want to quantify the policy, we can only take the results of the implementation of the policy as indicators. For this reason, in the present study, we selected the results of certain responses rather than the responses themselves. Two indicators, the marine reserves in coastal regions and the education situation are also the result of certain responses, which can reflect the results of the strength of environmental protection and education. Investment in environmental protection and wastewater treatment rate are direct indicators of response, which represent the effort to prevent environmental damage by human beings.

2.3.2. Processing of Indicators

The unit and the degree of importance of each index in the DPSWR framework differ. Thus, we adopted the data entropy method to deal with the data in DPSWR. The calculation steps for the entropy method are:
Original data normalization. If the increase in variable value results in a worse situation: x i j = ( x max x i j ) / ( x max x min ) . If the increase in variable value results in a better situation: x i j = ( x i j x min ) / ( x max x min ) . Where xij is the standardized value of an indicator for location i; xmax and xmin are the original values for location i, representing the highest value and the lowest value locations, respectively.
To quantify each index to the same degree, we should calculate the proportion of location i under index j: p i j = Z i j / i = 1 n Z i j , ( i = 1 , 2 , , n ; j = 1 , 2 , , m ) , where n represents the number of locations, and m represents the number of indices. Whereby:
  • Calculate the entropy (ej) of the index j: e j = k i = 1 n p i j ln ( p i j ) , where k = 1/ln(n), and ej0.
  • Calculate the coefficient of variation (gj) of index j: gj = 1-ej.
To normalize the coefficient of variation, calculate the weight (wj) of index j: w j = g j / j = 1 m g j (j = 1, 2, …, m).
The evaluation score (Fi) of location i is calculated as: F i = j = 1 m w j p i j .
Each indicator and its weight is shown in Table 1.

3. Results and Discussion

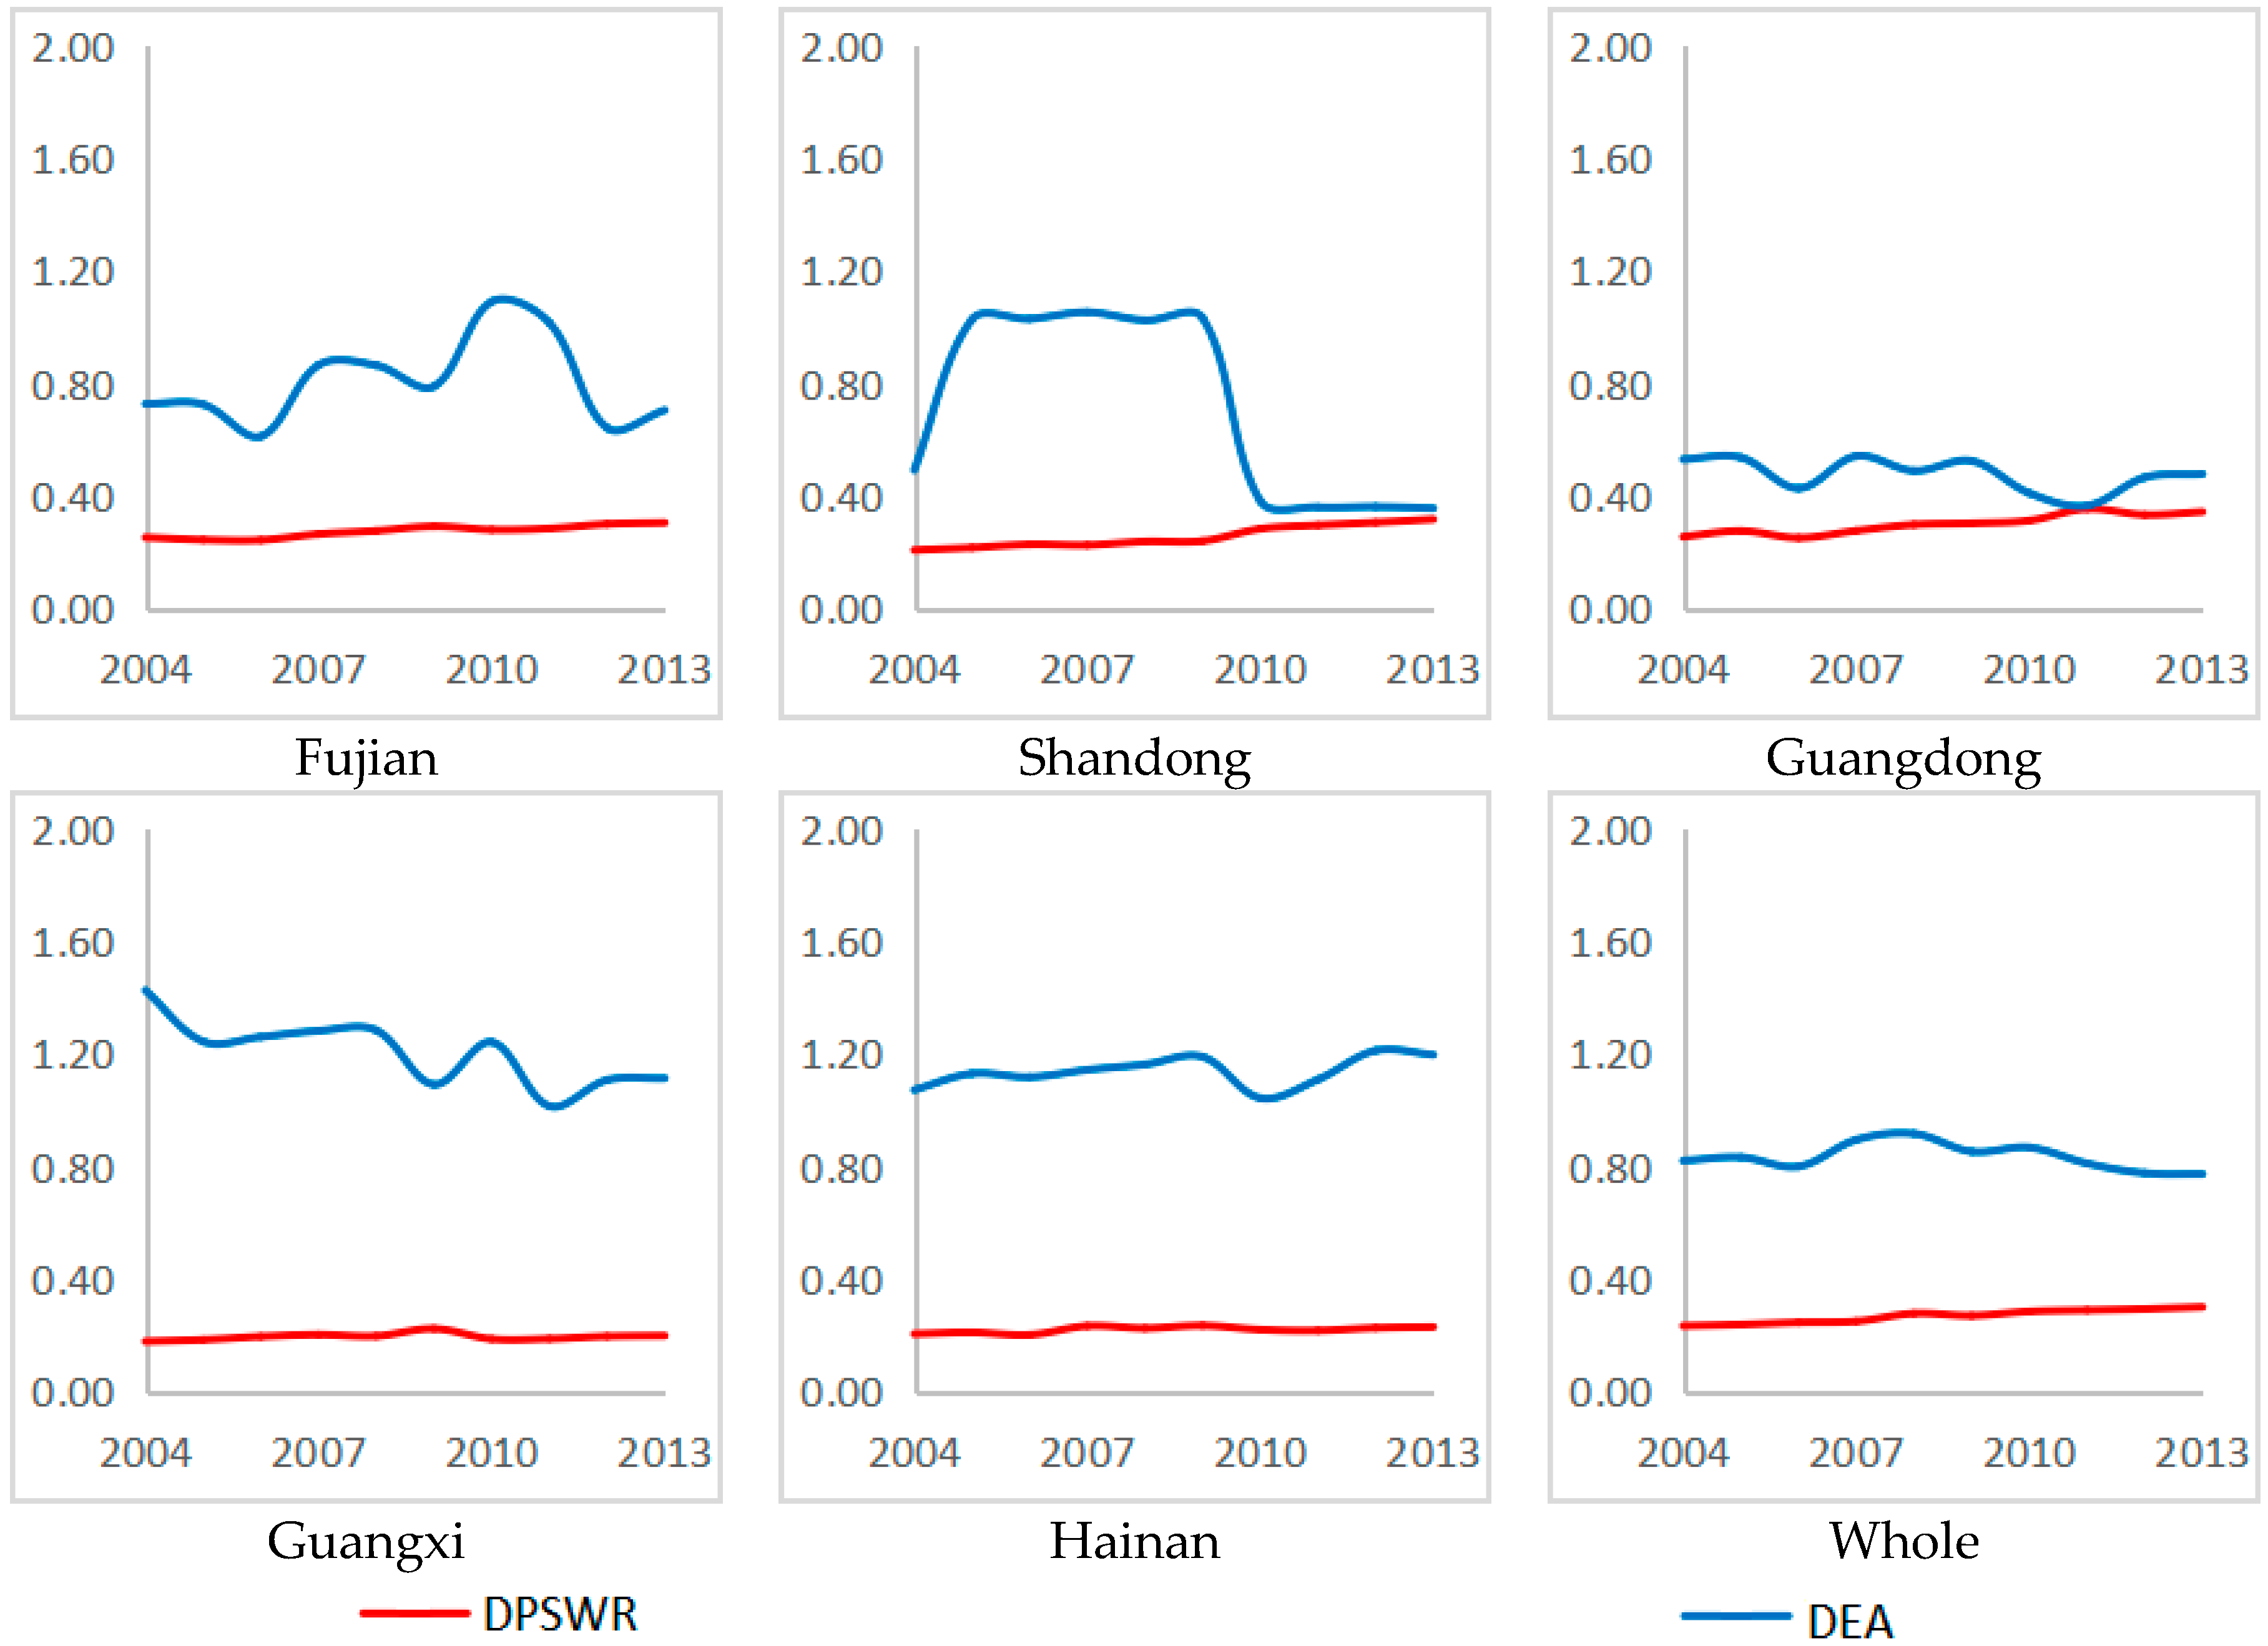
3.1. Efficiency Evaluation

The efficiency of each region was calculated by MaxDEA software (Beijing, China) for each year by using the evaluation value, which was calculated according to the weight of the entropy method (see Figure 4 for results). To show that there is no linear relationship between the efficiency value and the value of evaluation, we obtained the value for DPSWR (Figure 4).
The evaluation results of DPSWR using the data entropy method showed a steady trend, with minimal differences occurring among the various provinces and cities. Thus, the status of sustainable development was stable, remaining at the same level in China’s coastal area. This level was below 0.4, demonstrating that the efficiency analysis is very important and necessary.
Tianjin, Hebei, Guangxi, and Hainan have high efficiencies, which are basically maintained at more than 1. Thus, the efficiencies of these four provinces and cities are relatively effective. The efficiency of Fujian was maintained at 0.6–1, which was comparatively high to the other areas. The efficiencies of Liaoning, Shanghai, Zhejiang, and Guangdong were mostly maintained at 0.4–0.6, indicating a relatively low sustainable development efficiency of these four provinces. The efficiency of Jiangsu remained below 0.4, indicating it is relatively ineffective.
The efficiency in Shandong changed over time. It was relatively ineffective in 2004 (below 0.5), became highly effective from 2005 to 2009 (exceeding 1), and became ineffective again in 2010–2013 (falling below 0.4). We hypothesize that the decline in the efficiency of Shandong after 2009 was caused by an increase in the overall level of sustainable development. The main reason for this phenomenon is because the revenue of marine scientific research institutions, which is an important response indicator, increased more than 10 times from 1847.47 million yuan in 2009 to 18,897.31 million yuan in 2010. In contrast, the state and welfare did not change to a similar degree in this short time, resulting in a decrease in efficiency. However, this result should not be treated with pessimism, because the increase in investment in science and technology will be reflected through various achievements in forthcoming years, with an increase in efficiency representing one of these achievements.
In 2011 and 2012, the whole efficiency of the coastal provinces and cities was more than 0.8, indicating that China’s coastal areas were relatively efficient, but that there remained room for growth. To make further comparisons, we analyzed the efficiencies in relation to time and space dimensions.

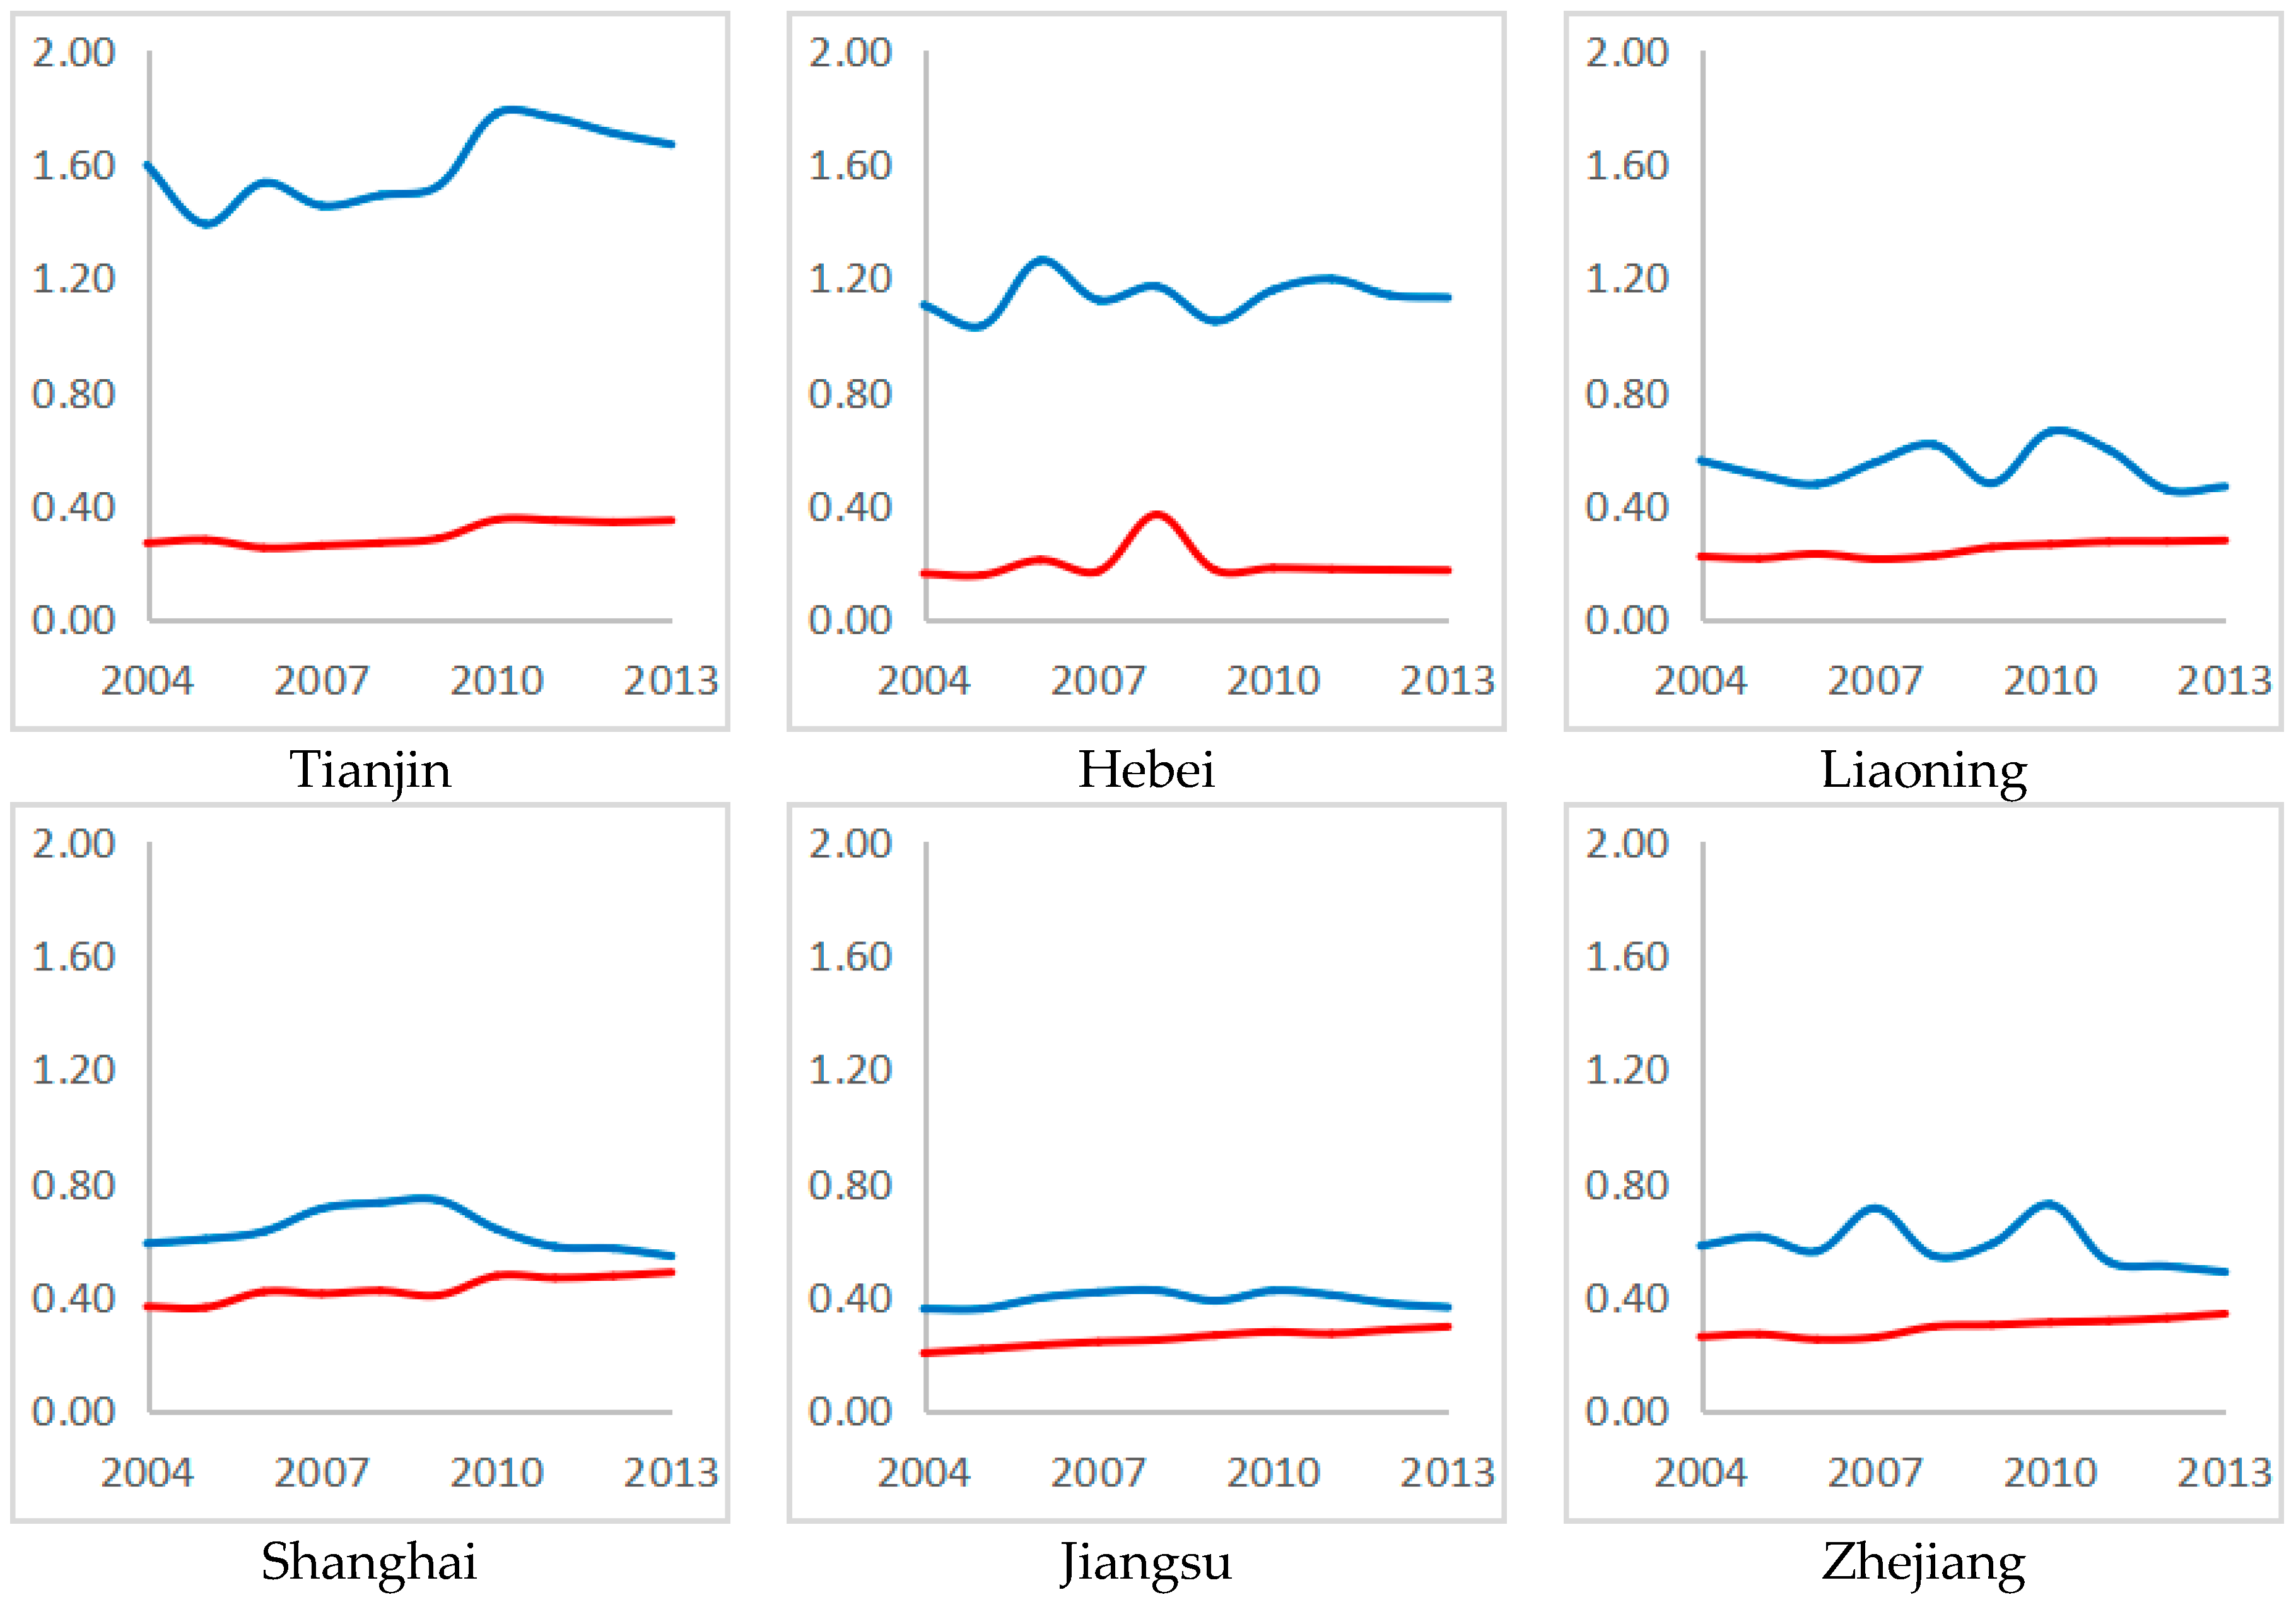
3.2. Time Series Analysis

We selected the efficiency results from 2004, 2008, and 2013, and incorporated them in the kernel density estimation using Eviews 8.0 (Denver, CO, USA) (see Figure 5 for the results).
The shape of the efficiency distribution (Figure 5) shows that efficiency presented a significantly skewed distribution, and did not form a single peak. The efficiency distribution was skewed to the left from 2004 to 2013, but weakened in 2008. This pattern indicates that the ratio of provinces and cities with high efficiencies increased from 2004 to 2008, and decreased from 2008 to 2013. The position of the efficiency distribution shows that the efficiency of marine sustainable development shifted to the right and then to the left. This pattern indicates that the efficiency of China’s coastal area increased and then decreased. The kurtosis of the efficiency distribution showed that the value of efficiency, which corresponded to the peak, first increased and then decreased. This pattern shows that the proportion of provinces and cities with high efficiency declined, following an initial increase. In parallel, the efficiency distribution showed a development situation from a sharp peak to a wide peak, and returned to a sharp peak again from 2004 to 2013. The kurtosis in 2004 was similar to 2013, which was mostly due to the low efficiency of the provinces and cities. The area that corresponded to the peak of efficiency distribution in 2008 was large, indicating that efficiency improved in most provinces and cities from 2004 to 2008, with noticeable acceleration in provinces and cities with low efficiency.
The time trend of efficiency was basically consistent with the development of China’s marine economy. After joining the WTO in 2001 and adopting a more open market accession, China’s marine economy developed rapidly after 2003, with 16.05% average growth rate of Gross Ocean Production from 2004 to 2007. However, because China was affected by the global economic crisis, its marine economy developed slowly, with 9.88% average growth rate of Gross Ocean Production from 2008 to 2013. The speed of economic growth affected changes to efficiency, both directly and indirectly, which also explains the change in the efficiency distribution of the time series.

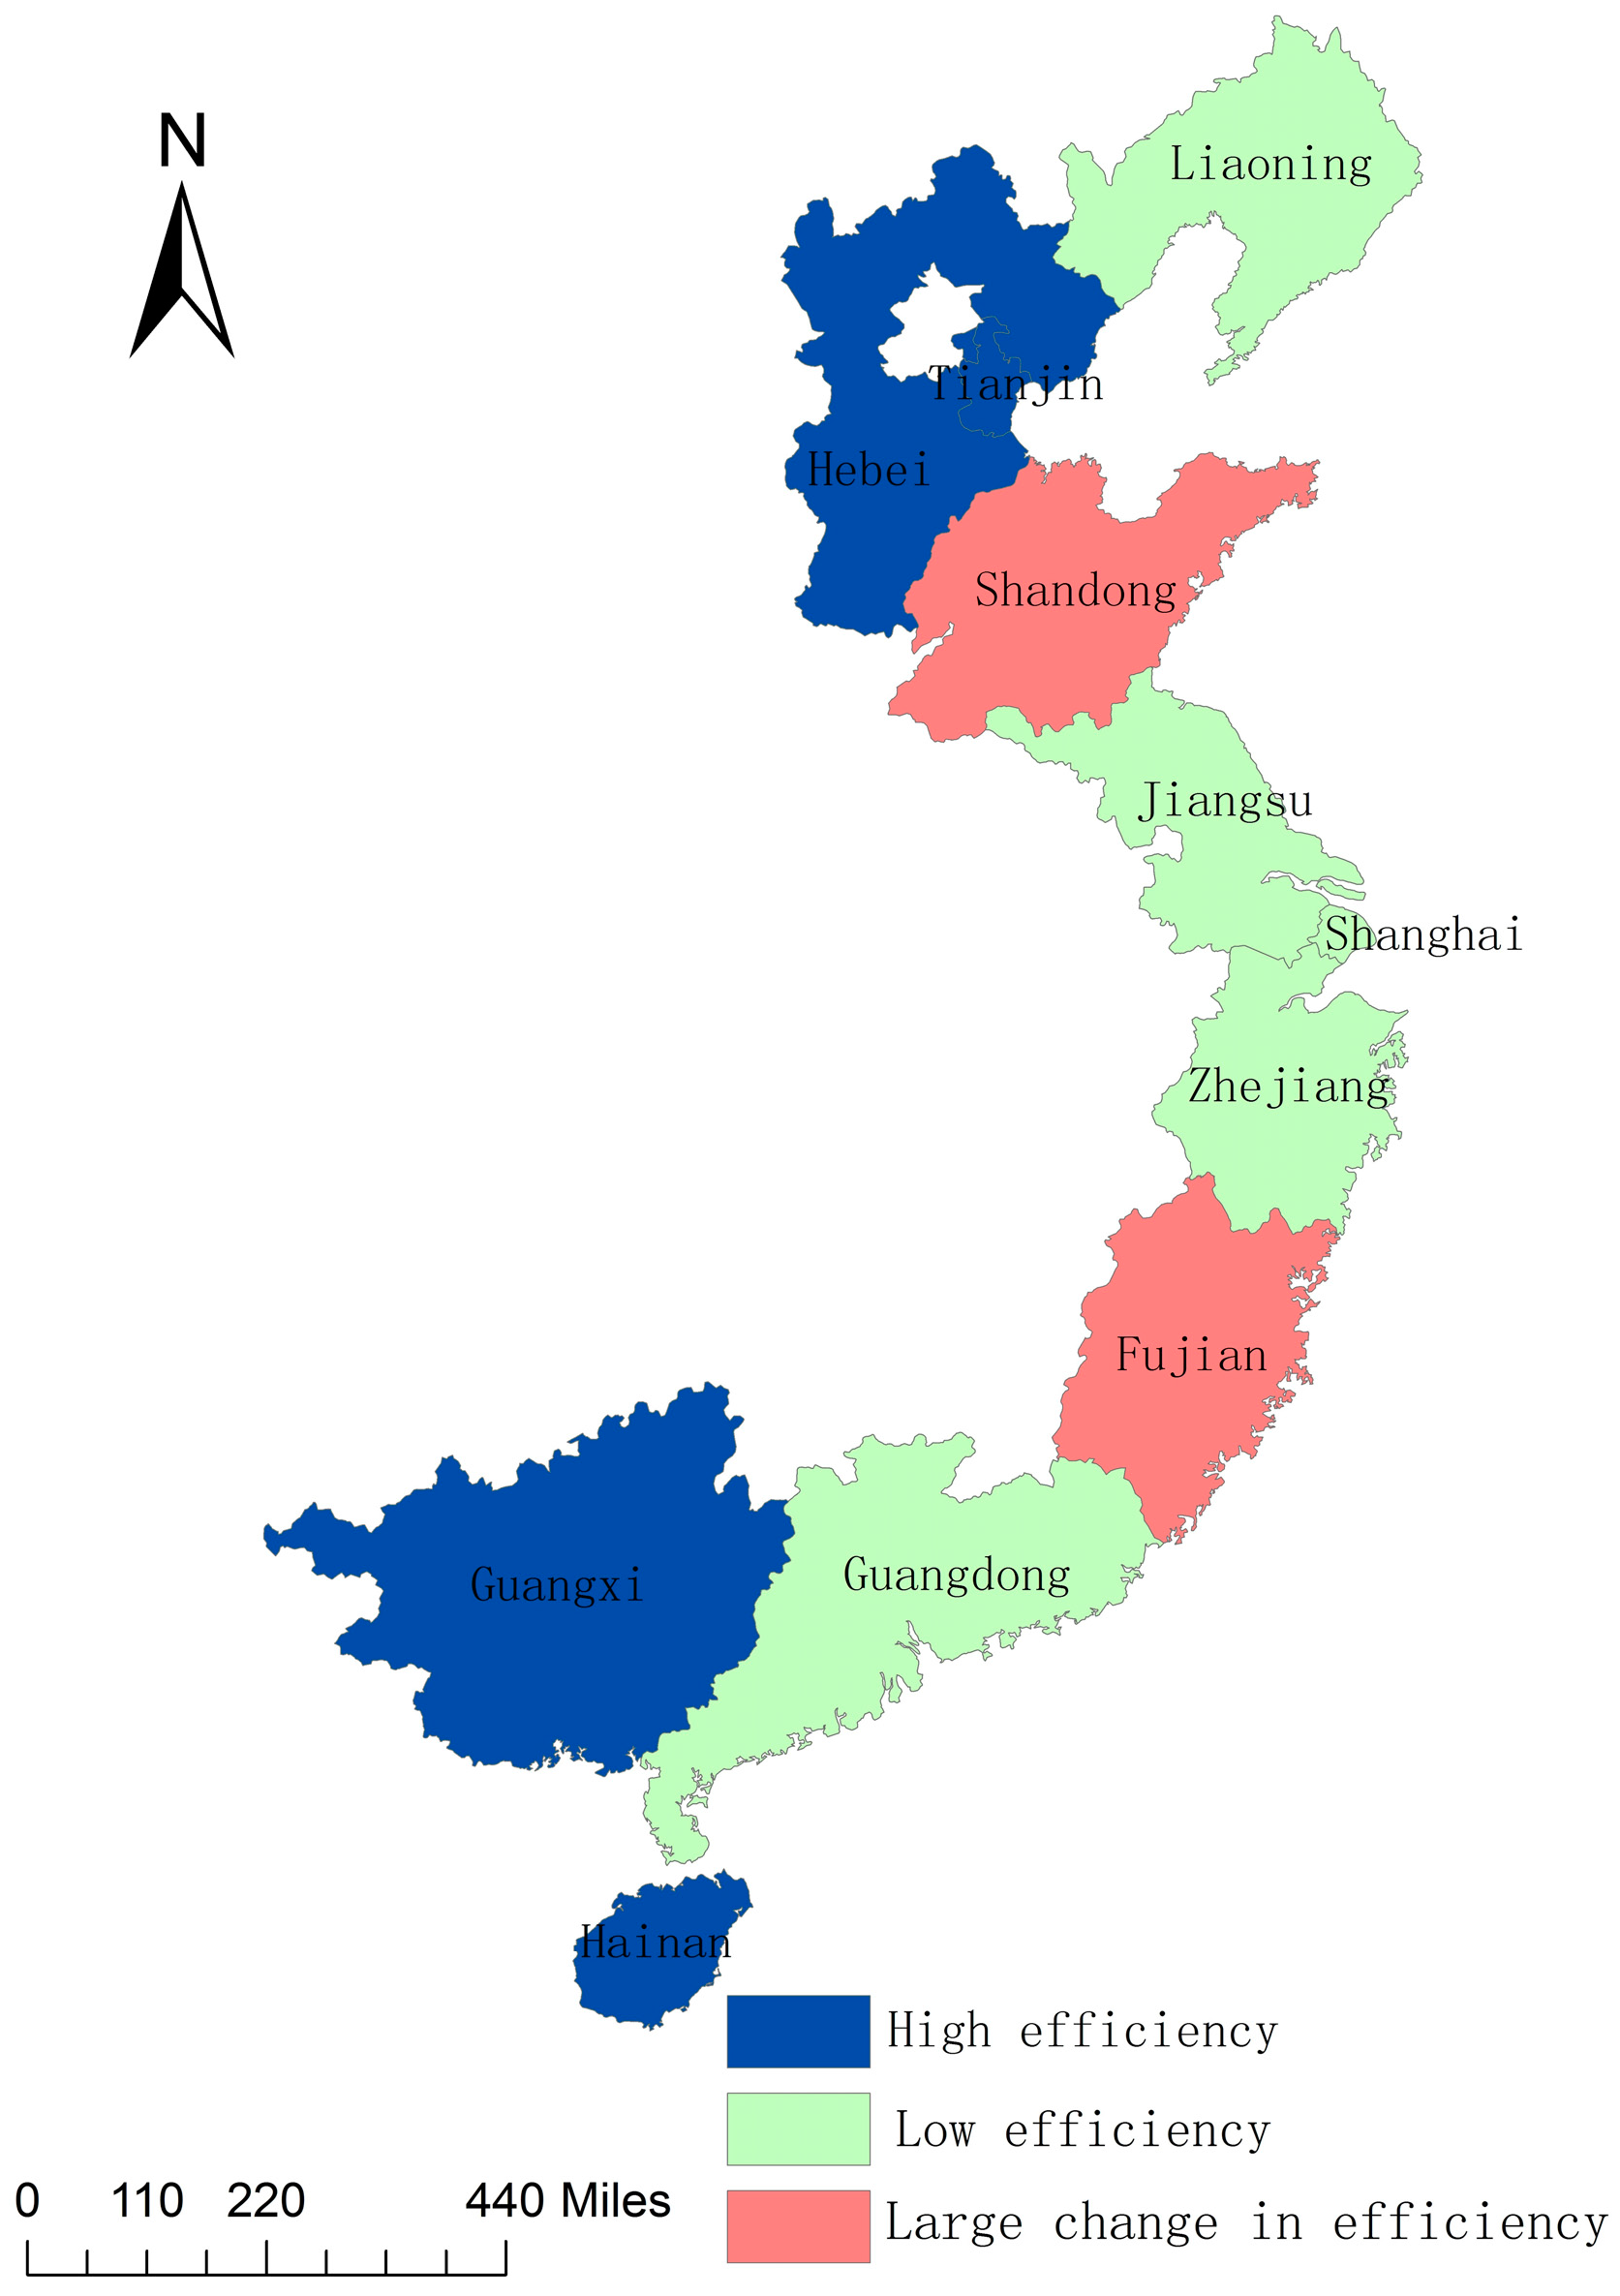
3.3. Space Sequence Analysis

We incorporated the efficiency values of each province and city in Equation (6) using SPSS 19.0 (Chicago, IL, USA) software to evaluate the hierarchical clustering (see Figure 6 for results).
The 11 coastal provinces and cities were separated into three categories: high efficiency, low efficiency, and greater changes in efficiency, based on the hierarchical cluster (Figure 6). The classification results of Figure 6 and the efficiency changes shown in Figure 4, we show that Liaoning, Shanghai, Jiangsu, Zhejiang, and Guangdong belong to a low efficiency group of 0.4–0.6, with a small change in scope (i.e., <0.2). Tianjin, Hebei, Guangxi, and Hainan belong to a high efficiency group of >1.0, with a greater change in scope (0.4). Shandong and Fujian belong to a high efficiency group (average of 0.8 and 0.7 for Fujian and Shandong, respectively), with the largest change in scope (with extremes of 0.48 and 0.03 in Fujian and 0.70 and 0.12 in Shandong).
While the results were divided according to the trend of change in the variables (Figure 6), the results minimally differed to those obtained for variable size. This phenomenon showed that the efficiency of China’s coastal areas is basically stable, with large fluctuations being rare. Furthermore, the four provinces and cities with the highest efficiency were located at the ends of the northern (Bohai Sea Ring) and southern (South China Sea) coastal areas, respectively. These four provinces and cities radiate far inland, and have the geographical advantages of trade with China’s neighbors, which contribute to their high efficiency.

4. Conclusions and Suggestions

At present, most studies evaluating sustainable development are based on the evaluation score of the index system. The DPSWR framework represents an important evaluation method of this index system because it incorporates welfare. However, for regions with similar evaluation results (e.g., Figure 4), the efficiency analysis helps guide policy-makers and environmental protectors on the direction of sustainable development. In parallel, The DEA model is widely used for evaluating efficiency, but is subject the indicators being selected, with grey correlation and principal component analysis failing to resolve this issue of comprehensive selection. In contrast, the DPSWR framework provides a good foundation for selecting reliable indicators for the DEA model.
Here, we used the combined DPSWR framework and DEA model to measure the efficiency of sustainable development in various provinces and cities of China’s coastal areas. Four provinces and cities (Tianjin, Hebei, Guangxi, and Hainan) were found to be relatively effective. Fujian was relatively effective too, whereas Liaoning, Shanghai, Zhejiang, and Guangdong had low effectiveness, along with Jiangsu. Shandong was relatively effective from 2004 to 2007, but was relatively ineffective level from 2008 to 2013. Analysis from the time dimension showed that the efficiency of China’s coastal areas changed with the marine economy, which increased from 2004 to 2007, and then return to the original level. From the perspective of space analysis, Tianjin, Hebei, Guangxi, and Hainan had high efficiency, whereas Liaoning, Shanghai, Jiangsu, Zhejiang, and Guangdong had low efficiency. Shandong and Fujian formed a third group with a large amplitude in variation across time. Although variation in the amplitude of efficiency at Fujian and Shandong are large, rules remain. The fluctuation in efficiency was around 0.8 in Fujian, initially exceeding 1.0 from 2004 to 2007, and then changing to 0.35 from 2008 to 2013 in Shandong.
The results of some studies using DEA to calculate efficiency are often very large in a short period of time; however, this is not consistent with the actual situation. If there is no major economic turmoil or policy support, efficiency in a short period of time cannot result in a large change. Large variation in efficiency values is mainly caused by large variation in the selected indicators; thus, it is more valuable for choosing more comprehensive evaluation indicators. According to the efficiency of DPSWR indicators, efficiency in a short period of time was mostly maintained at the same level in this study, which is closer to the actual situation. The classification result of the spatial analysis and according to efficiency value size were similar, despite changes to the classification of variable. Thus, this technique will help direct policy-makers by providing more accurate and comprehensive efficiency results, ensuring focus is correctly placed on low efficiency areas or area with major changes in efficiency.
To enhance efficiency, output must be improved and input reduced. We should reduce input to reduce the input of driving forces, pressure, and response. However, we should also improve the level of state and welfare, which is the output of the efficiency. The augmentation of the driving force and the response provides positive support for the increase in state and welfare. Therefore, to improve efficiency, we must allocate reasonable driving force and response factors. In parallel, we must reduce the consumption of energy and environmental resources, which are indicators of pressure. As the output, the internal elements of state and welfare should be increased with emphasis, rather than being based on the average distribution of limited resources in the different areas with respect to the degree of importance. For instance:
Driving force. Population density accounts for a very large proportion (34%). China’s coastal areas support high population densities. To ease this problem, we must increase the driving effect of the economy from coastal provinces and cities to inland provinces and cities, facilitating a shift in the population to inland provinces and cities. To improve efficiency, we should reduce the number of people and improve the quality of life of the population, both physically and mentally, by increasing investment in education and health. Tourism and urbanization are important for sustainable development, and must continue to be improved and strengthened, despite representing a small percentage in DPSWR. In addition, there is a small gap between the percentage of fisheries and aquaculture, which should be utilized by reducing fisheries and promoting the development of aquaculture.
Pressure. Each pressure indicator was associated with the environment or energy consumption. Thus, to improve the efficiency, we must reduce the input of these indicators. Based on the weight of each indicator, we know how to reduce the consumption of these categories. For energy consumption, GDP energy intensity represents the largest percentage, and is calculated from standard coal consumption. In contrast, the percentage of per capita electricity consumption is the smallest. Thus, we should reduce the consumption of standard coal, and use electricity or other cleaner sources of energy instead. Per capita water use also accounted for a certain percentage; thus, we should strengthen water saving education, and improve the way of water use, to reduce overall water consumption. The percentage of two indicators in environmental consumption, wastewater discharge and solid waste discharge, was also very large. Strengthening waste water purification technology and improving the comprehensive utilization of solid wastes is imminent.
Response. Revenue generated by marine scientific research institutions, marine reserves in coastal regions, and international tourism (foreign exchange) income accounted for the largest response percentage. However, these three indicators are the main responses to promote sustainable development as inputs. Therefore, we should continue to increase investment in science and technology, environmental protection, and openness to improve the efficiency. The degree of contribution of the marine industry, wastewater treatment rate, and education status accounted for the smallest response percentage. Despite the increased amount of these three response indicators, they had a small effect at improving efficiency, but did contribute towards improving the overall level of sustainable development. Therefore, we should continue to increase investment in the marine industry for overall economic support, as well as improve the wastewater treatment rate and increase investment in education.
State. Two indicators for evaluating the social state, HDI and the Gini coefficient, accounted for 36% of state; thus, strengthening policy support of social parameters is particularly important, especially for the improvement of the Gini coefficient, which means promoting social justice. The percentage of the Gross Ocean Product in the Gross Regional Product accounted for 20% of state; thus, continuing to strengthen the construction of the marine industry is important for improving sustainable development. In addition, the percentage of marine tertiary industry specific gravity was greater than the marine secondary industry specific gravity; thus, transferring the percentage of the marine tertiary industry to the secondary industry, and optimizing the industrial structure, could improve efficiency.
Welfare. The per capita Gross Ocean Product accounted for the largest percentage of welfare, and was greater than the sum of the percentage of any other two indicators combined. Therefore, it is important to improve the per capita Gross Ocean Product to enhance welfare. We must broaden marine innovation and investment channels, optimize industrial structure, promote the development of high-tech industry to construct the whole industrial chain of the innovation network for the marine environment, and promote the upgrading and transformation of the whole industrial chain. Per capita marine ecosystem services also accounted for more than a quarter of the percentage, thereby increasing investment in environmental protection. Furthermore, the supervision of environmental protection policies must be strengthened.

Acknowledgments

This article has been funded by the Minister of Education (MOE)’s Project of Key Research Institutes of Humanities and Social Sciences in Universities (No. 12JJD790032) and the Chinese National Natural Science Foundation (No. 41301129). And corrected by Editage (http://www.editage.cn/) in English. Constructive suggestions and comments on the manuscript from the reviewer(s) and editor(s) are appreciated.

Author Contributions

Song Wang, Caizhi Sun, Xin Li, and Wei Zou produced the paper and all co-authors contributed to the data collection and calculations.

Conflicts of Interest

The authors declare no conflict of interest.

References

  1. Sun, C.Z.; Zhang, K.L.; Zou, W.; Li, B.; Qin, X.H. Assessment and evolution of the sustainable development ability of human–ocean systems in coastal regions of China. Sustainability 2015, 7, 10399–10427. [Google Scholar] [CrossRef]
  2. Halpern, B.S.; Longo, C.; Hardy, D.; McLeod, K.L.; Samhouri, J.F.; Katona, S.K.; Kleisner, K.; Lester, S.E.; O’Leary, J.; Ranelletti, M. An index to assess the health and benefits of the global ocean. Nature 2012, 488, 615–620. [Google Scholar] [CrossRef] [PubMed] [Green Version]
  3. Visbeck, M.; Kronfeld-Goharani, U.; Neumann, B.; Rickels, W.; Schmidt, J.; van Doorn, E.; Matz-Lück, N.; Ott, K.; Quaas, M.F. Securing blue wealth: The need for a special sustainable development goal for the ocean and coasts. Mar. Policy 2014, 48, 184–191. [Google Scholar] [CrossRef] [Green Version]
  4. NDRC; SOA. Report on the Development of China’s Marine Economy (2015); Ocean Press: Beijing, China, 2015; pp. 3–20. (In Chinese)
  5. Cui, F.; Song, N. Report on the Development of Ocean Society of China (2015); Social Sciences Academic Press: Beijing, China, 2015; pp. 1–7. (In Chinese) [Google Scholar]
  6. Li, H.Y.; Wang, H.L.; Guo, J.L.; Feng, J.F. Evaluation of the marine ecological-economic sustainable development based on DEA. Ocean Technol. 2007, 26, 101–104. (In Chinese) [Google Scholar]
  7. Zheng, Y.; Zhou, Y.Q. Measures of the fishing capacity of Chinese marine fleets and discussion of the methods. J. Oceanogr. 2005, 61, 623–630. (In Chinese) [Google Scholar] [CrossRef]
  8. Griffin, W.L.; Woodward, R.T. Determining policy—Efficient management strategies in fisheries using data envelopment analysis (DEA). Mar. Policy 2011, 35, 496–507. [Google Scholar] [CrossRef]
  9. Vázquez, R.I.; Tyedmers, P. Identifying the importance of the “skipper effect” within sources of measured inefficiency in fisheries through data envelopment analysis (DEA). Mar. Policy 2013, 38, 387–396. [Google Scholar] [CrossRef]
  10. Pham, T.D.T.; Huang, H.W.; Chuang, C.T. Finding a balance between economic performance and capacity efficiency for sustainable fisheries: Case of the Da Nang gillnet fishery, Vietnam. Mar. Policy 2014, 44, 287–294. [Google Scholar] [CrossRef]
  11. Thøgersen, T.T.; Pascoe, S. Combining performance measures to investigate capacity changes in fisheries. Appl. Econ. 2014, 46, 57–69. [Google Scholar] [CrossRef]
  12. González-García, S.; Villanueva-Rey, P.; Belo, S.; Vázquez-Rowe, I.; Moreira, M.T.; Feijoo, G.; Arroja, L. Cross-vessel eco-efficiency analysis: A case study for purse seining fishing from North Portugal targeting European pilchard. Int. J. Life Cycle Assess. 2015, 20, 1019–1032. [Google Scholar] [CrossRef]
  13. Lee, J.S. Directions for the sustainable development of Korean small and medium sized shipyards. Asian J. Shipp. Logist. 2013, 29, 335–360. [Google Scholar] [CrossRef]
  14. Park, J.; Lee, D.; Zhu, J. An integrated approach for ship block manufacturing process performance evaluation: Case from a Korean shipbuilding company. Int. J. Prod. Econ. 2014, 156, 214–222. [Google Scholar] [CrossRef]
  15. Huang, Y.; Peng, J. Efficiency evaluation between port logistics and economic growth by DEA: A case study of Zhejiang province. J. Appl. Sci. 2014, 14, 2594–2600. [Google Scholar]
  16. Birgun, S.; Akten, N. Relative efficiencies of seaport container terminals: A DEA perspective. Int. J. Integr. Supply Manag. 2005, 1, 442–456. [Google Scholar] [CrossRef]
  17. Zhao, X.; Guo, K.Y. Efficiency analysis and evaluation of marine economy in coastal areas based on the GRA-DEA mixed model. Mar. Econ. 2012, 2, 6–10. (In Chinese) [Google Scholar]
  18. Yuan, Q.M.; Qu, J.; Ning, N.N. Evaluation research on Tianjin marine economy sustainable development via PCA and DEA. Mar. Environ. Sci. 2014, 33, 798–803. (In Chinese) [Google Scholar] [CrossRef]
  19. Xu, Y. Social Assessment of Agro-Processing Projects of Agricultural Industrialization Based on the Concept of Sustainable Development; Southwestern University of Finance and Economics: Chengdu, China, 2011; pp. 1–60. (In Chinese) [Google Scholar]
  20. Karageorgis, A.P.; Kapsimalls, V.; Kontogianni, A.; Skourtos, M.; Turner, N.R.; Salomons, W. Impact of 100-year human interventions on the deltaic coastal zone of the inner Thermaikos Gulf (Greece): A DPSIR framework analysis. Environ. Manag. 2006, 38, 304–315. [Google Scholar] [CrossRef] [PubMed]
  21. Pacheco, A.; Carrasco, A.R.; Vila-Concejo, A.; Ferreira, O.; Dias, J.A. A coastal management program for channels located in backbarrier systems. Ocean Coast. Manag. 2007, 50, 119–143. [Google Scholar] [CrossRef]
  22. Kohsaka, R. Developing biodiversity indicators for cities: Applying the DPSIR model to Nagoya and integrating social and ecological aspects. Ecol. Res. 2010, 25, 925–936. [Google Scholar] [CrossRef]
  23. Atkins, J.P.; Gregory, A.J.; Burdon, D.; Elliott, M. Managing the marine environment: Is the DPSIR framework holistic enough? Syst. Res. Behav. Sci. 2011, 28, 497–508. [Google Scholar] [CrossRef]
  24. Gregory, A.J.; Atkins, J.P.; Burdon, D.; Elliott, M. A problem structuring method for ecosystem-based management: The DPSIR modelling process. Eur. J. Oper. Res. 2013, 227, 558–569. [Google Scholar] [CrossRef]
  25. Research Group of the Institute of Marine Development Strategy of State Oceanic Administration. China’s Ocean Development Report; Ocean Press: Beijing, China, 2015; pp. 109–122. (In Chinese) [Google Scholar]
  26. OECD. OECD Core Set of Indicators for Environmental Performance Reviews: A Synthesis Report; Organization for Economic Co-Operation and Development, Environmental Monographs: Paris, France, 1993. [Google Scholar]
  27. EEA Report. Environmental Indicators: Typology and Overview. 1999. Available online: http://reports.eea.europa.eu/TEC25/en/tech_25_text.pdf (accessed on 19 September 2016).
  28. Ness, B.; Anderberg, S.; Olsson, L. Structuring problems in sustainability science: The multi-level DPSIR framework. Geoforum 2010, 41, 479–488. [Google Scholar] [CrossRef]
  29. Feld, C.K.; Sousa, J.P.; Da Silva, P.M.; Dawson, T.P. Indicators for biodiversity and ecosystem services: Towards an improved framework for ecosystems assessment. Biodivers. Conserv. 2010, 19, 2895–2919. [Google Scholar] [CrossRef]
  30. Gabrielsen, P.; Bosch, P. Internal Working Paper Environmental Indicators: Typology and Use in Reporting; European Environment Agency: Copenhagen, Denmark, 2003. [Google Scholar]
  31. Hou, Y.; Zhou, S.D.; Burkhard, B.; Muller, F. Socioeconomic influences on biodiversity, ecosystem services and human well-being: A quantitative application of the DPSIR model in Jiangsu, China. Sci. Total Environ. 2014, 490, 1012–1028. [Google Scholar] [CrossRef] [PubMed]
  32. Kristensen, P. The DPSIR Framework. In Proceedings of the Workshop on a Comprehensive/Detailed Assessment of the Vulnerability of Water Resources to Environmental Change in Africa Using River Basin Approach River Basin Approach, Nairobi, Kenya, 27–29 September 2004.
  33. Pinto, R.; de Jonge, V.N.; Neto, J.M.; Domingos, T.; Marques, J.C.; Patrício, J. Towards a DPSIR driven integration of ecological value, water uses and ecosystem services for estuarine systems. Ocean Coast. Manag. 2013, 72, 64–79. [Google Scholar] [CrossRef]
  34. Fu, L.P.; Shao, Y. Evaluation on low-carbon urbanization of Tianjin city based on DPSWR model. J. Chongqing Univ. Technol. Nat. Sci. 2015, 29, 124–129. (In Chinese) [Google Scholar]
  35. Bowen, R.E.; Riley, C. Socio-economic indicators and integrated coastal management. Ocean Coast. Manag. 2003, 46, 299–312. [Google Scholar] [CrossRef]
  36. Cooper, P. Socio-ecological accounting: DPSWR, a modified DPSIR framework, and its application to marine ecosystems. Ecol. Econ. 2013, 94, 106–115. [Google Scholar] [CrossRef] [Green Version]
  37. Gilbert, A.J.; Alexander, K.; Sardá, R.; Brazinskaite, R.; Fischer, C.; Gee, K.; Jessopp, M.; Kershaw, P.; Los, H.J.; Morla, D.M.; et al. Marine spatial planning and Good Environmental Status: A perspective on spatial and temporal dimensions. Ecol. Soc. 2015, 20, 64. [Google Scholar] [CrossRef]
  38. Charnes, A.; Cooper, W.W.; Rhodes, E. Measuring the efficiency of decision making units. Eur. J. Oper. Res. 1978, 2, 429–444. [Google Scholar] [CrossRef]
  39. Liu, Y.Y.; Sun, C.Z.; Xu, S.G. Eco-efficiency assessment of water systems in China. Water Resour. Manag. 2013, 27, 4927–4939. [Google Scholar] [CrossRef]
  40. Farrell, M.J. The measurement of productive efficiency. J. R. Stat. Soc. 1957, 120, 253–290. [Google Scholar] [CrossRef]
  41. Zhao, G.Q.; Wu, H. The empirical analysis of slack-based-measure efficiency in China’s insurance industry—Based on modified three-stage data envelopment Analysis. J. Financ. Econ. 2010, 25, 72–84. (In Chinese) [Google Scholar]
  42. Tone, K. Dealing with Undesirable Outputs in DEA: A Slacks Based Measure (SBM) Approach; National Graduate Institute for Policy Studies: Minato, Japan, 2004; pp. 44–45. [Google Scholar]
  43. Fukuyama, H.; Weber, W. A directional slacks—Based measure of technical inefficiency. Socio-Econ. Plan. Scie. 2009, 43, 274–287. [Google Scholar] [CrossRef]
  44. Fan, D.; Wang, W.G. Analysis of total factor energy efficiency and potential of the energy-saving and emission-abating in regional of China—Based on SBM model of undesired output. Math. Pract. Theory 2013, 43, 12–20. (In Chinese) [Google Scholar]
  45. Tone, K. A slack-based measure of super-efficiency in data envelopment analysis. Eur. J. Oper. Res. 2002, 143, 32–41. [Google Scholar] [CrossRef]
  46. Qin, X.H.; Sun, C.Z.; Zou, W. Quantitative models for assessing the human-ocean system’s sustainable development in coastal cities: The perspective of metabolic-recycling in the Bohai Sea Ring area, China. Ocean Coast. Manag. 2015, 107, 46–58. [Google Scholar] [CrossRef]
  47. Jones, M.C.; Marron, J.S.; Sheather, S.J. A brief survey of bandwidth selection for density estimation. J. Am. Stat. Assoc. 1996, 91, 401–407. [Google Scholar] [CrossRef]
  48. Gao, T.M. Eviews Applications and Examples of Econometric Analysis Methods and Modeling; Tsinghua University Press: Beijing, China, 2006. (In Chinese) [Google Scholar]
  49. Zhang, D.D.; Zhou, C.H.; Su, F.Z.; Yang, X.M.; Du, Y.Y. A physical Impulse-based approach to evaluate the exploitative intensity of Bay: A case study of Daya Bay in China. Ocean Coast. Manag. 2012, 69, 151–159. [Google Scholar] [CrossRef]
  50. Silverman, B.W. Density Estimation for Statistics and Data Analysis; CRC Press: Boca Raton, FL, USA, 1986. [Google Scholar]
  51. Aobuli, T.; Wang, H.L.; Alimujiang, K. The environmental pollution degree in West China assessed by hierachical cluster analysis. J. Glaciol. Geocryol. 2015, 37, 266–270. [Google Scholar]
  52. Palmer, B.J.; Hill, T.R.; Mcgregor, G.K.; Paterson, A.W. An assessment of coastal development and land use change using the DPSIR framework: Case studies from the Eastern Cape, South Africa. Coast. Manag. 2011, 39, 158–174. [Google Scholar] [CrossRef]
  53. Campuzano, F.J.; Mateus, M.D.; Leitão, P.C.; Leitão, P.C.; Marín, V.H.; Delgado, L.E.; Tironi, A.; Pierini, J.O.; Sampaio, A.F.P.; Almeida, P.; et al. Integrated coastal zone management in South America: A look at three contrasting systems. Ocean Coast. Manag. 2013, 72, 22–35. [Google Scholar] [CrossRef]
  54. Vermaat, J.E.; Estradivari, E.; Becking, L.E. Present and future environmental impacts on the coastal zone of Berau (East Kalimantan, Indonesia), a deductive scenario analysis. Reg. Environ. Chang. 2012, 12, 437–444. [Google Scholar] [CrossRef]
  55. Maxim, L.; Spangenberg, J.H.; O’Connor, M. An analysis of risks for biodiversity under the DPSIR framework. Ecol. Econ. 2009, 69, 12–23. [Google Scholar] [CrossRef]
  56. Newton, A.; Weichselgartner, J. Hotspots of coastal vulnerability: A DPSIR analysis to find societal pathways and responses. Estuar. Coast. Shelf Sci. 2014, 140, 123–133. [Google Scholar] [CrossRef]
  57. Shao, C.F.; Ju, M.T. Study of the index system of low-carbon cities based on DPSIR model. Ecol. Econ. 2010, 10, 95–99. (In Chinese) [Google Scholar]
  58. Zhang, B.; Chen, G.; Guo, Q. Static frame model validation with small samples solution using improved kernel density estimation and confidence level method. Chin. J. Aeronaut. 2012, 25, 879–886. [Google Scholar] [CrossRef]
  59. Wei, C.; Guo, Z.Y.; Wu, J.P.; Ye, S.F. Constructing an assessment indices system to analyze integrated regional carrying capacity in the coastal zones—A case in Nantong. Ocean Coast. Manag. 2014, 93, 51–59. [Google Scholar] [CrossRef]
  60. Chen, B.; Huang, H.; Yu, W.W.; Zheng, S.L.; Wang, J.K.; Jiang, J.L. Marine biodiversity conservation based on integrated coastal zone management (ICZM)—A case study in Quanzhou Bay, Fujian, China. Ocean Coast. Manag. 2009, 52, 612–619. [Google Scholar]
  61. Gao, L.H.; Gao, Q. Validation and calculation of the coordination degree of interactive relationships in the marine eco-economic system. Resour. Sci. 2012, 34, 173–184. (In Chinese) [Google Scholar]
  62. Pirrone, N.; Trombino, G.; Cinnirella, S.; Algieri, A.; Bendoricchio, G.; Palmeri, L. The Driver-Pressure-State-Impact-Response (DPSIR) approach for integrated catchment-coastal zone management: Preliminary application to the Po catchment-Adriatic Sea coastal zone system. Reg. Environ. Chang. 2005, 5, 111–137. [Google Scholar] [CrossRef]
  63. Sekovski, I.; Newton, A.; Dennison, W.C. Megacities in the coastal zone: Using a driver-pressure-state-impact-response framework to address complex environmental problems. Estuar. Coast. Shelf Sci. 2012, 96, 48–59. [Google Scholar] [CrossRef]
  64. Liu, L.H. Calculation and analysis of the city low-carbon developmental index based on DPSIR model: Taking the urban district of Jiangmen city as an example. Environ. Sci. Technol. 2015, 38, 273–284. (In Chinese) [Google Scholar]
  65. Nair, R.S.; Bharat, D.A.; Nair, M.G. DPIRS framework for sustainable development of coastal areas. Bonfring Int. J. Ind. Eng. Manag. Sci. 2012, 2, 117–124. [Google Scholar] [CrossRef]
  66. Tan, F.F.; Lu, Z.H. Study on the interaction and relation of society, economy and environment based on PCA–VAR model: As a case study of the Bohai Rim region, China. Ecol. Indic. 2015, 48, 31–40. (In Chinese) [Google Scholar] [CrossRef]
  67. Wei, J.; Zhao, Y.T.; Xu, H.Q.; Yu, H. A Framework for selecting indicators to assess the sustainable development of the natural heritage site. J. Mt. Sci. 2007, 4, 321–330. [Google Scholar] [CrossRef]
  68. Zhu, J.; Tang, Z.Z.; Liu, X.M.; Lu, Y.F. Evaluation of low carbon city development based on DPSIR model—Taking Jiyuan city as an example. Urban Probl. 2012, 12, 42–47. (In Chinese) [Google Scholar]
  69. Nobre, A.M. An ecological and economic assessment methodology for coastal ecosystem management. Environ. Manag. 2009, 44, 185–204. [Google Scholar] [CrossRef] [PubMed]
  70. Zhang, X.Y.; Xue, X.Z. Analysis of marine environmental problems in a rapidly urbanising coastal area using the DPSIR framework: A case study in Xiamen, China. J. Environ. Plan. Manag. 2013, 56, 720–742. [Google Scholar] [CrossRef]
  71. Ojeda-Martínez, C.; Casalduero, F.G.; Bayle-Sempere, J.Y.; Cebrián, C.B.; Valle, C.; Sanchez-Lizaso, J.L.; Forcada, A.; Sanchez-Jerez, P.; Martín-Sosa, P.; Falcón, J.M.; et al. A conceptual framework for the integral management of marine protected areas. Ocean Coast. Manag. 2009, 52, 89–101. [Google Scholar] [CrossRef]
  72. Yang, Y.D.; Sun, C.Z. Assessment of land-sea coordination in the Bohai Sea Ring area and spatial-temporal differences. Resour. Sci. 2014, 36, 691–701. (In Chinese) [Google Scholar]
  73. Martins, J.H.; Camanho, A.S.; Gaspar, M.B. A review of the application of driving Forces-Pressure-State-Impact-Response framework to fisheries management. Ocean Coast. Manag. 2012, 69, 273–281. [Google Scholar] [CrossRef]
  74. Mukuvari, I.; Mafwila, S.K.; Chimuka, L. Measuring the recovery of the Northern Benguela Current Large Marine Ecosystem (BCLME): An application of the DPSIR framework. Ocean Coast. Manag. 2016, 119, 227–233. [Google Scholar] [CrossRef]
  75. Huang, H.F.; Kuo, J.; Lo, S.L. Review of PSR framework and development of a DPSIR model to assess greenhouse effect in Taiwan. Environ. Monit. Assess. 2011, 177, 623–635. [Google Scholar] [CrossRef] [PubMed]
  76. Zhang, X.P.; Liu, J.; Fang, T. Evaluation on the low carbon city development of Lanzhou city based on DPSIR model. J. Northwest Univ. Nat. Sci. 2012, 48, 112–115. (In Chinese) [Google Scholar]
  77. Zhu, X; Lu, Z.N. Evaluation on the low-carbon city development based on DPSIR model—The case of Jiangsu province. Res. Technol. Econ. Manag. 2013, 1, 115–118. (In Chinese) [Google Scholar]
  78. Bidone, E.D.; Lacerda, L.D. The use of DPSIR framework to evaluate sustainability in coastal areas. Case study: Guanabara Bay basin, Rio de Janeiro, Brazil. Reg. Environ. Chang. 2004, 4, 5–16. [Google Scholar] [CrossRef]
  79. Zhou, G.H.; Singh, J.; Wu, J.; Sinha, R.; Laurenti, R.; Frostell, B. Evaluating low-carbon city initiatives from the DPSIR framework perspective. Habitat Int. 2015, 50, 289–299. [Google Scholar] [CrossRef]
  80. Yin, K.D.; Fang, S.M. Marine Index System; Economic Science Press: Beijing, China, 2008. [Google Scholar]
  81. Atkins, J.P.; Burdon, D.; Elliott, M.; Gregory, A.J. Management of the marine environment: Integrating ecosystem services and societal benefits with the DPSIR framework in a systems approach. Mar. Pollut. Bull. 2011, 62, 215–226. [Google Scholar] [CrossRef] [PubMed]
Figure 1. Development of China’s 11 coastal provinces and cities. Note: Sansha city was founded in 2012; thus, data were lacking, resulting in our excluding this city from the analyses.
Sustainability 08 00958 g001
Figure 2. The DPSWR framework. (a) Ring structure of DPSIR framework; (b) Resolution structure of DPSIR framework.
Sustainability 08 00958 g002
Figure 3. Linear decomposition of the DPSWR framework.
Sustainability 08 00958 g003
Figure 4. Efficiency of China’s coastal areas.
Sustainability 08 00958 g004aSustainability 08 00958 g004b
Figure 5. Time series analysis of efficiency by kernel density estimation.
Sustainability 08 00958 g005
Figure 6. Space sequence analysis of efficiency by hierarchical cluster.
Sustainability 08 00958 g006
Table 1. Indicators and its weights of DPSWR.
DPSWRIndicatorUnitData SourceWeight
Driving ForceNatural Population Growth Rate%[34,52,53,54,55,56,57,58]0.06
Population Densitypersons/km2[34,53,58,59,60,61,62]0.34
Urbanization%[53,57,62,63,64,65,66,67,68]0.11
Aquaculturehm2[53,54,69,70]0.15
Tourism10,000 person-times[52,53,54,56,62,63,65,69,71,72]0.18
Fisheriest[53,54,62,65,69,70,73,74]0.16
PressurePer Capita Water Usem3/person[34,57,63,65,67,68,75,76,77]0.19
Per Capita Electricity ConsumptionKW·h/person[34,57,63,65,68,75,76,77]0.08
Wastewater Discharget/10,000 yuan[53,54,60,61,62,63,65,66,69,72,78]0.15
Solid Wastes Dischargedt/10,000 yuan[62,63,65,66,78]0.32
GDP Energy Intensityt[34,57,63,65,66,68,75,76,77]0.21
StateMarine secondary industry specific gravity%[57,61,64,66,67,69,76,77]0.10
Marine tertiary industry specific gravity%[57,66,67,68,76,77,79]0.14
Marine comparative labor productivity [57,61,66,77]0.12
Proportion of the Gross Ocean Product in the Gross Regional Product%[61,72]0.20
Water Quality%[53,54,62,63,65,66,69,70]0.09
HDI [54,67,78]0.15
Gini Coefficient [54,57,64,67,78]0.21
WelfarePer capita Gross Ocean Productyuan/person[60,61,66,72,75,78]0.42
Growth rate of Gross Ocean Product%[80]0.16
Per Capita Marine Ecosystem Services10,000 yuan/person[75,81]0.26
CO2 Emissions [34,57,64,68,76,77]0.16
ResponseContribution degree of marine industry [80]0.06
Marine industrial structure change index [80]0.11
International tourism (foreign exchange) income10,000 USD[67]0.17
Revenue of marine scientific research institutions10,000 yuan[34,56,67]0.23
Investment in Environmental Protection%[34,57,64,67,76,77]0.12
Marine Reserves in Coastal Regionskm2[54,62,70]0.22
Wastewater Treatment Rate%[34,57,62,70,76,77,78]0.05
Education situationperson[70,78]0.07

