Case Report

Sea-Level Rise and Land Subsidence: Impacts on Flood Projections for the Mekong Delta’s Largest City

1
Tokyo Institute of Technology, School of Environment and Society, 2-12-1 Ookayama, Meguro-ku, Tokyo 152-8550, Japan
2
Faculty of Civil Engineering, Ho Chi Minh City University of Technology, 268 Ly Thuong Kiet St., Dist.10, Ho Chi Minh City 700000, Vietnam
*
Author to whom correspondence should be addressed.
Sustainability 2016, 8(9), 959; https://doi.org/10.3390/su8090959
Submission received: 21 June 2016 / Revised: 10 September 2016 / Accepted: 12 September 2016 / Published: 21 September 2016
(This article belongs to the Section Sustainable Urban and Rural Development)

Abstract

:
The present paper demonstrates that inundation levels in the Mekong Delta’s largest city, Can Tho, are predominantly determined by ocean tides, sea-level rise, and land subsidence. Our analysis of inundation patterns projects that the duration of inundation at an important road in the city will continue to rise from the current total of 72 inundated days per year to 270 days by 2030 and 365 days by 2050. This is attributed to the combined influence of sea-level rise and land subsidence, which causes relative water level rises at a rate of 22.3 mm·yr−1. People in the Mekong Delta have traditionally lived with floods, and thus there is certain resilience among residents in coping with small floods. At present, daily maximum inundation depth, which is generally shallower than 10 cm on the road, seems to be still manageable; however, our analysis indicates that this will start drastically increasing in the coming decades and reach an average depth of 70 cm by 2050. Effective and well-planned actions to mitigate the effects of land subsidence and sea-level rise are urgently required, otherwise, local inhabitants will encounter an unmanageable increase in inundation depth and duration in the coming decades. This study, which considers both sea-level rise and land subsidence, suggests that inundation depth and duration are projected to rise much faster than those indicated by previous studies, which only consider sea-level rise.

1. Introduction

The Mekong Delta, which extends over the vast area of southern Vietnam, is considered one of the world’s most sensitive areas to climate change [1]. Because of its low-lying characteristics (see Figure 1) this region is very vulnerable to the influence of sea-level rise (SLR). Currently, about 1.7 million ha of the delta are flooded every year, affecting about 9 million people in the inland regions [2].
A number of researchers have made various predictions of the effects of SLR on this region and calculated the number of people affected and the area flooded, employing a variety of methodologies and SLR scenarios. It was predicted that one in ten people in the Mekong Delta may face displacement due to flooding and other climate effects [3]. The proportion of the delta potentially affected by SLR will vary from 68.7% to 91.4% under 20 cm SLR and from 86.2% to almost 100% under 45 cm SLR. Inundation as a result of a 1 m SLR would affect 6 million people [4]. Six of the Mekong Delta’s 12 provinces would see over 30% of their populations affected [5].
Aside from this constant and on-going increase in sea levels due to the effects of climate change, interdecadal or interannual sea surface oscillations are also likely to increase the risk of floods along low-lying coasts. One such decadal variation is the El Niño Southern Oscillation (ENSO). Historical records indicate that there is a correlation between strong El Niño events and marked increases in mean sea level (MSL) in the Eastern Pacific, and decreases in the Western Pacific. During the 1997–1998 ENSO event, a rise and subsequent fall of mean sea level was observed in the Eastern Pacific [6,7]. More extreme climate events, such as typhoons, are another predicted consequence of climate change. The number of typhoons that approach the coasts of southern Vietnam is only one half to one third of those that approach the northern and central parts [8]. However, these typhoons would cause more severe storm damage if SLR continues. The possible increase in wind damage would increase throughout Vietnam due to climate change, which causes significant damage to houses, infrastructure and rice productions [9,10,11].
The Mekong Delta is also facing another critical issue, land subsidence, which inevitably exacerbates the damages due to floods or saline water intrusions over the vast area of the region. The land of the Mekong Delta is a complicated sedimentary environment that extends over a low-lying area, and which is mainly composed of silt and clay carried by river flow. The present morphology of the Mekong Delta has been developed over the last 6000 years, during which time the delta has advanced around 200 km towards the sea [12]. Land subsidence is a gradual settling of the ground owing to the subsurface movement of unconsolidated sediments. The Mekong Delta as a “deltas in peril”, where reductions in aggradation and accelerated compaction will overwhelm rates of global sea-level rise. Groundwater exploitation could be a major cause of land subsidence [13]. Time-series data from monitoring wells indicates that the average rate of hydraulic head decline is 0.3 m·yr−1, which indicates land subsidence at an average rate of 16 mm·yr−1 [14]. However, because of the lack of data, the question remains as to exactly how much of the subsidence in the delta is due to groundwater extraction [15,16].
The Mekong Delta is home to some 20 million people and also produces a significant proportion of the world’s rice [17,18]. Thus, climate change and land subsidence impacts on this region will have far-reaching economic and public health consequences, not only for Vietnam, but for the wider world. Saline water intrusions further inland are also projected to become more severe due not only to SLR but also to the impacts of population growth, urbanisation, industrialisation, and the construction of new water-control structures in the upstream sections of the Mekong River, threatening agriculture and local inhabitants’ daily life [19,20].
Although the vulnerability of the delta to SLR and subsidence has been widely acknowledged, the actual impact on urban areas in the Mekong has still not been quantitatively investigated. The present paper, focusing on Can Tho City, attempts to project possible impacts caused by a combination of SLR and land subsidence in the near future.

2. Methodologies

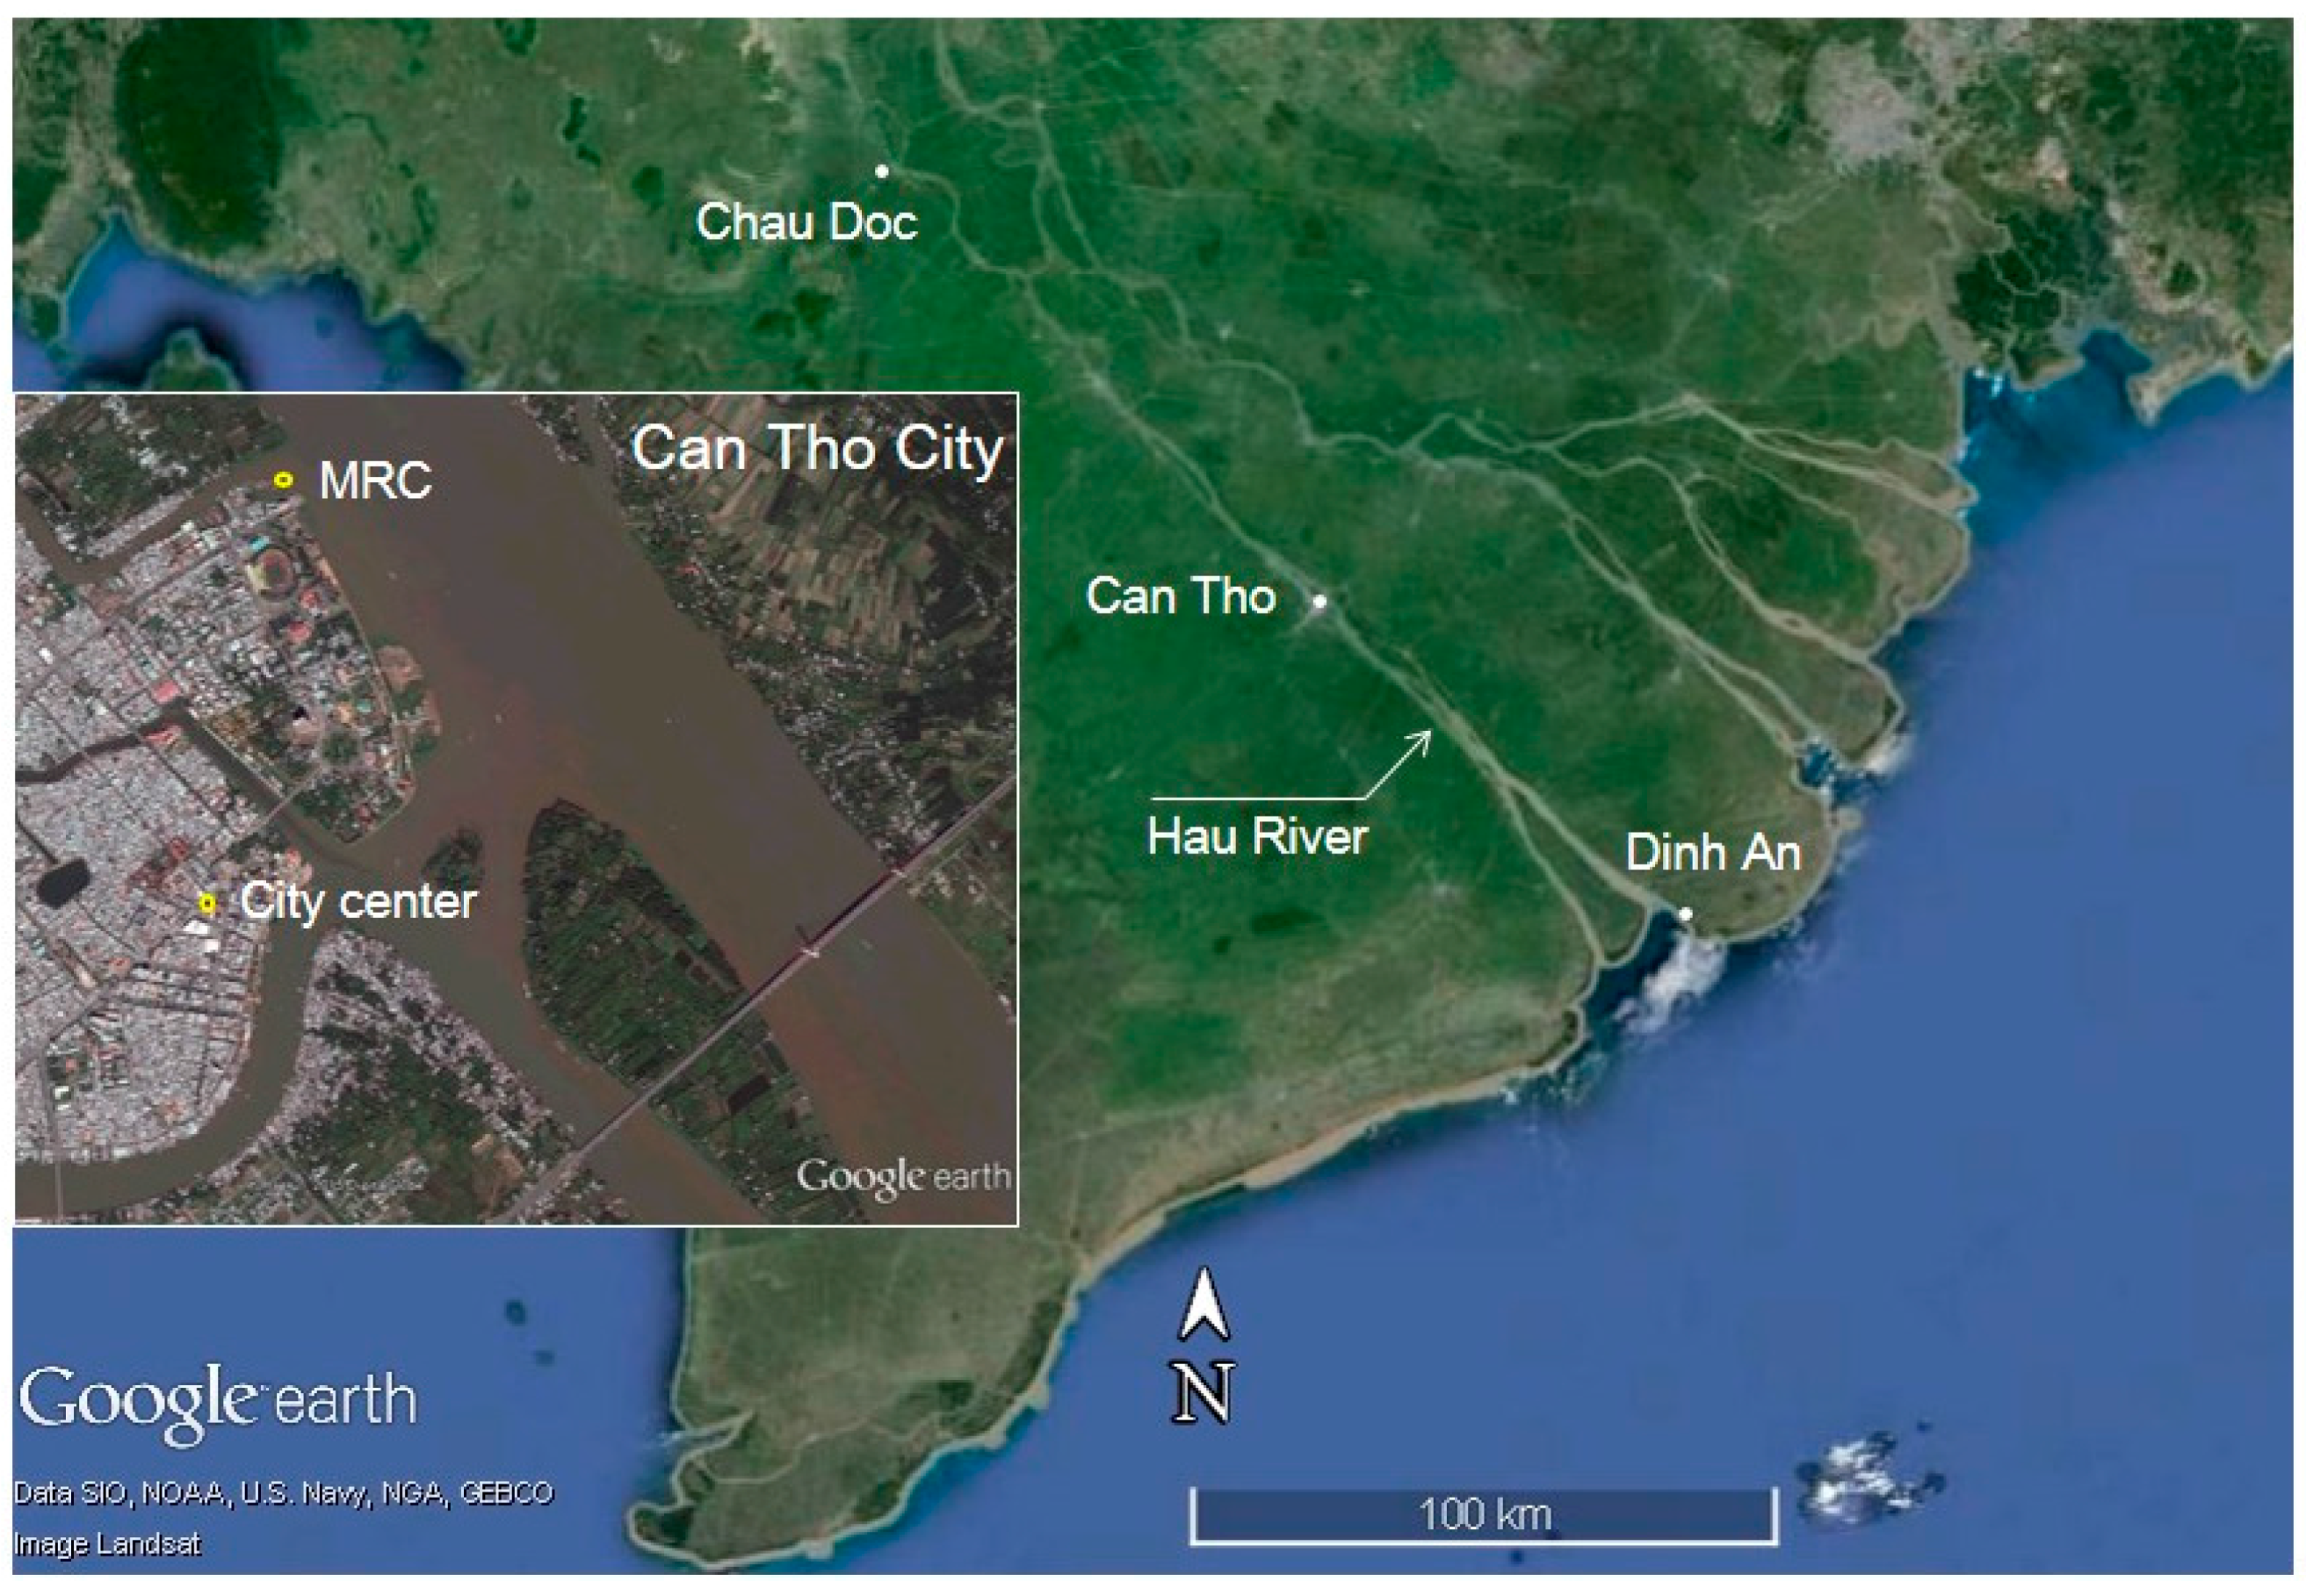
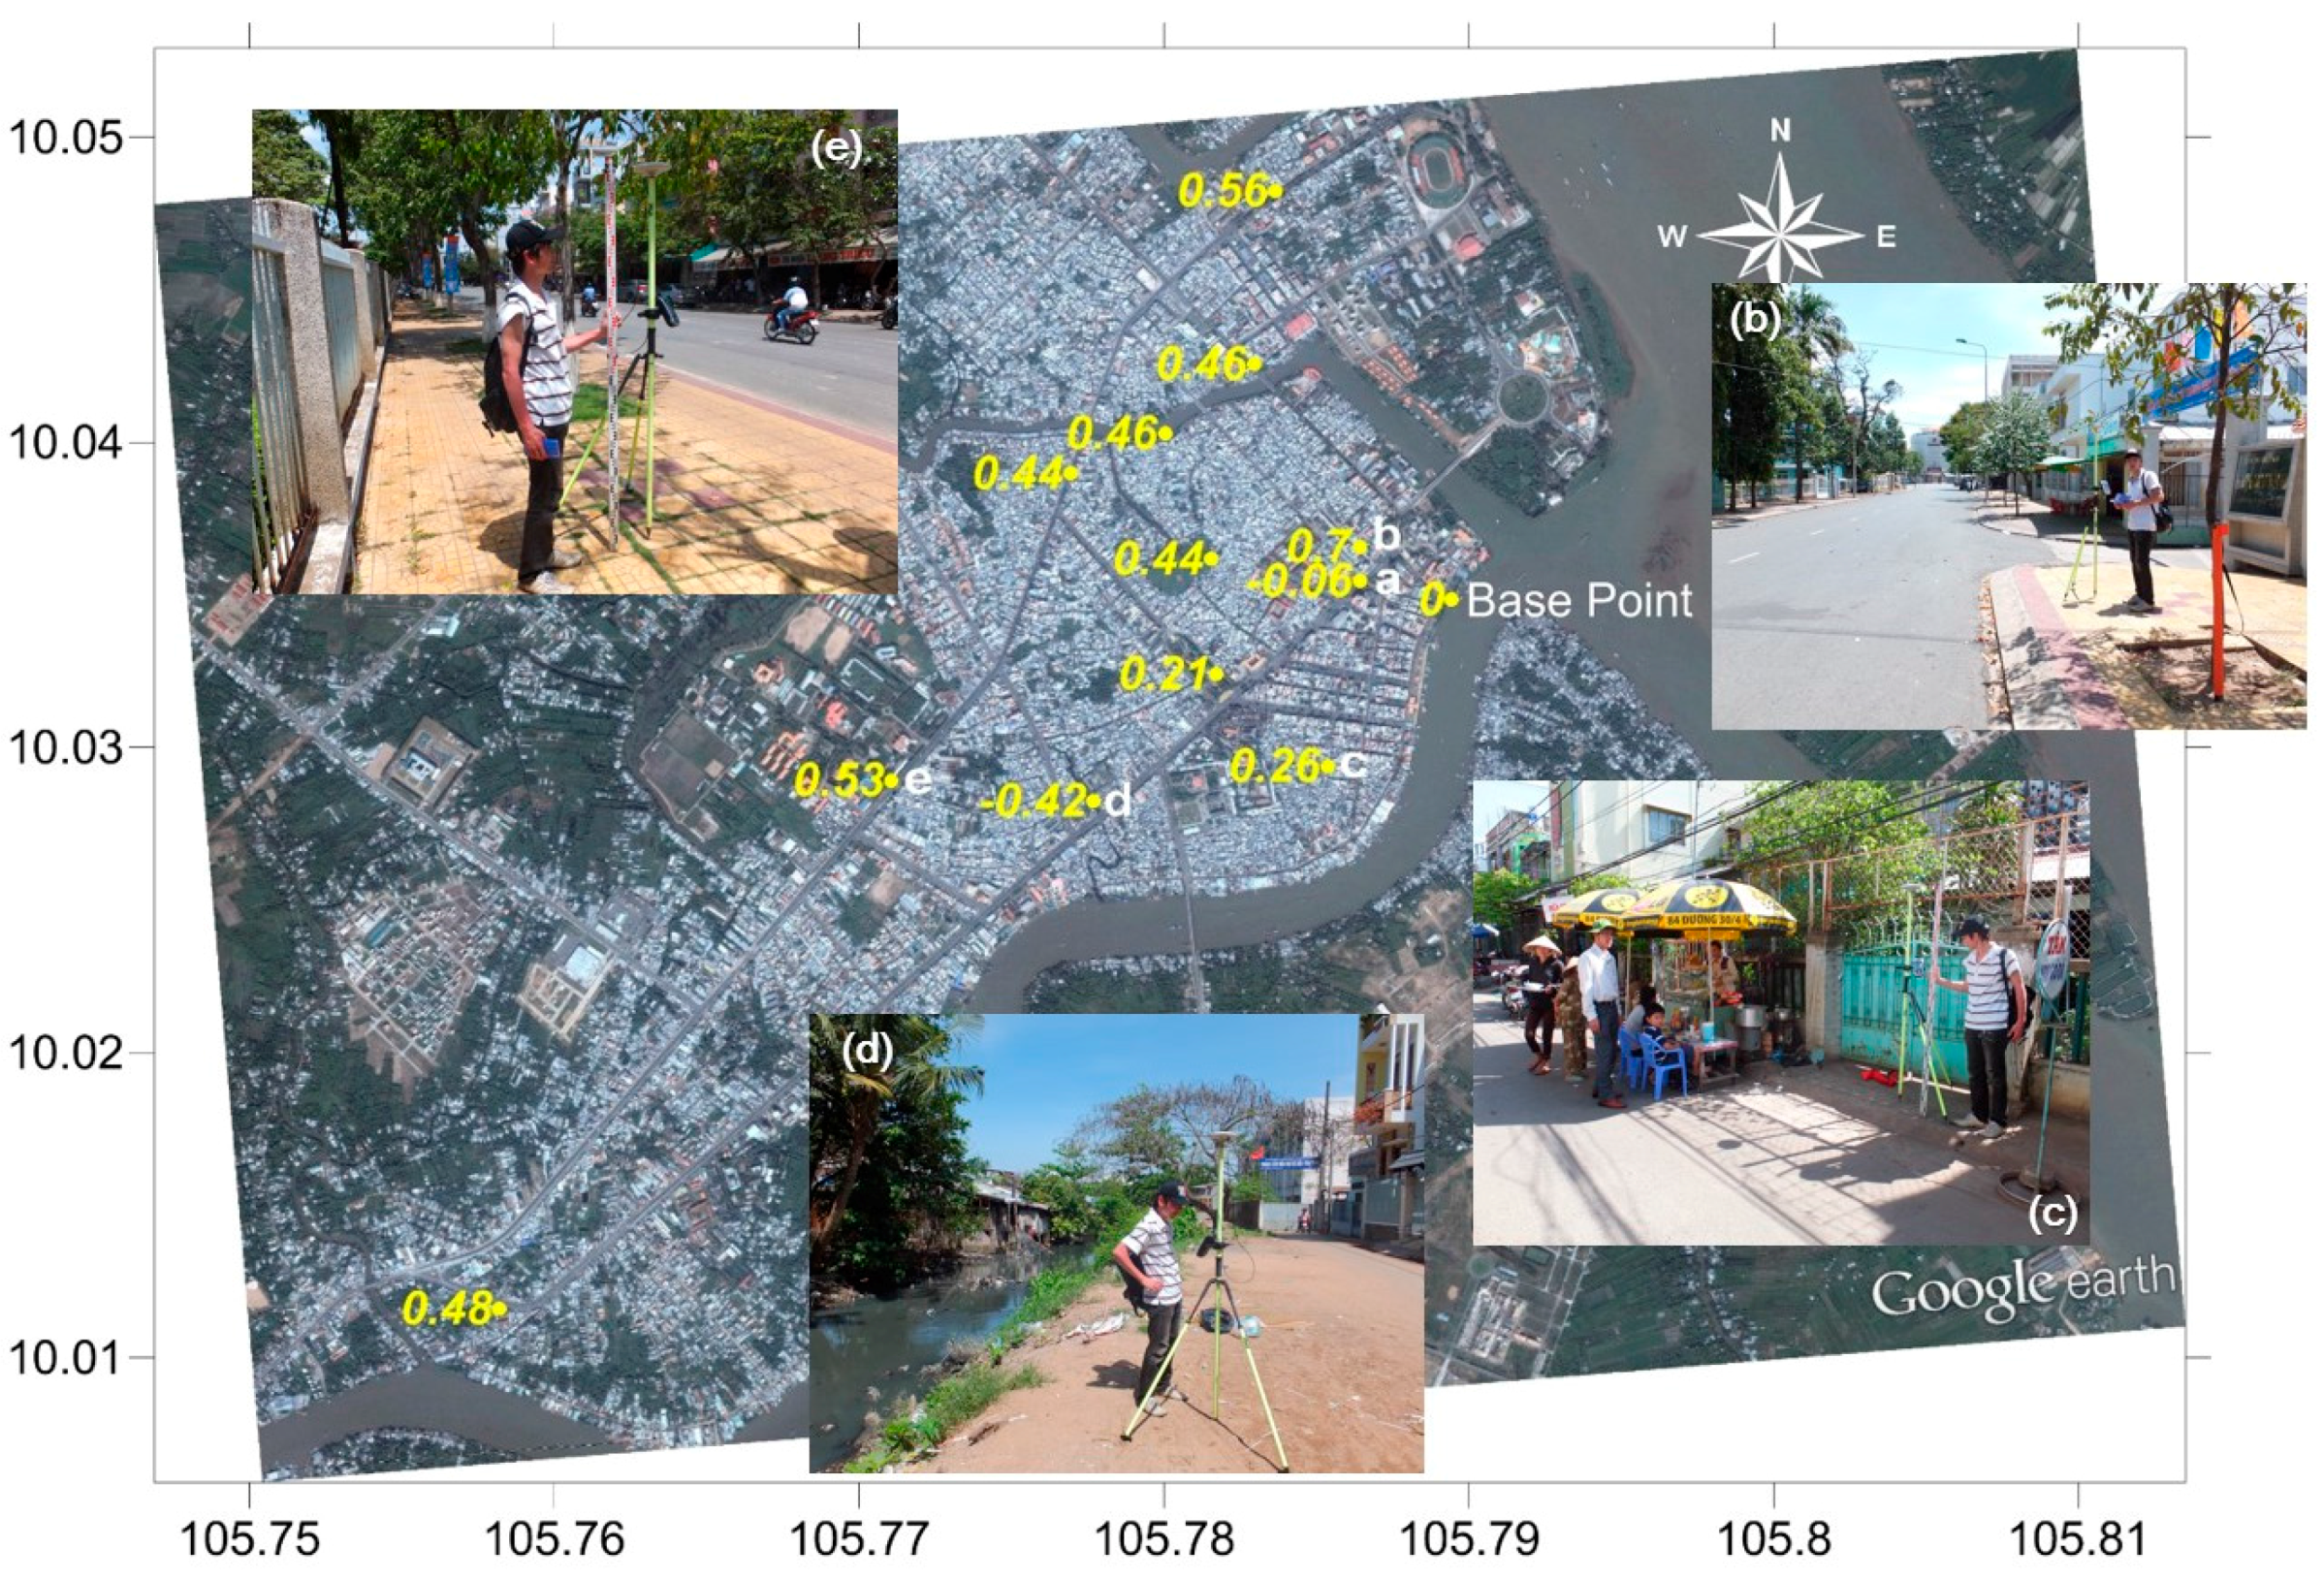
2.1. Target City and Site

The authors chose Can Tho as the target city because the city has the highest population in the Mekong Delta (1.2 million people). The city is surrounded by the Hau River (Figure 1), one of the main branches of the Mekong River. Can Tho is located in an estuary, which is a transitional area between a river and the sea. Although Can Tho is situated approximately 80 km from the river mouth, whose water levels are significantly influenced by the ocean tides in addition to seasonal high river discharge and consequent inundations (Figure 2a–e). The daily tidal range in the city exceeds 1.7 m [21]. Tides propagate further upstream to towns close to the Cambodia’s border near Chau Doc (Figure 1, situated about 190 km inland from the river mouth), and disappear afterwards (Mekong River Commission, 2005) [22]. In general, the fluvial inundation including the tidal influence is dominant in the downtown Can Tho, although the pluvial inundation plays a role even in places where no fluvial inundation occurs [23].
We conducted a series of field surveys to reveal the extent of inundation in the Mekong Delta, including Can Tho and neighbouring provinces, in the period of January 2012–March 2015 (totally 5 trips). Figure 2f shows a situation during the field survey at a point in the city centre of Can Tho, about 300 m inland from the river. Using the static GPS method with a base receiver located at the point indicated on Figure A1, the elevation of this area could be accurately measured (error would be less than a few centimetres). In this study, detailed inundation depths are estimated using this location as a target site.

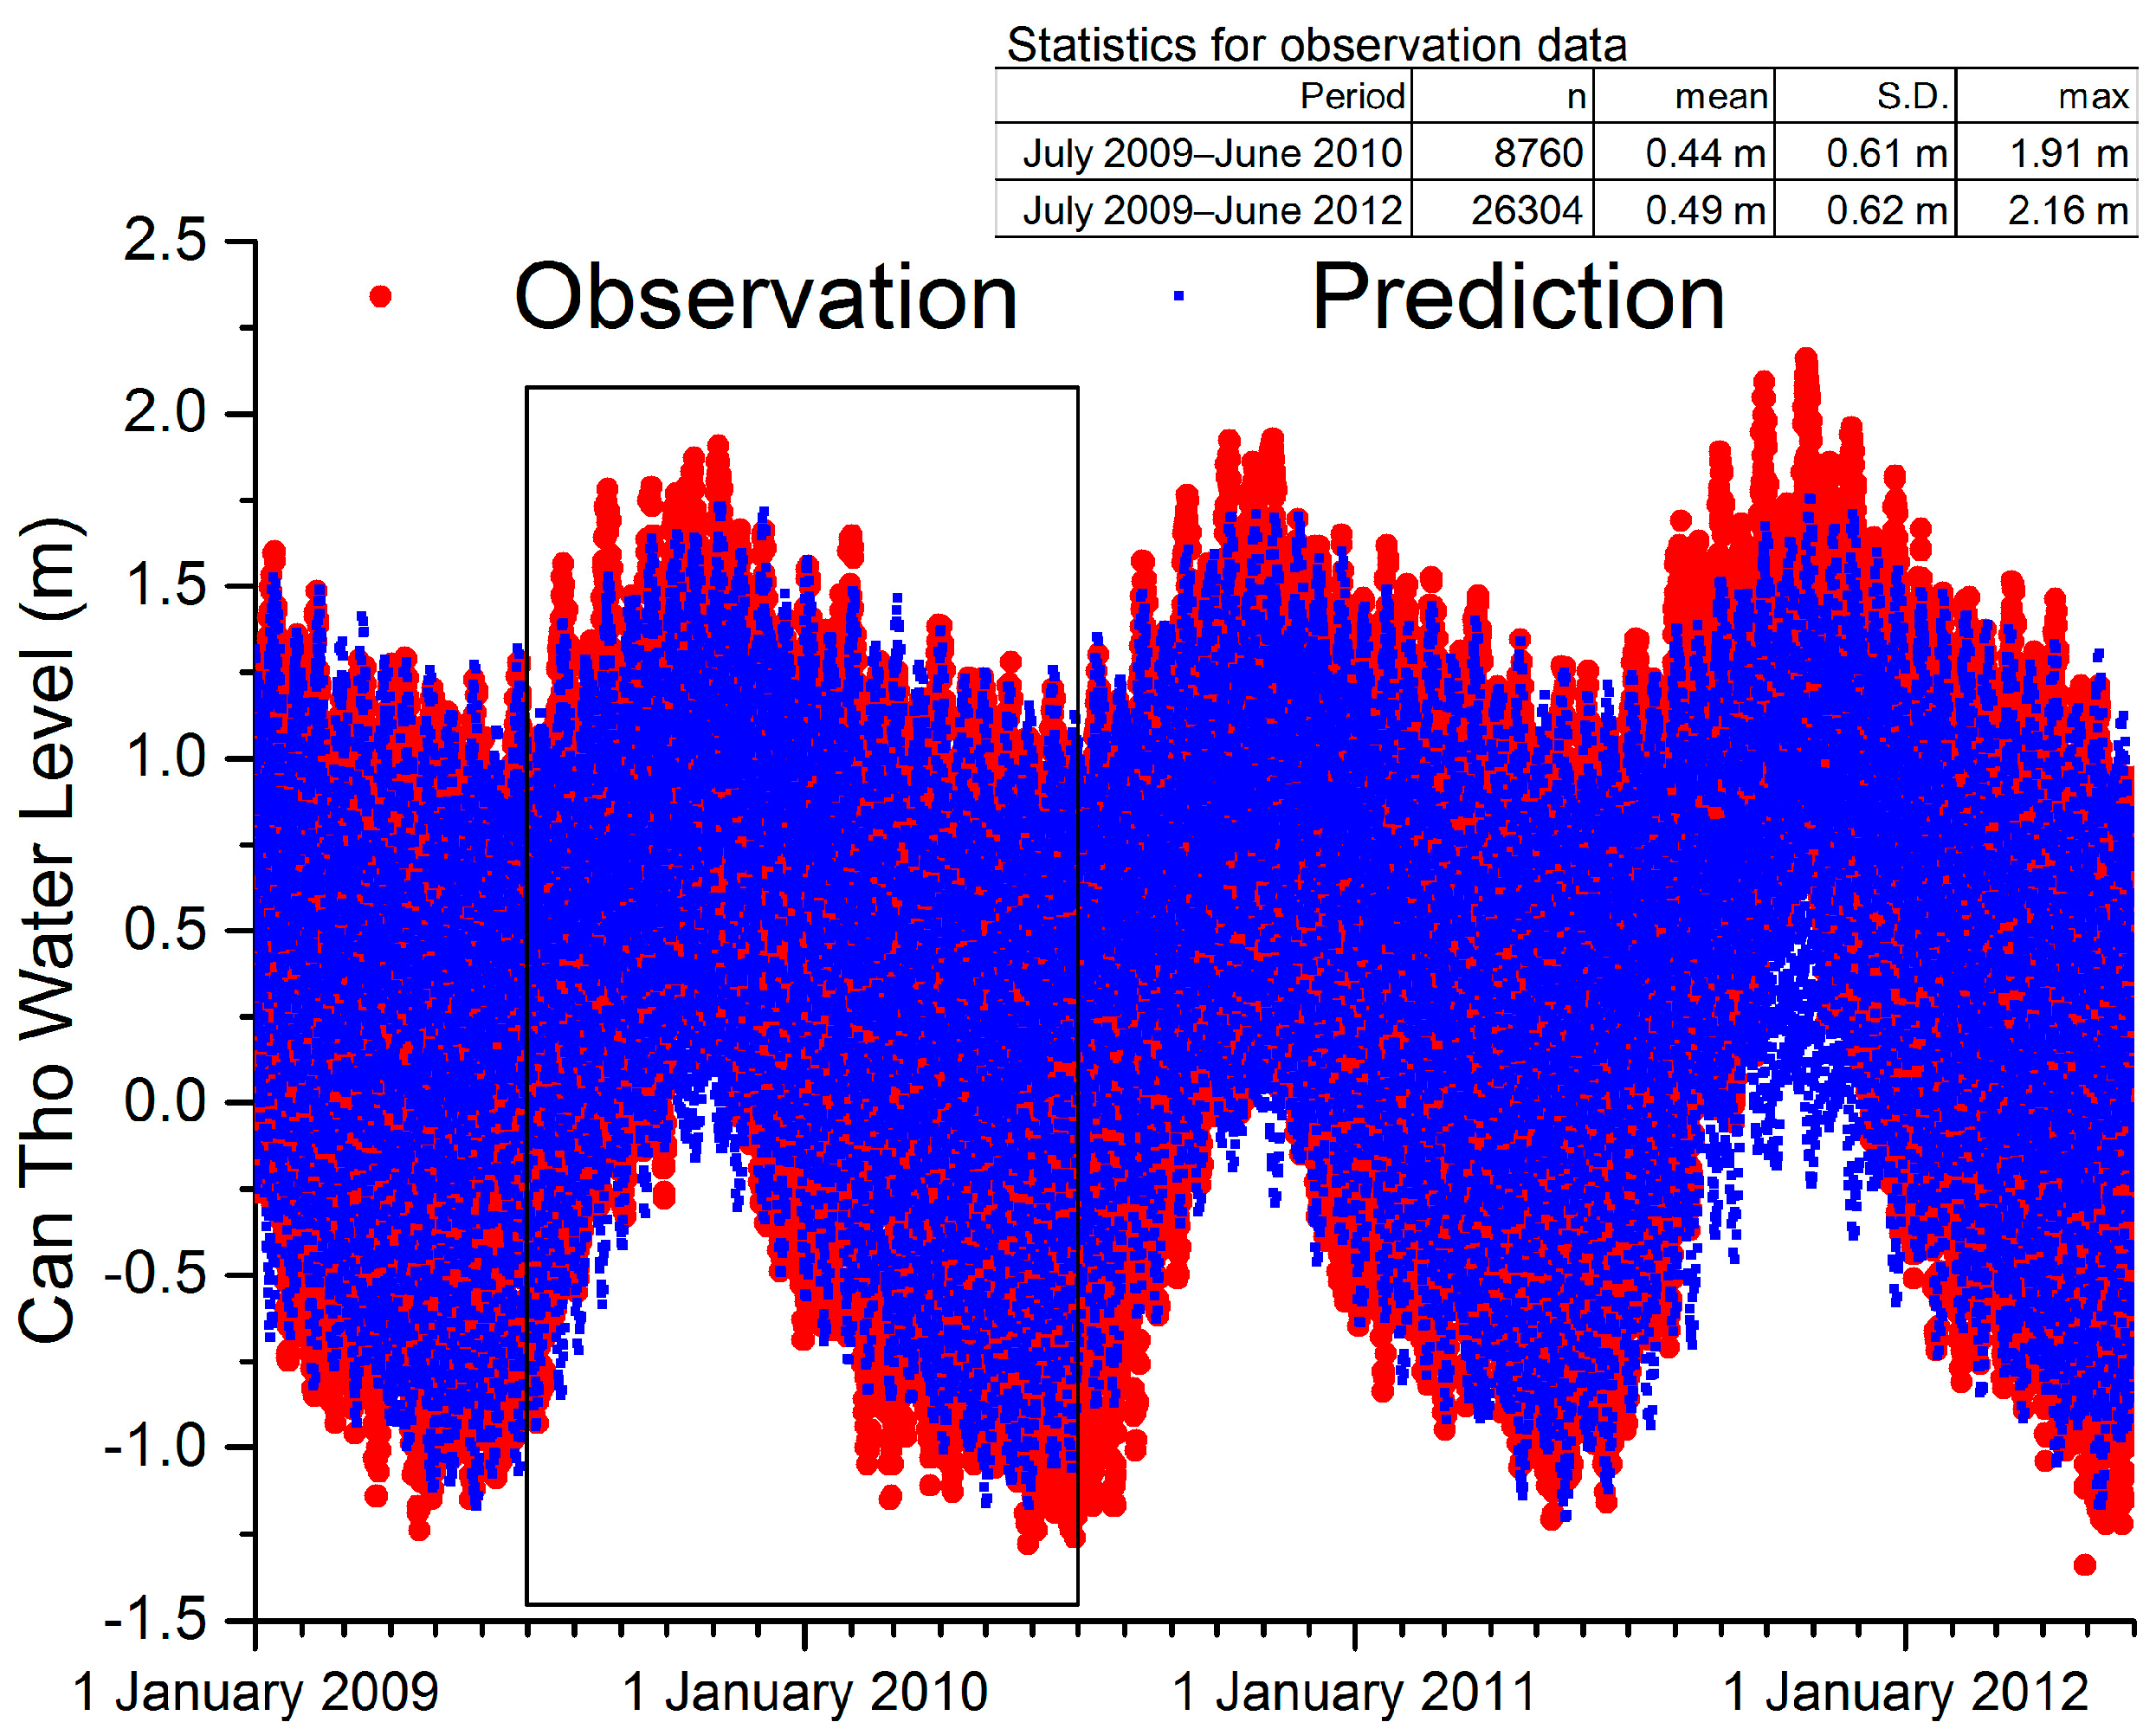
2.2. Water Level Monitoring Stations and Data

The Hau River has three water level monitoring stations: Dinh An, Can Tho, and Chau Doc (see Figure 1), all of which are operated by the Mekong River Commission (MRC) and the Vietnamese government (Southern Regional Hydro-Meteorological Center). Water surface elevation at Dinh An, which faces the sea, is considered to be relatively independent of river flow, while water levels at Chau Doc, 190 km inland from the river mouth, are predominantly determined by river discharge and less influenced by ocean tides [24].
The authors obtained hourly tidal data from 2009 to the present. However, because substantial data gaps were found in the records, particularly in the Dinh An data series, this study’s authors limited their analysis to one year-long tidal record at each of these stations for the period July 2009 to June 2010.
The authors used the water levels monitored at these stations to conduct a series of analyses to make sure the connection between water levels at Can Tho and external factors such as SLR, land subsidence, and upstream water level. Inundation depths are then estimated based on future scenarios at the city centre (Figure 2f), where a precise topographical survey was conducted by the authors.

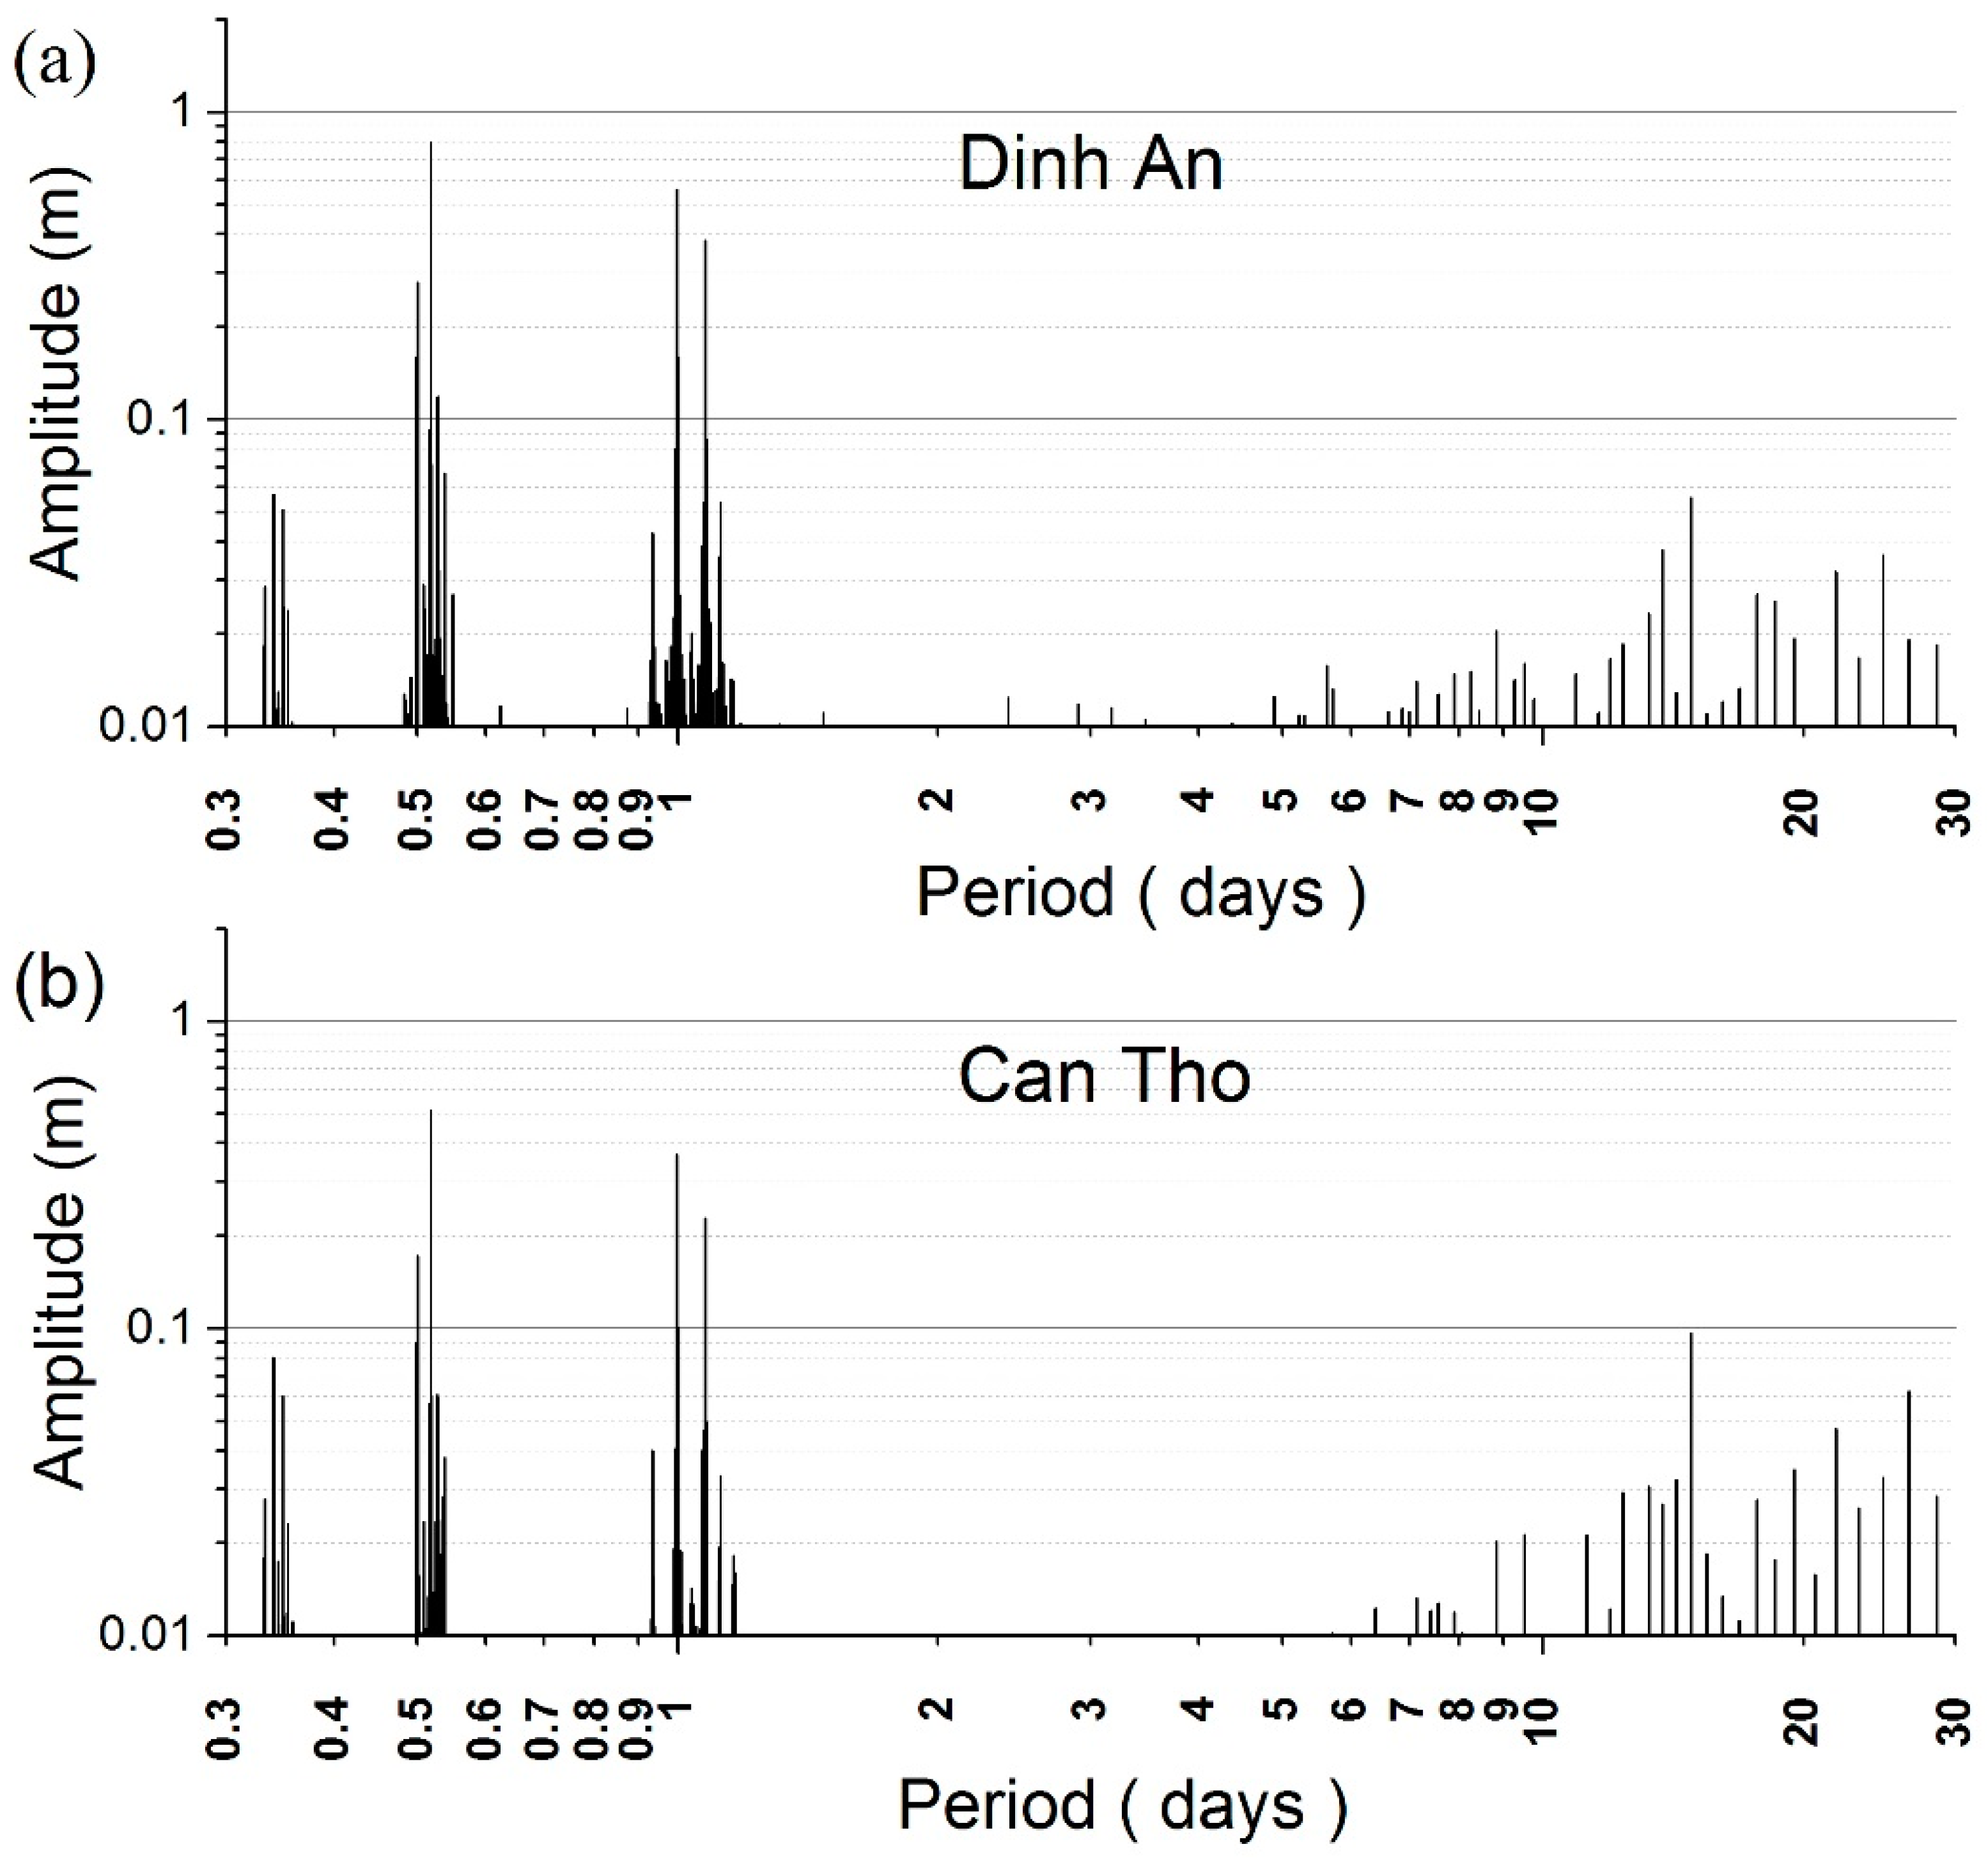
2.3. Tidal Harmonic Analysis

Ocean tides propagate as far as an upstream location such as Can Tho, which is located 80 km inland from the river mouth, and whose water levels are predominantly determined by semidiurnal, diurnal, and annual cycles (Figure 3) [21]. Since the Dinh An station is located nearby the sea, water elevation at this location appears to be mostly dependent on oceanic tides, relatively independent of river discharge. It should be noted that the annual water level cycle at Can Tho is determined by an oscillation forced by both tides (i.e., the constituent of Sa) and river discharge (flood-dry season cycle), and that contributions from each factor are of the same order [21]. A model analysis indicates that the difference in tidal amplitude between a connecting tributary in Can Tho and the Hau River is small, whereas the flow velocity largely varies depending on the location [25].
The present study re-analysed the data from Takagi et al. [25], and derived a total of 60 tidal constituents by harmonic analysis, as represented by the major five components in Table 1. As described later, tide predictions with these constituents were used to detect how much water levels differ from predicted tides.

3. Results

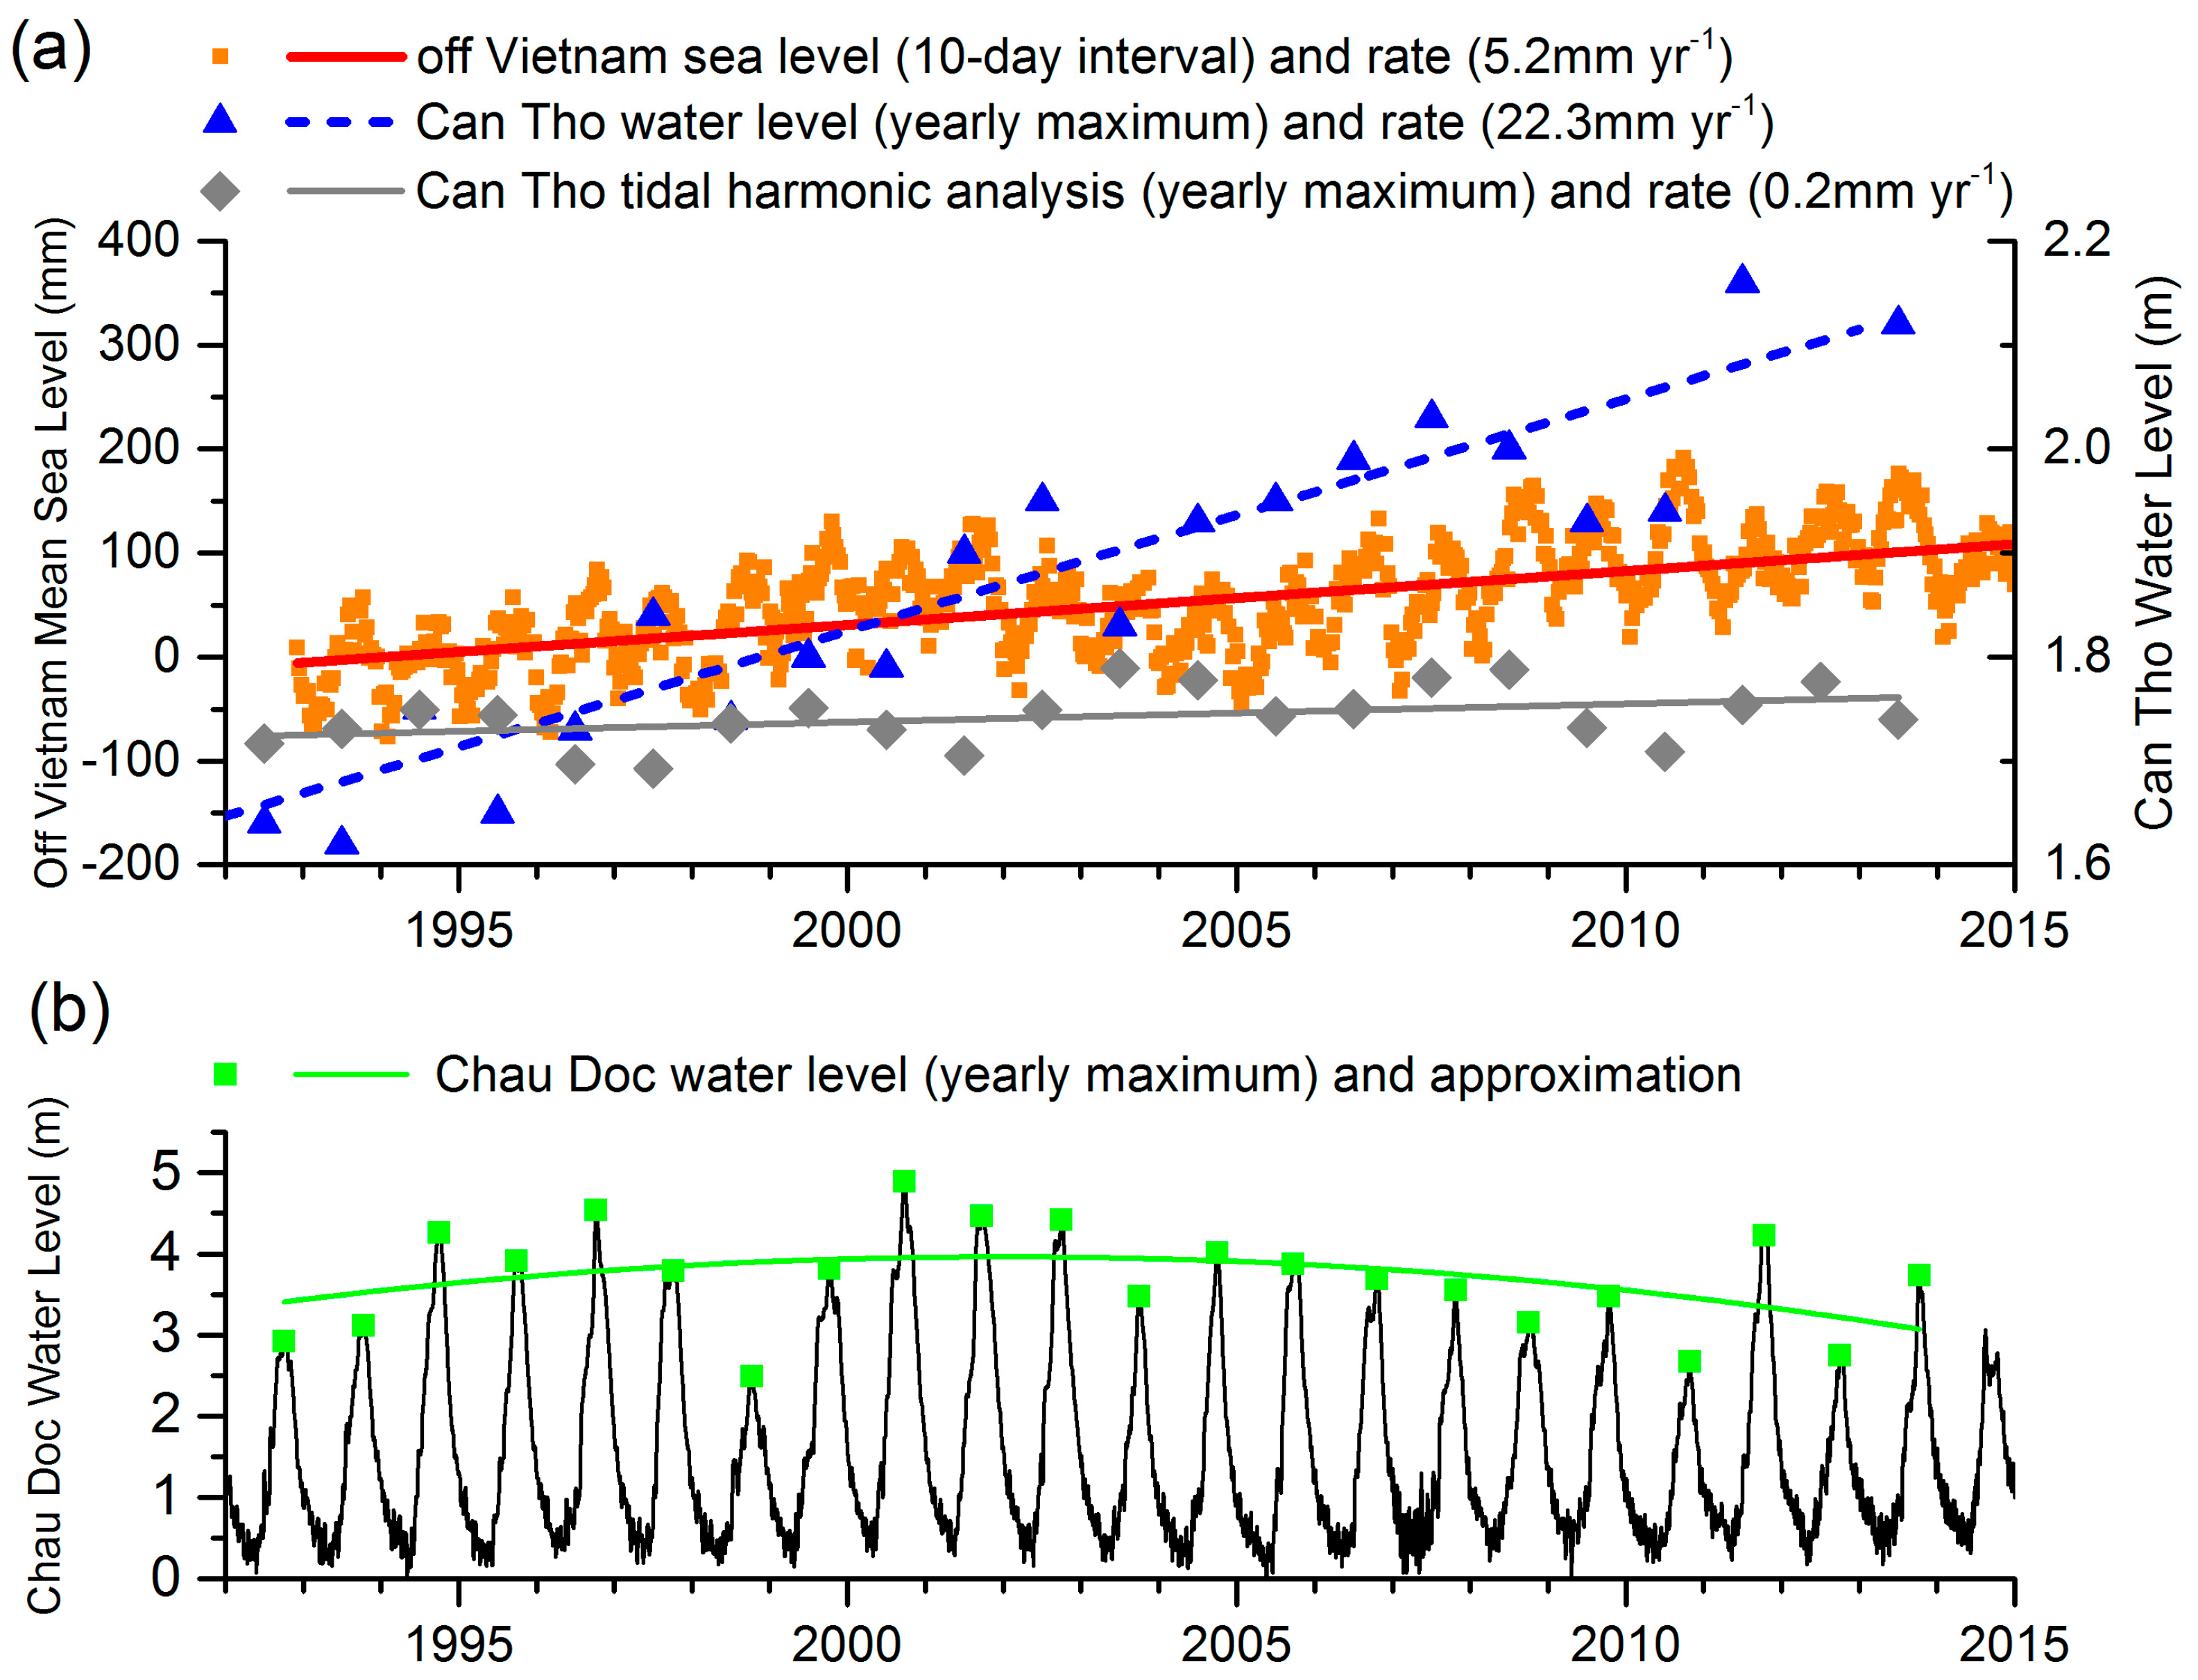
3.1. Yearly Rate of Water Level Rise and Land Subsidence

In order to be conservative when deriving future scenarios, it is worth looking at past data in order to make projections. The TOPEX/POSEIDON satellite has observed variations in global mean sea level with a precision of 4 mm at 10-day intervals since late 1992. The satellite’s data show a rise in Vietnamese sea levels of about 5.2 mm·yr−1 between 1992 and 2015 (Figure 4). This rate seems to be similar to the projections by the Vietnamese government that assumed three emission scenarios (B1: low emissions, B2: medium, and A1FI: high) and projected that sea level will rise by 28 cm to 33 cm by 2050, relative to the baseline period of 1980–1999 [26,27]. However, this rate is not necessarily in line with global average increases, as it is estimated that global sea level has been rising by approximately 3.2 [2.8 to 3.6] mm·yr−1 between 1993 and 2012 [28].
Shifting surface winds, the expansion of warming ocean water, and the addition of melting ice can alter ocean currents which, in turn, lead to changes in sea level that vary from place to place. Towards the end of the 21st century, regional patterns in sea level will progressively emerge and eventually dominate over natural variability [28]. Recent studies claim that SLR over the next 100 years projected by the Intergovernmental Panel on Climate Change could be too low by almost a factor of two, considering the additional mass loss from the Greenland and Antarctic ice sheets that is projected (e.g., [29,30]). Therefore, the assumption of this study that SLR will continue at the current rate of 5.2 mm·yr−1 assumed in this study needs to be considered as a conservative estimation. Given accelerated SLR, future floods could be more serious than those presented in this study.
Aside from the constant increase in sea levels found in Figure 4, interannual sea surface oscillations are also likely to increase the risk of floods along low-lying coasts. Sea levels could become unexpectedly high due to ENSO or other oceanic mechanisms. Abnormal high tides induced by such mechanisms have been investigated on various coasts across the world. For instance, Shoji [31] demonstrated, using the data from 22 tidal stations in Japan, that the daily mean sea levels move along the coast. Such traveling means waters could be separated into two types of waves, namely internal Kelvin-type waves and continental shelf waves [32]. An abnormal high tide with a maximum amplitude of 60 cm that caused inundation over a wide area of Yokohama Port in October 2006 is likely to have been generated by a shelf wave [33]. The extensive coastal floods that occurred on November 2007 in Jakarta are considered to have been induced by an abnormal tidal component up to about 20 cm, which were likely caused by a La Niña event, the 18.6 year lunar nodal high-tide cycle, and other abnormal tide mechanisms that simultaneously took place [34].
Therefore, it is expected that this type of regional sea level fluctuations could temporarily bring a few cm to a few tens of cm of abnormal high tides in Mekong Delta. Analyses considering these uncertainties are important to incorporate into flood projections and thus should be the objective subject of future research. However, in this study the authors simply assumed that SLR around Vietnam will linearly progress at the rate of 5.2 mm·yr−1, neglecting interannual or interdecadal variations.
Although it is not clearly understood how SLR will cause changes in water level at an upstream location from the river mouth, it can be assumed that the mean water level at Can Tho will show a similar increasing trend with SLR [21]. This can be corroborated by the fact that the amplitudes corresponding to the semi-annual cycle are of approximately the same magnitude between Dinh An and Can Tho [21]. Thus, the authors assume that a constant increase in sea level could result in a water level rise of the same magnitude in Can Tho.
Figure 4 shows that for the 1992 and 2013 data series the yearly maximum water levels at Can Tho varied from a minimum of 1.62 m in 1993 to a maximum of 2.16 m in 2011, demonstrating that the yearly maximum water levels have been steadily increasing at a rate of 22.3 mm·yr−1 on average. On the other hand, the predicted maximum water levels derived from the tidal harmonic analysis during this period were stable, showing no increase, as can also be seen in Figure 4. This discrepancy demonstrates that astronomical tidal fluctuation is not related to the increase in maximum water level over the last two decades.
Runoff from the upstream Mekong might be thought to be responsible for this trend of increasing maximum water levels at Can Tho. However, it is interesting that water levels between Can Tho and Chau Doc appear not to strongly correlate with each other (Figure 4), indicating that changes in runoff may not have influenced the steady increase in water levels at Can Tho. The reason for this is not fully understood, but it can be partially explained because unlike Can Tho, farther downstream at Chau Doc, water losses due to floodwaters overflowing their banks at Chao Doc exceed gains from rising sea level. This observation is consistent with the conclusions of Fujihara et al. and Delgado et al. [23,35]. They demonstrate that the relationship between upstream discharge and downstream water levels has followed a negative trend for 70 years in the Mekong Delta. This indicates that inflow from upstream has little impact on rising maximum water levels in the lower Mekong Delta. Maximum water levels at Can Tho are not necessarily determined by those at Chau Doc because water floods over the upstream floodplain before Can Tho is submerged, as pointed out by Be et al. [36], which indicates that water levels higher than 3.5 m at Chau Doc cause widespread uncontrollable floods over a wide area of the delta.
Given these findings, the author considers that the contribution of land subsidence to inundation can be estimated by subtracting the rate of SLR (5.2 mm·yr−1) from yearly maximum water levels increasing at a rate of 22.3 mm·yr−1, which results in 17.1 mm·yr−1. This estimation, which is very close to the average rate of 16 mm·yr−1 estimated by Erban et al. [14], clearly demonstrates that land subsidence will be the predominant factor leading to more serious floods over the low-lying city in the coming decades. Nevertheless, further study needs to be conducted to identify mechanisms and causes of land subsidence, which have not yet been fully understood.

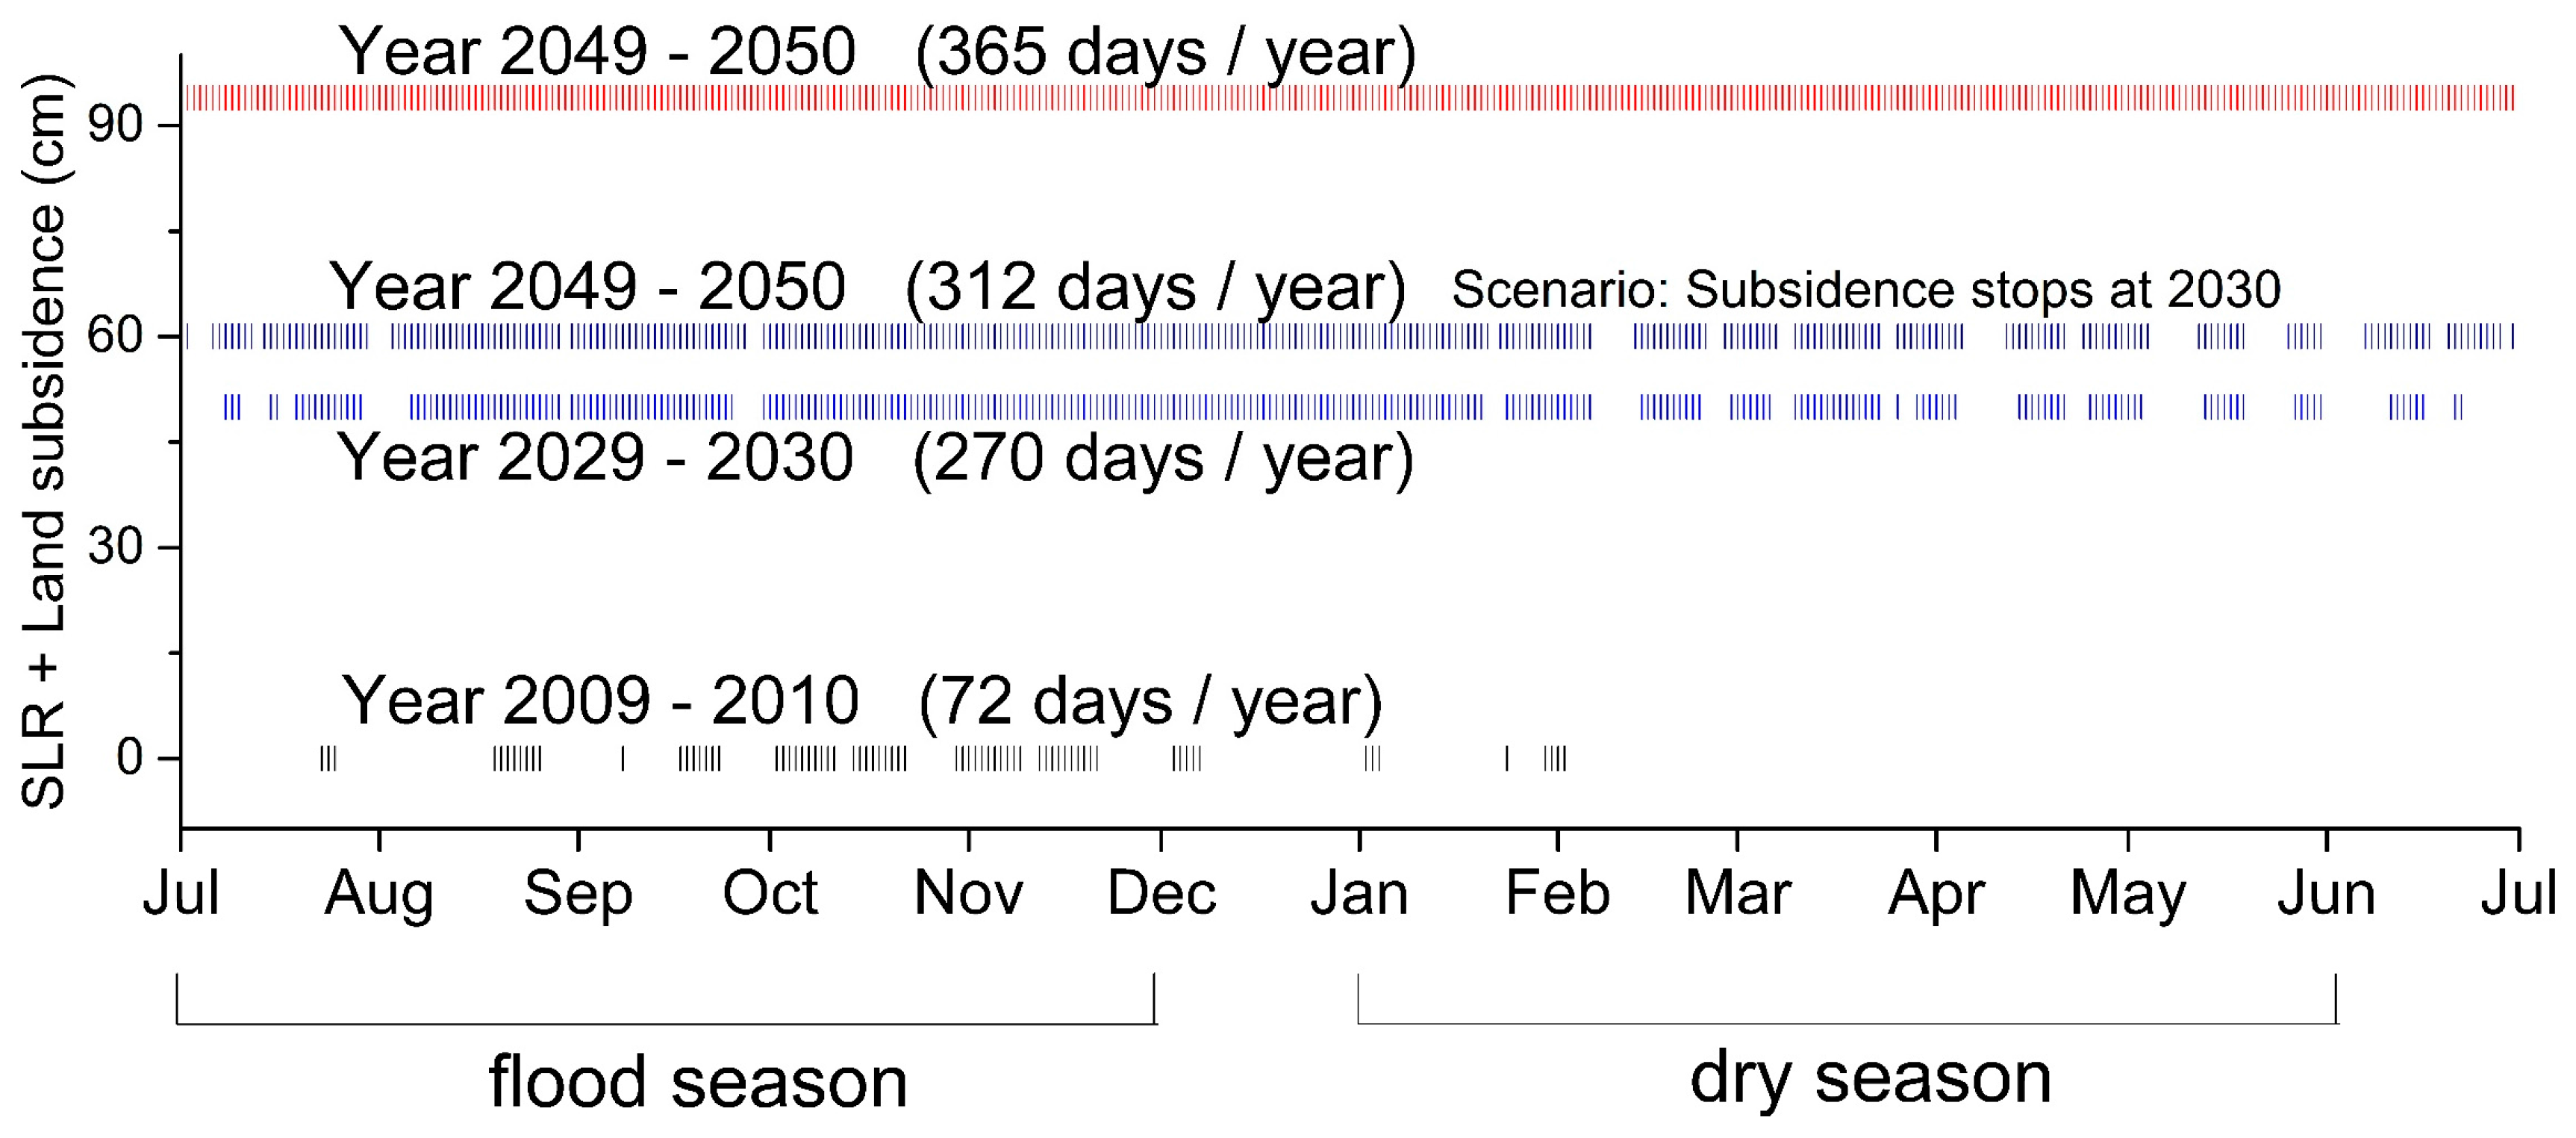
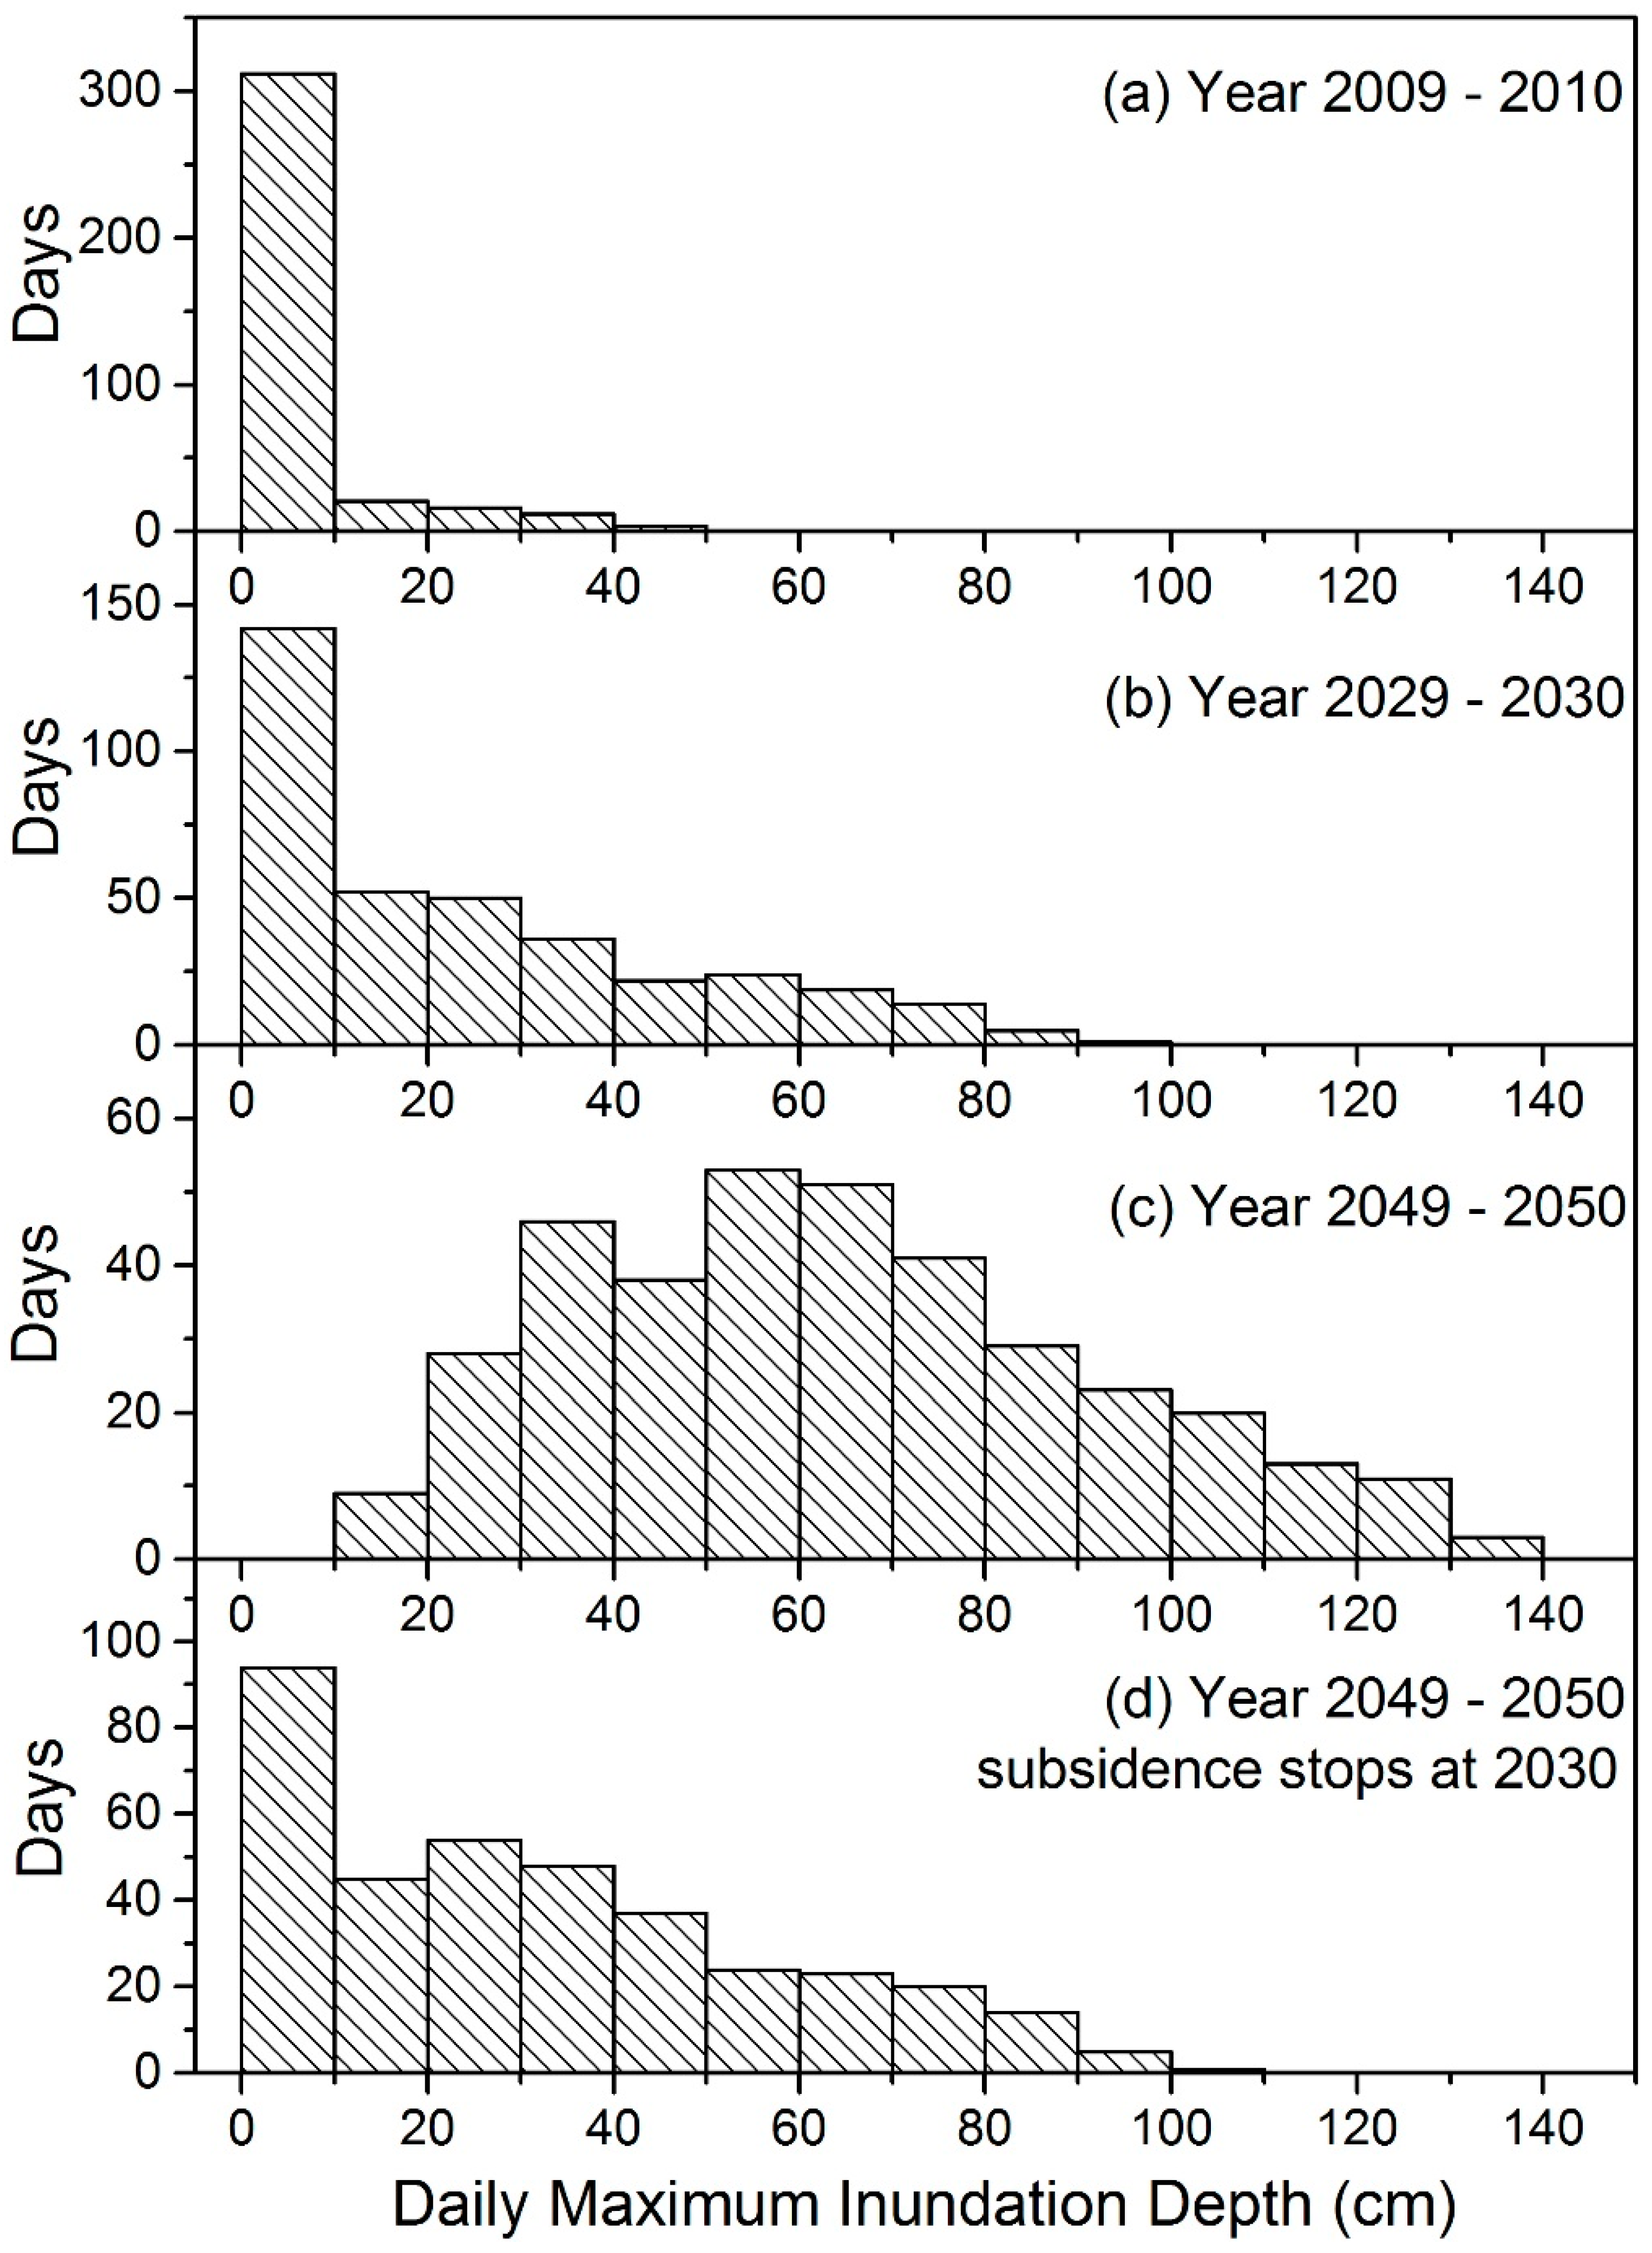
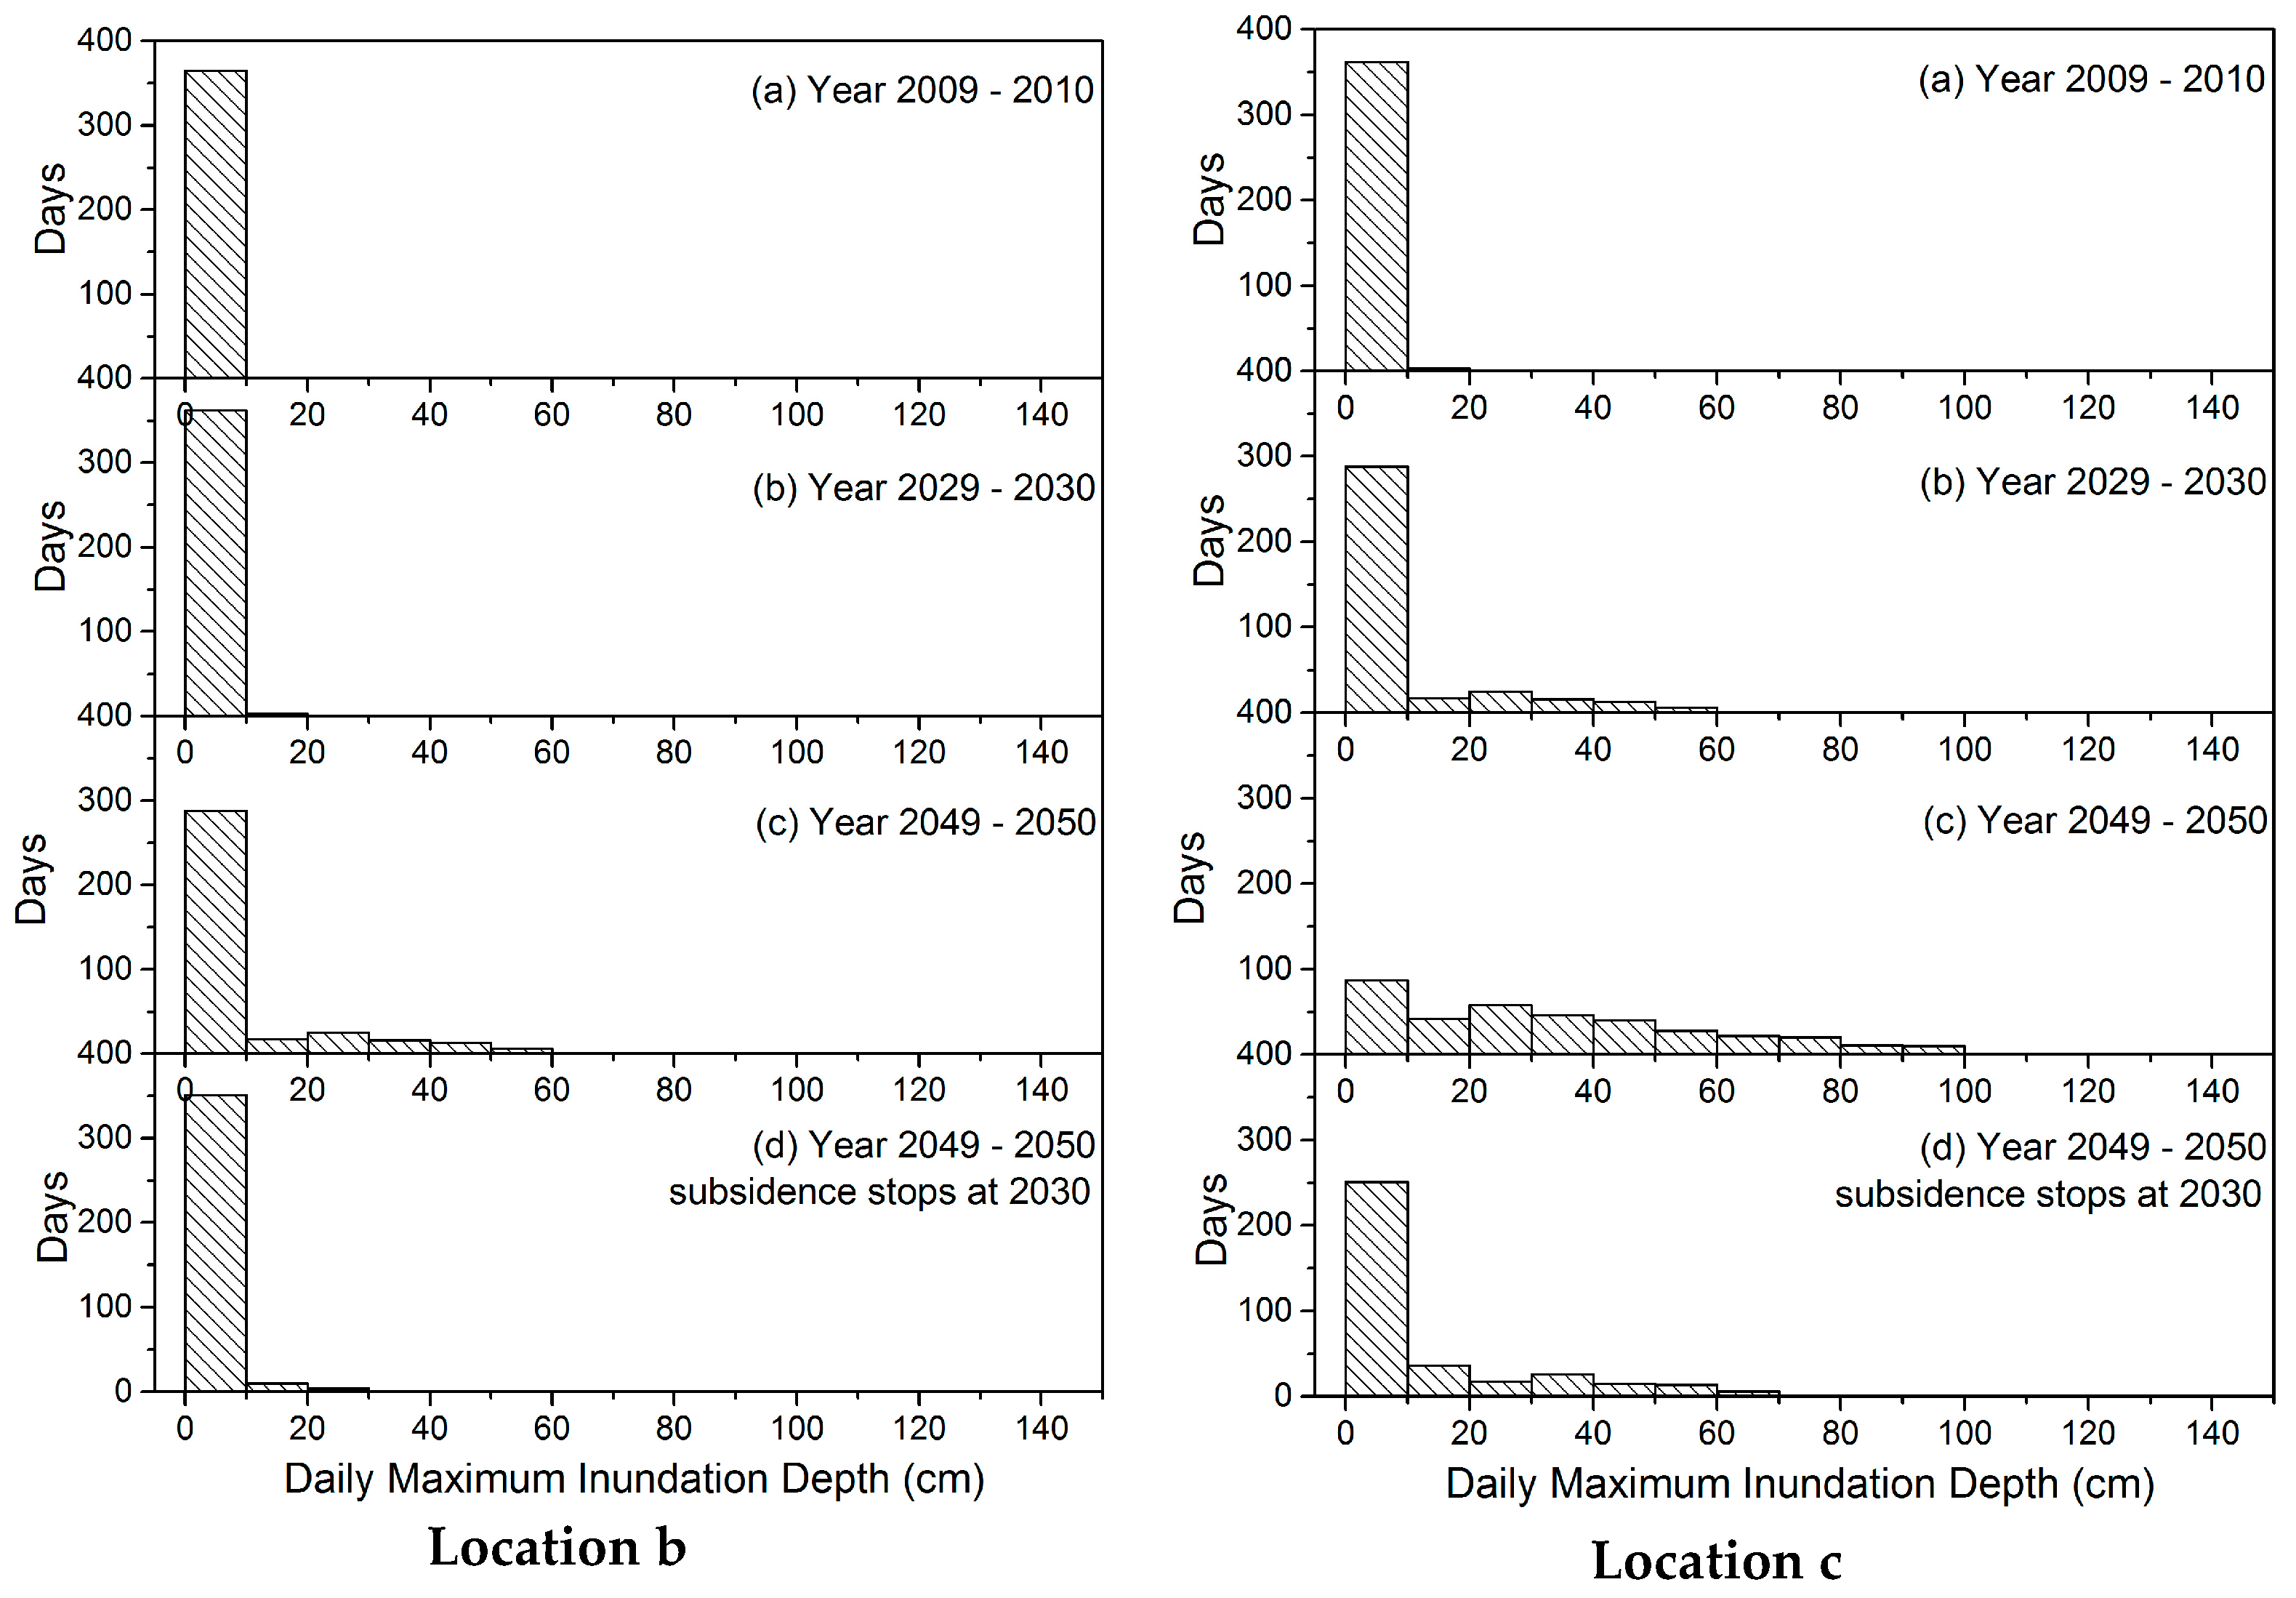
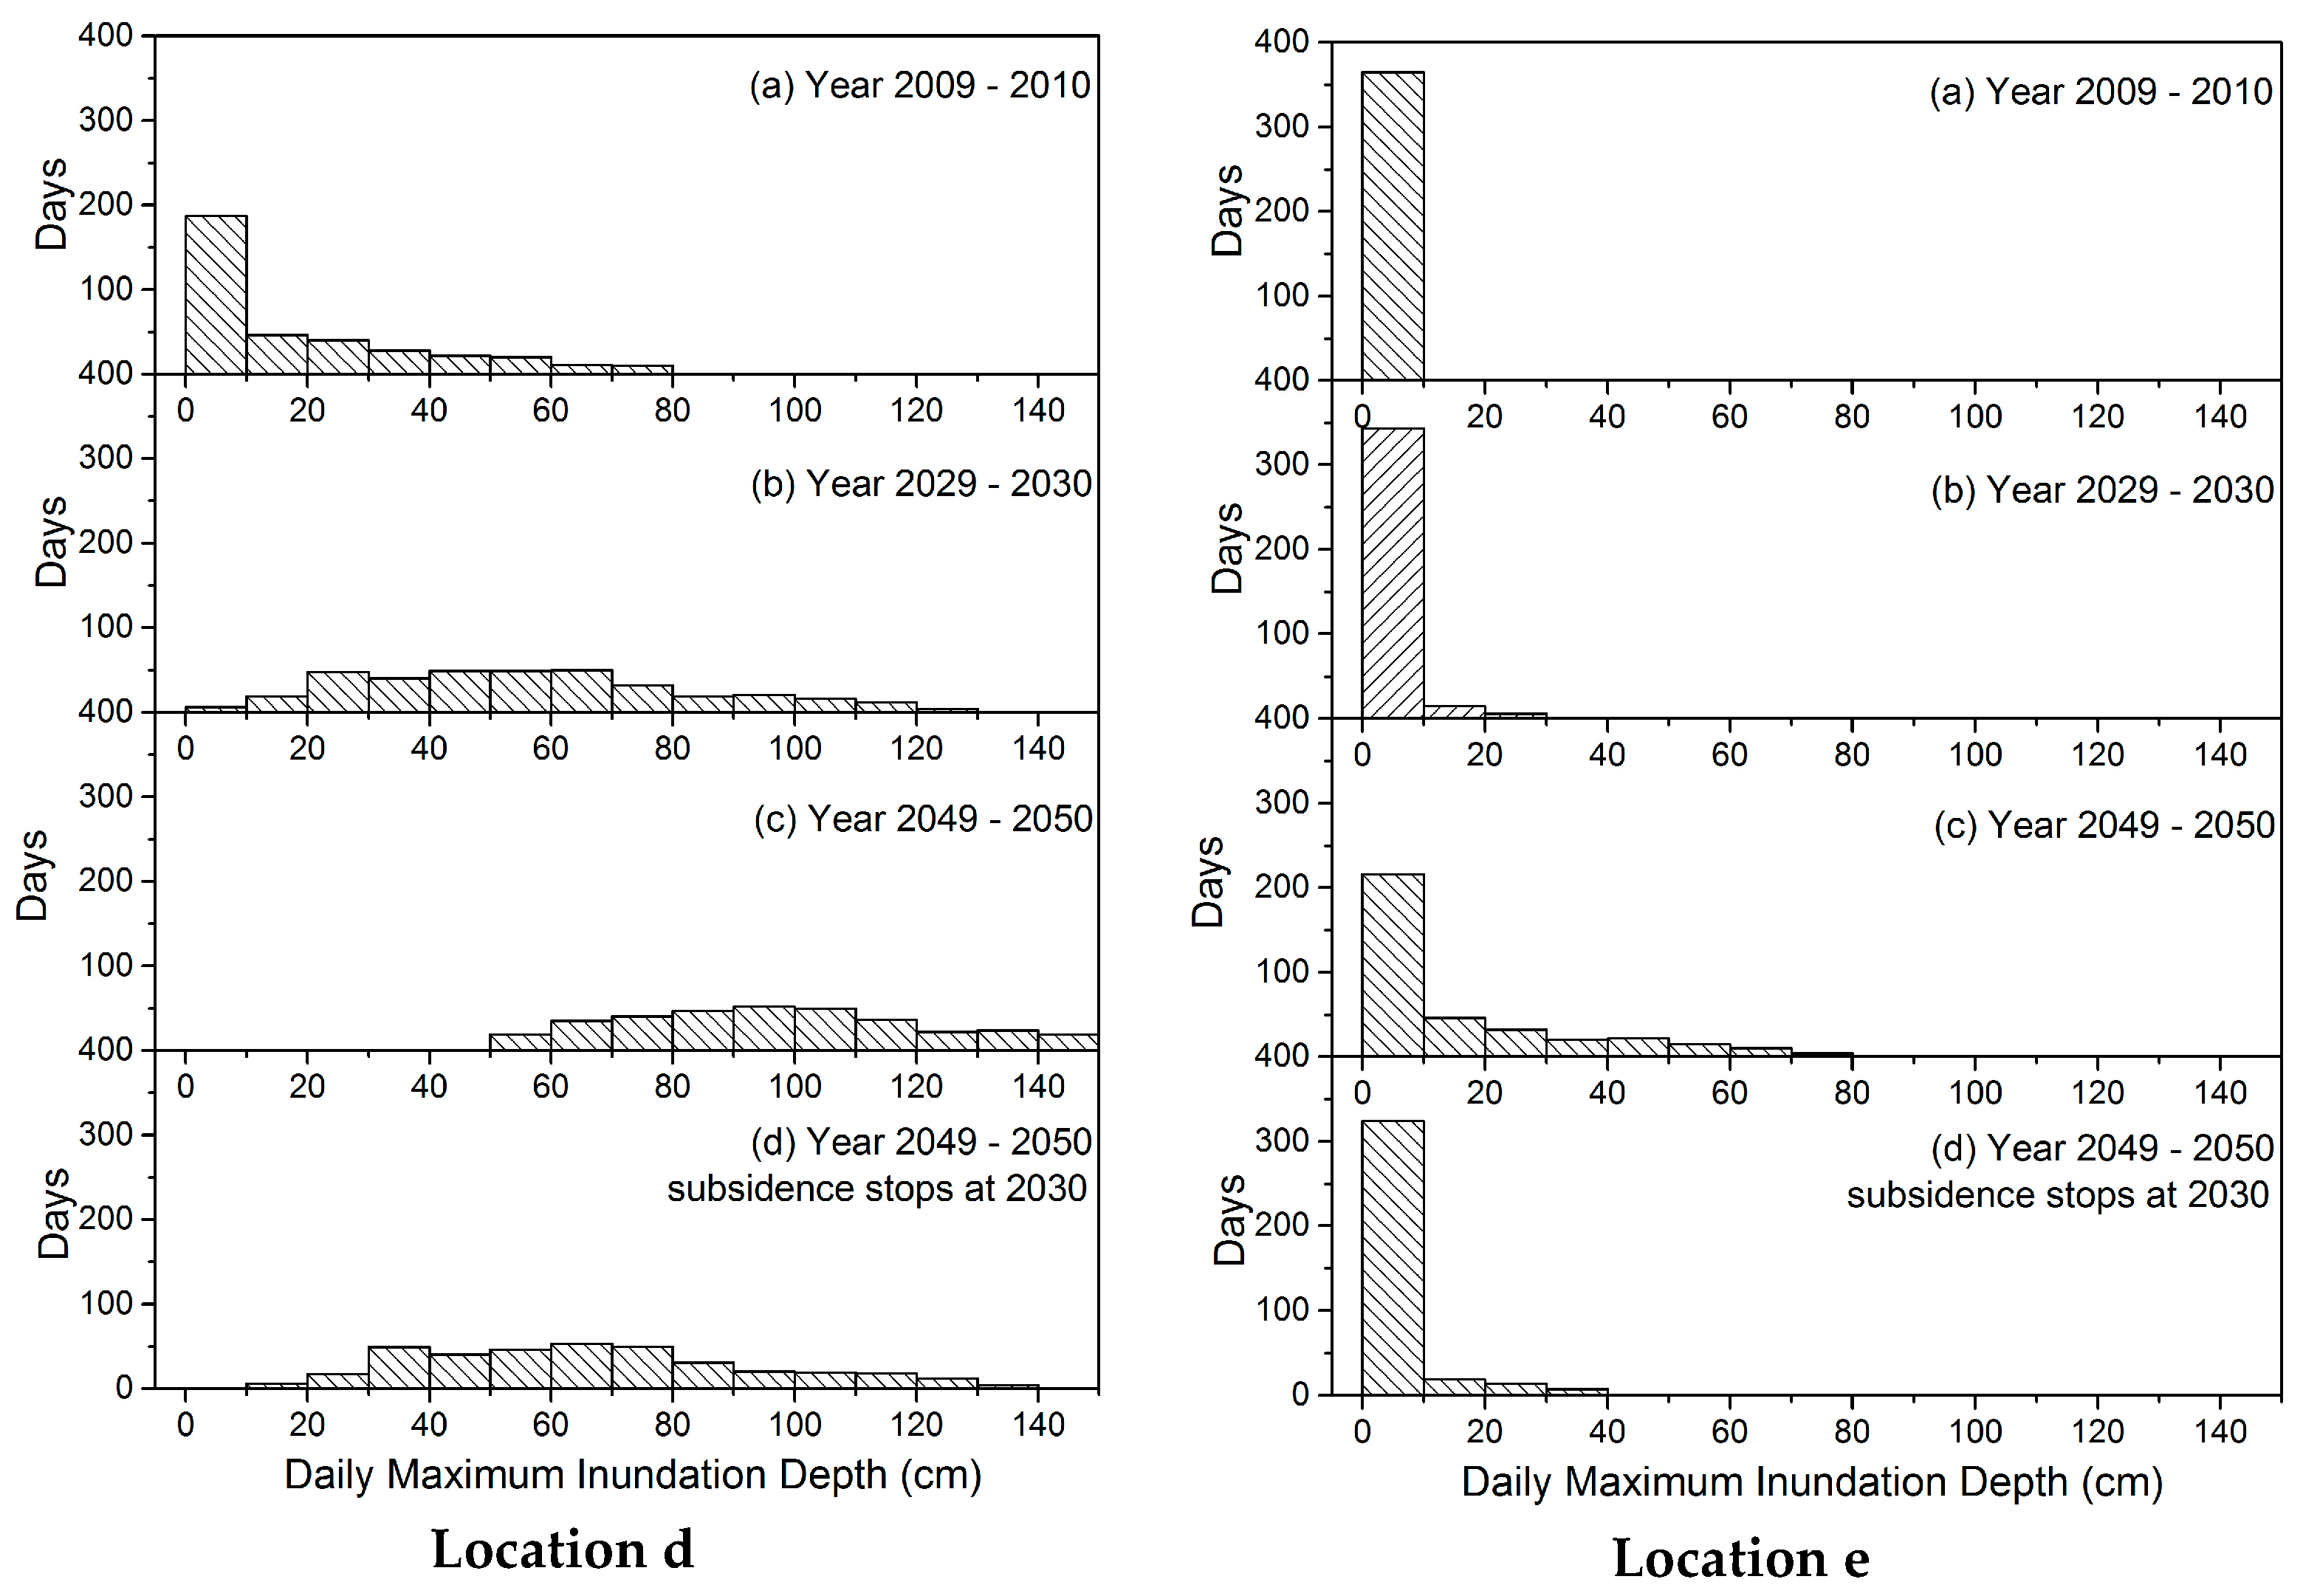
3.2. Inundation Frequency and Depth in the Near Future

The potential inundation depth in the central district of Can Tho (Figure 2) can be obtained by using the MRC water level data and the measured ground elevation [21]. Using water level data, the relative water level in the city from the base point situated on the riverbank (see Figure 2a and Figure A1) could be obtained by vertically shifting the original MRC data down 1.5 m (because a water level of +1.5 m coincides with the ground surface of the riverbank) [21]. The present research extends their methodology [21] to investigate how seriously inundation may increase as a result of the changing environment. Figure 5 indicates that the ground around this city centre area is estimated to have experienced floods for a total of 72 days between 2009 and 2010. Therefore, in the first place, it needs to be recognised that inundation has already become a significant issue over the region, as also verified by many previous researchers [15,21,37].
Figure 5 also indicates how inundation would become more common in the near future, caused by SLR of 5.2 mm·yr−1 along with land subsidence at a rate of 17.1 mm·yr−1. The authors attempted to project flood situations in the close future, in order to provide an image of the situation that local habitants will most likely face. The main scenario is that both SLR and land subsidence will start from 2010 (considered the present condition) and continue until 2050 at the estimated rates. Another scenario is the case that land subsidence stops at 2030, while SLR will further continue until 2050.
The duration of flood in the city will be significantly prolonged from the present total days of 72 days per year, to 270 days per year in the period between 2029 and 2030 and 365 days per year between 2049 and 2050. Furthermore, according to the distribution shown in Figure 5, the ground will be inundated during all seasons of the year, whereas presently inundation is limited to the flood season (particularly, October and November. See Table A1).
Inundation depths will also become more significant with the increase in SLR and subsidence as shown in Figure 6 (see also Figure A2 for other locations in the city). Under the present conditions, daily maximum inundation depth is generally shallower than 10 cm, whereas if no effective action is taken to curb the effects of SLR and subsidence, maximum inundation depth will drastically increase in the next 10–20 years, reaching up to 70 cm on average by 2050.

4. Discussion

The present inundation level at Can Tho City, which is predominantly lower than 10 cm, seems to be manageable for a population familiar with regular seasonal floods. Local inhabitants try to mitigate inundation damages on their properties by temporal countermeasures such as the flood protection wall shown in Figure 2e. These attempts seem to be effective in limiting the risk for now.
However, Figure 5 and Figure 6 demonstrate that the area will inevitably experience serious and persistent inundation in the coming decades, having a significant influence on many types of economic activities and crippling the daily lives of many.
This paper has only considered the effects of increased flooding from ongoing sea level rise combined with land subsidence, largely caused by excess groundwater withdrawal. With increasing CO2 emissions, significant additional SLR is inevitable and thus it is not expected to be possible to eliminate its effects in the short term. On the other hand, land subsidence can be halted by implementing reasonable countermeasures, as proven by a handful of successful cases in the other cities such as Tokyo [38]. Figure 5 shows that ending land subsidence by 2030 will contribute to decreasing the duration of inundation by about 50 days compared to the 2050 scenario with continued subsidence. The reason of that 2030 was selected as an end date for land subsidence in this scenario is that land subsidence appears not to stop immediately, but continues for a long period even after mitigation plans are taken. For example, Tokyo took about 15 years to stop land subsidence after legal regulations such as the Industrial Water Act were put in place [38].
Given the consequences caused by SLR and subsidence, some kind of structural measures need to be implemented by responsible agencies: these may include constructing dykes and raising roads. If these countermeasures fail to enable local populations to continue their lives normally, many local inhabitants will be faced with environmental displacement as warned by some researchers (e.g., [3,39]).
However, it should be noted that if these structural measures are not implemented as part of well-considered plans and designs, it would create more serious consequences in some areas, while substantially eliminating the risks in others. Since the rate of subsidence varies from place to place because of differences in the composition of the subsurface, degree of extraction of groundwater, or loads of buildings, floodwaters tend to concentrate in particular spots which are substantially lower in elevation than their surroundings. Public health can be threatened by stagnant or reverse water from sewer systems. Thus, well-considered management plans for coping with these immediate and future threats must be developed first and foremost.
The present study assumed that the pattern of water levels observed in the period between July 2009 and June 2010 will repeat in the future. This means that future water levels were given as a prerequisite and treated deterministically in this study, neglecting interannual or interdecadal variations. However, this simplification will inevitably bring about some amount of error in flood projection. For instance, Figure 7 shows that water levels are clearly changing in response to seasonal tidal patterns in addition to predominant semi-diurnal or diurnal tidal fluctuations. In two of the plots shown in the figure, predicted water levels derived by the tidal harmonic analysis do not show substantial differences from year to year with respect to both annual highest and lowest water levels. On the other hand, annual highest water level in the recorded water levels appears to be changing year by year (e.g., about 30 cm between October 2009 and October 2011). This was likely caused by a difference in year-by-year variation of discharge from the upstream river. The hydrological statistics compiled by MONRE (2011) [40] also shows that for the 2000 and 2010 data series, the yearly maximum water levels at Can Tho varied from a minimum of 1.79 m in 2000 to a maximum of 2.03 m in 2007, demonstrating that maximum water levels are fundamentally fluctuating over many years. In this sense, the maximum level of 1.93 m recorded in the period between July 2009 and June 2010 can be considered to represent a typical value of maximum high water levels in recent years. Figure 7 also appends the statistics of observed data for two intervals, July 2009–June 2010 and July 2009–June 2012, in order to show that the standard deviation of water levels does not significantly change according to the period. Although the maximum and mean water level could be both increasing as time passes due to the combined influences of SLR and land subsidence, the short-period water-level fluctuation that could be represented by the standard deviation is relatively stable. This observation further supports that the one-year-period data between July 2009 and June 2010 could be recognized as water levels measured in a typical one-year in terms of water level characteristics.

5. Conclusions

People in the Mekong Delta have traditionally lived with floods, and thus there is certain resilience among residents in coping with small floods. Inundation is mostly limited to the flood season at present. In the near future, however, it may occur during any season of the year due to the combined impact of SLR and land subsidence, posing a significant threat to these low-lying communities. It is important to note that inundation could become more persistent and frequent, even without extreme SLR scenarios. Such floods can have a great impact on the daily life of local inhabitants in the Mekong Delta. Thus, particular attention should be paid to this problem to promote measures to cope with potential extensive floods in the immediate future.

Acknowledgments

The present research was funded by the JSPS KAKENHI Grant Number 26702009. The authors thank Tran Van Ty, Van Pham Dan Tri, Tran Thi Le Hang, Shintaro Maeda, Yuto Takahashi, and Chiaki Tsurudome for their cooperation during the field surveys in the Mekong Delta over the last 5 years.

Author Contributions

Hiroshi Takagi analysed the data, projected the future floods, and wrote the paper. Nguyen Danh Thao and Le Tuan Anh led the field surveys. All authors read and approved the manuscript.

Conflicts of Interest

The authors declare no conflict of interest.

Appendix A

Figure A1. Relative ground levels (meter), which are shown in yellow, were measured from the height at the base point on the riverbank of Can Tho, Vietnam, using the Static GPS. Locations: (a) the main road crossing the city center, discussed in the main text (see Figure 2f); (b) a road raised by about a half meter; (c) a market street closed to the river; (d) a reclaimed area around a low-lying swamp; and (e) the road in front of Can Tho University.
Sustainability 08 00959 g008
Figure A2. Histogram of the counted days when inundations take place in the four locations shown in Figure A1 for future scenarios and present conditions, derived from one year-long tidal record between July 2009 and June 2010.
Sustainability 08 00959 g009aSustainability 08 00959 g009b
Table A1. Inundated days in each month for the scenarios (recompilation of Figure 5).
2009–20102029–20302049–20502049–2050 Subsidence Stops at 2030
January6283130
February2172820
March0243127
April0183022
May0153118
June083021
July3173126
August8253128
September8263028
October21313131
November19303030
December5313131
Total72270365312

References

  1. WWF. The Greater Mekong and Climate Change: Biodiversity, Ecosystem Services and Development at Risk; WWF: Bangkok, Thailand, 2009; p. 34. [Google Scholar]
  2. Thi Thuy, H.P.; Furukawa, M. Impact of sea level rise on coastal zone of Vietnam. Bull. Coll. Sci. Univ. Ryukyu 2007, 84, 45–59. [Google Scholar]
  3. Dasgupta, S.; Laplante, B.; Meisner, C.; Wheeler, D.; Yan, J. The Impact of Sea Level Rise on Developing Countries: A Comparative Analysis. World Bank Policy Research Working Paper 4136. 2007. Available online: https://openknowledge.worldbank.org/bitstream/handle/10986/7174/wps4136.pdf (accessed on 13 September 2016).
  4. Wassmann, R.; Hien, N.X.; Hoanh, C.T.; Tuong, T.P. Sea level rise affecting the Vietnamese Mekong delta: Water elevation in the flood season and implications for rice production. Clim. Chang. 2004, 66, 89–107. [Google Scholar] [CrossRef]
  5. Carew-Reid, J. Rapid Assessment of the Extent and Impact of Sea Level Rise in Viet Nam; ICEM—International Centre for Environmental Management: Sydney, Australia, 2008; p. 74. [Google Scholar]
  6. Nerem, R.S.; Chambers, D.P.; Leuliette, E.W. Variations in global mean sea level associated with the 1997–1998 ENSO event: Implications for measuring long term sea level change. Geophys. Res. Lett. 1999, 26, 3005–3008. [Google Scholar] [CrossRef]
  7. Becker, A.; Toilliez, J.O.; Mitchell, T.J. Considering sea level change when designing marine civil works: Recommendations for best practices. In Handbook of Coastal Disaster Mitigation for Engineers and Planners; Esteban, M., Takagi, H., Shibayama, T., Eds.; Elsevier: New York, NY, USA, 2015; pp. 697–722. [Google Scholar]
  8. Takagi, H.; Thao, N.D.; Esteban, M.; Tran, T.T.; Knaepen, H.L.; Mikami, T. Vulnerability of coastal areas in southern Vietnam against tropical cyclones and storm surges. In Proceedings of the 4th International Conference on Estuaries and Coasts (ICEC), Hanoi, Vietnam, 8–11 October 2012; pp. 292–299.
  9. Esteban, M.; Thao, N.D.; Takagi, H.; Shibayama, T. Increase in port downtime and damage in Vietnam due to a potential increase in tropical cyclone intensity. In Climate Change and the Sustainable Use of Water Resources; Leal Filho, W., Ed.; Springer: Berlin/Heidelberg, Germany, 2012. [Google Scholar]
  10. Takagi, H.; Thao, N.D.; Esteban, M. Tropical cyclones and storm surges in southern Vietnam. In Coastal Disasters and Climate Change in Vietnam: Engineering and Planning Perspectives; Thao, N.D., Takagi, H., Esteban, M., Eds.; Elsevier: New York, NY, USA, 2014; pp. 3–16. [Google Scholar]
  11. Takagi, H.; Thao, N.D.; Esteban, M.; Mikami, T.; Cong, L.V.; Ca, V.T. Coastal Disasters in Vietnam. In Handbook of Coastal Disaster Mitigation for Engineers and Planners; Esteban, M., Takagi, H., Shibayama, T., Eds.; Elsevier: New York, NY, USA, 2015; pp. 235–255. [Google Scholar]
  12. Mekong River Commission (MRC). State of the Basin Report 2010; MRC: Vientiane, Laos, 2010; p. 232. [Google Scholar]
  13. Syvitski, J.P.M.; Kettner, A.J.; Overeem, I.; Hutton, E.W.H.; Hannon, M.T.; Brakenridge, G.R.; Day, J.; Vörösmarty, C.; Saito, Y.; Giosan, L.; et al. Sinking deltas due to human activities. Nat. Geosci. 2009, 2, 681–686. [Google Scholar] [CrossRef]
  14. Erban, L.E.; Gorelick, S.M.; Zebker, H.A. Groundwater extraction, land subsidence, and sea-level rise in the Mekong Delta, Vietnam. Environ. Res. Lett. 2014, 9. [Google Scholar] [CrossRef]
  15. Huong, H.T.L.; Pathirana, A. Urbanization and climate change impacts on future urban flooding in Can Tho city, Vietnam. Hydrol. Earth Syst. Sci. 2013, 17, 379–394. [Google Scholar] [CrossRef]
  16. Schmidt, C. Alarm over a sinking delta. Science 2015, 348, 845–846. [Google Scholar] [CrossRef] [PubMed]
  17. Food and Agriculture Organization of the United Nations (FAO). Rice Market Monitor. Volume XIV—Issue No. 2. 2011, p. 35. Available online: http://www.fao.org/docrep/014/am491e/am491e00.pdf (accessed on 13 September 2016).
  18. Thao, N.D.; Takagi, H.; Esteban, M. (Eds.) Coastal Disasters and Climate Change in Vietnam—Engineering and Planning Perspectives; Elsevier: New York, NY, USA, 2014; p. 424.
  19. Trung, N.H.; Tri, V.P.D. Possible impacts of seawater intrusion and strategies for water management in coastal areas in the Vietnamese Mekong delta in the context of climate change. In Coastal Disasters and Climate Change in Vietnam: Engineering and Planning Perspectives; Thao, N.D., Takagi, H., Esteban, M., Eds.; Elsevier: New York, NY, USA, 2014; pp. 219–232. [Google Scholar]
  20. Smajgl, A.; Toan, T.Q.; Nhan, D.K.; Ward, J.; Trung, N.H.; Tri, L.Q.; Tri, V.P.D.; Vu, P.T. Responding to rising sea levels in the Mekong Delta. Nat. Clim. Chang. 2015, 5, 167–174. [Google Scholar] [CrossRef]
  21. Takagi, H.; Ty, T.V.; Thao, N.D.; Esteban, M. Ocean tides and the influence of sea-level rise on floods in urban areas of the Mekong Delta. J. Flood Risk Manag. 2014, 8, 292–300. [Google Scholar] [CrossRef]
  22. Mekong River Commission (MRC). Overview of the Hydrology of the Mekong Basin; MRC: Vientiane, Laos, 2005. [Google Scholar]
  23. Apel, H.; Trepat, O.M.; Hung, N.N.; Chinh, D.T.; Metz, B.; Dung, N.V. Combined fluvial and pluvial urban flood hazard analysis: Concept development and application to Can Tho city, Mekong Delta, Vietnam. Nat. Hazards Earth Syst. Sci. 2016, 16, 941–961. [Google Scholar] [CrossRef]
  24. Fujihara, Y.; Hoshikawa, K.; Fujii, H.; Kotera, A.; Nagano, T.; Yokoyama, S. Analysis and attribution of trends in water levels in the Vietnamese Mekong Delta. Hydrol. Process. 2015. [Google Scholar] [CrossRef]
  25. Takagi, H.; Tsurudome, C.; Thao, N.D.; Le, T.A.; Tran, V.T.; Van, P.D.T. Ocean tidal modelling for urban flood risk assessment in the Mekong Delta. Hydrol. Res. Lett. 2016, 10, 21–26. [Google Scholar] [CrossRef]
  26. Ministry of Natural Resources and Environment (MONRE). Climate Change, Sea Level Rise Scenarios for Viet Nam, Ministry of Natural Resources and Environment of Vietnam; MONRE: Bangkok, Thailand, 2009.
  27. Thanh, N.D. Climate Change in the Coastal Regions of Vietnam. In Coastal Disasters and Climate Change in Vietnam: Engineering and Planning Perspectives, 1st ed.; Thao, N.D., Takagi, H., Esteban, M., Eds.; Elsevier: New York, NY, USA, 2014; pp. 175–198. [Google Scholar]
  28. Intergovernmental Panel on Climate Change (IPCC). Climate Change 2013—The Physical Science Basis. Working Group I Contribution to the Fifth Assessment Report of the Intergovernmental Panel on Climate Change; Cambridge University Press: Cambridge, UK, 2013; p. 1552. [Google Scholar]
  29. Watson, C.S.; White, N.J.; Church, J.A.; King, M.A.; Burgette, R.J.; Legresy, B. Unabated global mean sea-level rise over the satellite altimeter era. Nat. Clim. Chang. 2015, 5, 565–568. [Google Scholar] [CrossRef]
  30. DeConto, R.; Pollard, D. Contribution of Antarctica to past and future sea level rise. Nature 2016, 531, 591. [Google Scholar] [CrossRef] [PubMed]
  31. Shoji, D. On the variations of the daily mean sea levels along the Japanese Islands. J. Oceanograph. Soc. Jpn. 1961, 17, 21–32. [Google Scholar]
  32. Kitade, Y.; Matsuyama, M. Coastal-trapped waves with several-day period caused by wind along the southeast coast of Honshu, Japan. J. Oceanogr. 2000, 56, 727–744. [Google Scholar] [CrossRef]
  33. Takagi, H.; Kidu, S.; Shibayama, T. Analysis of Abnormal Tides in Tokyo Bay induced by Incoming Continental-shelf Waves. Jpn. Soc. Civ. Eng. 2008, 55, 1306–1310. [Google Scholar]
  34. Takagi, H.; Esteban, M.; Mikami, T.; Fujii, D. Projection of coastal floods in 2050 Jakarta. Urban Clim. 2016, 17, 135–145. [Google Scholar] [CrossRef]
  35. Delgado, J.M.; Apel, H.; Merz, B. Flood trends and variability in the Mekong River. Hydrol. Earth Syst. Sci. 2010, 14, 407–418. [Google Scholar] [CrossRef]
  36. Be, T.T.; Sinh, B.T.; Miller, F. (Eds.) Challenges to Sustainable Development in the Mekong Delta: Regional and National Policy Issues and Research Needs: Literature Analysis; The Sustainable Mekong Research Network: Bangkok, Thailand, 2007; p. 208.
  37. Toan, T.Q. Climate change and sea level rise in the Mekong delta: Flood. In Coastal Disasters and Climate Change in Vietnam: Engineering and Planning Perspectives; Thao, N.D., Takagi, H., Esteban, M., Eds.; Elsevier: New York, NY, USA, 2014; pp. 199–218. [Google Scholar]
  38. Land Bureau, Japan. Ground Water Map—Chiba Tokyo Kanagawa Prefectures District; Land Bureau: Tokyo, Japan, 1996; p. 142. (In Japanese)
  39. Yamamoto, L. Environmental displacement in Vietnam. In Coastal Disasters and Climate Change in Vietnam: Engineering and Planning Perspectives; Thao, N.D., Takagi, H., Esteban, M., Eds.; Elsevier: New York, NY, USA, 2014; pp. 379–393. [Google Scholar]
  40. Ministry of Natural Resources and Environment (MONRE). Natural Hydrological Report of Can Tho Station 2000–2010; MONRE: Bangkok, Thailand, 2011. (In Vietnamese)
Figure 1. Can Tho is located in the southern Vietnam. Three tide stations, at Dinh An, Can Tho, and Chau Doc, are located along the Hau River. The location of the station operated by MRC is indicated on the enlarged map. The authors investigate how inundation will be exacerbated in the near future, focusing on one location in the city center.
Sustainability 08 00959 g001
Figure 2. River water frequently intrudes across the riverbank (a,b), or through the sewage system (c,d), and inundates roads, not receding for hours. An improvised flood protection board in front of a residential house is shown in (e). The main road runs across the central district (Ninh Kiu District). A precise ground elevation survey was carried out by the authors with the static GPS method (f). Photos taken in Can Tho on March 2012 (f), August 2014 (ac,e), and November 2014 (d) by the authors.
Sustainability 08 00959 g002aSustainability 08 00959 g002b
Figure 3. Water level amplitudes at Dinh An and Can Tho estimated by the Fourier analysis [21].
Sustainability 08 00959 g003
Figure 4. Water levels off the coast of Vietnam (orange on (a)), at Can Tho (blue on (a)), and at Chau Doc (b). Measurements of sea levels off the coast of Vietnam taken from the TOPEX and Jason series of satellite radar altimeters (reproduced using the Regional Sea Level Data of the University of Colorado). Yearly maximum water levels at Can Tho Monitoring Station (80 km inland) and Chau Doc Monitoring Station (190 km inland) were derived from the MRC data. The grey line on (a) shows the result of harmonic analysis of 60 tidal constituents at Can Tho, showing the yearly maximum water levels and rate of change.
Sustainability 08 00959 g004
Figure 5. Distribution of the days when the main road in downtown Can Tho (Ninh Kieu District) is potentially inundated under present and future SLR—Land Subsidence scenarios. Vertical bars indicate the days the ground would be flooded. The analysis was made using the GPS ground elevations and the MRC water levels. Note that it was assumed that water levels appeared for the period between 2009 and 2010 will simply repeat in the future, while SLR and subsidence progress with the passage of time. Inundated frequency counted according to each month is listed in Table A1.
Sustainability 08 00959 g005
Figure 6. Histogram of the counted days when inundations take place on one of the main roads in Can Tho for future scenarios and present conditions: (a) 2009–2010 (present); (b) 2029–2030 period under current projections for land subsidence and SLR; (c) 2049–2050 period under current projections for land subsidence and SLR; (d) 2049–2050 period, hypothesising that land subsidence stops at 2030, while SLR continues until 2050.
Sustainability 08 00959 g006
Figure 7. Observed and predicted water levels at a one-hour interval from January 2009 to June 2012. The rectangle indicates the one-year period in which the authors used the data as a baseline for representing the present water levels (see Figure 5 and Figure 6).
Sustainability 08 00959 g007
Table 1. Five principal tidal constituents at Can Tho Station: Amplitude (cm) and phase (degree).
M2N2S2K1O1
AmplitudePhaseAmplitudePhaseAmplitudePhaseAmplitudePhaseAmplitudePhase
51.9152.49.7118.717.7198.035.118.221.3324.3

