1. Introduction
Recent concerns with long-term sustainability, adaptive capacity, and resilience have led to rapid growth in studies of ecological and social phenomena, including examinations of social-ecological governance and networks [
1,
2,
3,
4,
5,
6,
7,
8]. Researchers have advanced scholarship characterizing the structures of the social networks that govern ecological resources [
2,
3,
4,
5]. However, they have faced challenges in describing or quantifying the interactions among the social and ecological components of the system [
6], particularly when crossing multiple boundaries [
7]. This is especially problematic when trying to identify and evaluate sustainability outcomes in urban areas, where the social and governance characteristics of a system are many and the interactions are complex [
8].
Urban sustainability is characterized by a complex array of public, private, and civil society actors that highlight the multi-purpose governance challenges that cities face today [
9,
10]. Indeed, there is growing appreciation that “it takes a network” for cities to become more sustainable and resilient [
9]. Recent research on ”civic stewardship” has focused on how locally based groups across the United States have responded to public problems by working along with, and outside of, government agencies and the private business sector [
11,
12]. Stewardship, in this case, refers to conserving, managing, caring for, monitoring, advocating for, and educating the public about local environments. Civic stewardship also means recognizing that ecological and social scientists must look beyond disciplinary boundaries and technical approaches and engage a variety of stakeholders in order to find acceptable solutions to complex problems [
5,
12].
One perspective to assess the social complexity involved in civic stewardship systems is social network analysis. Relevant examples include using network analysis to examine stakeholder relationships in resource management [
3,
13]; social capital in collaborative planning [
14]; structure and effectiveness of networks facilitated by federal programs [
15,
16]; and network governance of ecosystem services [
17,
18]. However, understanding the social is just one part of the equation. Despite an increase in research on integrated social-ecological governance systems [
6,
8], few social network analysis studies link social and ecological dimensions. Indeed, it is increasingly clear that there are no structured and systematic frameworks that integrate social and ecological phenomena. Such a framework could facilitate planning new urban stewardship network research, provide a basis for comparisons among cities and their urban stewardship networks, and guide evaluation of existing urban stewardship network research.
We outline critical features of a social-ecological framework for urban stewardship research, including: (1) hypothesis testing and theory development; (2) data standardization for collection at the same location over time and among different locations, allowing for a high degree of reproducibility and comparability; and (3) identifying the full range and relevant types of analyses for understanding governance networks for both research and application. In essence, the framework should prompt and assist researchers to be explicit and systematic about which theories, hypotheses, data, analyses, and interpretations are most relevant to their urban stewardship network questions.
In the following sections, we describe what we call the “STEW-MAP” framework and provide examples from a national collaborative research program in the United States to illustrate how this framework can be used. The Stewardship Mapping and Assessment Project (STEW-MAP) is an international effort to identify and evaluate the social networks and geographic extent of urban environmental stewardship organizations, and to examine relationships among and between these organizations and the ecological phenomena with which they interact [
19]. This study is currently being implemented in Baltimore, Chicago, Los Angeles, New York City, San Juan, and Seattle [
19]. Although efforts at research and practice are underway in each of these cities, the overall STEW-MAP program, as well as other urban ecology initiatives, lack a consistent framework to pose social-ecological questions, collect and analyze data, and work with practitioners to evaluate and apply research. We have developed this STEW-MAP framework in response to this need.
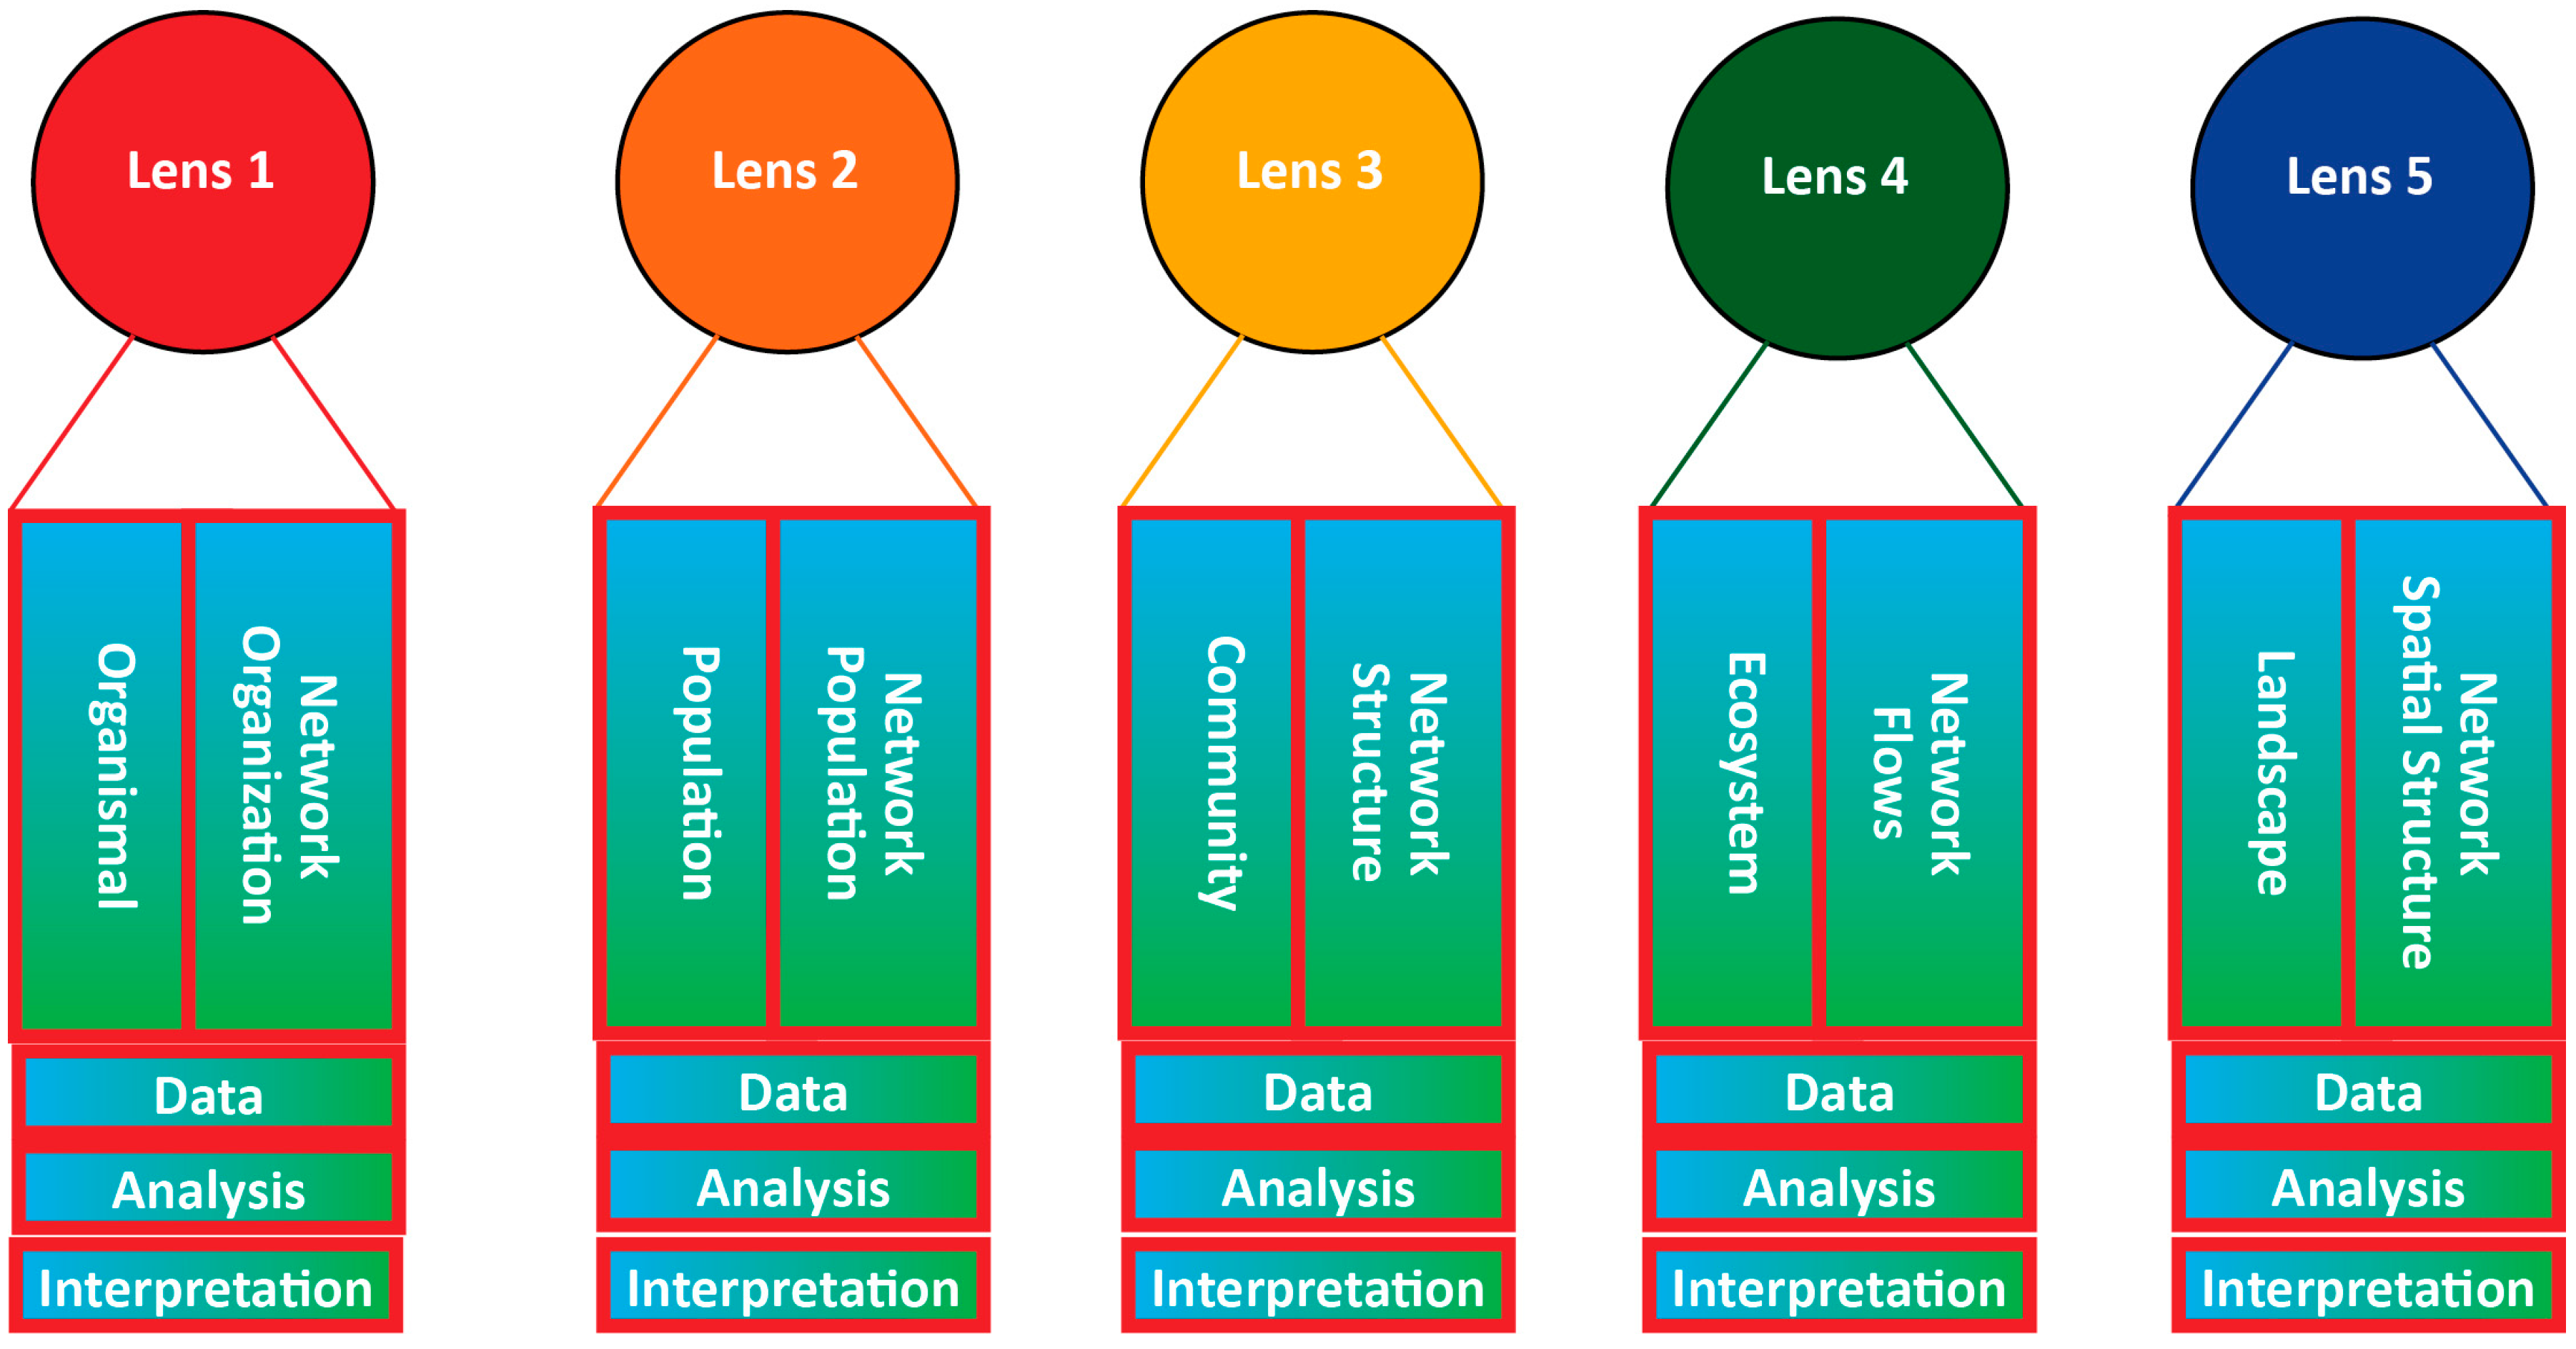
We have structured the remainder of the paper in the following way. First, we describe the framework and its five major components or lenses. For each lens, we describe the characteristic social and ecological questions, variables, and analyses. We describe both the ecological and social dimensions and, using published examples from Baltimore, MD, USA, New York City, NY, USA, Seattle, WA, USA, and San Juan, Puerto Rico (all part of the STEW-MAP program), we illustrate the social network components of each lens. In the third section, we return to the critical challenge of integrating social and ecological components and propose a novel and significant feature of the framework: its utility for generating and testing hypotheses about the governance of social-ecological systems by combining individual lenses and their social or ecological sub-components. Finally, we conclude by reflecting on the strengths and limitations of the STEW-MAP framework for advancing urban stewardship network research and applications.
2. The STEW-MAP Framework Lenses
Social and ecological sciences share one important quality in common: they both require a “theory of observation” [
20]. The study of urban social-ecological systems requires a focus on observation and measurement, with the understanding that our observations involve arbitrary structural decisions and categorizing phenomena. We acknowledge that these categories are often socially constructed, yet we find them useful as “lenses” to guide data collection, hypothesis development and testing, and evaluating research efforts. Allen and Hoekstra, in a Unified Ecology [
20], proposed that ecological phenomena such as population and ecosystem can be understood as a series of ecological lenses and used to guide the development of ecological theory and research. We extend this approach to lenses, using the ecological dimensions discussed by Allen and Hoekstra—organismal, population, community, ecosystem and landscape—and elaborate on associated dimensions of social phenomena to inform STEW-MAP urban social network research (
Figure 1).
It is important to emphasize that the ecological criteria we use as lenses are not meant to signify ordered or scale-defined levels. Following Allen and Hoekstra, these criteria “are not scalar but rather announce how one plans to study a slice of ecological material cut out for research. Criteria are the basis upon which one makes a decision as to what relationships are important in an ecological observation” [
20] (p. 17). While being sensitive to extrapolating natural science categories into the social world, we propose that the “lens” framework provides a useful tool for incorporating and combining different data types for social-ecological understandings of urban stewardship networks (
Table 1). In the following sub-sections, we describe the ecological and social components of each lens.
2.1. Lens 1: Organismal/Network Organizations
Lens 1 asks questions about individual organisms and individual organizations. For example, how does an individual organism/organization respond to changes in its environment? What influences its life cycle?
Organismal ecology examines the individual organism. Organisms are physically discrete, have genetic integrity, and have physiological integrity within and physiological autonomy from other organisms [
20]. Organismal ecologists ask questions about form, functional life cycle, life history, and speciation. Moreover, Allen and Hoekstra state, “there are individuals that could be defined as populations in their own right” [
20] (p. 43). This is also true of organizations, as they are collections of individual people and interactions.
For the social network component of Lens 1, organizations and their staff are of interest as discrete individual entities and as individual actors within a larger network. Through this lens, researchers examine organizational structure and function. Organizational research collects data about the properties of an organization such as its mission, number of employees, sources of funds and annual budget, or types of activities. Research on organizational function might examine how it was formed, employee motivations and interactions, organizational strategies, leadership roles, and how it responds to or creates social or environmental change. Using Lens 1, rich data are collected about individual organizations and their behaviors through in-depth qualitative methods such as interviews, document analysis, and case study research. Depending on the research question, organizations of study may range from the “hubs” or backbone organizations [
21] to peripheral, small volunteer-based community groups.
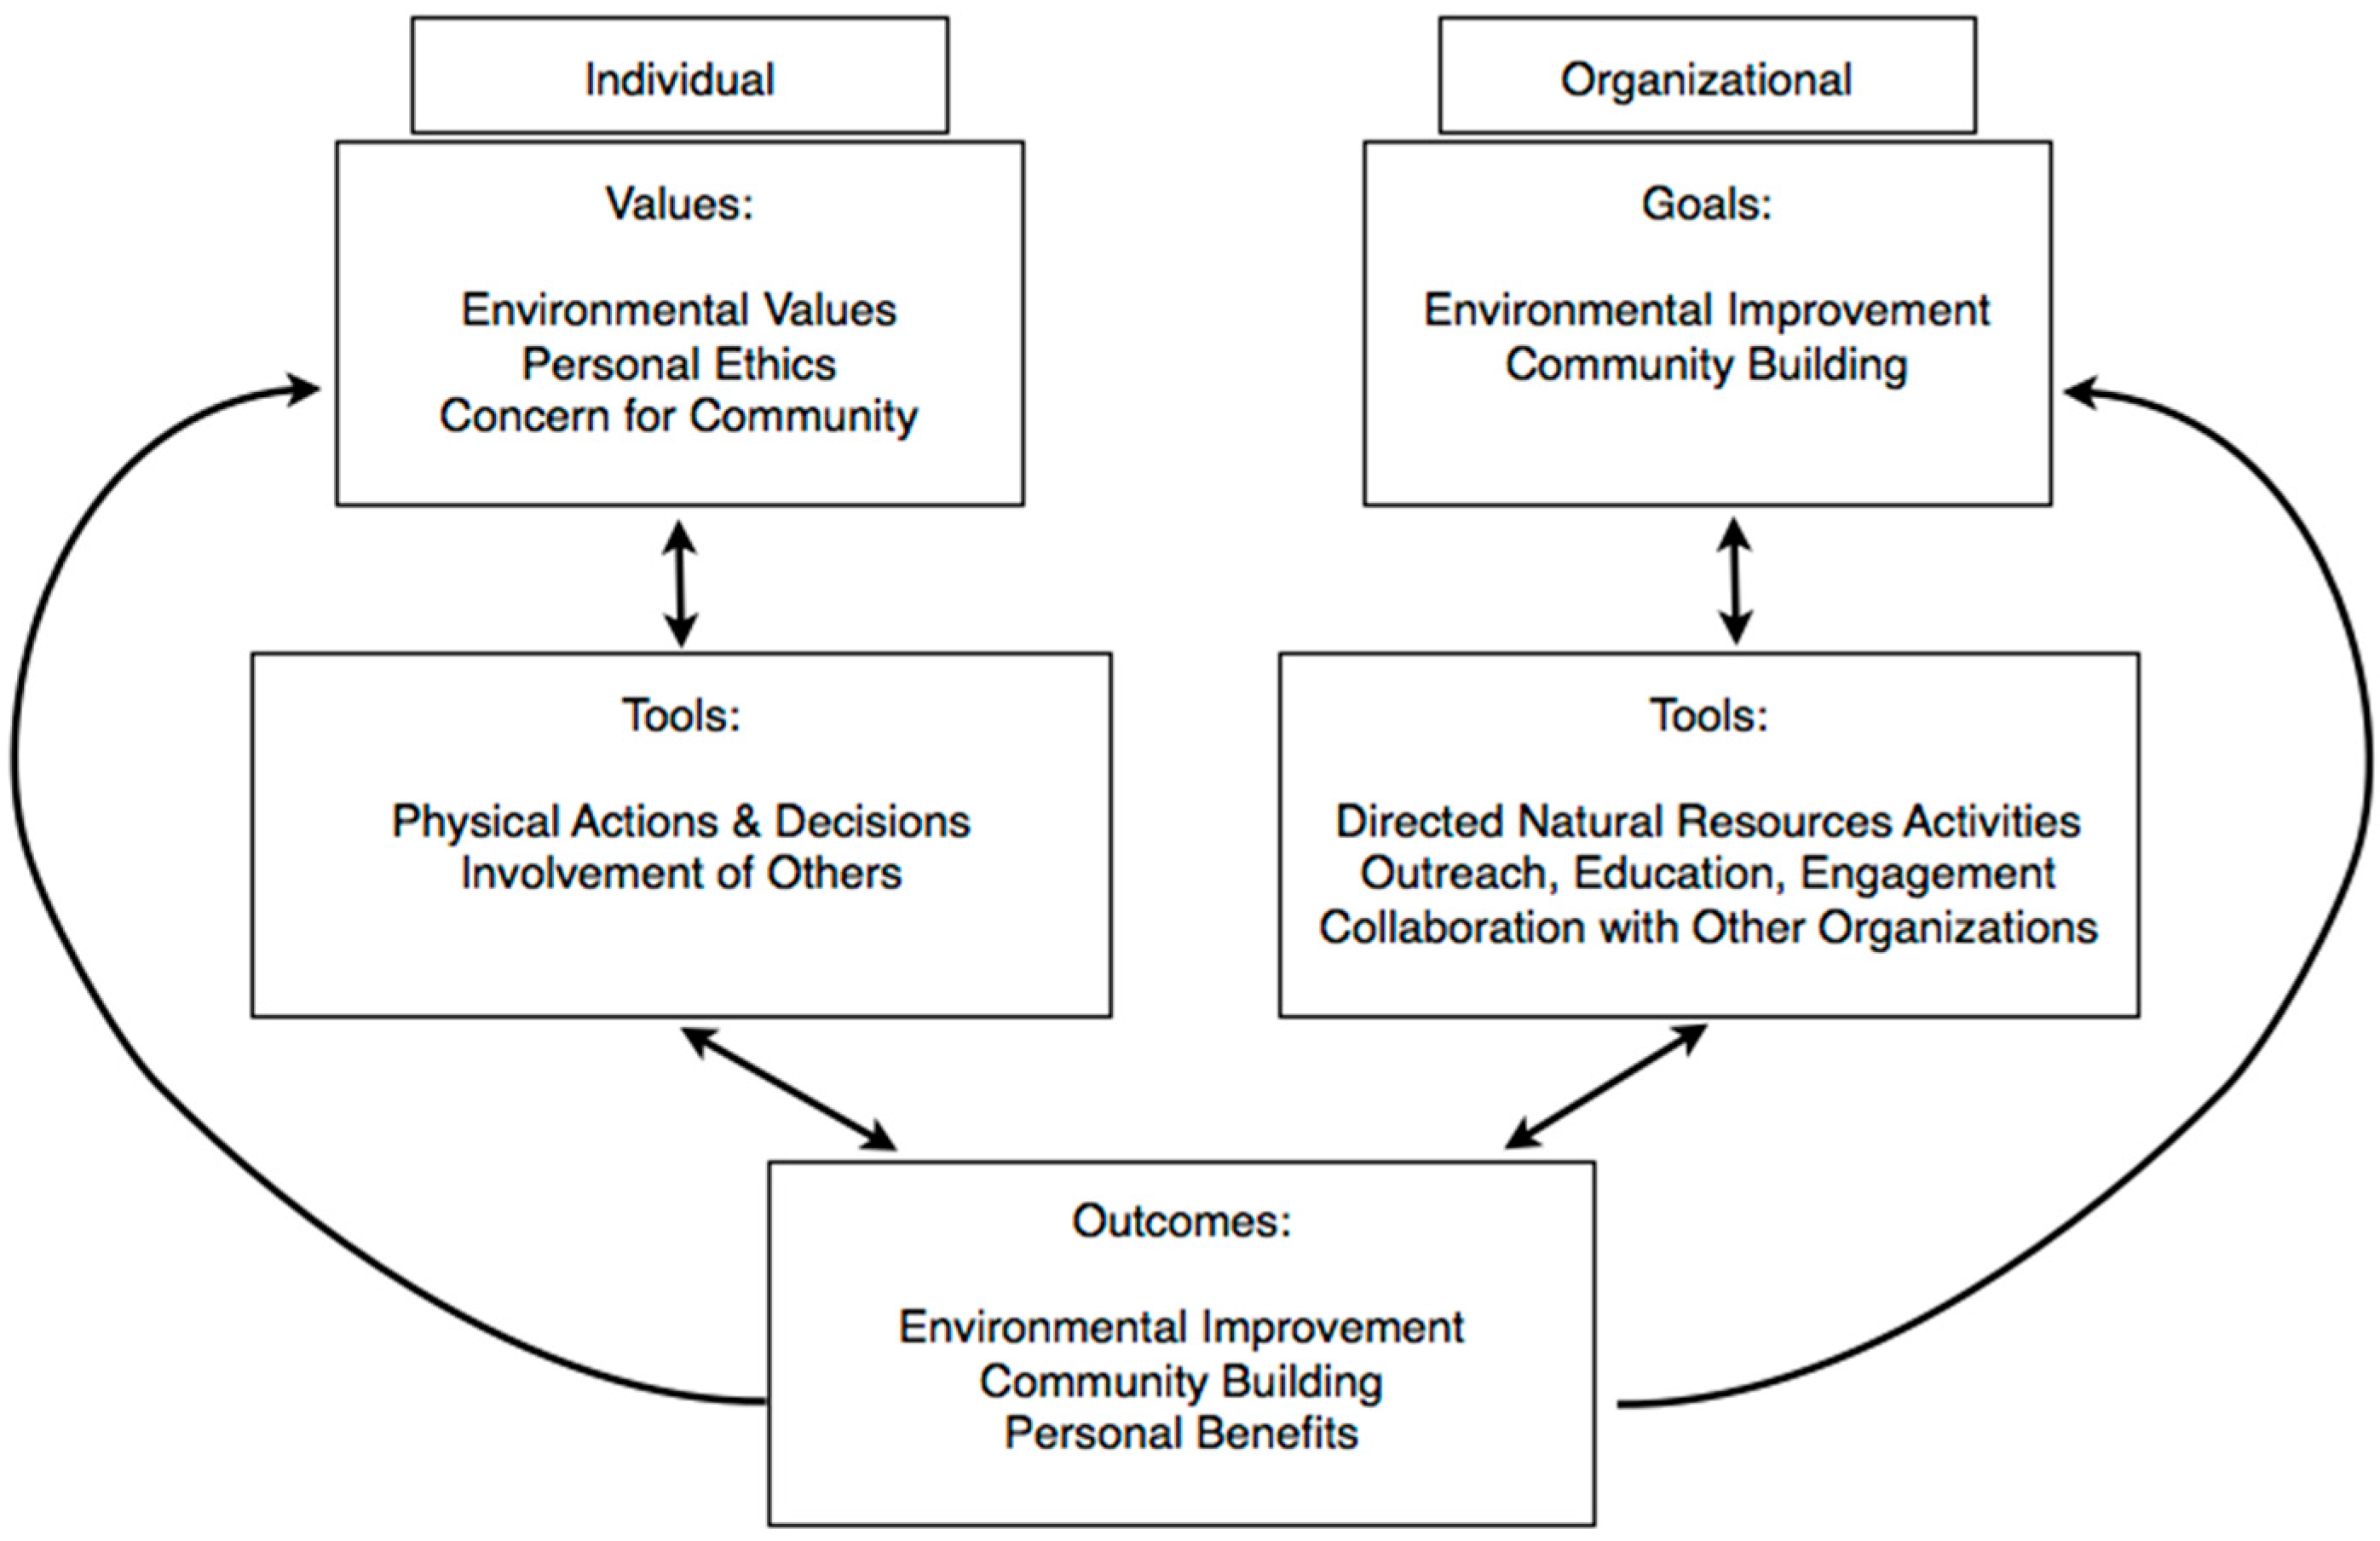
Wolf and others [
22] compared how the values, tools, and desired outcomes of stewardship organization staff matched their organizations in Seattle. To answer this question, the researchers used a series of semi-structured interviews with staff from nine key organizations. Results indicated that staff members conceptualized stewardship at two social scales: individual and organization (
Figure 2). Individual motivations were value-based, including environmental ethics, personal ethics, and concern for community. Individuals applied their stewardship values through direct behaviors, actions and decisions, as well as the involvement of others. Action outcomes were perceived to be environmental improvement and community building, as well as personal benefits such as meaning or realization of personal passion. Staff perceived their organization’s stewardship motivations as goal-based and separated into the broad categories of environmental improvement and community building. As
Figure 2 illustrates, organizations used multiple approaches, interventions, or tools, including: direct collective programs to improve and protect natural resources; outreach, education, and citizen engagement; and collaboration with other stewardship organizations, often through coalitions or partnerships. Ultimately, organizational goals and structures were important in enabling individual staff to realize and reinforce their personal values.
In New York City, Connolly and others [
23] examined the role of individual “broker” organizations. They describe broker organizations as organizations that have access to numerous pieces of information associated with different groups, allowing them to synthesize large pools of knowledge and to know which groups to connect, how to connect them, and when to connect them. Using their network inventory (Lens 2) and structural analyses (Lens 3), the researchers identified those civic groups that were at least two standard deviations above the mean on two separate measures of centrality: number of in-degree ties and betweenness. The number of in-degree ties (in-centrality) refers to the number of times that an organization was identified as a partner by another organization. This measure identifies organizations that have the most direct connections with other organizations, indicating that they have the largest sphere of influence in their activities. Betweenness addresses the structural position of an organization as a connector among various organizations who might be otherwise disconnected from other parts of the network. Measures of betweenness are useful for identifying “connectors” in the network in contrast to the popularity of organizations.
Connolly and others [
23] investigated how these stewardship organizations in New York City came to play a broker role, responding to social, economic, and environmental change over a multi-decadal time period. They found that beginning in the 1970s through early 1990s, much of the work on the local environment in NYC was connected to community development efforts designed to help the city and specific neighborhoods recover from the effects of disinvestment and fiscal crisis that resulted from the political, economic and demographic shifts that surfaced in the 1960s. Many of those interviewed spoke of this formative period in the 1970s and 1980s, as a period when civic groups organized and compensated for the retreat of public sectors from maintenance and improvement of the local environment.
By the 1990s, several civic groups, including those that worked on developing community gardens, parks restoration, and water quality issues, had established a stable political and economic position, which set the stage for the second phase. The 1990s were marked by a period of economic expansion in New York City and pressure for more developable land. During this period, civic stewardship groups fought the city over community gardens, parkland privatization, and waterfront development. These battles galvanized many of the civic stewardship groups and consolidated a more cohesive citywide effort. The most visible of these battles was fought over control of community gardens, but other issues, such as waterfront preservation, were also critical. Emerging in the most recent period of the environmental stewardship system in New York City since the 2000s, stewardship organizations have leveraged the political power developed in the 1990s to gain standing in the decisions made by government agencies. They have increasingly become specialists utilized by public agencies in the environmental management process and as connectors among civic organizations.
Ultimately, Connolly and other’s [
23] historical analyses at the organizational level (Lens 1) demonstrates that groups formed in the 1970s were the building blocks of the coalitions that resulted from oppositional politics in the 1990s and then became the foundation for hybrid governance structures in the early 2000s. Their analyses also show that local stewardship groups have the capacity to evolve over time in response to a changing set of conditions in the political, economic, and social realms. An important feature in the adaptive capacity of stewardship groups has been the ability of broker organizations and the stewardship network to engage with new actors along a spectrum of oppositional and cooperative relationships.
2.2. Lens 2: Population/Network Population
Lens 2 focuses on populations, understood as either the population of organisms such as the focus of population ecology, or the population of network organizations. In ecology, population studies consider the dynamics of collections of individuals. Key questions in population ecology include presence/absence of species, birth rates, mortality rates, age distribution, total population numbers, and dispersal rates. Sometimes being from the same population is insufficient. In epidemiology, there can be three populations within a species, those that are infected, those that are susceptible, and those that are immune [
20] (p. 255). Thus, consideration of sub-populations of different types can be important.
Network research examines the size and composition of the network population and its sub-populations. This lens guides questions such as “how many organizations are in the network?” and “how many total relationship ties are in the network?” In studies of longitudinal network change, these simple measures on network population provide insightful measures on trajectories of change [
8]. These data are usually collected via social network analysis survey and represents basic network analysis descriptive statistics. Subpopulation descriptive information, such as the sector to which a specific organization belongs, can also be collected through the survey.
Romolini and others [
24] were interested to understand whether cities with some similar sized populations and land areas would have similarly sized stewardship populations and sub-populations. Their study examined Seattle and Baltimore, which are similar in population size, land area, and vegetative cover, and are directly connected to an impacted water body—the Puget Sound and Chesapeake Bay. At the same time, however, these two cities are significantly different in population change, racial diversity, education levels, and household income.
The two stewardship networks were nearly identical in population size—395 and 390 organizations—in Seattle and Baltimore. The size of sub-populations were also similar across sectors: public, non-profit, private, and other.
Table 2 shows the distribution of organizations across sector type, with a more detailed distribution of organization types within each sector. The non-profit sector was the dominant sector for each stewardship network, followed by the public sector, and a small set of organizations from the private sector. Similarly, Connolly and others [
25] found that New York City, with a much larger population and land area, had a civic-to-civic stewardship network that was more than twice as large as Seattle and Baltimore: a total of 704 organizations and a moderately connected core set of groups of 404 organizations. Working in San Juan, Puerto Rico (PR) to understand its network of sustainability actors, Muñoz-Erickson [
26] identified 110 actors in San Juan’s urban sustainability network.
Although the total network populations were similar in Baltimore and Seattle, Romolini and others [
24] found that there were significant differences in the network sub-populations when the networks were examined in terms of organizational purpose or functions and site types on which they worked. Organizations in Seattle and Baltimore were asked to choose their main organizational purpose or function from a list of 19 possible responses. ‘‘Environment’’ was the dominant functional domain for organizations in Seattle, with 70.8% of organizations choosing that category, compared to 47.9% in Baltimore. ‘‘Community Improvement’’ was the most chosen organizational purpose of environmental stewardship groups in Baltimore, with 50.3% of respondents compared to 34.7% in Seattle. Thus, more Seattle groups described their purposes in the environmental and science realms, whereas much greater percentages of Baltimore groups expressed social, including faith-driven, purposes. Trends were also different between Seattle and Baltimore in terms of the dominant site types for their stewardship activities. While Seattle organizations reported much more activity in water-related site types, Baltimore organizations dominated in reporting activities in sites within built environments. Within the category of natural areas and open spaces, the responses were mixed, with Baltimore organizations reporting more activity in community gardens, and Seattle groups working on more forests and parks. This still reflects a built versus open space divide, as community gardens in Baltimore are often constructed on reclaimed abandoned land. These differences in site types may be partially explained by the histories of development and industry in each city. For example, Baltimore’s legacy of losing industry and population left it with tens of thousands of vacant properties; some of which community groups have used to plant gardens and help revitalize neighborhoods.
2.3. Lens 3: Community/Network Structure
Lens 3 focuses on community structural dynamics. Allen and Hoekstra describe communities as “the integration of the complex behavior of the biota in a given area so as to produce a cohesive and multifaceted whole” [
20] (p. 156). Community ecology studies examine the interactions and accommodations among different species, and community structure questions such as predation, parasitism, competition, symbiosis, and the role of keystone species. Data for these studies are collected through techniques such as gradient analysis, site analysis, vegetation composition, and studies on habitats and niches.
The community lens for social-ecological networks examines the interactions among organizations in terms organizational network structure, such as centrality, centralization, density, modularity (statistical subgroup analysis). Social network analysis can help guide the data collection and analysis driven by questions such as, how cohesive is the network? To what degree is the network organized around one or a few nodes? Are there organizations that are peripheral? What statistical subgroups exist in the network (a distinct analysis from composition in Lens 2, which relies on categorical sub-populations)? As with the network population, data for this lens comes from an organizational survey including questions about relationships with other organizations. Analyses employ social network measures previously found relevant in natural resources management such as modularity, centrality, and centralization [
3].
Romolini and others [
24] studies of Seattle and Baltimore’s stewardship networks included comparisons of network structure. To characterize the structure of the networks, they examined cohesiveness of the networks using measures of density, centralization, and degree and betweenness centrality. In both cities, the density of the networks were 1%. Unlike density, however, the centralization scores were significantly different in Baltimore and Seattle, with Baltimore displaying over five times greater centralization than Seattle (18.3% and 3.6%, respectively). In Baltimore, 11 organizations (2.8% of the network) held more than 20% of the relationships related to information sharing. The most connected organization in Baltimore, The Parks and People Foundation, had 76 ties, which is more than 4% of the ties in the network. In Seattle, the ties were more evenly distributed. The most connected organization in Seattle, the Seattle Department of Parks and Recreation, had 40 information ties.
High centralization is when a small number of organizations hold most of the ties in the network. One possible explanation for the disparity in centralization between Baltimore and Seattle is the relative distribution of resources. Of the survey respondents that replied to the financial questions, Seattle stewardship organizations reported an average budget of $23.5 million, which was more than 10 times as large as Baltimore organizations’ reported average of $2.1 million. Using a different metric, the $150,000 median budget reported in Seattle was more than six times that of the $24,000 reported for organizations in Baltimore. Romolini and others [
24] suggest that this scarcity of funding resources in Baltimore requires organizations to leverage each other’s resources more than in Seattle, which may require greater reliance on the most central organizations in Baltimore for funding and informational resources.
In New York City, Connolly and others [
25] found that New York City’s network population was “clustered” in several different ways. One set of statistical clusters was associated with a mission that is not exclusively tied to environmental issues, such as historic preservation, architecture, and urban planning. Another set of clusters was associated with the types of sites stewarded: land stewardship types such as community gardens and local food groups, and water-related issues, such as water quality and access. A third set of clusters was associated with geography at the borough and neighborhood scale and organizations working in the same place.
Connolly and others [
25] interpreted this as evidence for a multi-scalar, polycentric network structure. Focusing only on civic actors, the stewardship network had a centralization measure of 3.28%. When government actors were included in the centralization analyses, the measure increased nearly 10-fold to 28.4%. Connolly and others [
25] suggest that this difference in network centralization for civic-only organizations versus the whole network indicate a multi-scalar capacity for managing urban ecosystem services, with civic stewardship groups coordinating activities amongst themselves across diffuse small-scale clusters and city-wide activities facilitated through connections with government agencies.
2.4. Lens 4: Ecosystem/Network Flows
Lens 4 considers “what” flows through the system. Allen and Hoekstra note that, “the cycles and pathways of energy and matter in aggregate form the entire ecosystem” [
20] (p. 44). An ecosystem perspective in ecology has become a dominant lens for understanding how the interactions of biotic and abiotic components of ecological systems affect the stocks and flows on energy, materials, and nutrients. Questions studied through the ecosystem perspective include fluxes and pathways of matter and energy, and nutrient cycling, such as nitrogen, phosphorous, or carbon.
Similarly, social network research examines the stocks and flows of critical resources cycling through the network. Organizations may exchange a number of resources, including knowledge, data, expertise, funds, access to land or water, or staff. Studies utilizing Lens 4 would focus on relevant network resources and use network analysis to examine flows of those resources through network relationships. Network surveys, semi-structured interviews, and archival records are used to characterize the “substance” and “strength” of ties among organizations.
Quantifying “what is exchanged” in Lens 4 is challenging. Network measures to characterize structure already exist. For instance, which actors are central to the flows of information, funds, or staff (Lens 3). However, a great deal of work remains to be done to quantify and characterize the frequency, rate, and magnitude of these flows in stewardship networks. In particular, information can be characterized in different ways, such as data, knowledge and expertise, analyses and models.
Other network flows—knowledge, policy—were demonstrated in San Juan, Puerto Rico. Muñoz-Erickson [
26] used the knowledge-action systems analysis to expose and disentangle the political (visions and frames), epistemological (knowledge systems), and structural (networks) dynamics of governance actors as they advance specific policies, decisions, and actions related to sustainability. In this case, knowledge-action systems refer to the formal and informal networks of individuals and organizations in which knowledge, ideas, and strategies for sustainability are being produced, evaluated, and validated.
Muñoz-Erickson [
26] found that four visions for the future of San Juan made up the “substance” of the relationships forming statistical sub-populations: the Economically Sustainable City, the Livable City, the Modern City, and the Ecologically Sustainable City. Muñoz-Erickson [
26] described the Economically Sustainable City as the dominant vision for the city as reflected in the goals of the state’s main public agencies regulating land-use planning and environmental issues in the city, i.e., PR Planning Board, PR Environmental Quality Board, and the PR Department of Natural Resources, and the network’s most central actors. The vision of San Juan as a Modern City was primarily associated with the goals of former Mayor Jorge A. Santini Padilla for the redevelopment and revitalization of San Juan’s main urban cores. The Livable City vision reflected the goals and expectations of two main sectors of the city: the city government, through the San Juan Municipality Territorial Ordinance Plan, and the civic sector, through the work of NGO and community-based organizations. The Ecologically Sustainable City vision strongly valued the sustainability of the city’s ecological systems. Key ideas framing this vision were systems thinking, ecological networks functioning at multiple spatial scales, and long-term processes to maintain and enhance the resilience of these systems from disturbance. Grove et al. [
27] elaborate these points discussing “ecology for a city”.
2.5. Lens 5: Landscape/Network Spatial Structure
Lens 5 considers the spatial dimensions of previous lenses. Landscape ecologists consider the reciprocal relationships between spatial structure and organisms, populations, communities and processes over time [
20]. Landscape ecology is concerned with the spatial and temporal distribution of ecosystem processes. Because landscape ecology is a perspective and not a scale, questions and analyses focus on these spatial dynamics over a range of spatial scales, from the spatial heterogeneity of a vernal pool to the northern boreal forest.
Urban stewardship networks also have spatial structure, which may be significant for understanding the dynamics of its organizations, populations, structures, and flows within a neighborhood to an entire region. For example, researchers interested in understanding how neighborhood-level actors interact in the network may conduct spatial mapping of each participants’ territory and determine whether, where, and how often those actors interact. These types of data could be collected through surveys and interviews and analyzed through a variety spatial analysis techniques.
Researchers have indirectly and directly applied a spatial perspective to urban stewardship networks. As we noted earlier, in Lens 2, Connolly and others [
25] found that certain sub-populations emerged from their analysis that were geographically based, working in the same neighborhoods. In contrast, Locke and others [
28] asked whether the presence of stewardship groups (Lens 1) affected vegetation change in New York City over time? Using New York City’s social network data [
11] and vegetation data for 2000 and 2010 mapped to neighborhoods, the researchers were able to assess whether the presence of stewardship organizations affected vegetation change. They found that, although on average there was very little vegetation change at the neighborhood scale during this time period, there was a statistically significant relationship between the number of stewardship groups at the neighborhood level and whether those neighborhoods experienced changes in vegetation cover. Specifically, although most neighborhoods lost a relatively small amount of vegetation, those neighborhoods that experienced an increase in vegetation tended to have more stewardship groups present.
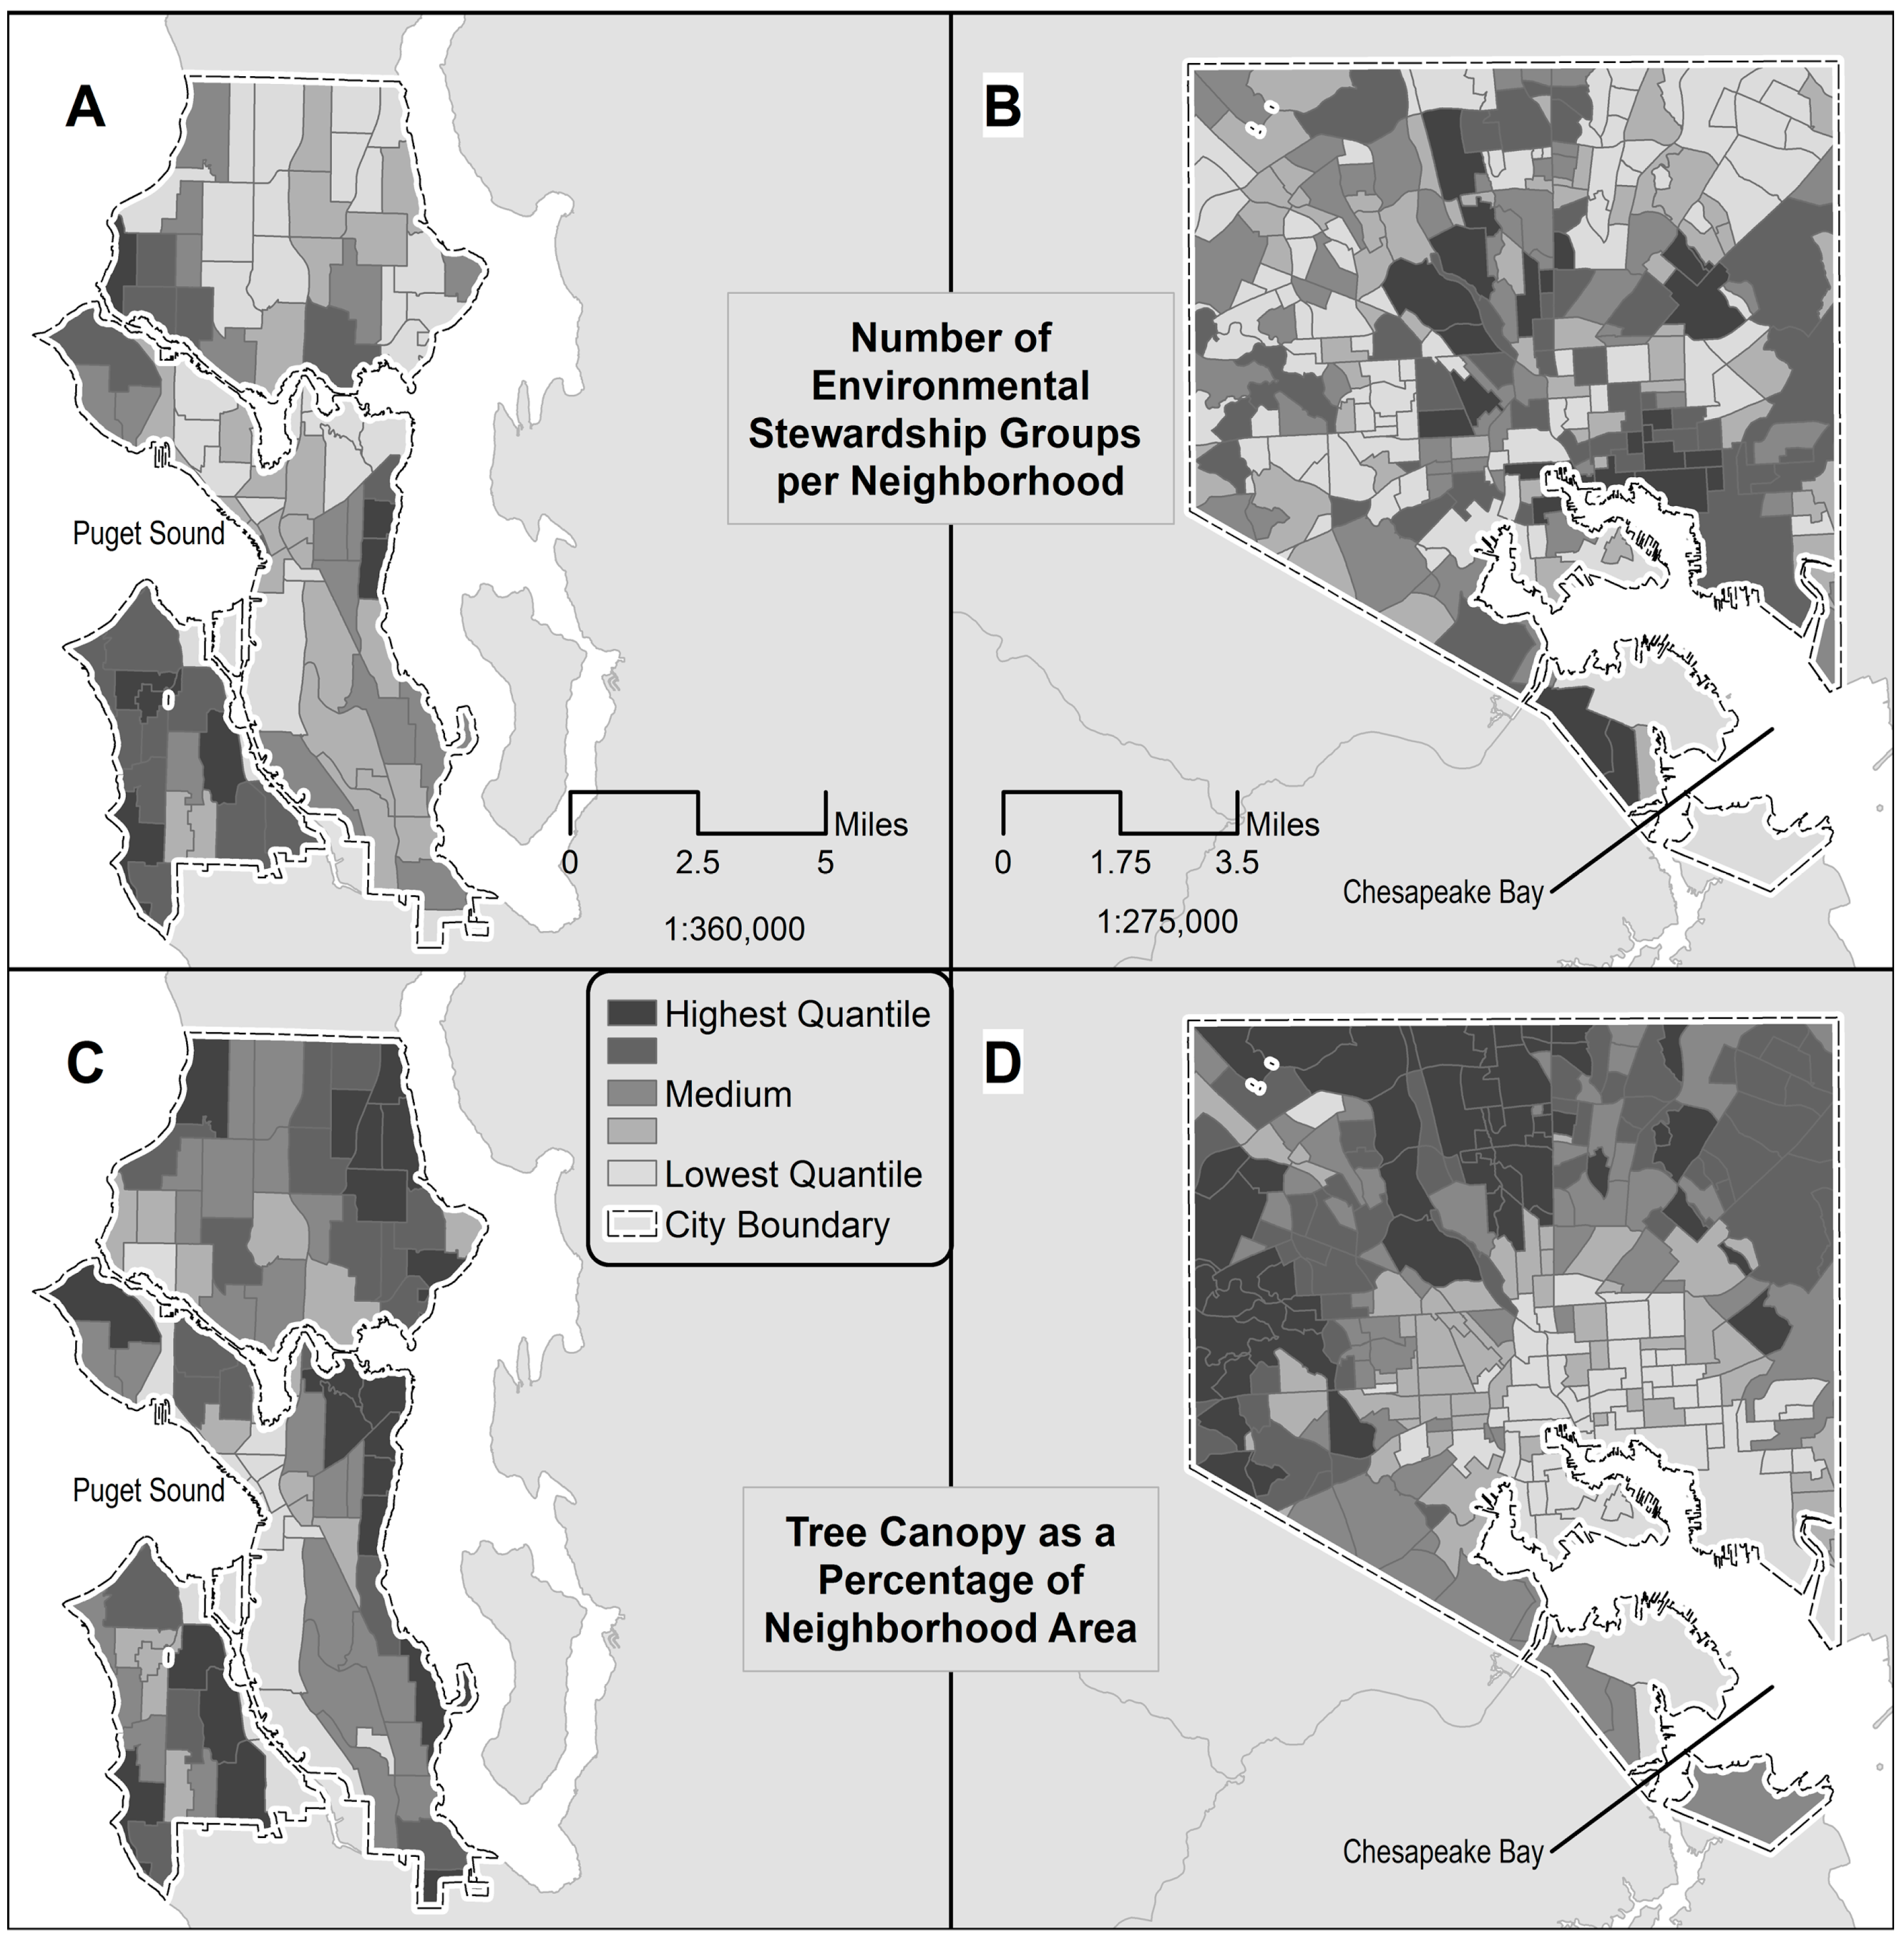
Romolini and others [
29] included more network phenomena, comparing the relationships among the presence of stewardship groups (Lens 1), the number of their ties (Lens 3), and the distribution of canopy cover in Seattle and Baltimore in order to examine the relationships between stewardship presence, level of collaboration, density of collaborations, and environmental conditions. The researchers found that none of the land cover categories—water, trees, or other vegetation—were good predictors of the number of stewardship organizations, the ties between them, or the density of those ties in Baltimore neighborhoods. In Seattle, however, the researchers found some evidence that the existence of water and tree resources may lead to the establishment of organizations to steward them.
The researchers had different results when they turned their attention to whether the presence of stewardship groups and their connectivity was related to the distribution of canopy cover. While there were no significant results in Seattle, the researchers found that the number of stewardship organizations in Baltimore was positively associated with tree canopy, with the results indicating an increase of about 1% in tree canopy with the addition of one stewardship organization. However, the number of ties between organizations had a negative relationship with tree canopy cover, with the results showing a decrease of nearly 1% in tree canopy with every additional tie between organizations [
29].
Figure 3 illustrates these results.
Romolini and others [
29] hypothesize that these two, seemingly contradictory findings suggest that there might be two types of stewardship groups. One type of stewardship group might focus on conservation of existing trees in areas with higher levels of canopy cover. Another type of group might concentrate on rehabilitation by planting new trees in areas with low levels of existing cover. Conservation is more associated with maintenance of the existing resource: pruning, mulching, and watering, for instance. Rehabilitation is more resource intensive, including materials such as trees, soils, stakes, and mulch; human and machine labor; and coordination of permissions and permits in order to work on diverse lands, such as vacant lots, public-rights-of-way, and school yards. Thus, there may be fewer groups with the capacity, but working in collaboration (more ties) in re-vegetation areas (low canopy). Further, it can take a number of years before trees grow large enough to be measured using existing tree canopy mapping tools. The data from their surveys did not permit them to test this hypothesis, however. Follow-up surveys with stewardship groups to map their specific conservation and rehabilitation activities in neighborhoods with high and low levels of tree canopy cover would be needed to examine this hypothesis (Lens 1).
The use of these lens together in these analyses suggest the potential and power of structured and systematic combination of multiple lenses. In the next section, we describe how the STEW-MAP framework can be used to more fully realize a social-ecological approach to urban stewardship network research.
3. Using the STEW-MAP Framework to Integrate Social and Ecological Phenomena
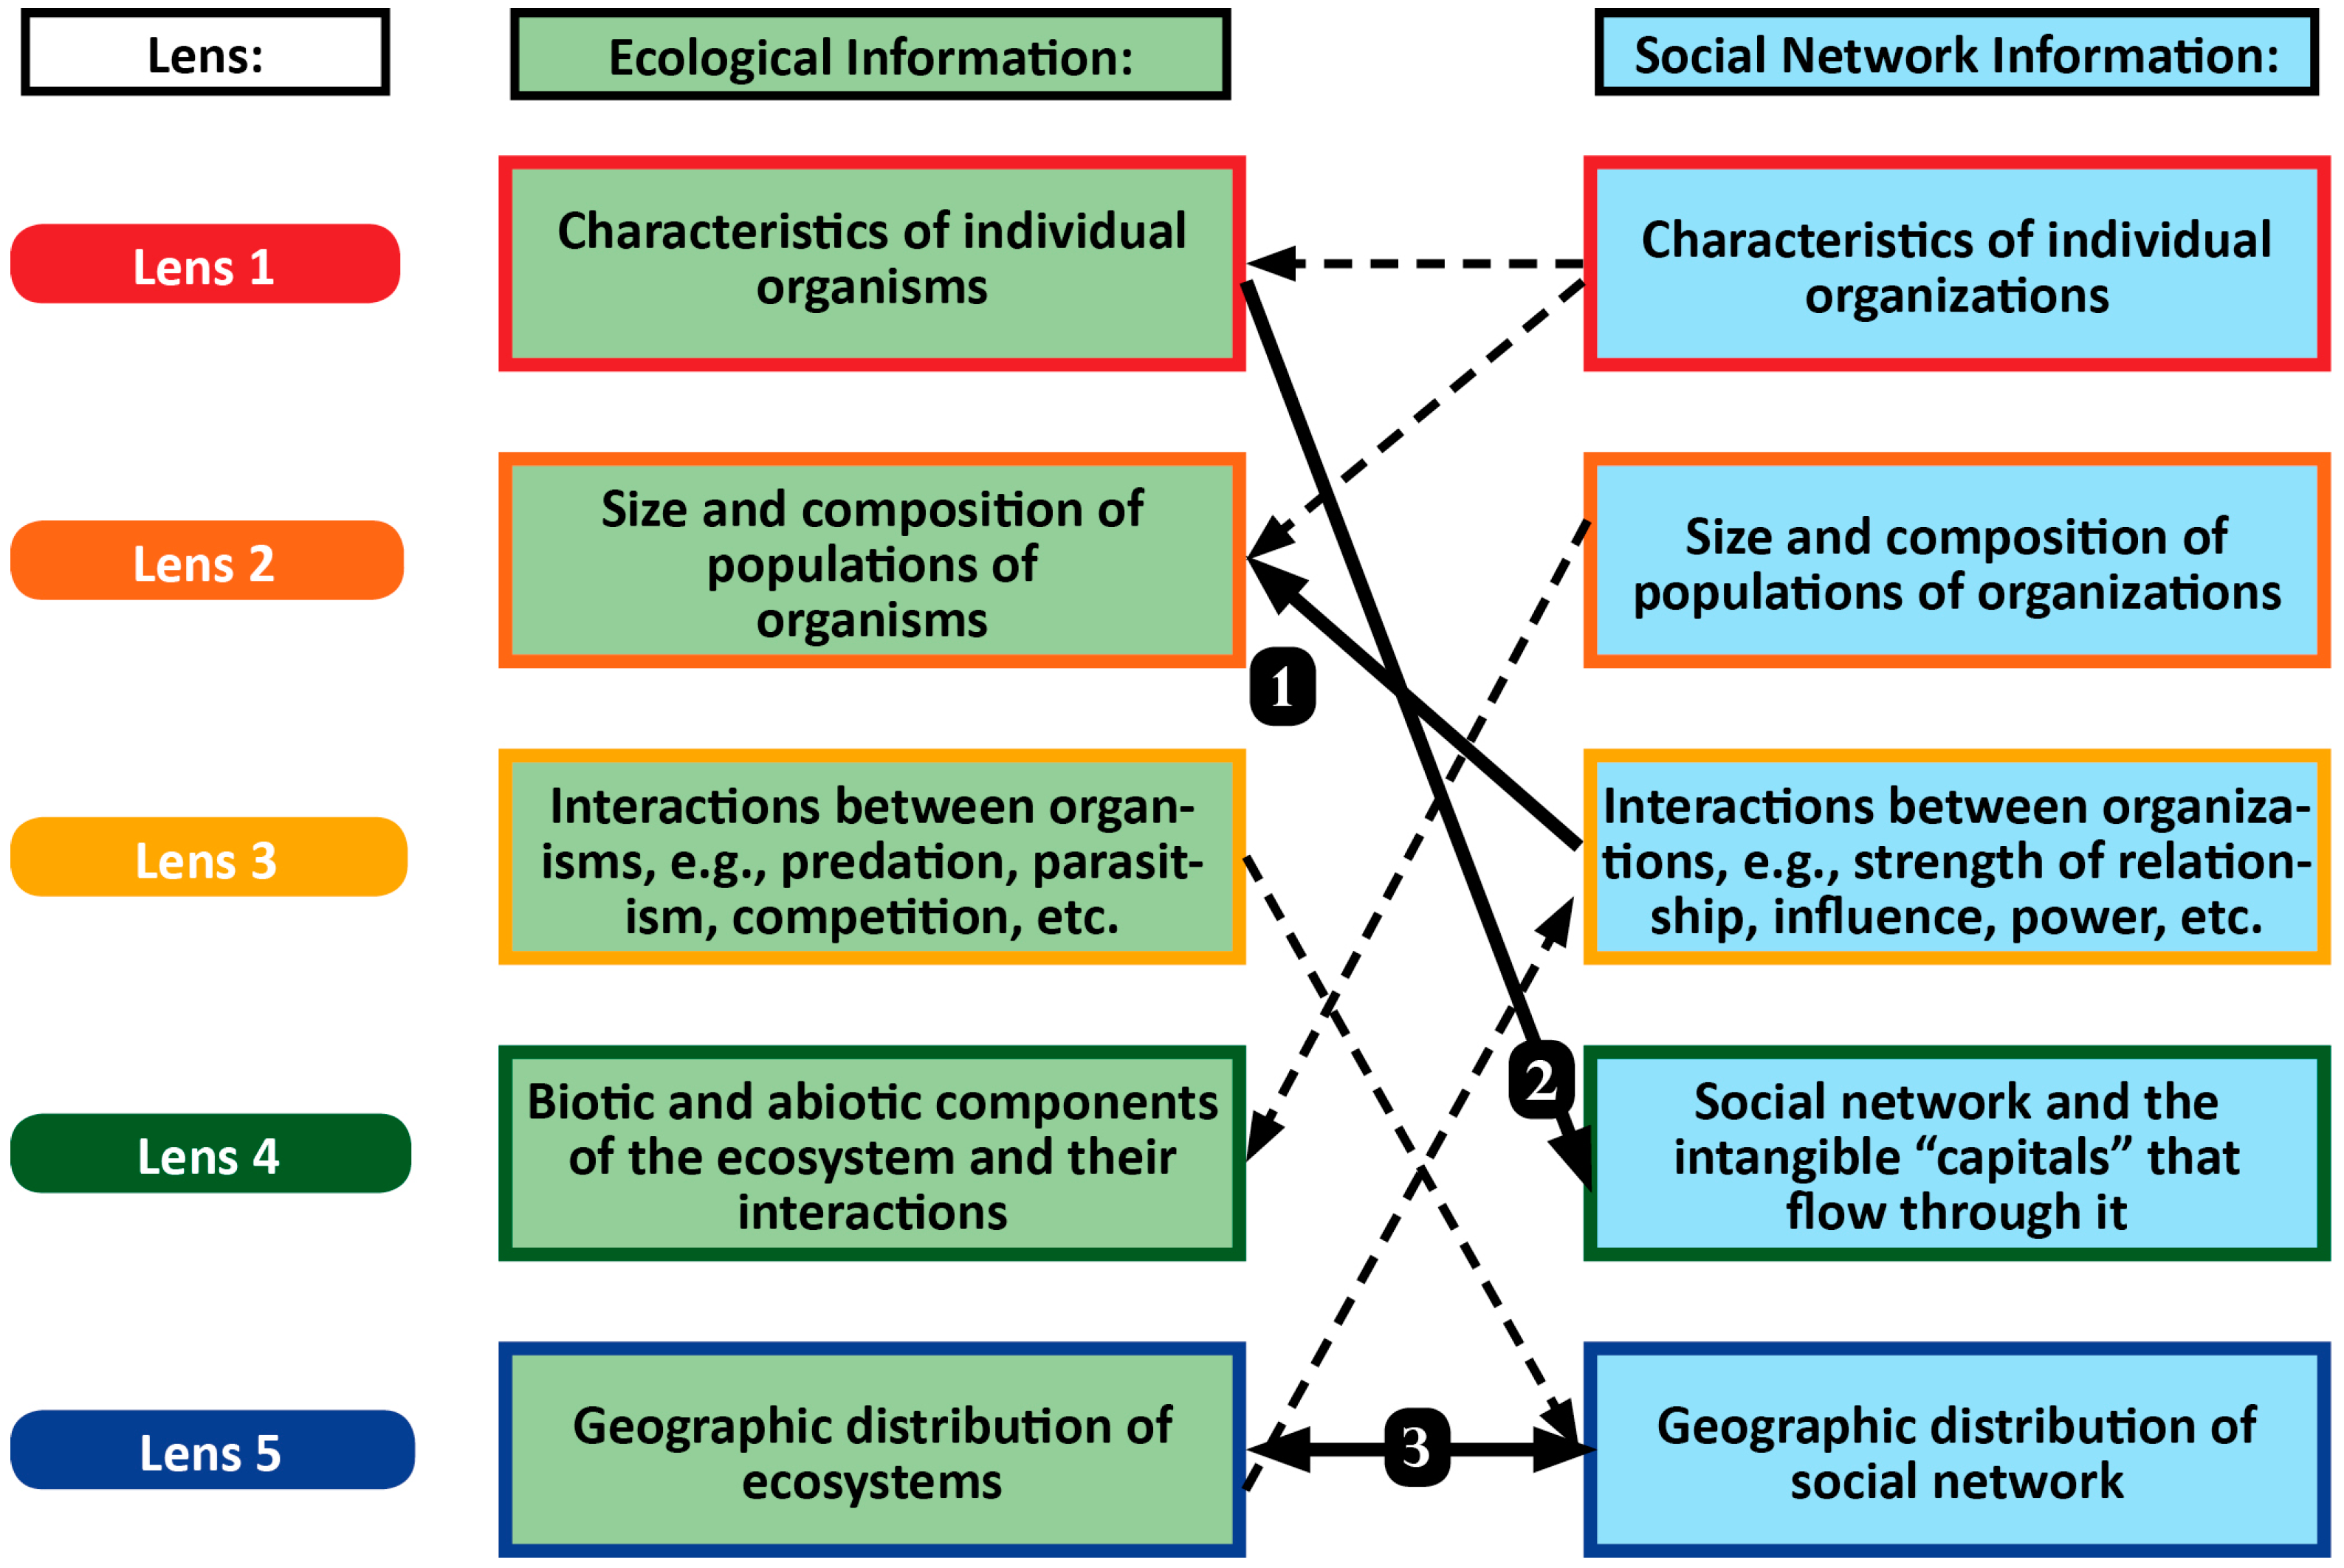
The integration of social and ecological phenomena is a critical challenge to the study of urban stewardship networks and understanding governance regimes to promote urban sustainability and resilience. An essential feature of the STEW-MAP framework is its utility for generating questions and testing hypotheses by combining individual lenses and their social or ecological sub-components. This linking of social and ecological lens are most simply illustrated in
Figure 4 as one-directional relationships between social network and ecological lens. The arrows in
Figure 4 include examples of possible research questions that might be identified using this framework.
Figure 4 shows a few possibilities for examining the interactions among the ecological and social network components of the system. The solid arrows are described in the following example questions:
- (1)
How might the interactions among organizations in the network affect populations of organisms? For instance, how might the interactions among stewardship organizations affect the protection and conservation of ash trees from Emerald Ash Borer?
- (2)
How might the ecological characteristics of an organism affect different resources in a network? For example, how might the decline and restoration of oysters in the Chesapeake Bay affect stewardship network investments to understand the decline of the oysters, protection of healthy oyster beds, and activities to rehabilitate infected oyster beds?
- (3)
How might the spatial distribution of ecological phenomena affect the spatial distribution of stewardship groups, and conversely, how might the spatial distribution of stewardship groups affect the distribution of ecological phenomena? For instance, how might the distribution and condition of urban tree canopy affect the presence of stewardship groups and, conversely, how might the presence of stewardship groups affect changes in canopy cover over time?
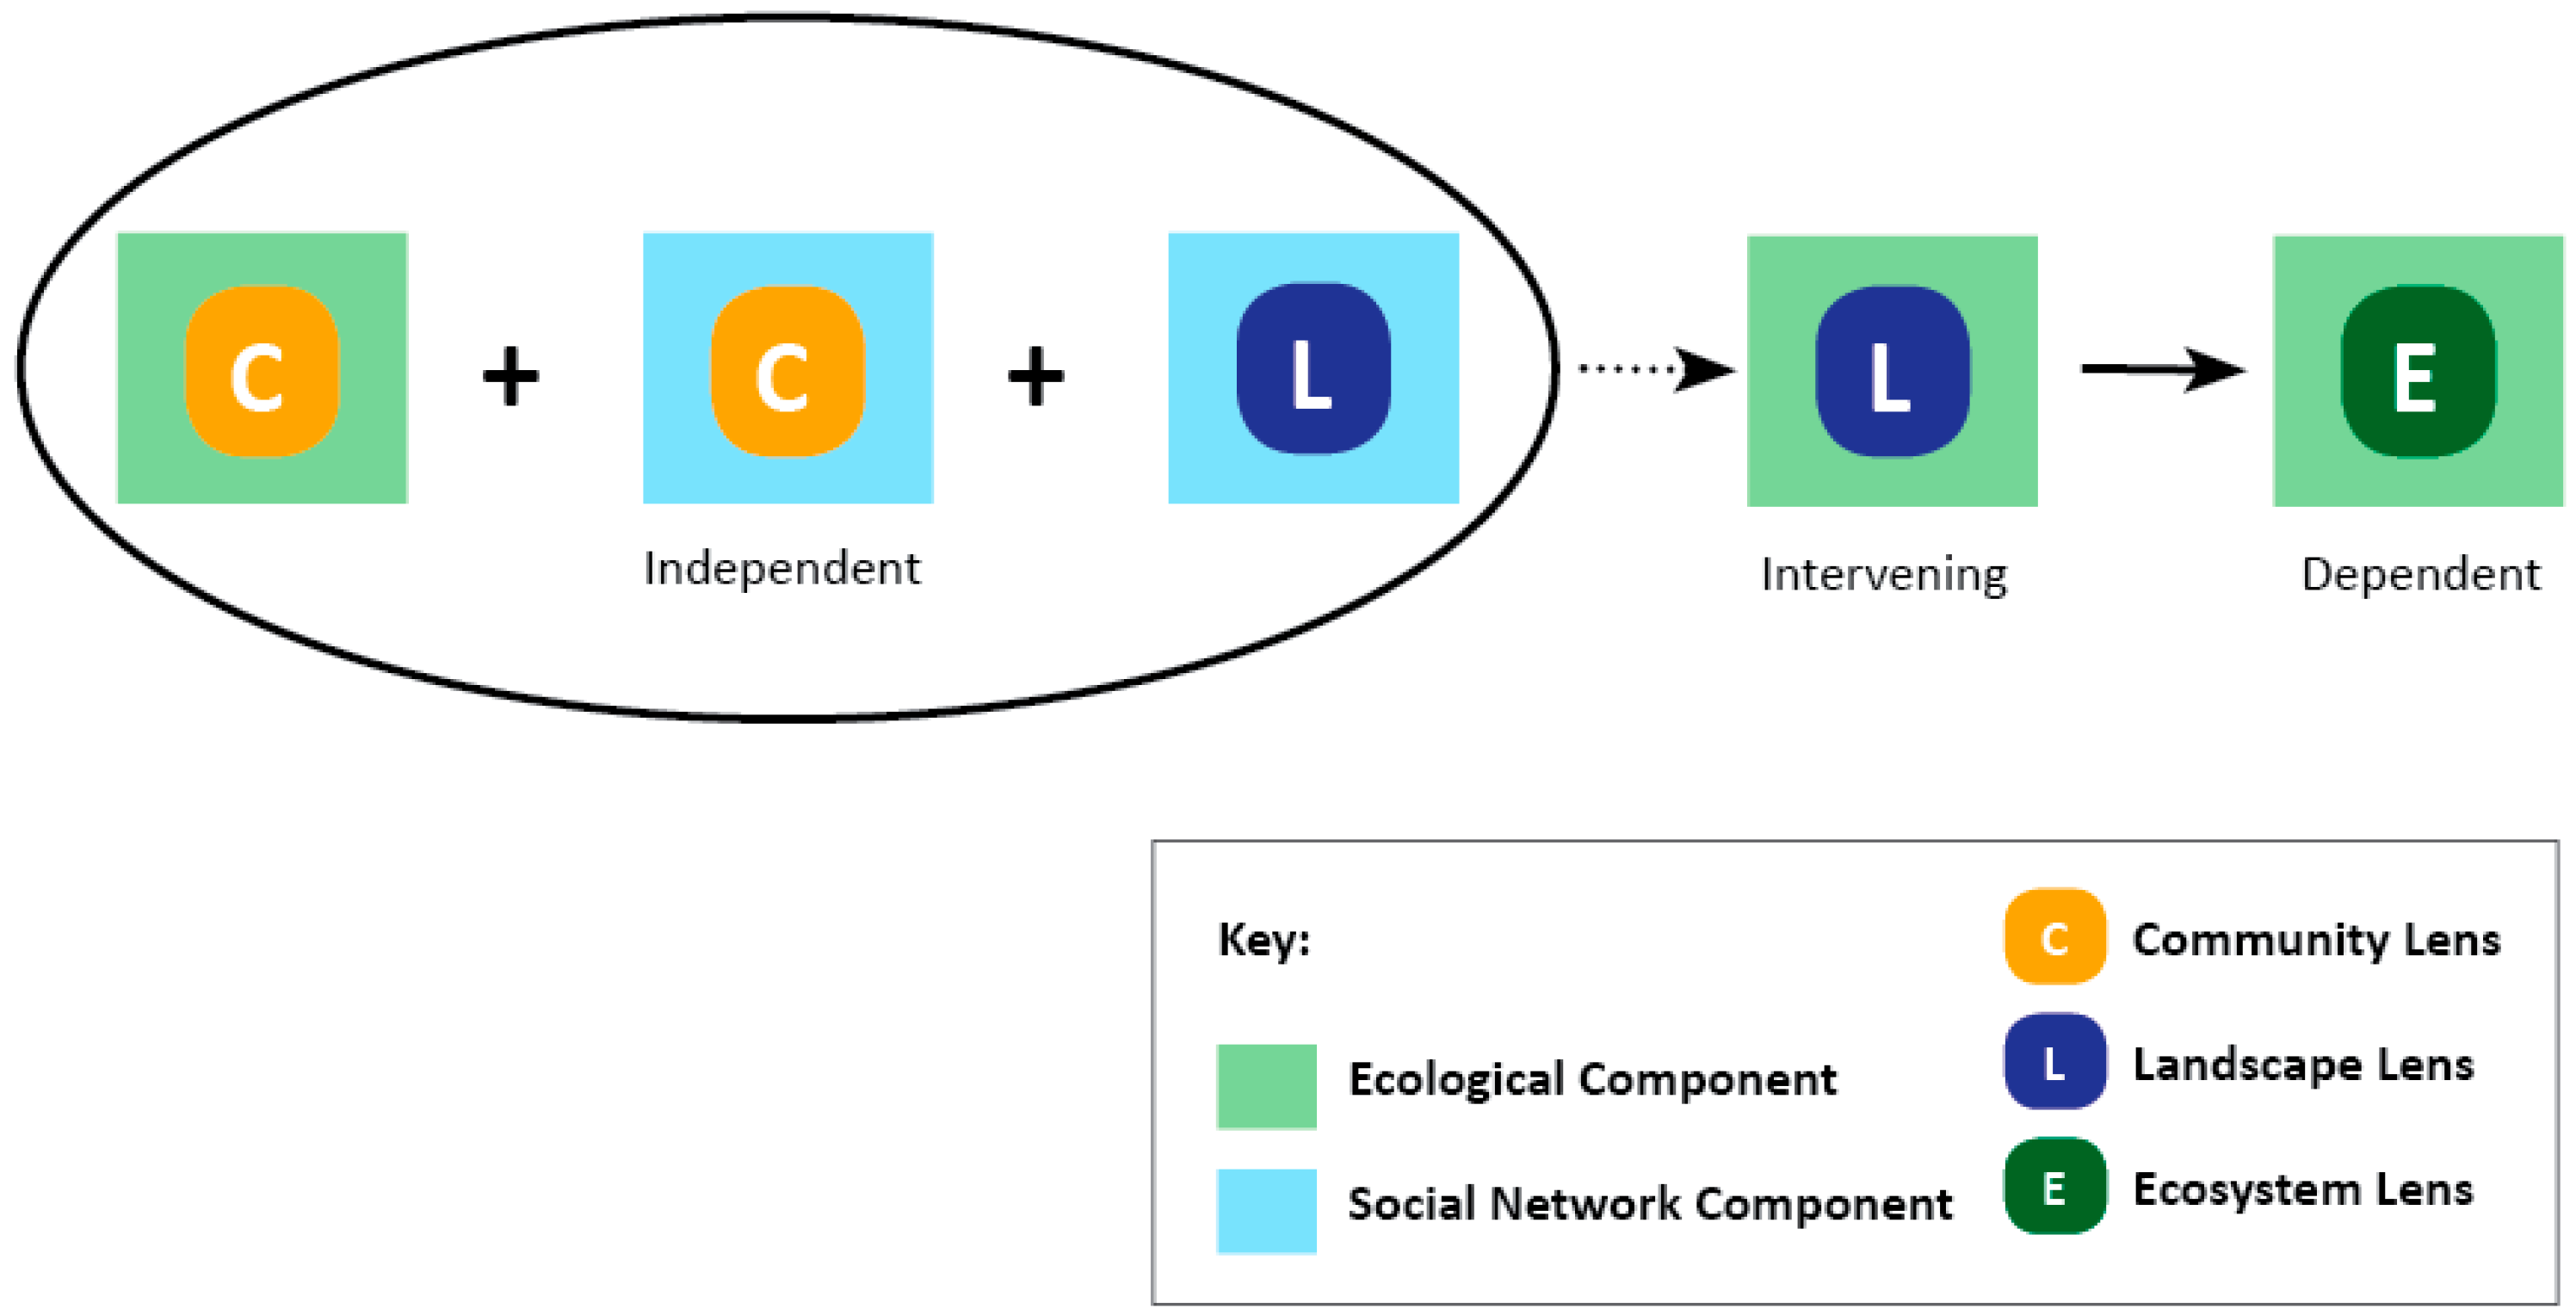
These examples, and other possible combinations in
Figure 4, illustrate how one might ask questions and collect and analyze relevant data about the direct interactions of one social network lens and one ecological lens. However, the framework is designed so that questions, data, analyses, interpretations, and applications do not need to be limited to the relationship between only one social network lens and one ecological lens. Lenses can be treated as building blocks, where a combination of social network and ecological lenses can be used as independent, intervening, or dependent phenomena to pose questions, collect and analyze data, interpret results, and consider possible applications (
Figure 5).
Figure 5 illustrates one of many potential combinations in which lenses are used as building blocks where the broad research or policy question could be, “What ecological landscape and ecosystem outcomes result from the interactions between the ecological and social network communities and the social network landscape?” In practical terms, this question is relevant where variations in biodiversity and keystone species (ecological community) and the spatial distribution (social network landscape) of different types of organizations (social network community) may have differential effects on spatial variations (ecological landscape) of ecological resources of concern, such as water quality.
For example, researchers in Austin, Texas have been considering a coupled social-ecological study that would combine different lenses. The five county greater Austin area has dealt with development and conservation trade-offs around the golden-cheek warbler, an endangered species, for over two decades. Annual population studies coupled with civic science provide a good understanding of the population dynamics of the species (Lens 2, population ecology). In this five county area, numerous civic stewardship groups have emerged working on land conservation, green space stewardship, and birding. The collection of organizations (Lens 2, social network population) have corresponding centrality measures (Lens 3, network structure), associated with specific places within the five county area (Lens 5, network spatial structure). Two potential hypothesis emerge from this context. First, H
1: The census blocks with higher concentrations of network centralization scores are positively correlated with higher golden-cheek warbler populations. Second, H
2: That those higher network centralization census blocks have (1) higher golden-cheek warbler populations and (2) higher percentage of sensitive aquifer recharge zone protection (Lens 5, landscape ecology), leading to increased hydrological flows (Lens 4, ecosystem flows). This example, although hypothetical, provides an illustration of potential combinations using building blocks (see
Figure 5).
We recognize that stewardship network research and applications can be an iterative, dynamic, and cumulative process [
27]. Lenses may be added as new questions emerge from researchers or practitioners. For example, in cases where organizations were found to be more or less active or influential within the network (Lens 3), researchers in New York City are employing follow-up, in-depth qualitative organizational surveys to better understand the roles and interactions of central and peripheral organizations. In Baltimore, researchers have shared the results from the initial stewardship network analyses with local practitioners. Ensuing conversations with local partners identified new analyses for their use. In particular, local partners were interested to use the framework, data, and analyses in order to actively self-assess, manage, and monitor the network in order to promote the exchange of information, knowledge and expertise (network flows), match organizations to priority stewardship areas (network spatial structure) and promote inclusion of marginal organizations (network structure).
4. Conclusions
The suggested STEW-MAP framework leverages increasing interest in social network analysis as a powerful tool for understanding natural resource governance in urban environments. While progress has been made, we propose that a systematic and robust framework is needed to pose questions, collect and analyze data, interpret results, and consider practical applications that address the complexity and interdependence of social-ecological dynamics over space and time.
The proposed framework is useful throughout the entire research process, from initiating research questions to interpreting results. It can be used to generate novel and unanticipated research questions and practical applications by combining lenses, or building blocks, of analysis. This framework matches with the practical governance of urban natural resource systems, as the social network lenses we propose are of practical significance to understand the life-history, structure, and performance of organizations (Lens 1), the number and diversity of certain types of organizations (Lenses 2 and 3) and the resource flows among organizations (Lens 4) and their location (Lens 5). A crucial aspect of social network analysis for natural resource governance is the ability to relate it to ecological drivers and outcomes. In particular, a landscape perspective (Lens 5) is an essential and often missing social network lens for connecting the spatial characteristics of social networks to ecological phenomena. Thus, this framework offers new opportunity to advance both the study and practice of natural resource governance towards more sustainable and resilient cities.


