1. Introduction
We are currently witnessing an unprecedented growth in the number of mobile subscribers in rural areas, which has prompted mobile network operators to expand their cellular networks to provide mobile service to subscribers in rural areas, increasing the profitability of the operators [
1]. However, operational expenditures and greenhouse gas emissions are a major concern of the mobile network operators because diesel generators are typically used to power the off-grid cellular base stations in remote areas [
2], which challenges mobile network operators to find an economically feasible alternative power source that is also environmentally friendly. With the current progress in renewable energy, the key features of a power source, such as the cost effectiveness, sustainability, and reliability, as well as reduction of the greenhouse gas emissions, can be met [
3].
South Korea is located at a latitude between 34°N and 38°N and has excellent potential to use solar energy. The average daily solar radiation ranges from 2.474 kWh·m
−2 in December to 5.622 kWh·m
−2 in May [
4,
5]. Moreover, the solar radiation in South Korea is relatively high compared with other countries located at similar latitudes. For example, the annual average global horizontal irradiation of Jeonju (latitude 36°N, longitude 127°E) in South Korea is 4.01 kWh·m
−2, in contrast to the 3.64 kWh·m
−2 of Tokyo, which is located at a similar latitude but a longitude of approximately 139°E [
5]. In addition, References [
4,
5] have shown that the wind speed in South Korea does not exceed 4 m/s. According to References [
6,
7], the wind speed is considered low, and a stand-alone solar power system would be useful for low DC-power demand applications (less than 2 kW), such as cellular base stations.
The key contributions of this study are summarised as follows: (i) feasibility study of the solar power system to feed remote cellular base stations under various cases of daily solar radiation in South Korea; (ii) determination of the optimum criteria and the economic and technical feasibility of the solar power system using HOMER software; and (iii) economic comparison of the proposed solar power system vs. diesel generators.
This paper is organised as follows.
Section 2 reviews the use of renewable energy in the telecommunication sector.
Section 3 discusses the use of the solar energy to feed the off-grid base stations in South Korea.
Section 4 describes the system architecture of a solar power system integrated with a cellular base station. Mathematical models, an overview of HOMER software, and the simulation setup are presented in
Section 5,
Section 6 and
Section 7, respectively.
Section 8 presents the optimisation results and discussion, and
Section 9 presents the economic comparison of the proposed solar power system vs. the diesel generator.
Section 10 concludes this paper.
2. Overview of the Use of Renewable Energy in the Telecommunications Sector
Solar energy was used extensively in the telecommunications industry in the 1970s for microwave repeaters to connect remote towns and homesteads to the telecommunication grid, allowing them to access the same radio, telephone and television services that their urban neighbours had long enjoyed. In addition, photovoltaic energy powered telecommunication satellite earth stations, rural telephony, and telephone exchanges [
8]. However, this section discusses the renewable energy solutions in cellular communication technology; several studies have been conducted to help mobile network operators to achieve their ambition to maintain profitability while protecting the environment by shifting away the use of diesel generators to feed off-grid base stations.
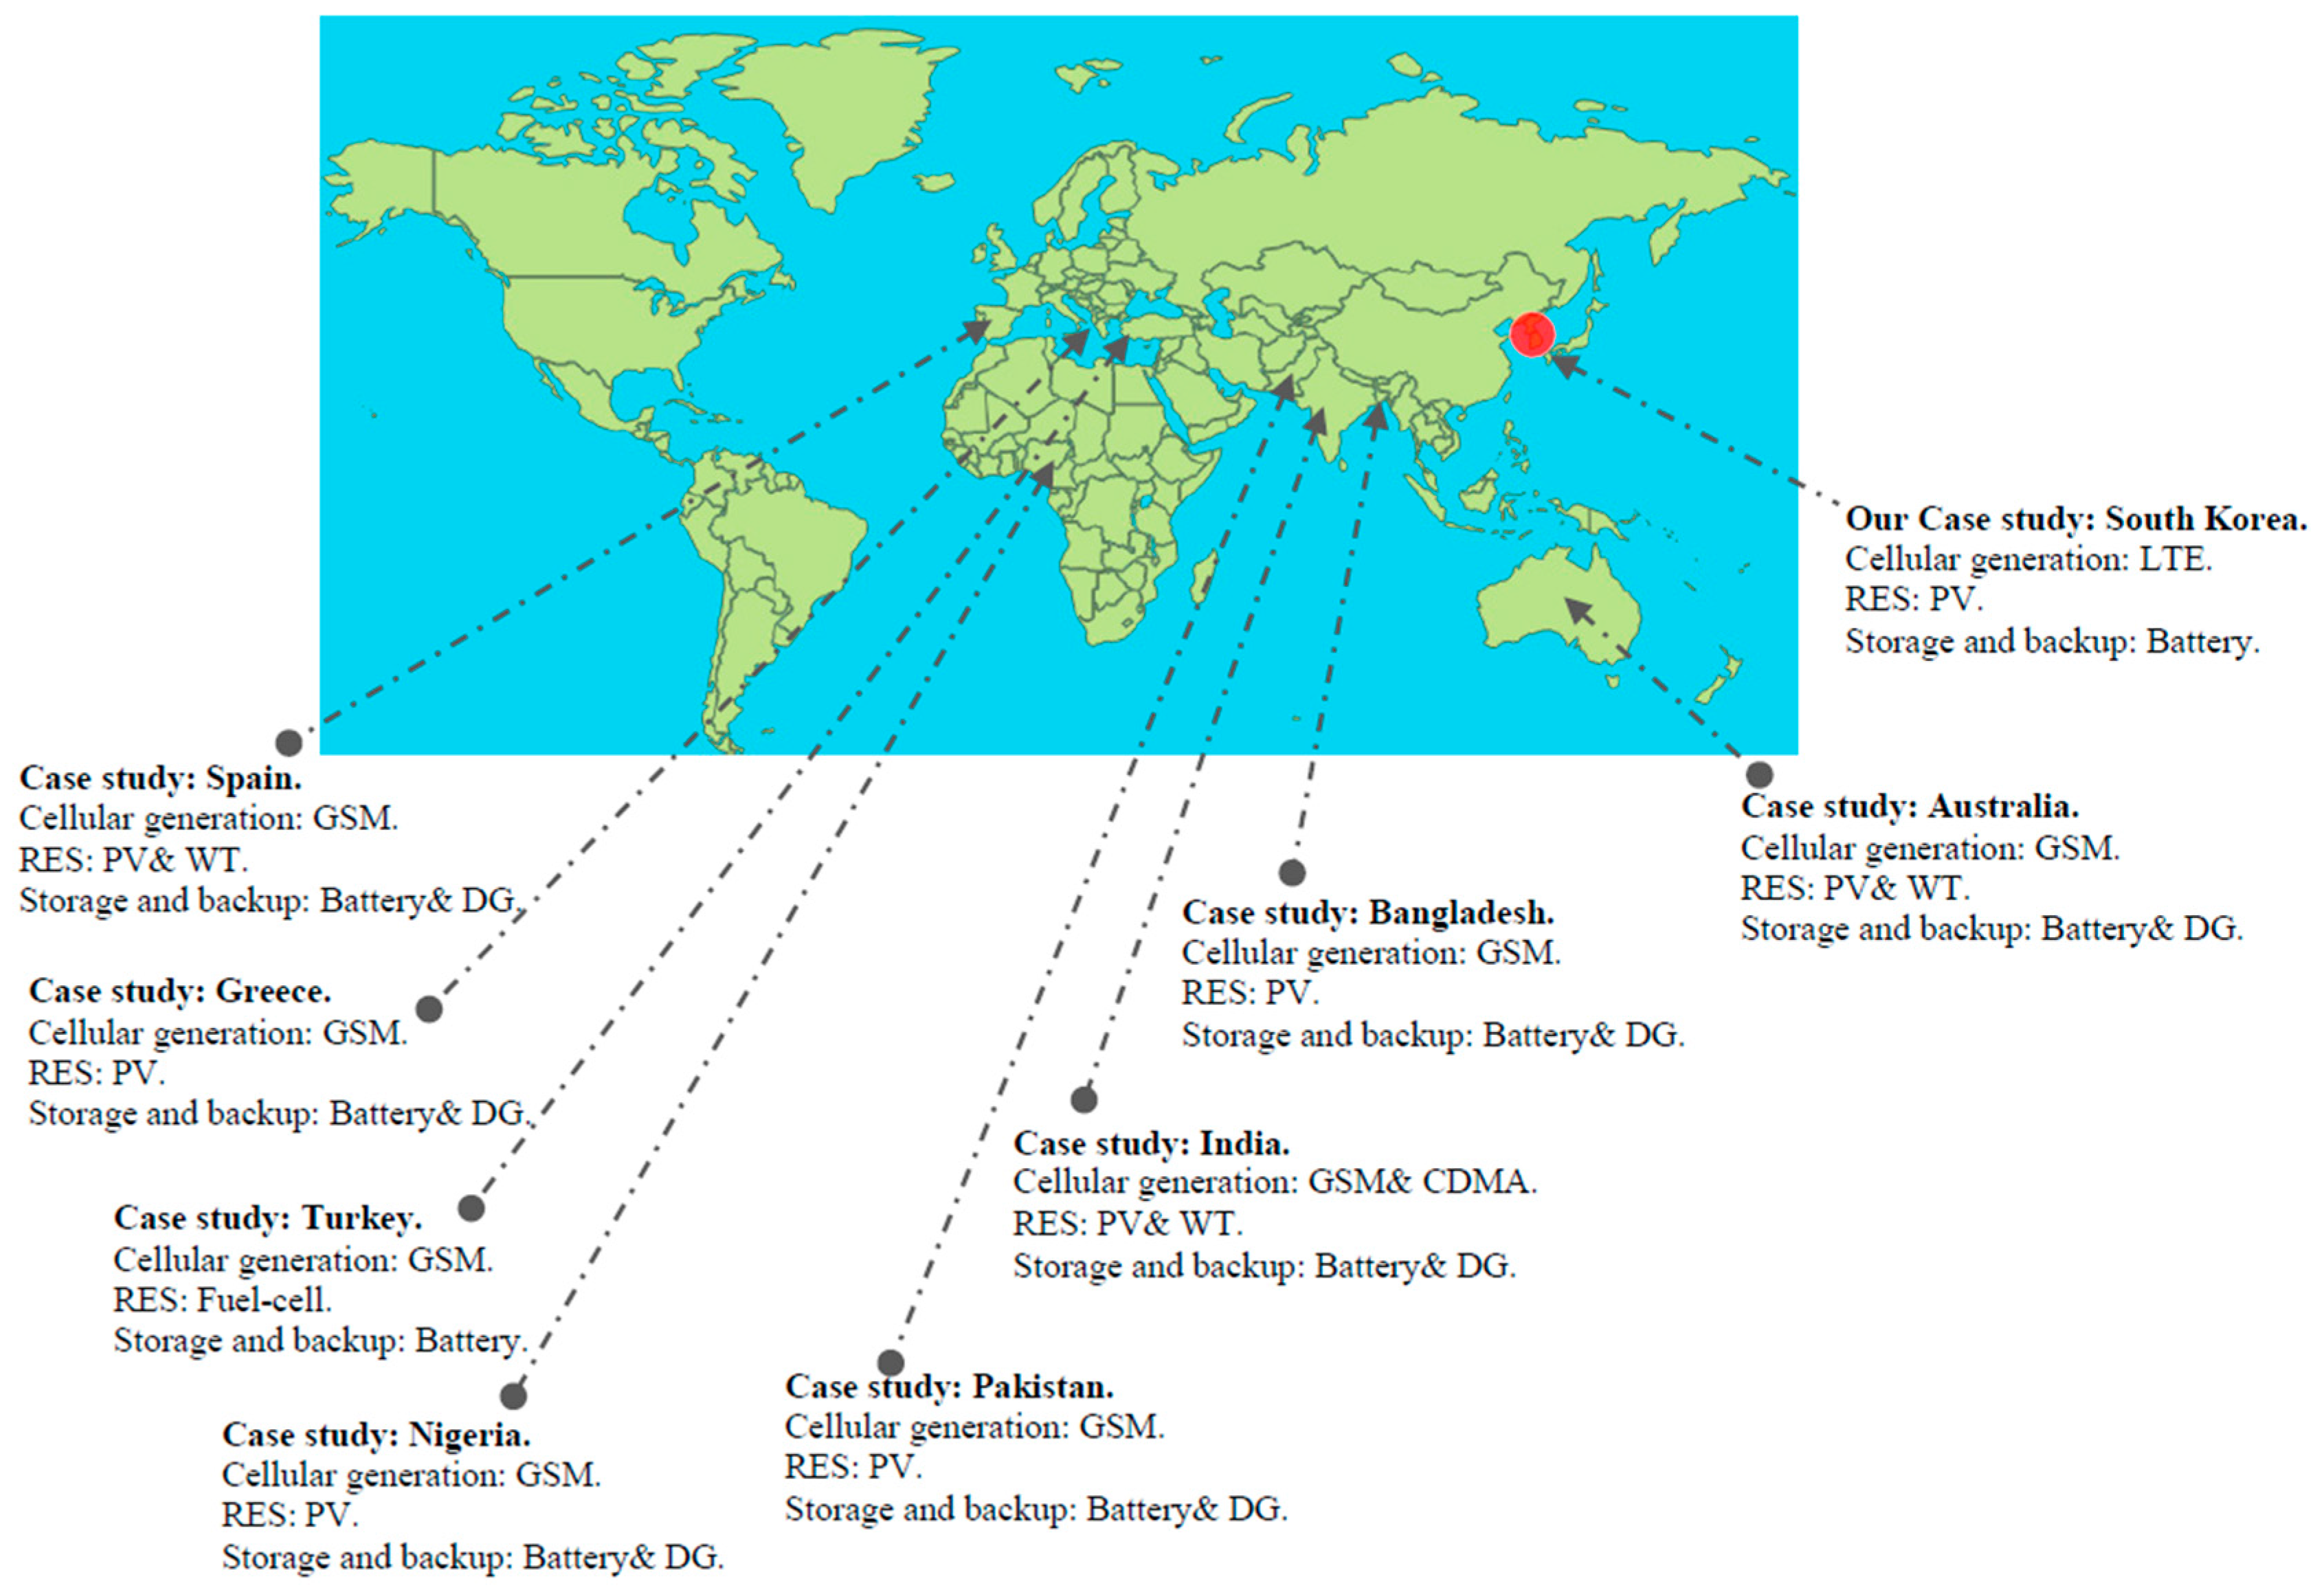
Figure 1 highlights the different studies that have been conducted to develop environmentally friendly cellular networks with low operational expenditures in different regions around the world.
This study addresses the sustainability of power sources for base stations in the fourth generation of cellular networks, which is called long-term evolution (LTE) and is considered the fastest development in mobile communication [
18].
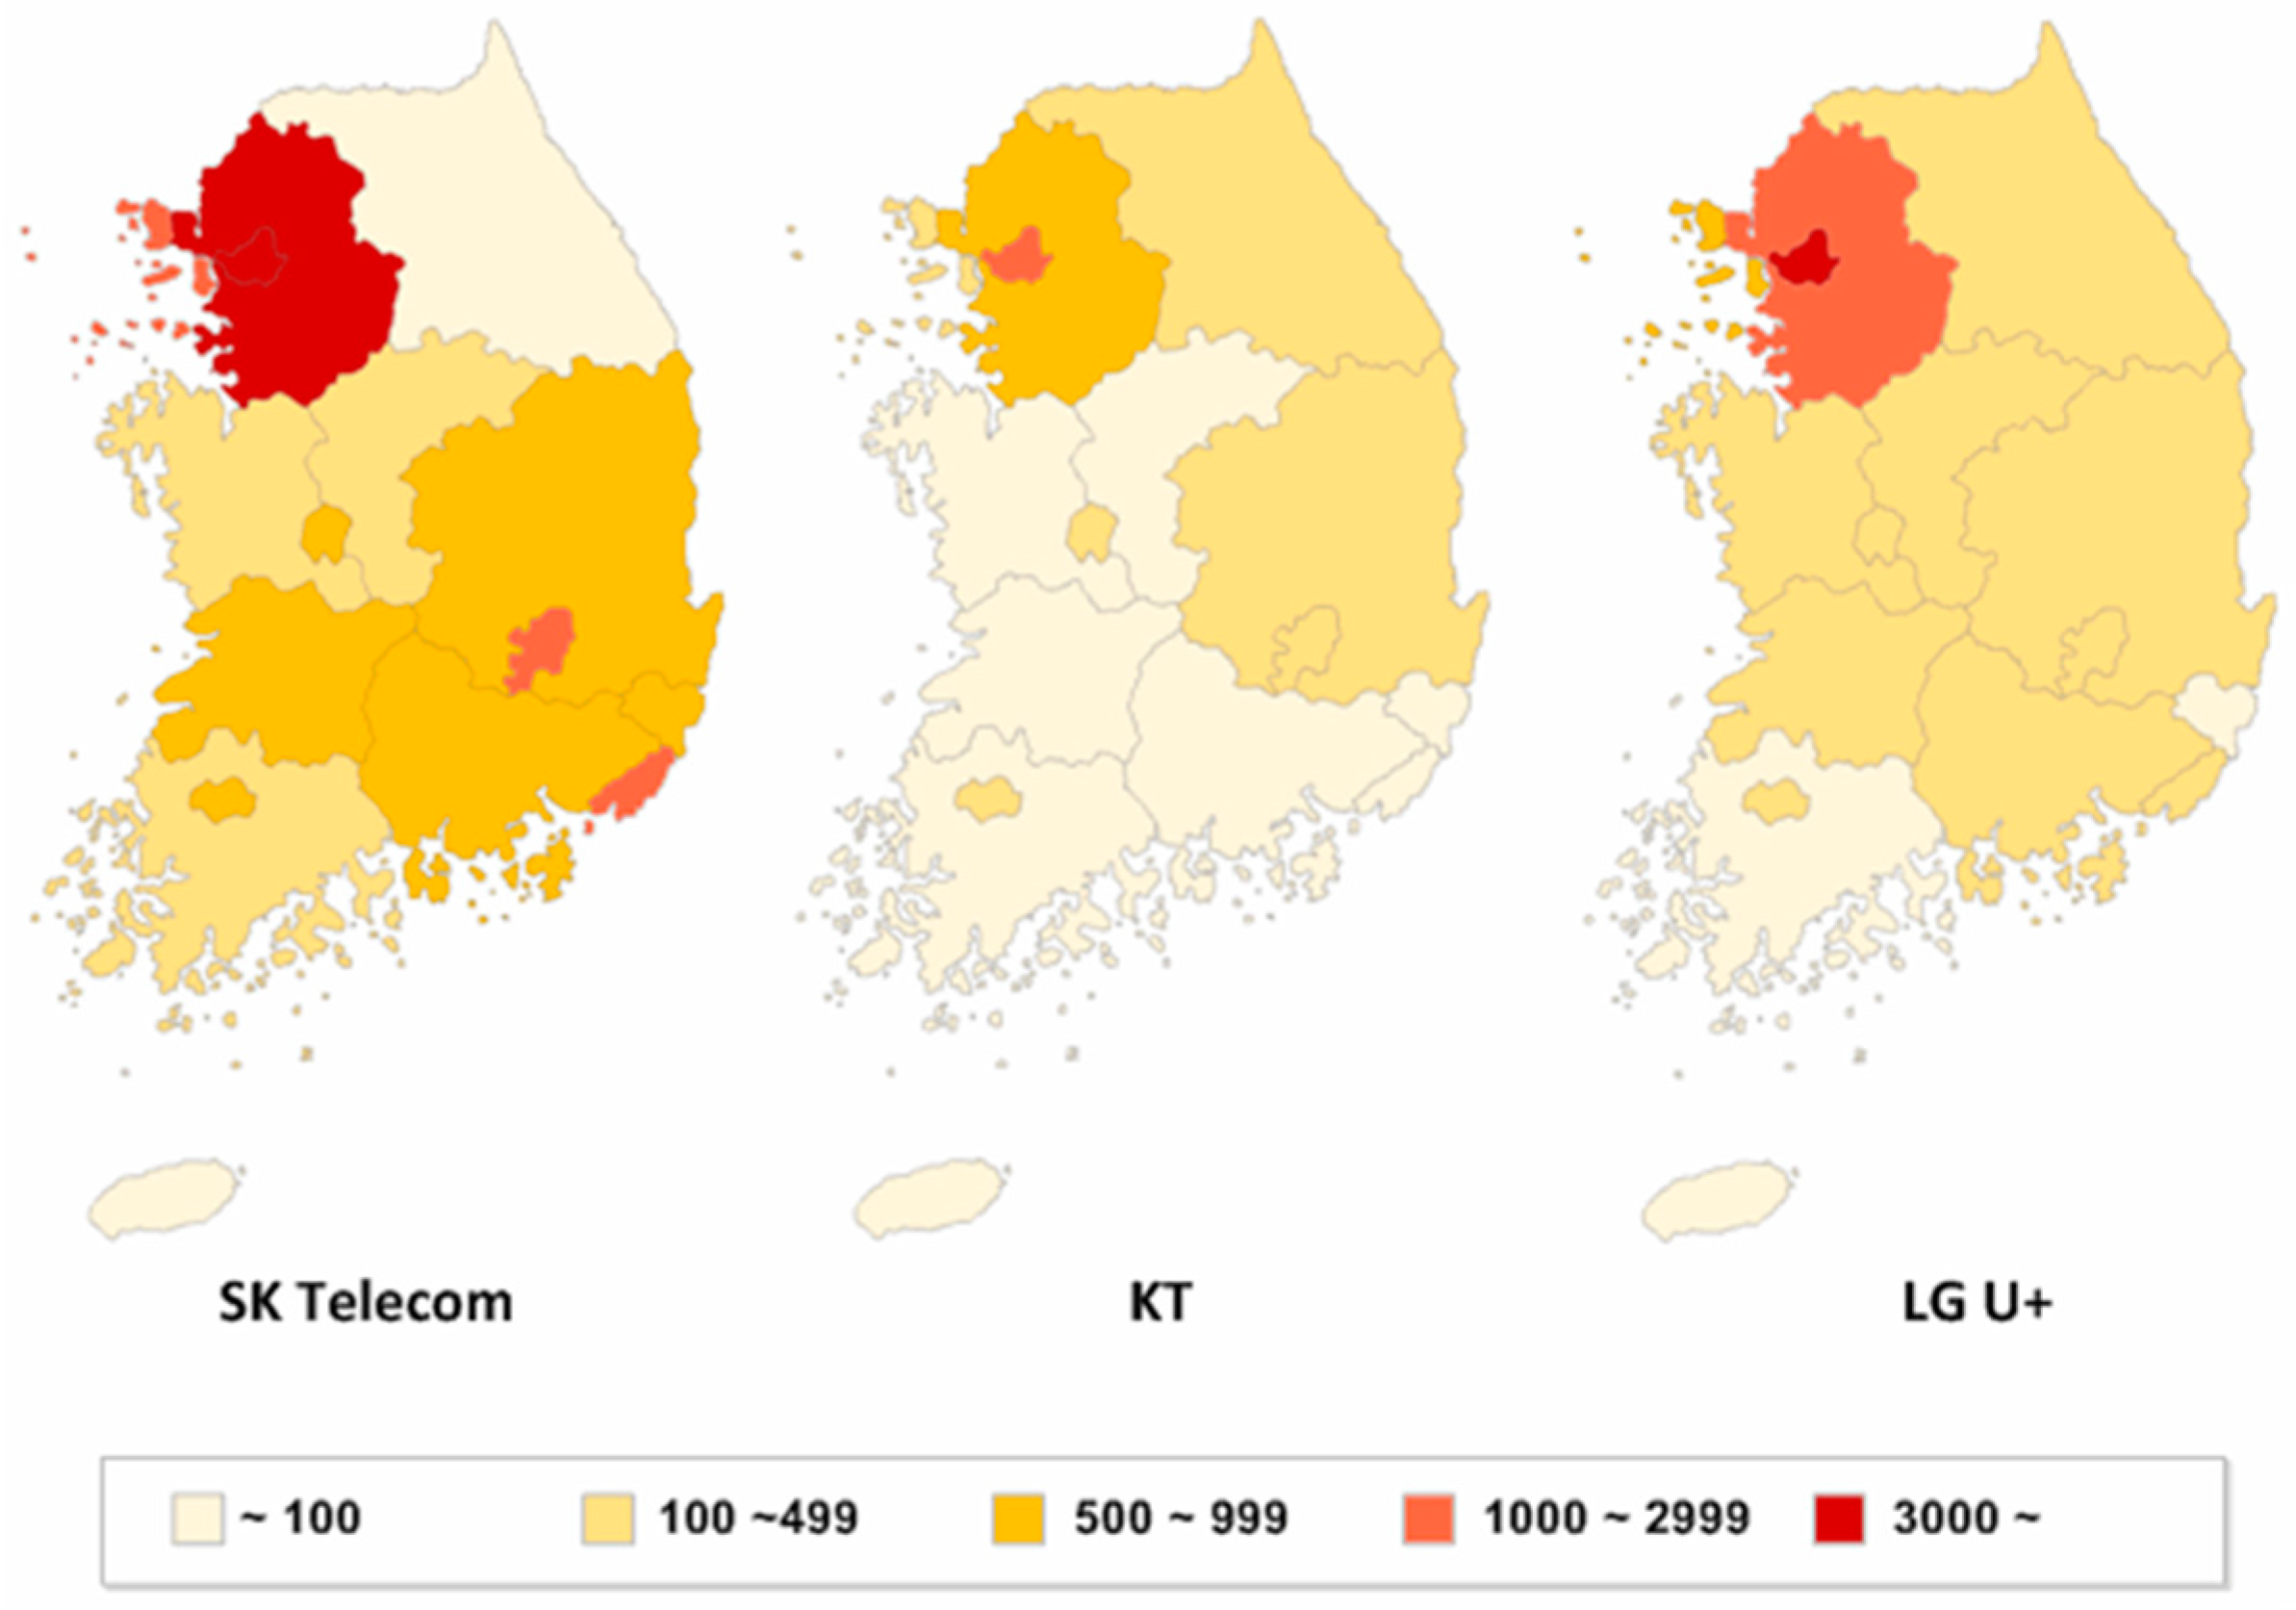
Figure 2 shows the number and locations of the LTE base stations deployed in South Korea by mobile operators, where
SK Telecom has 52,000,
LG U+ has 70,717, and
KT has 42,476 LTE base stations [
19].
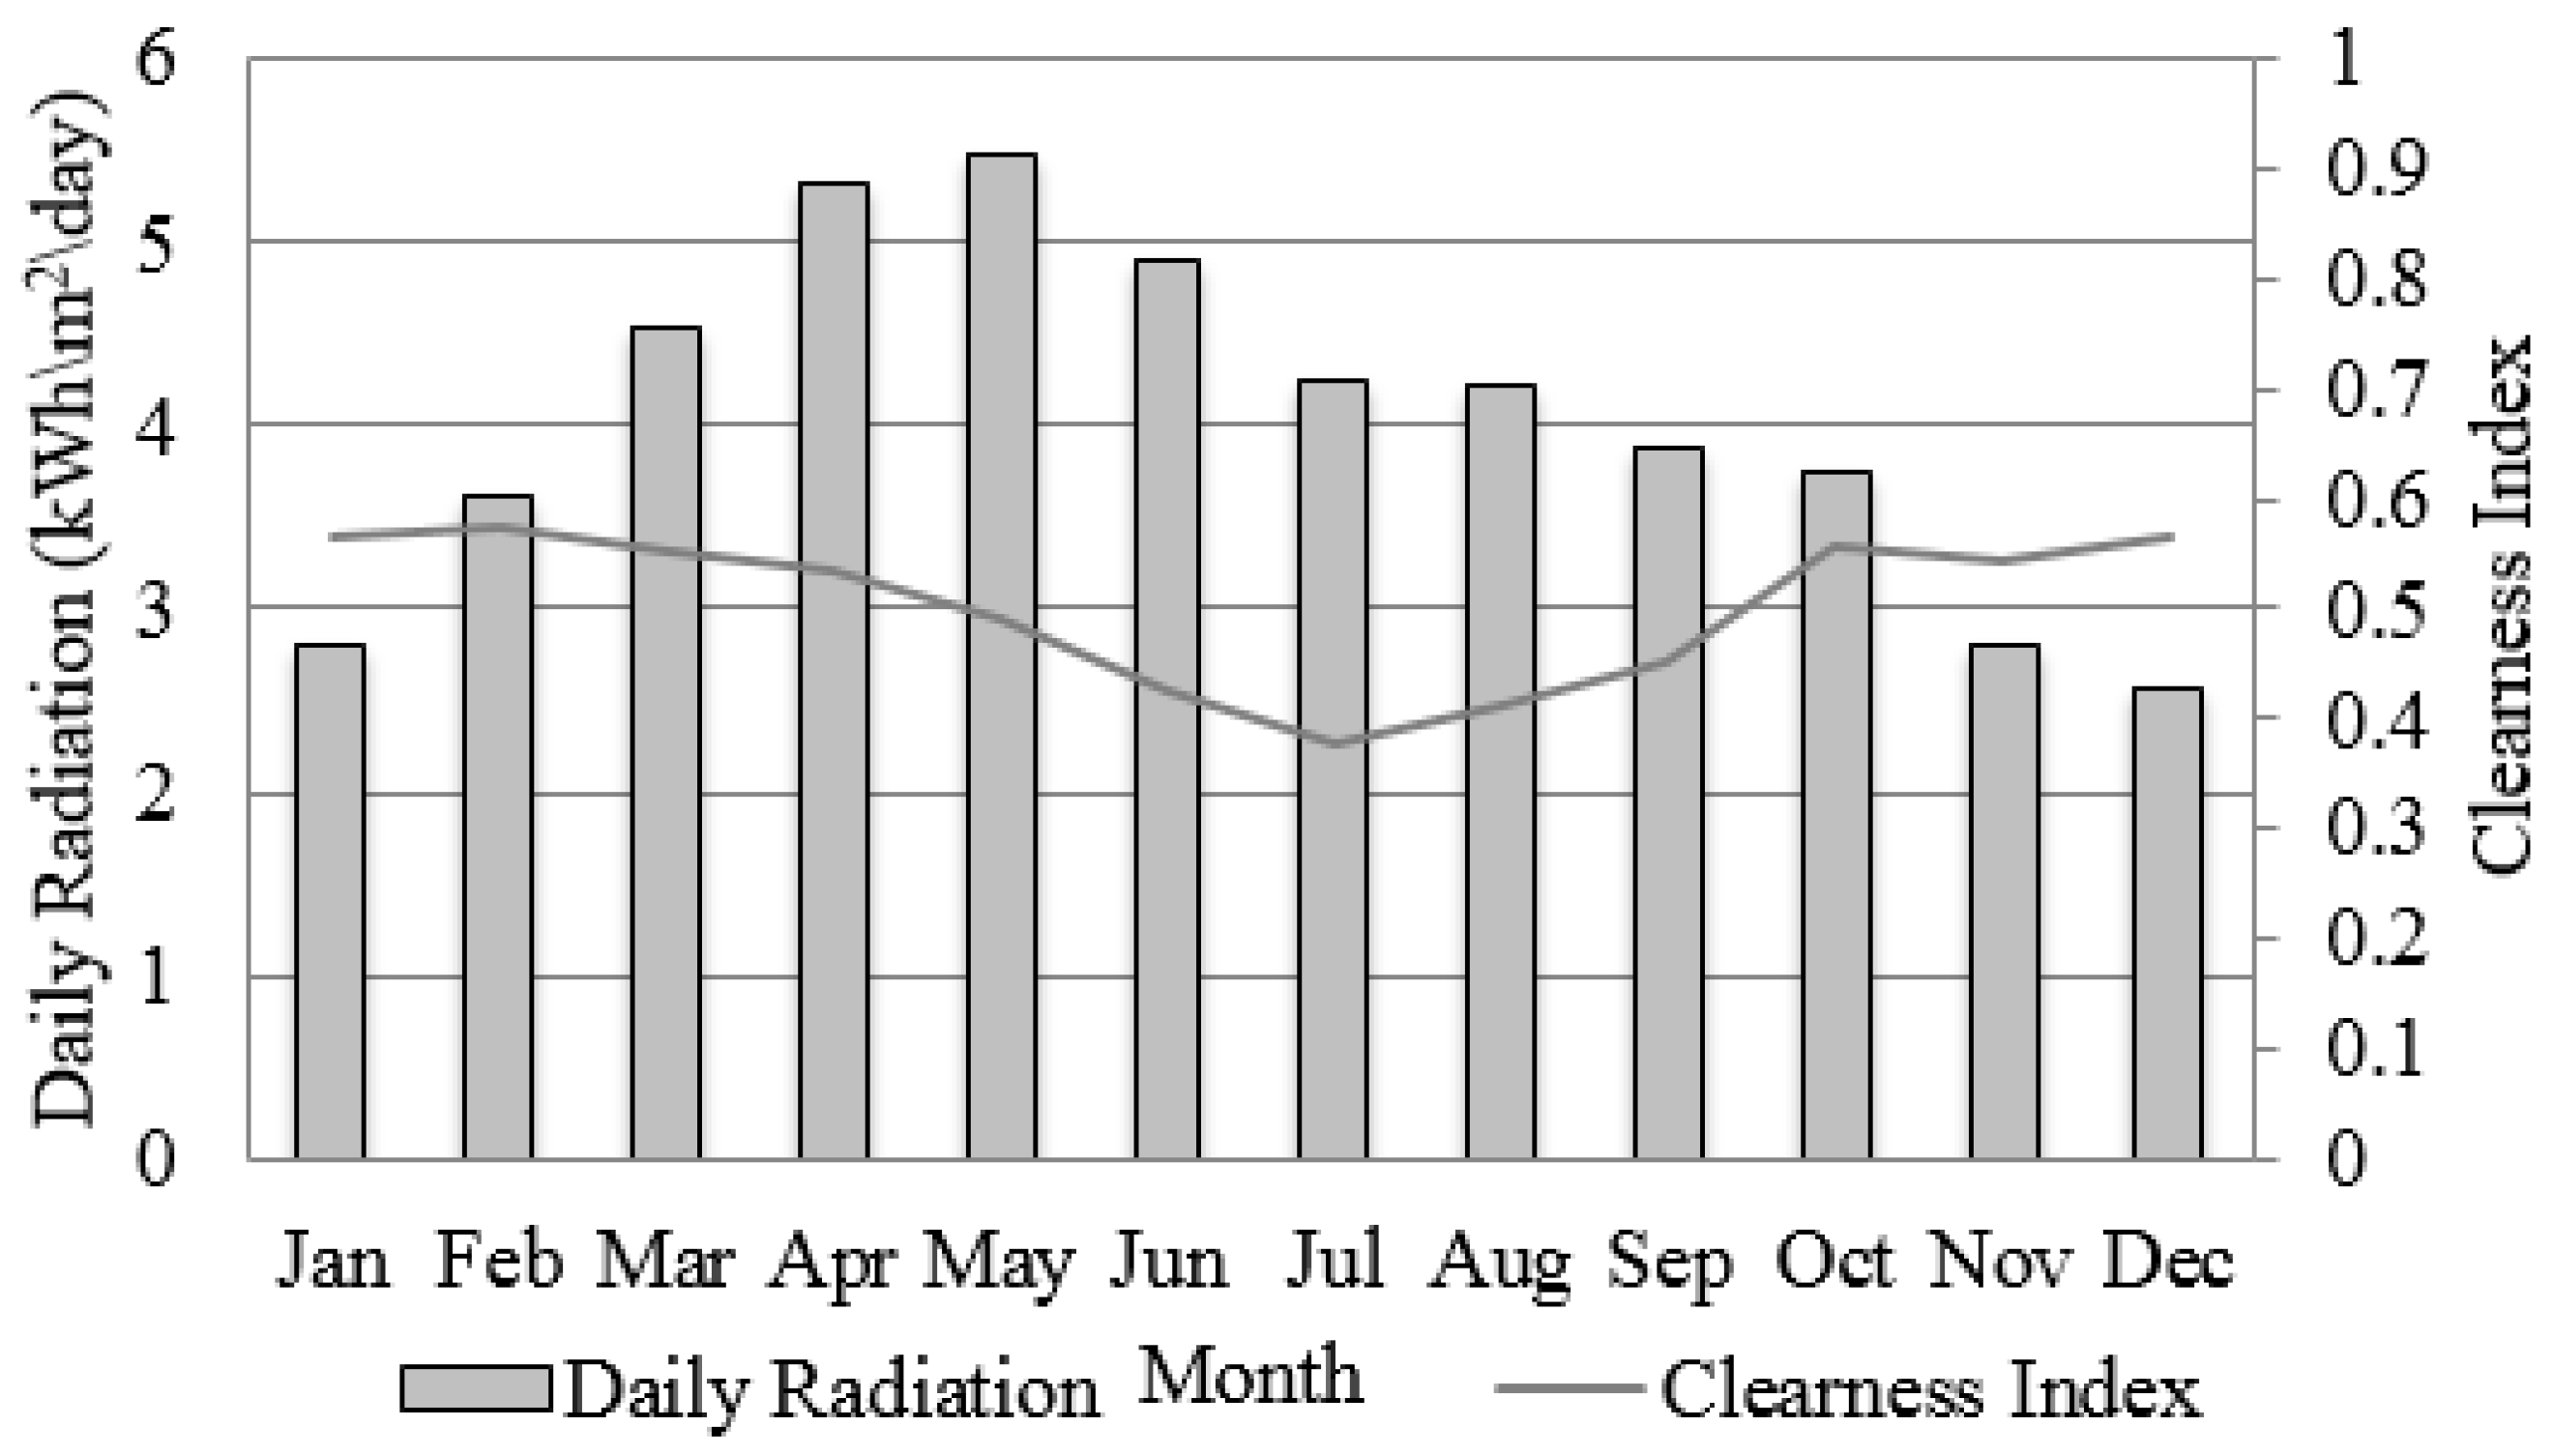
3. Potential of Applying Solar Energy in South Korea
The average daily solar radiation in South Korea, which is located at a latitude between 34° and 38°N, is estimated to be 4.01 kWh·m
−2 and varies from 2.474 kWh·m
−2 in December to 5.622 kWh·m
−2 in May [
4,
5]. Monthly variation, as shown in
Figure 3, is largely because of the shift in the elevation angle of the sun. Additionally, the long spell of rainy weather in early summer decreases the global horizontal irradiance in June and July.
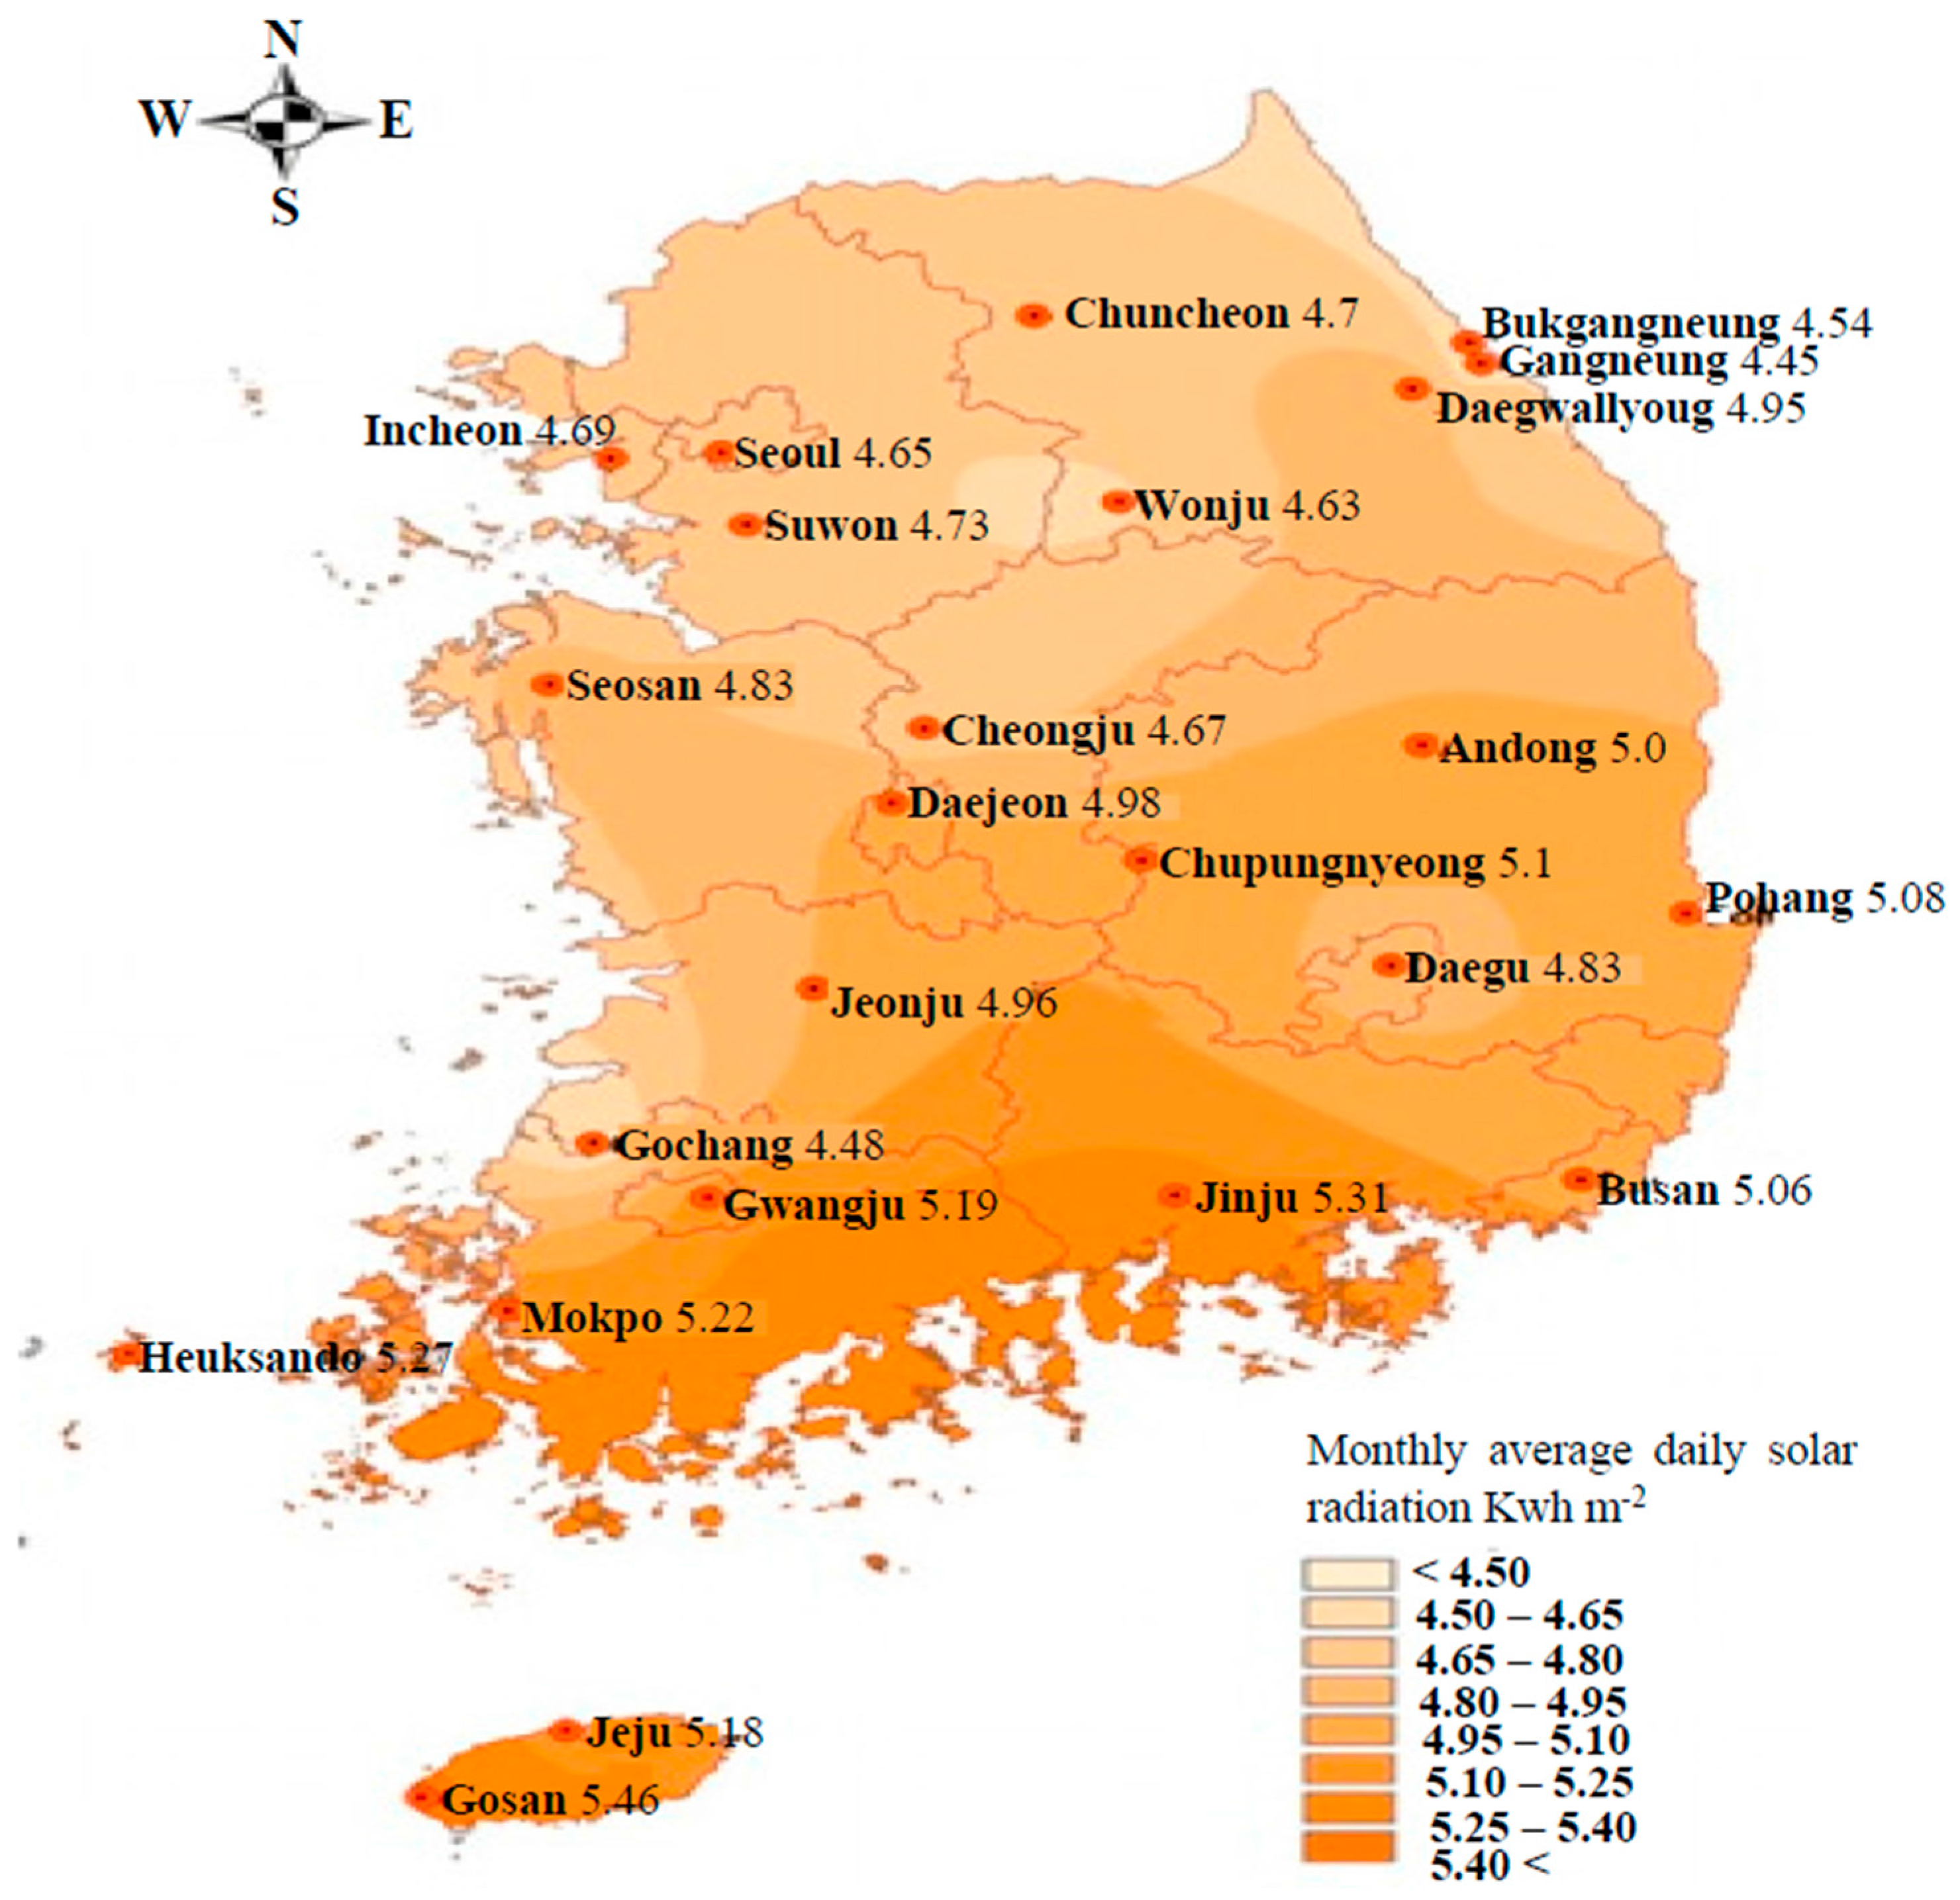
Moreover, solar radiation in different areas of South Korea is shown in
Figure 4. Relatively higher daily solar radiation of over 5 kWh·m
−2 can be obtained in the southwestern coastal area, including Jeju Island. In contrast, in the northwestern region around Seoul, daily solar radiation is lowered to approximately 4.7 kWh·m
−2, and Gochang, located at the western coast of South Korea, shows the lowest daily solar radiation of 4.48 kWh·m
−2.
According to
Figure 4, this study attempts to determine the optimum criteria for the solar energy systems for different values of solar radiation to cover all possible areas of South Korea: 4.0, 4.5, 4.6, 4.7, 4.8, 4.9, and 5.0 kWh·m
−2. The monthly average solar radiation values used in this study are obtained from the Korea Meteorological Administration (KMA) and the NASA Surface Meteorology and Solar Energy using the longitude and latitude of South Korea [
4,
5]. The energy production analysis and the cost details of the solar power system will be given based on the average daily solar radiation of South Korea, which is 4.0 kWh·m
−2.
Barriers Facing the Spread of Photovoltaic (PV) System and Recommendations
One of the major drawbacks of the PV system is that it is highly dependent on weather conditions; this system lacks stability because of the variation in solar radiation. As stated above, solar radiation in December is less than half of the solar radiation in May. This large seasonal fluctuation of solar radiation results in difficulties with using the PV system in South Korea. To ensure sufficient electrical energy, the PV capacity should be increased or an additional power generation system should be included, which may cause increased installation costs for the overall system. In addition, typhoons with heavy rain that occur in South Korea largely during the summer season will damage solar PV panels and their mounting structure. Continued maintenance by a trained engineer is necessary to maintain PV system performance for telecommunication applications.
4. System Model
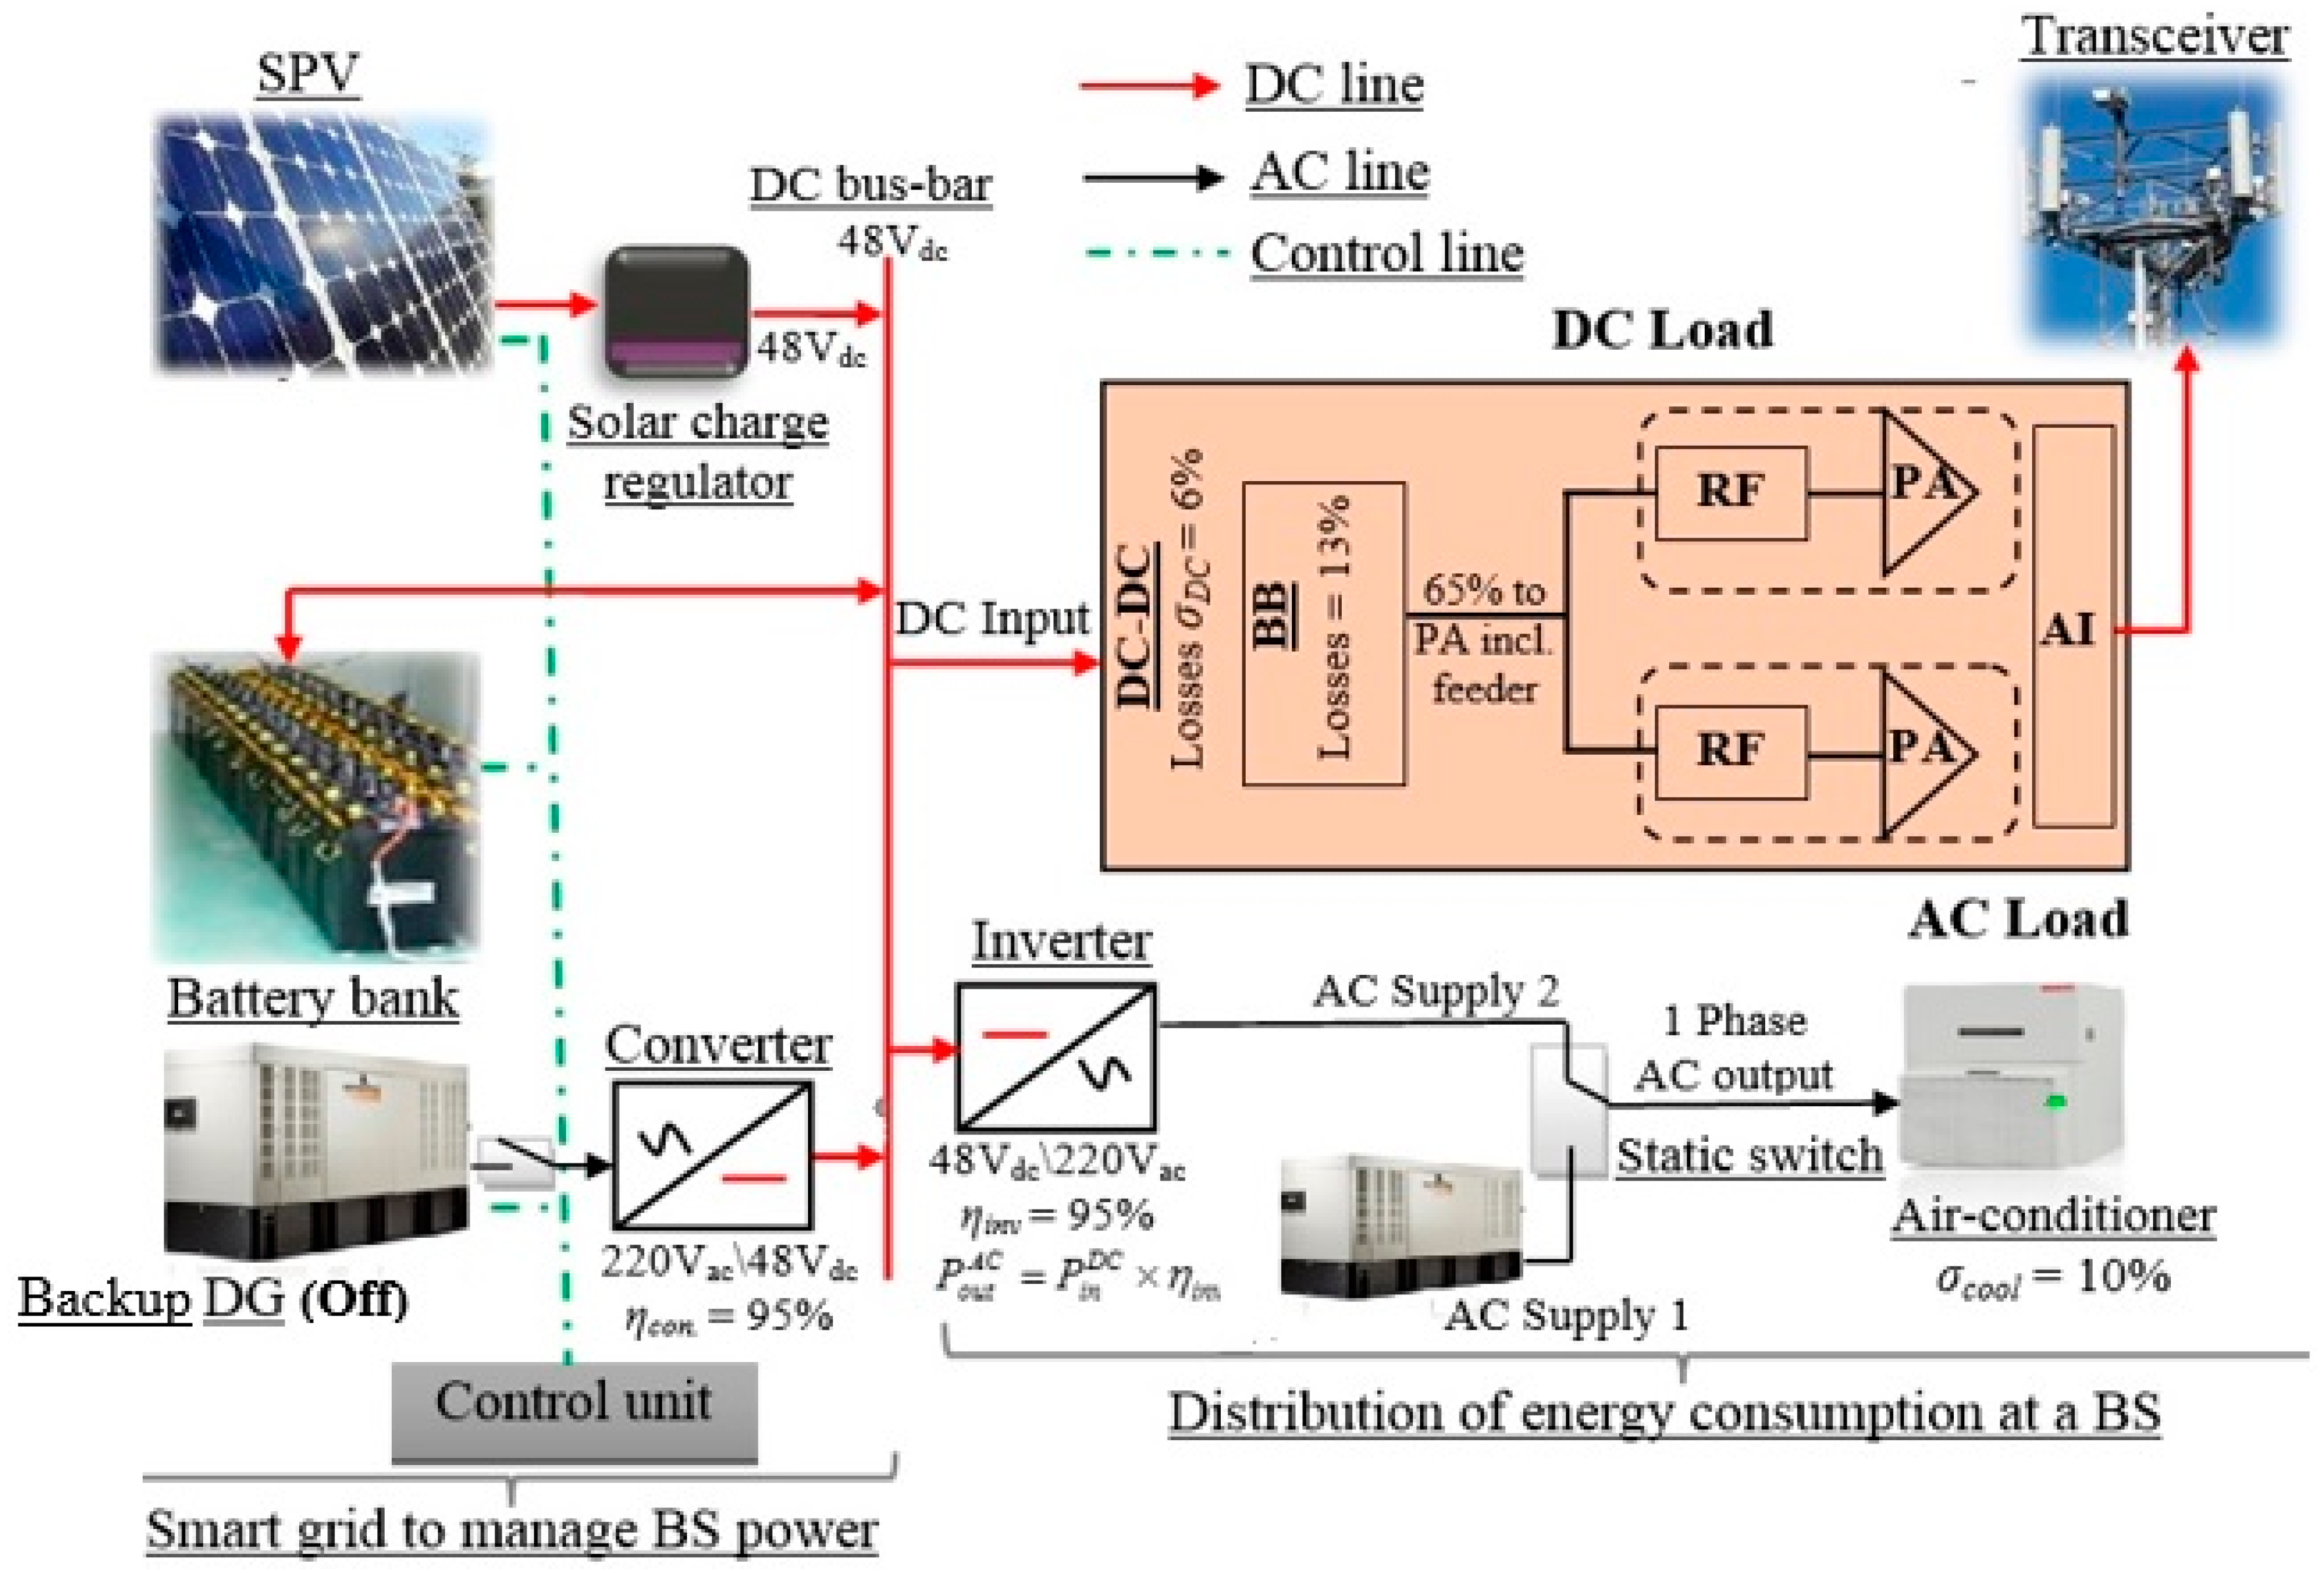
Figure 5 shows a model of a solar energy system integrated with an LTE-macro base station.
The solar panels feed the required energy to the LTE-macro base station. However, in case of a malfunction of the solar panels, resulting in an inability to provide the energy required to the LTE-macro base station, the battery bank compensates for the shortage of energy. If the battery bank reaches its maximum depth of discharge (DOD) and loses the ability to supply the LTE-macro base station the required energy, a backup diesel generator supplies energy to the LTE-macro base station. Hence, the diesel generator is suggested as a backup power source to secure the power supply during maintenance or in case of a malfunction in the system. The static switch monitors the power of the solar power system. If the output power is less than required to meet the AC loads, the AC loads switch to draw energy from the backup diesel generator.
4.1. Long-Term Evolution (LTE)-Macro Base Station Subsystem and Power Consumption Modelling
The base station in a cellular network is an access link between the core network and the mobile equipment (users); a base station site consists of a set of equipment, including a power amplifier, baseband unit, radio-frequency unit, power supply, and air conditioner. More details on the base station components can be found in [
21].
An LTE-macro base station type is described in [
22]. The mathematic equation for the power consumption of an LTE-macro base station is
, where
NTRX is the number of transceivers,
is the power consumption by the power amplifier unit,
is the power consumption by the radio-frequency unit, and
is the power consumption by the baseband unit.
σDC and
σcool represent the DC-DC regulator and air conditioner losses, respectively. However, the power consumption of the air conditioner depends on the surroundings and the internal temperature of the LTE-macro base station cabinet. According to [
22],
σDC is approximately 6%, and
σcool is approximately 10%.
is a linear function of the base station transmission power
and is equal to
where
ηPA is the PA efficiency. In general, both coverage and signal propagation fading are considered main factors in determining the transmission power of the base station. However, the simplified mathematical model to calculate the transmission power from the base station is
where
α is the path loss coefficient,
R is the actual coverage radius of the base station, and
Po and
Ro are the normalised transmission power, which is 40 W, and the normalised coverage radius, which is 1 km for a base station. Hence, the mathematic equation for the power consumption of the LTE-macro base station is
. In addition, the base station site includes a microwave dish (
Pmc) to connect the base station to the core network and lighting lamps (
Plm). Hence, the final mathematic equation for the power consumption of the LTE-macro base station is,
Table 1 summarises the power consumption for different equipment at an LTE-macro base station with a 2 × 2 multiple-input and multiple-output antenna configuration with three sectors.
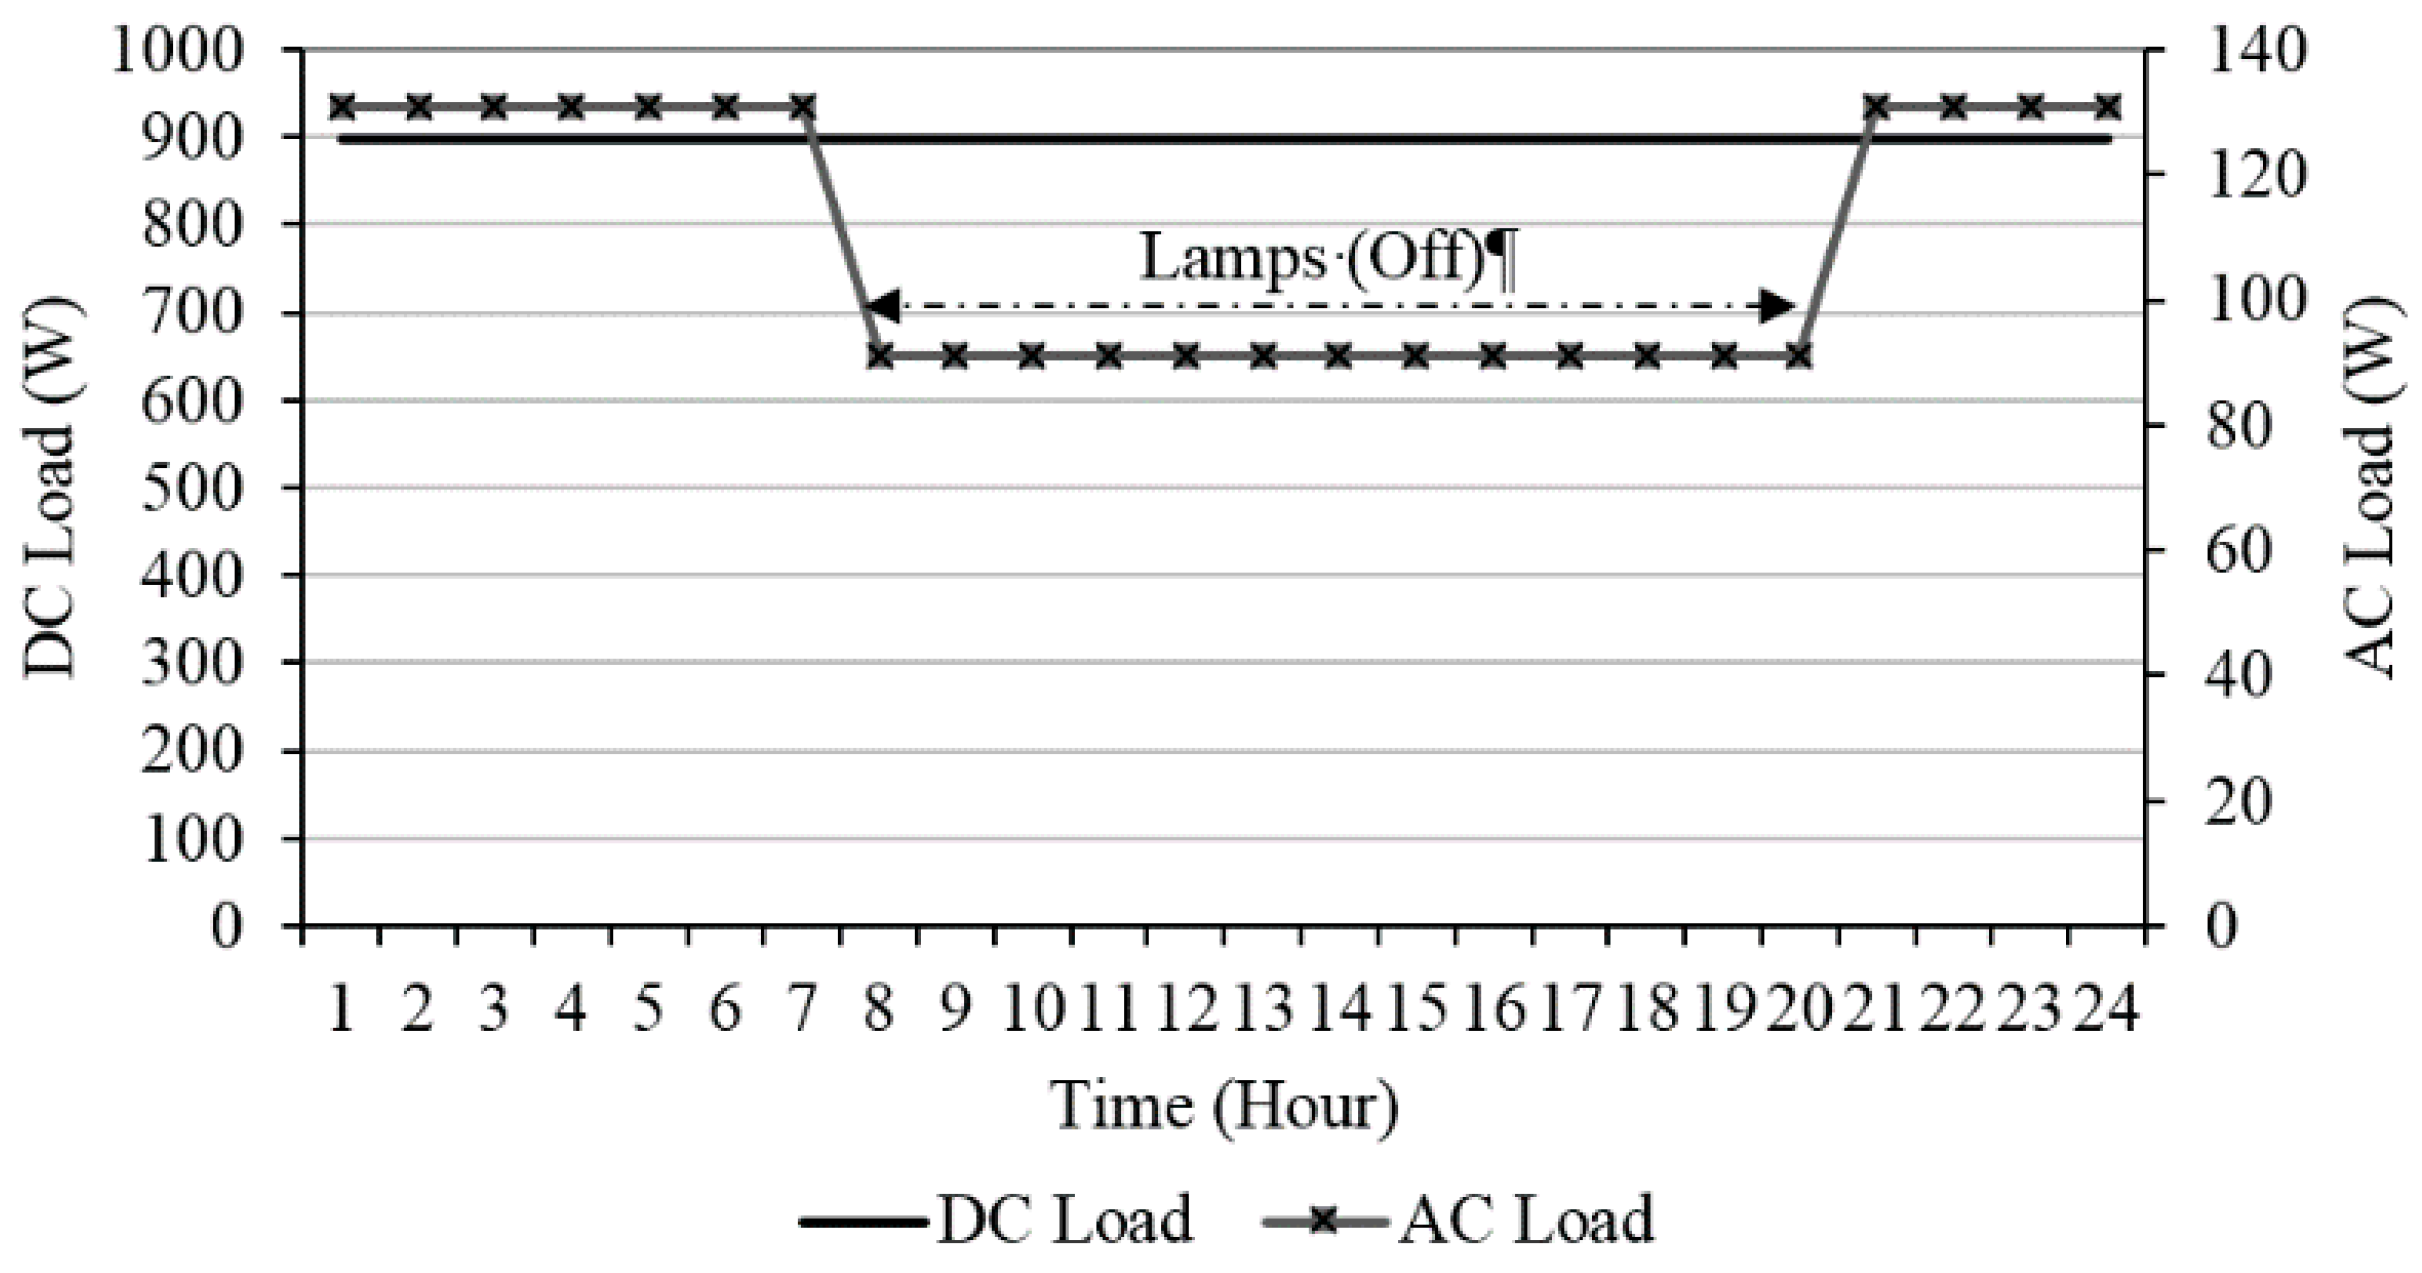
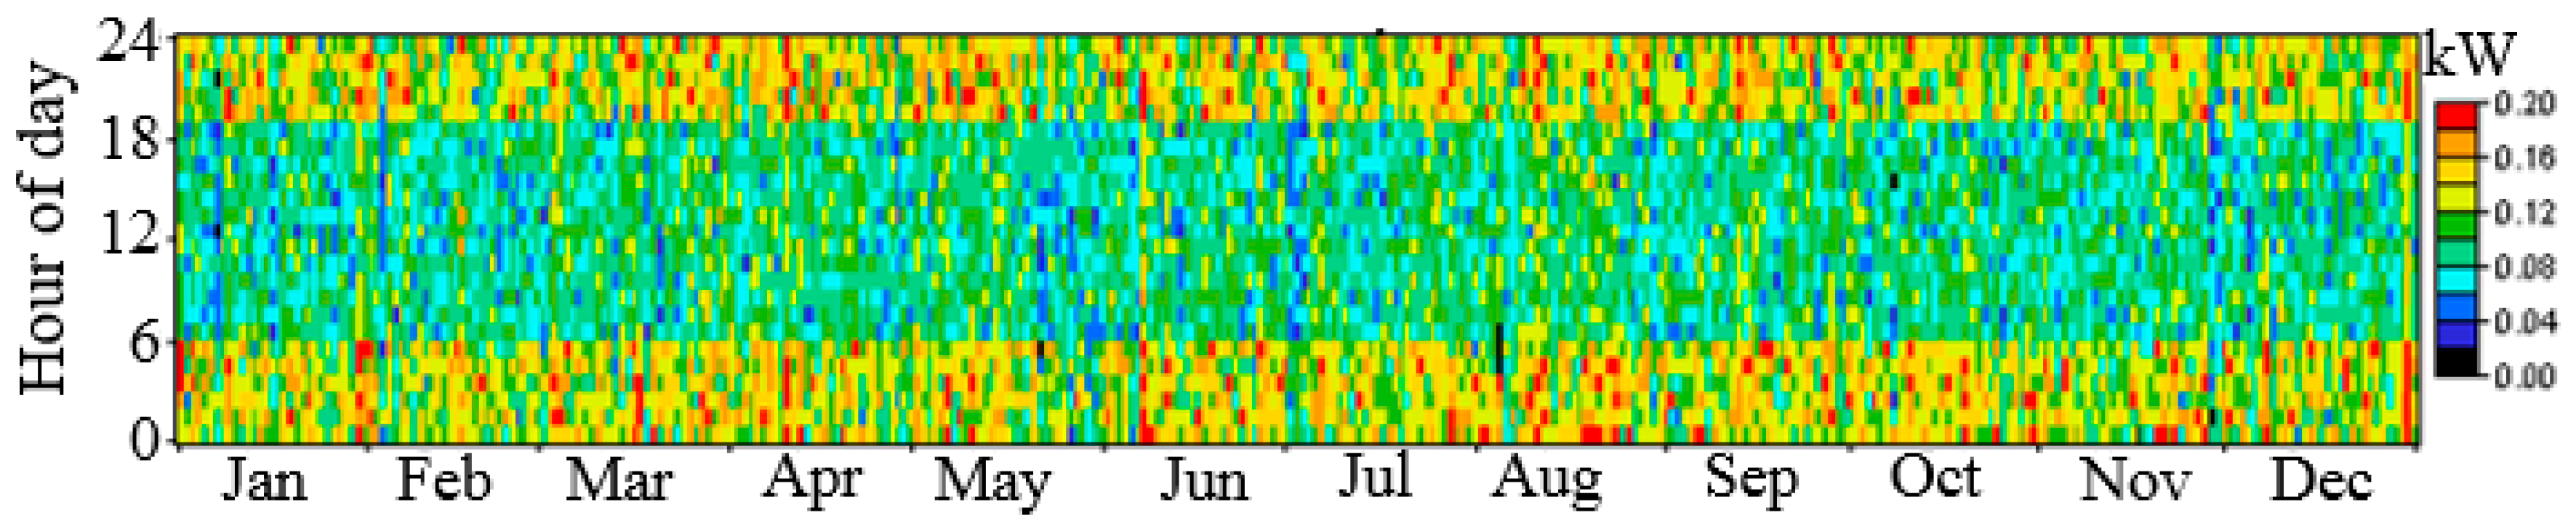
In addition,
Figure 6 shows the hourly load profiles. The AC load includes a 91 W air conditioner that represents 10% of
Pin and 40 W lighting that operates from 7 p.m. to 7 a.m. The DC load includes a base station (
Pop minus air conditioner equals 819 W and microwave backhaul equals 80 W).
4.2. Solar Power Subsystem
The elements of the solar power system are listed below; these elements are designed for easy installation and disassembly. Moreover, due to the significant development in solar technology, these components are designed with high efficiency and low losses to contribute to energy saving.
- a)
Solar panels: absorb shortwave irradiance and convert it into direct current (DC) electricity [
7].
- b)
Solar regulator charger: control unit responsible for the regulation of the unregulated DC output voltage of the solar array to regular DC voltage that is compatible with the load and the battery. In this study, the DC load (LTE-macro base station) voltage is 48 Vdc.
- c)
Batteries: store excess energy from the solar arrays to be used at night or when the power output of the solar panels is not sufficient to cover the LTE-macro base station load. A charge control unit is added to protect the batteries by regulating the charging and discharging process and maintaining the battery lifecycle [
7].
- d)
Inverter: converts the 48 DC voltage of the DC bus-bar into 220 alternating current (AC) voltage that is used to feed the AC load in the base station [
7].
- e)
Control unit: key element in the solar power system that manages and controls the power flow of the different elements in the solar power system to meet the demands of the LTE-macro base station load.
5. Mathematical Model
This section presents the details of the mathematical model of a solar power system proposed to feed an LTE-macro base station.
5.1. Photovoltaic System
HOMER is used to calculate the output energy of the solar panels (
QPV) according to the following equation [
23],
where
YPV is the capacity of the PV array, and
PSH is the peak solar hour [
24].
fPV is the PV derating factor, which reflects the impact of dust, wire losses, temperature, and other factors that can affect the output energy of the solar array.
5.2. Battery Model
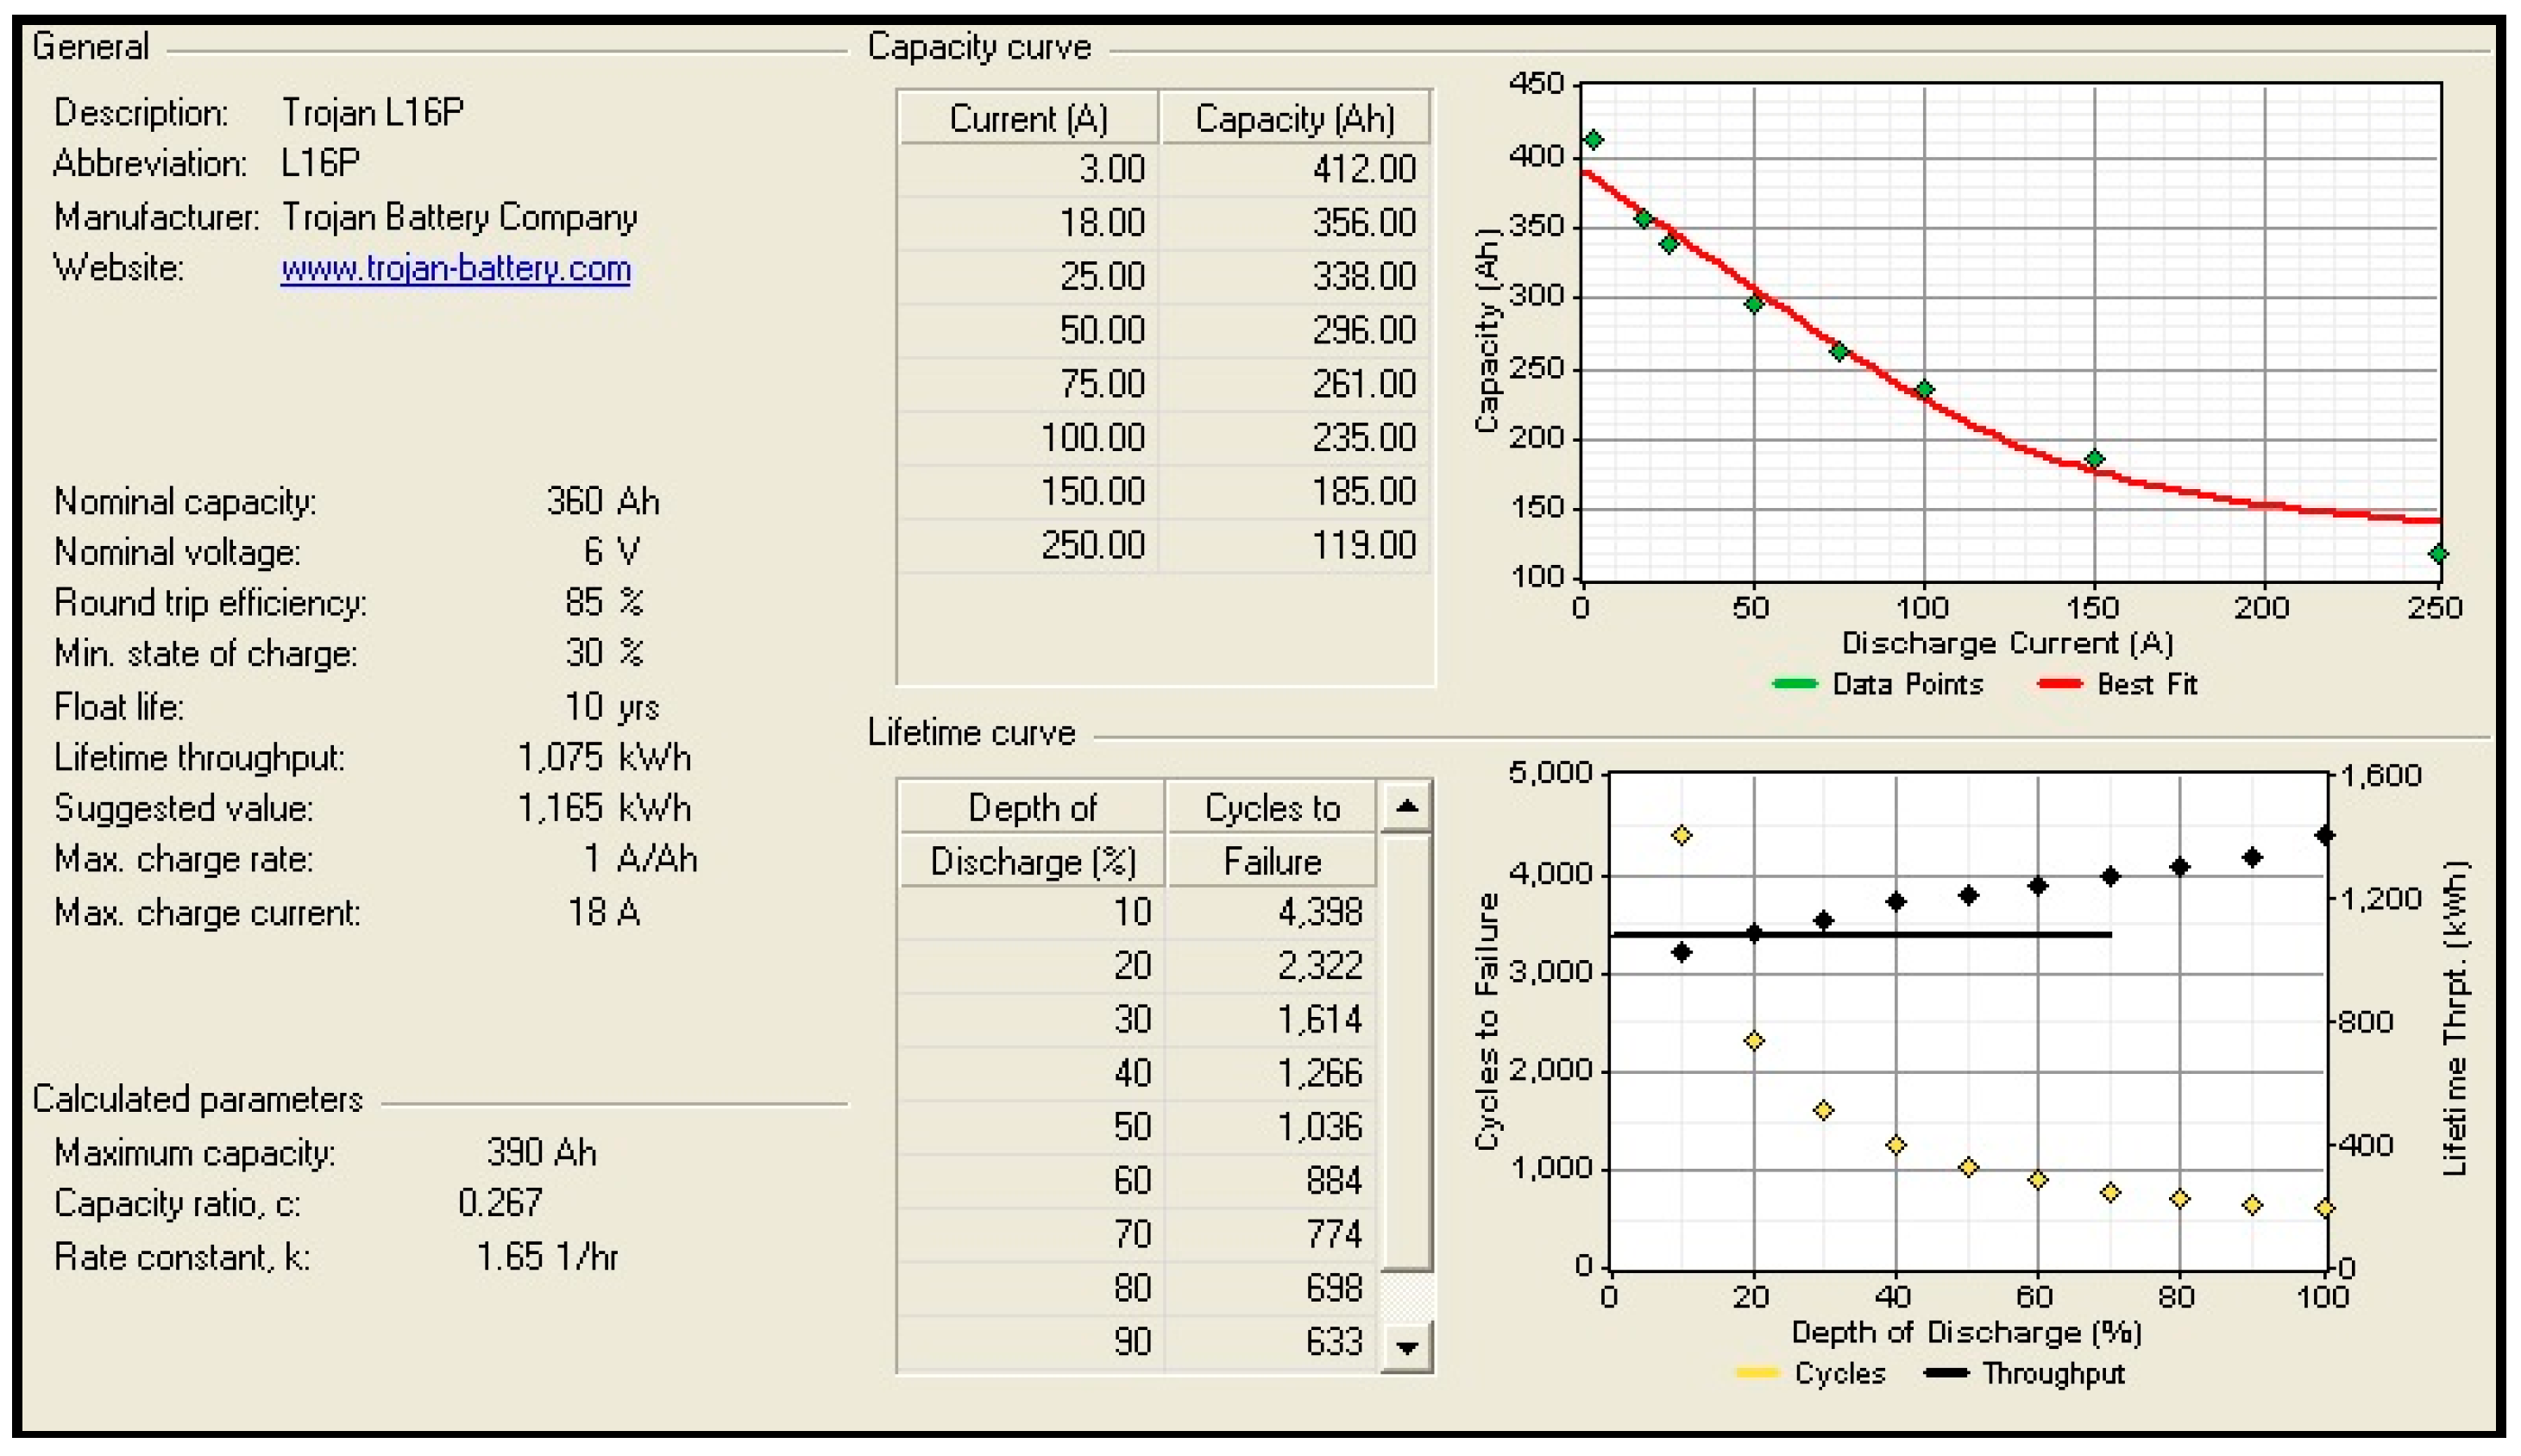
The key features of the battery model used in this study, such as the capacity, voltage, charge current, efficiency, and state of charge (SOC), are shown in
Figure 7. More details can be found in [
25].
The maximum state of charge (
SOCmax) of the battery bank is equal the nominal capacity of the battery bank, while the minimum state of charge (
SOCmin) is 30%, which means the maximum energy that will be delivered from the “
Trojan L16P” battery bank is 70%. This value is called the depth of discharge (
DOD) and is expressed as follows [
23],
The battery bank autonomy (
Abatt) is an important factor that represents the potential number of days that the battery bank can feed the required energy load without contribution from the solar panels, and it is expressed as the ratio of the battery bank size to the LTE-macro base station load [
23],
where
Nbatt is the number of batteries,
Vnom and
Qnom are the voltage and capacity of a single battery, respectively, and
Lprim−avg is the average daily LTE-macro base station load.
The battery lifecycle (
Rbatt) is another important issue that can reduce the total replacement cost during the project lifecycle. The throughput and the battery float life are the main factors that affect the battery lifecycle. The battery lifecycle is calculated by HOMER based on the following equation [
23],
where
Qlife is the lifetime throughput of a single battery,
Qthr is the annual battery throughput, and
Rbatt,f is the battery float life.
6. HOMER Modelling Software
HOMER [
23] is the optimisation software used in this study to determine the optimal solar power system that satisfies user-specified constraints with the lowest net present cost NPC, which represents all the costs that occur within the project lifecycle, including the initial costs (IC), replacement costs, and O&M costs.
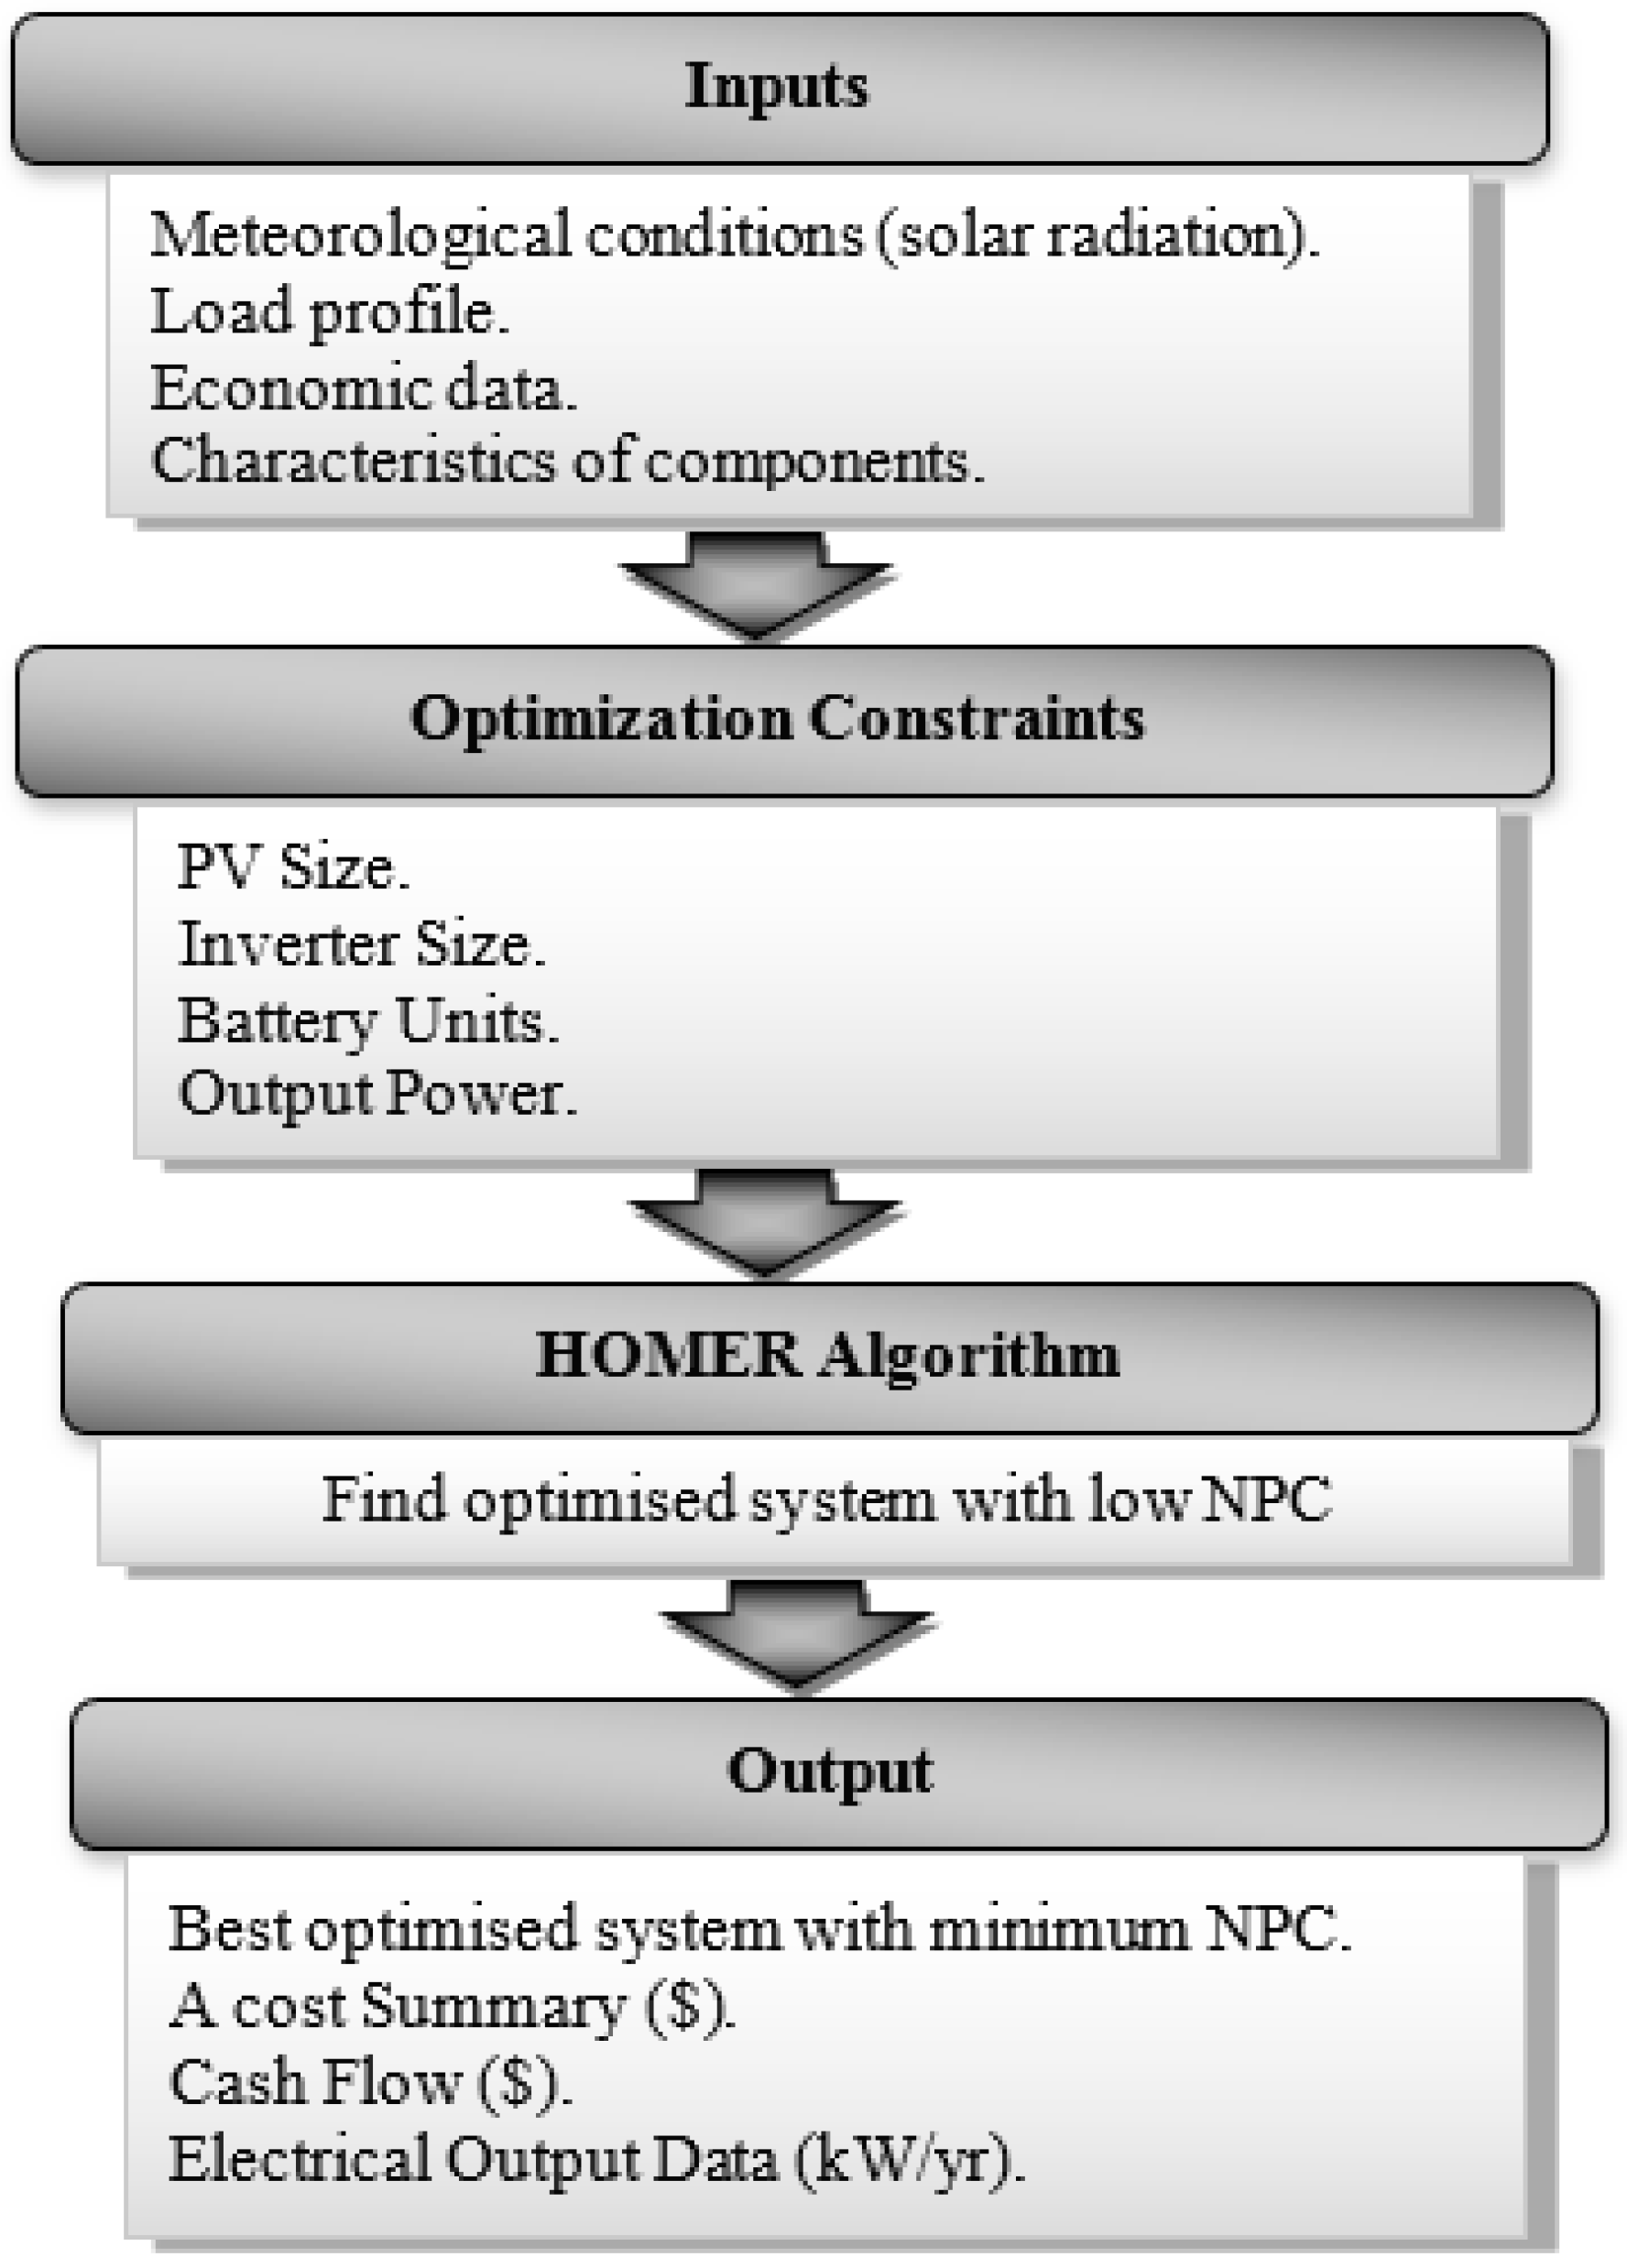
Figure 8 summarises the main parts of the HOMER simulation, inputs, optimisation, and outputs. The NPC is computed as follows,
where
TAC is the total annualised cost, and
CRF is the capital recovery factor (CRF), which is,
where
n is the project lifecycle, and
i is the annual real interest rate.
The discount factor (
fd) is a ratio used to calculate the present value of cash flow that occurs in any year of the project lifetime and is expressed as follows,
NPC also includes the salvage value (
S), which is calculated as follows,
where
rep,
rem, and
comp are the replacement cost of the component, the remaining lifetime, and the lifetime of the component, respectively.
7. Simulation Configuration
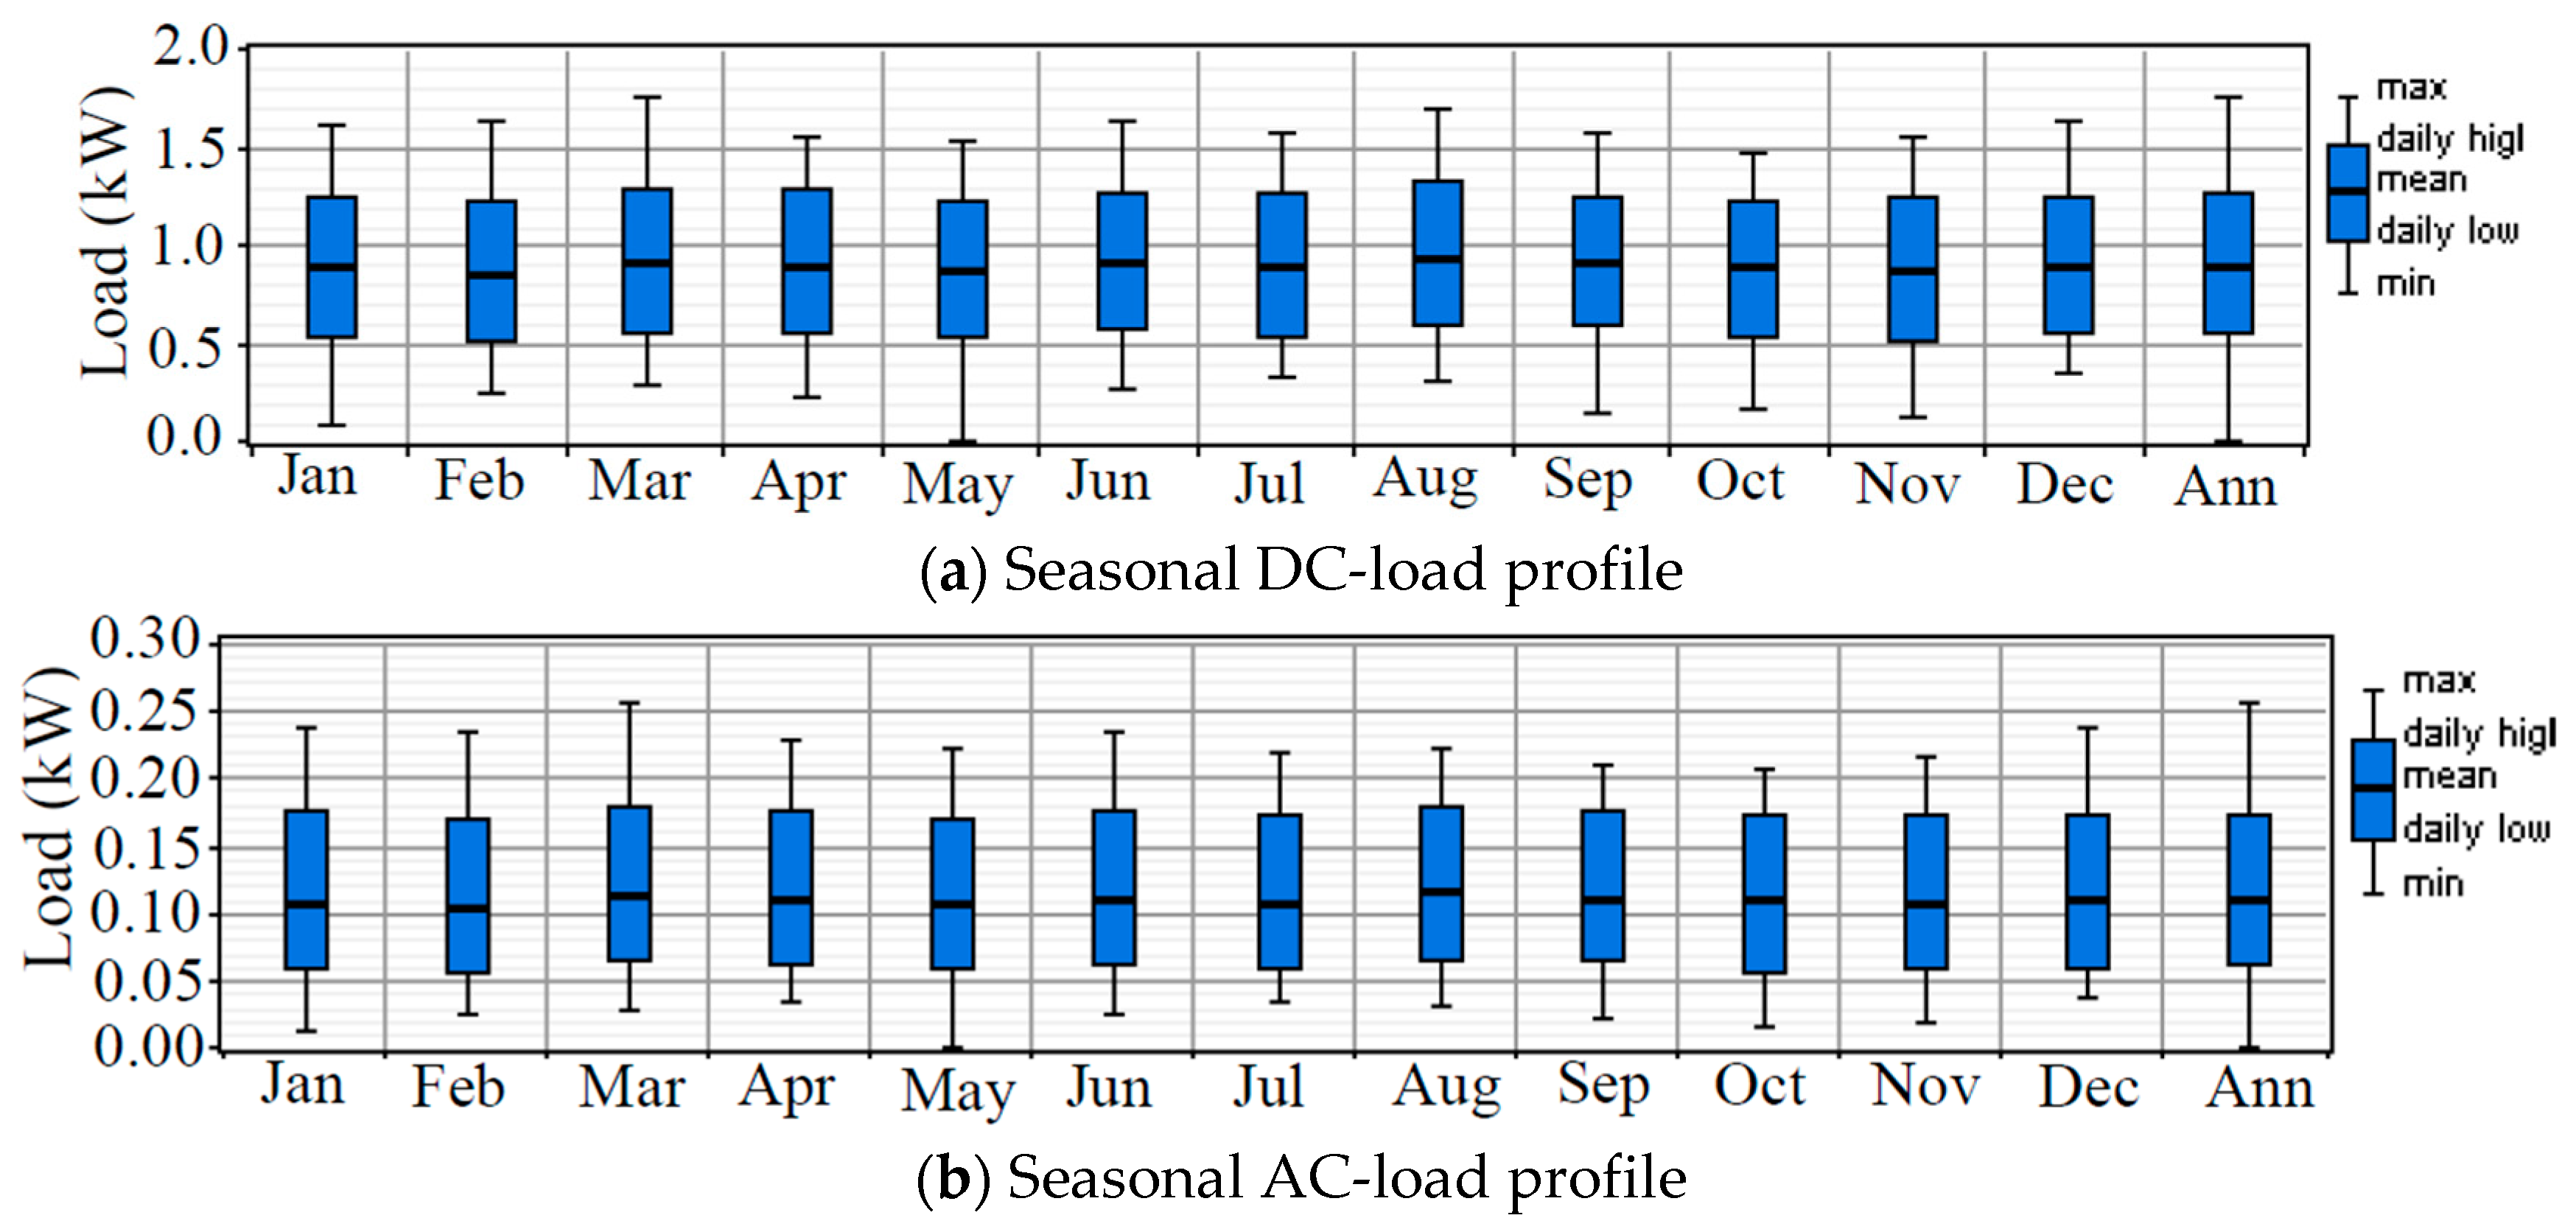
7.1. Load Profile
The LTE-macro base station load is critical for designing a reliable and efficient system. Sizing and modelling of the solar power system depend on the load profile. We used 24-h load values for 365 days for an accurate analysis. The seasonal load profiles for both the DC and AC loads are shown in
Figure 9.
7.2. Characteristics of the Components, Economic Data, and Lifetime of the Project
To develop the optimal solar power system, several values for the system components, operational lifecycle, component efficiency, and costs are considered for efficient performance in the optimisation process. The lifecycle of the project is 10 years, representing the lifetime of the base station equipment [
26]. The South Korea annual real interest rate was 1.25% in June 2016 [
27]. More details about the technical and economic specifications of the system components are listed in
Table 2.
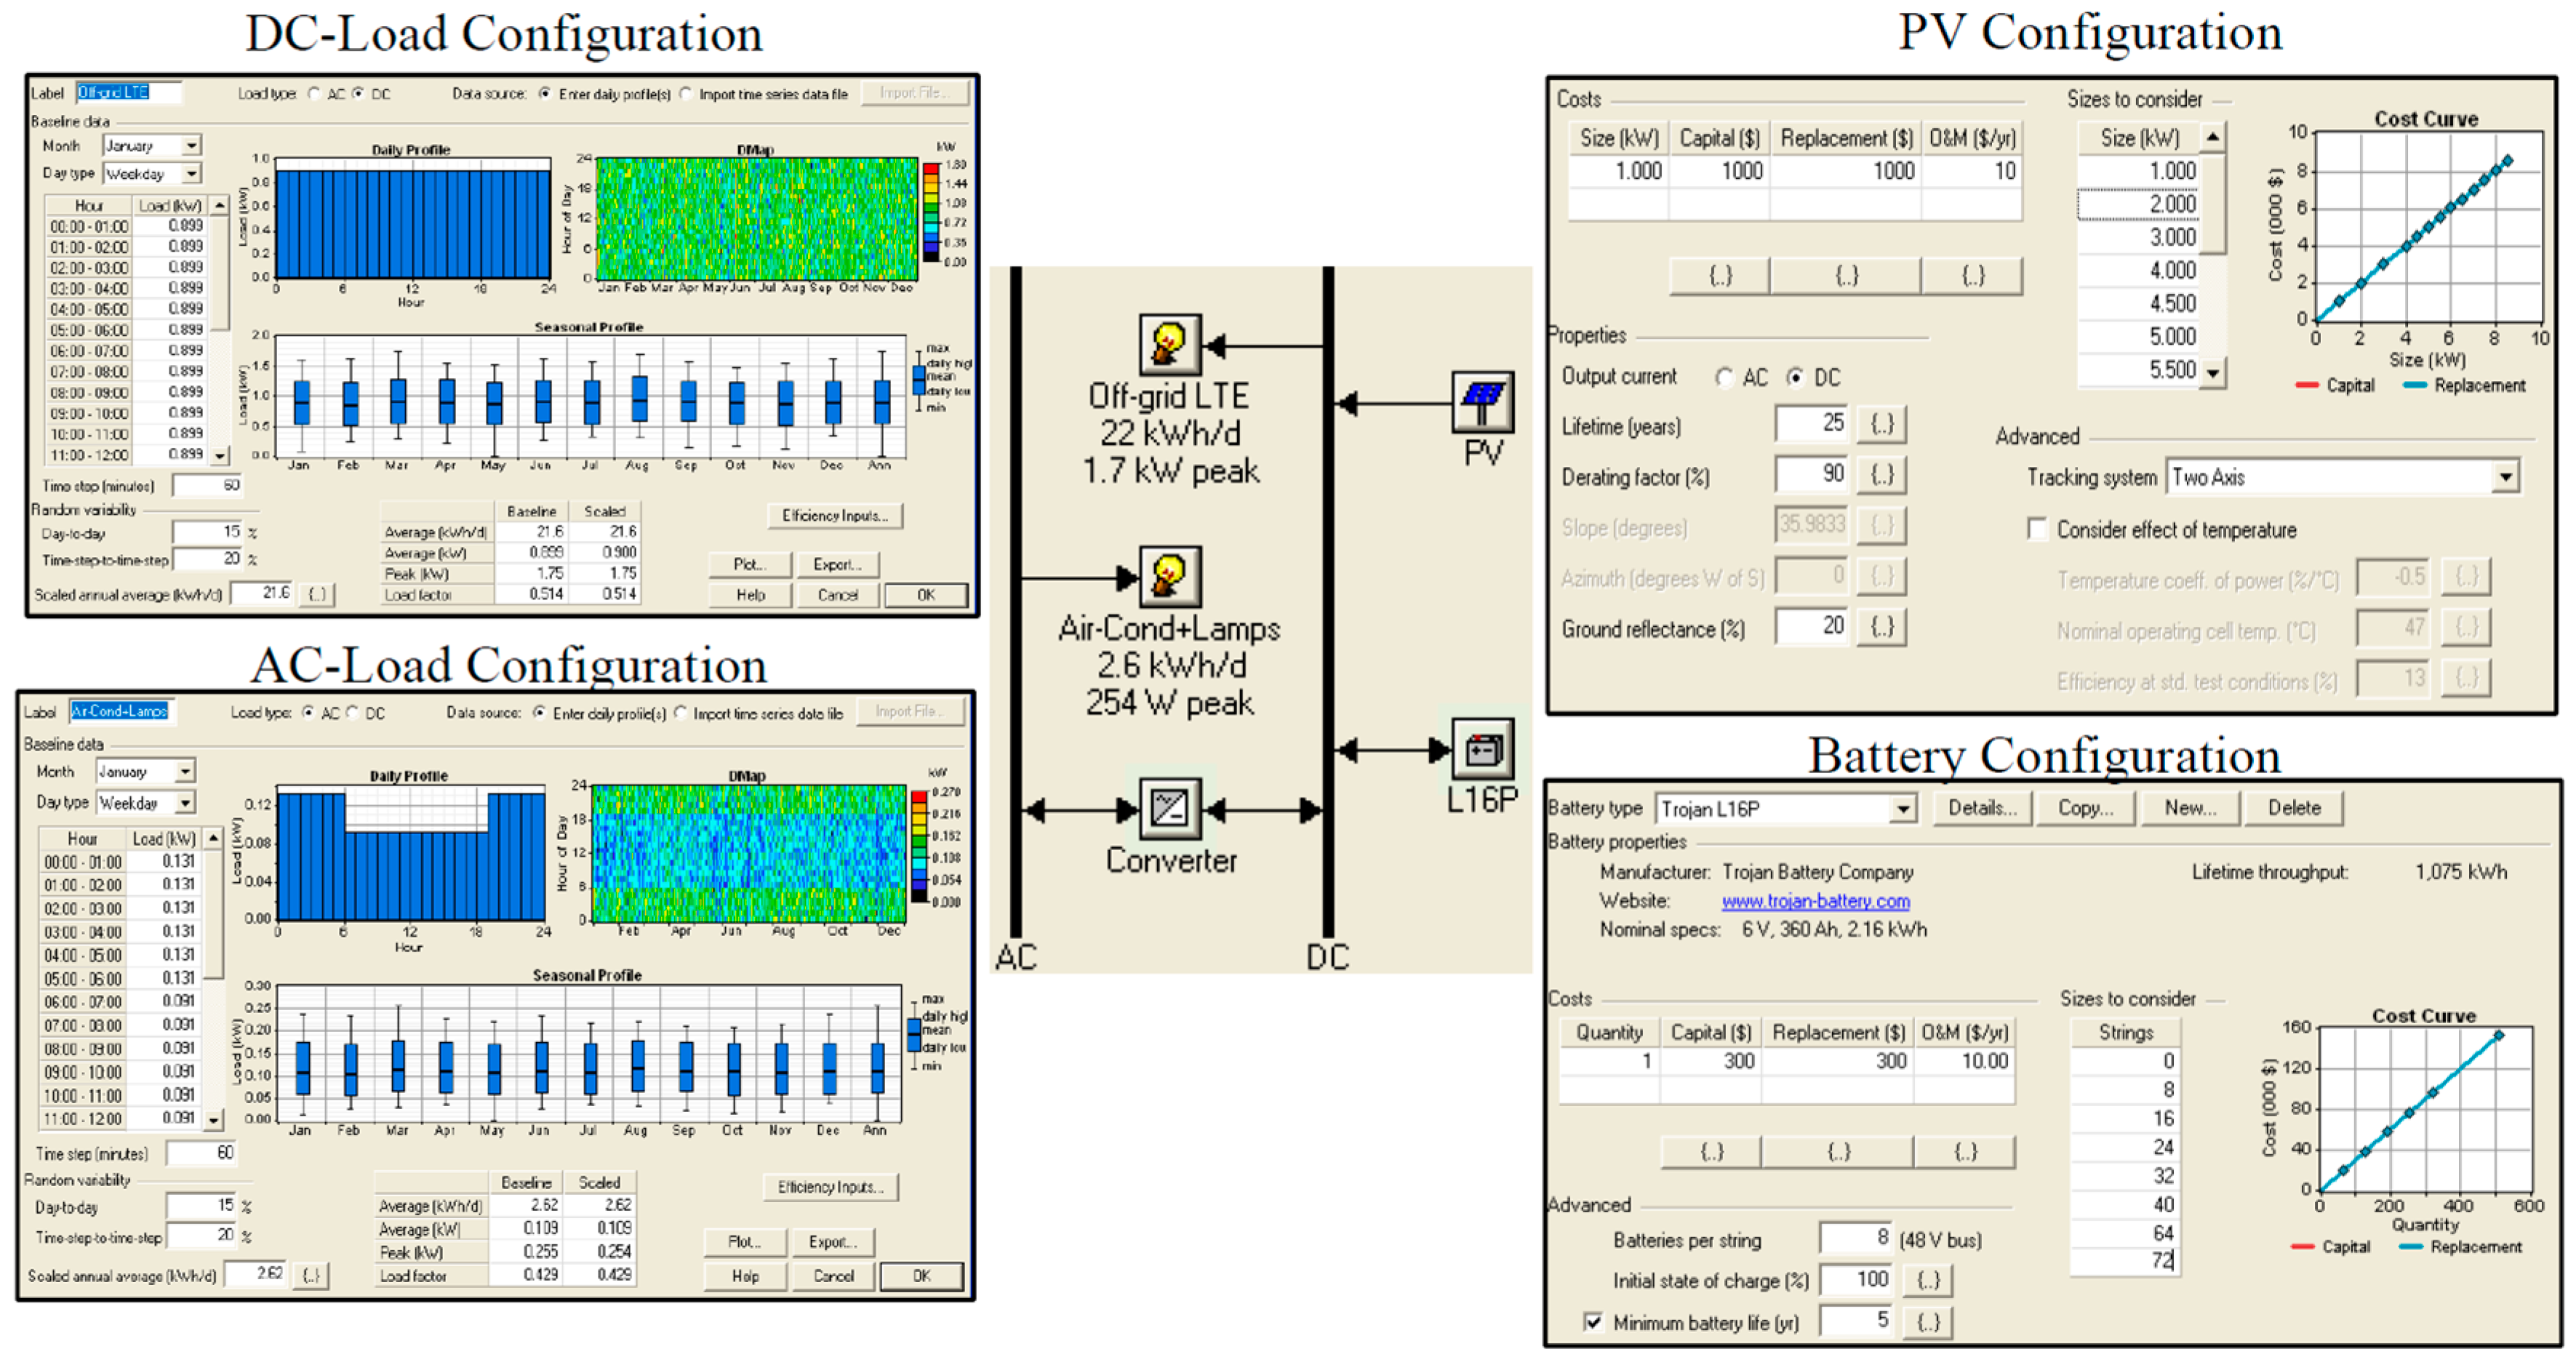
7.3. System Implementation
The implementation of a stand-alone solar power system within the HOMER simulation software and the configurations for the various elements in the system are shown in
Figure 10.
8. Optimisation and Simulation Results
In this study, different average daily solar radiation values of 4.0, 4.5, 4.6, 4.7, 4.8, 4.9, and 5.0 kWh·m−2 are considered to cover a wide range of South Korean locations. The optimal system architecture, output energy production, technical criteria to implement the proposed solar power system, and cash flow analysis are presented in the following subsections.
8.1. Optimal System Architecture
A summary of both of the optimum size of the components and the costs of the solar power system, identified by the HOMER simulation based on the different daily radiation values, are presented in
Table 3.
In general, the optimal size of the solar array decreases with increasing solar radiation. However, in some cases, such as 4.6–4.8 kWh·m
−2, the size of the solar array is the same, but the energy output of the solar array is different, as discussed in detail in
Section 8.2 “Energy Yield Analysis”.
IC is the construction cost of the proposed solar power system, which is paid at the beginning of the project and depends on the components included in the solar power system. The O&M costs are the annually costs to operate and maintain the system components.
Table 3 shows that both the IC and O&M costs decrease with increasing solar radiation because the size of the solar array decreases. The decrease in both IC and O&M results in an overall decrease in the total cost of the solar power system (NPC). More details are provided in
Section 8.4, “Economic Analysis.”
8.2. Energy Yield Analysis
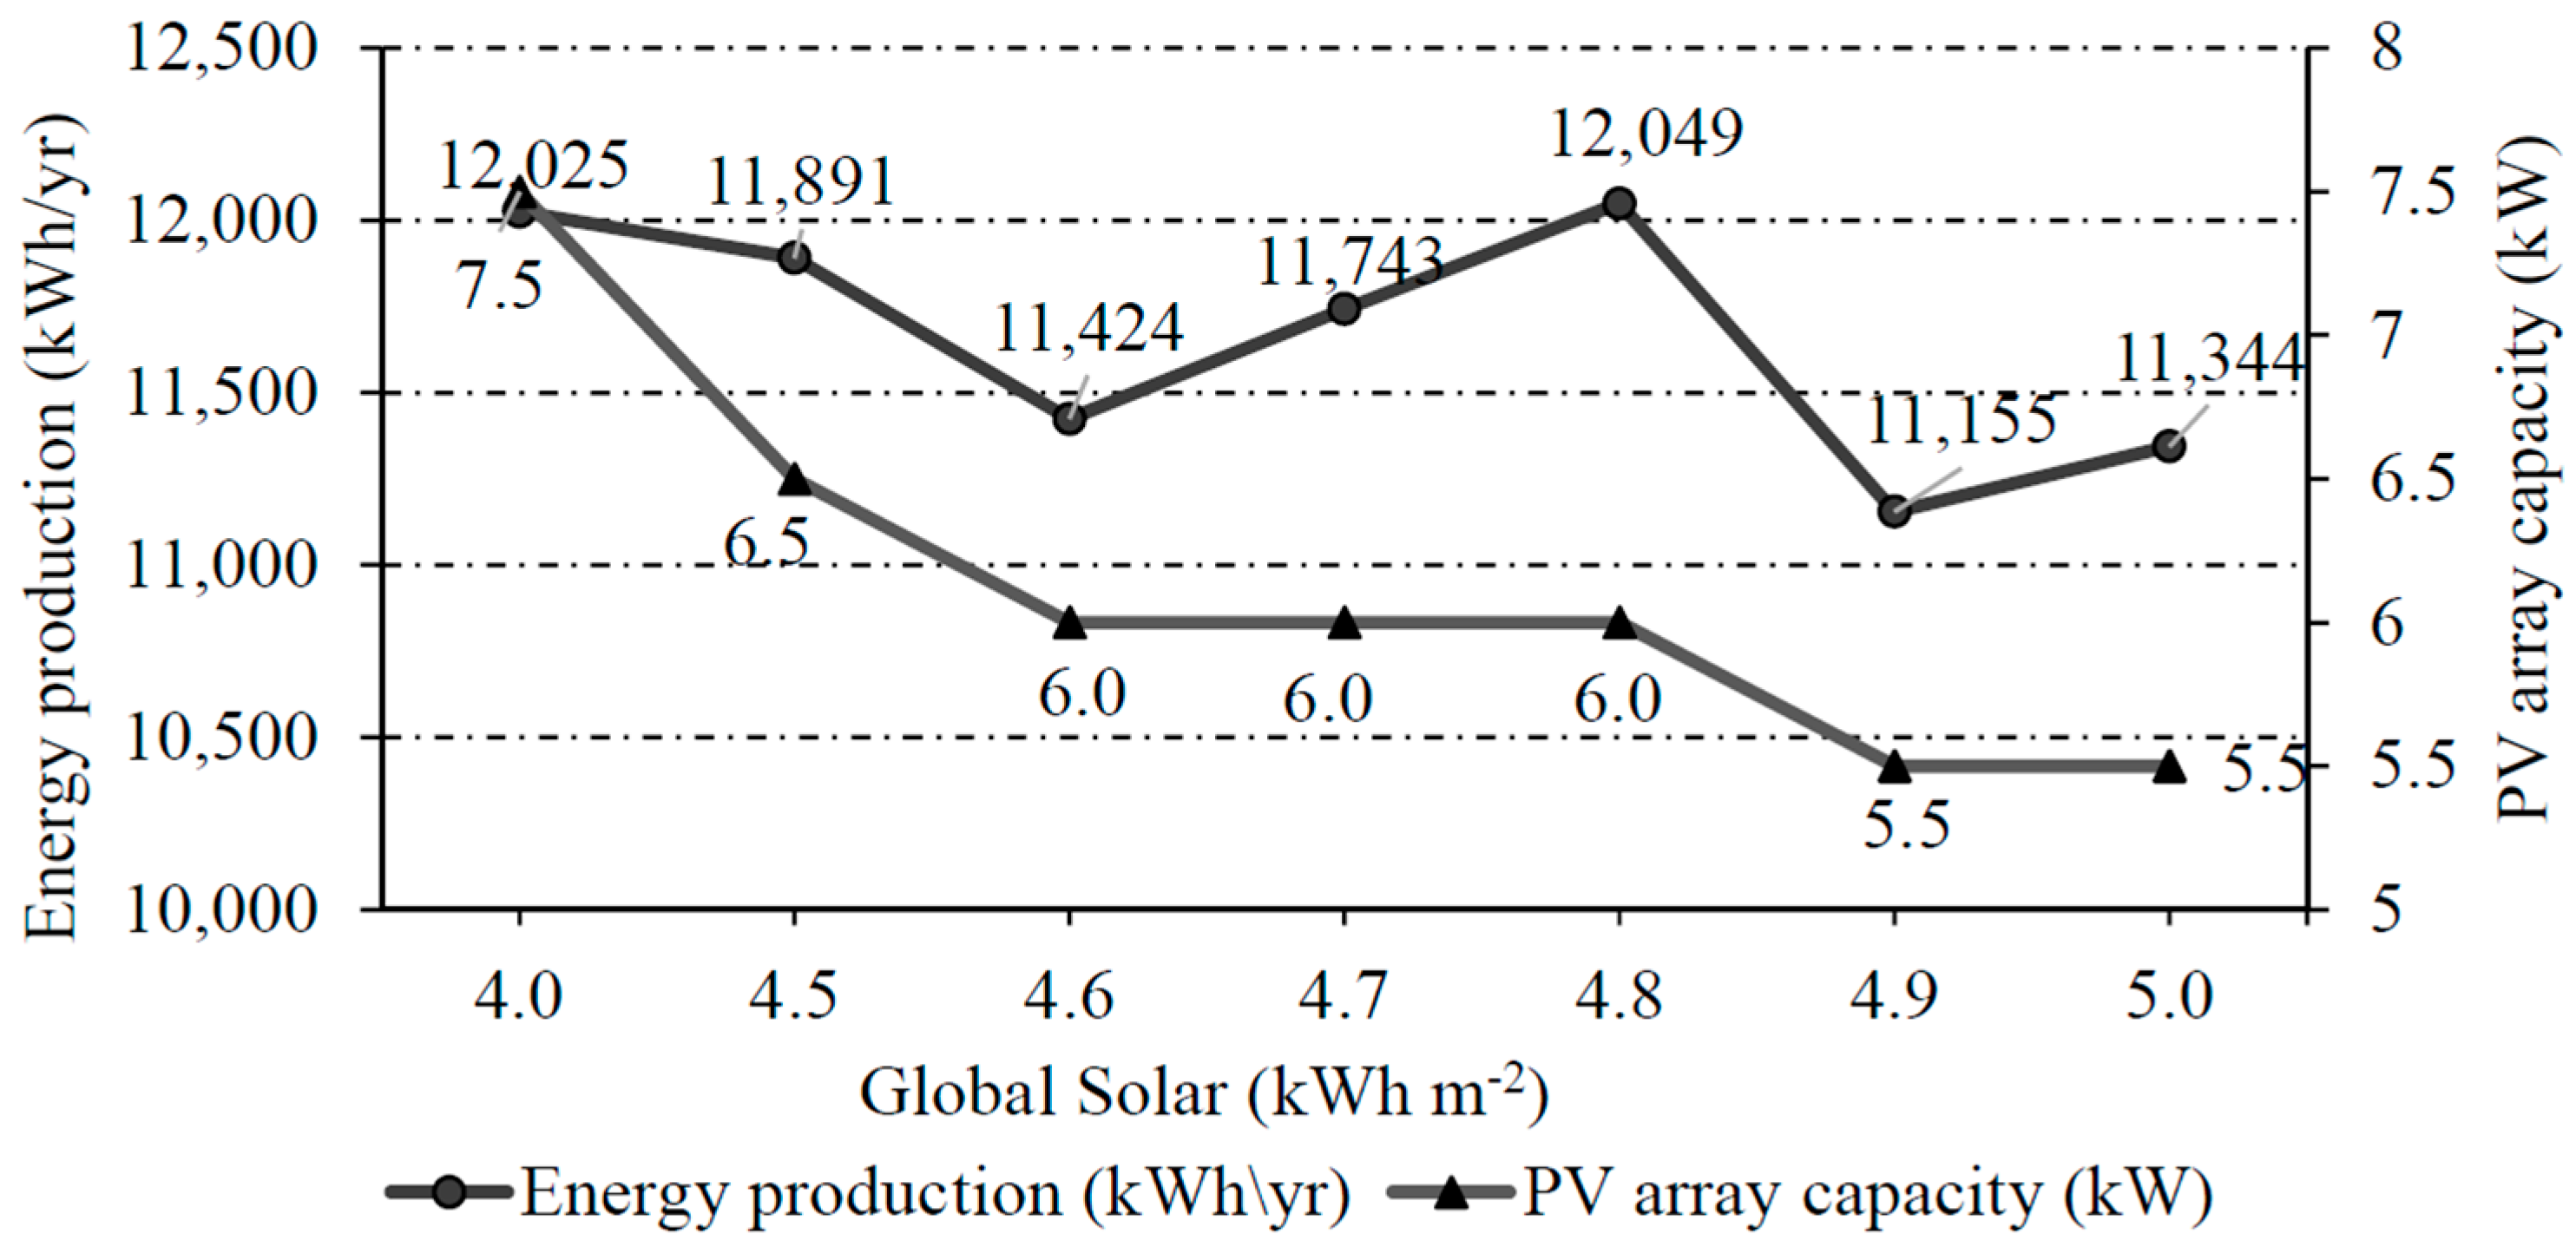
Figure 11 shows the annual output energy of the solar power system for different cases of solar radiation. The annual output energy of the solar power system increases with increasing solar radiation at a given PV size.
The following discussion is based on the average daily solar radiation for South Korea of 4.0 kWh·m−2 as a case study. However, the analysis can be extended to include other cases of solar radiation with slight differences in daily peak sun hours per case.
Based on Equation (2), the annual output energy of the solar power system is 9855 kWh (7.5 kW PV capacity × 4.01 h peak solar hours × 0.9 PV derating factor × 365 day/year). The dual tracking mode is used in this study, which increases the annual output energy to 12,025 kWh.
The total annual output energy of the solar power system is 12,025 kWh, while the LTE-macro base station requires 8840 kWh: AC load (air conditioner 91 W + lamps 40 W (operation from 7 p.m. to 7 a.m.) plus the DC load (base station 819 W + microwave link 80 W) multiplied by (24 h × 365 days/year). The difference between the annual output energy of the PV array and the annual energy required by the LTE-macro base station is: 2285 kWh/year excess electricity + 850 kWh/year battery losses + 50 kWh/year inverter losses.
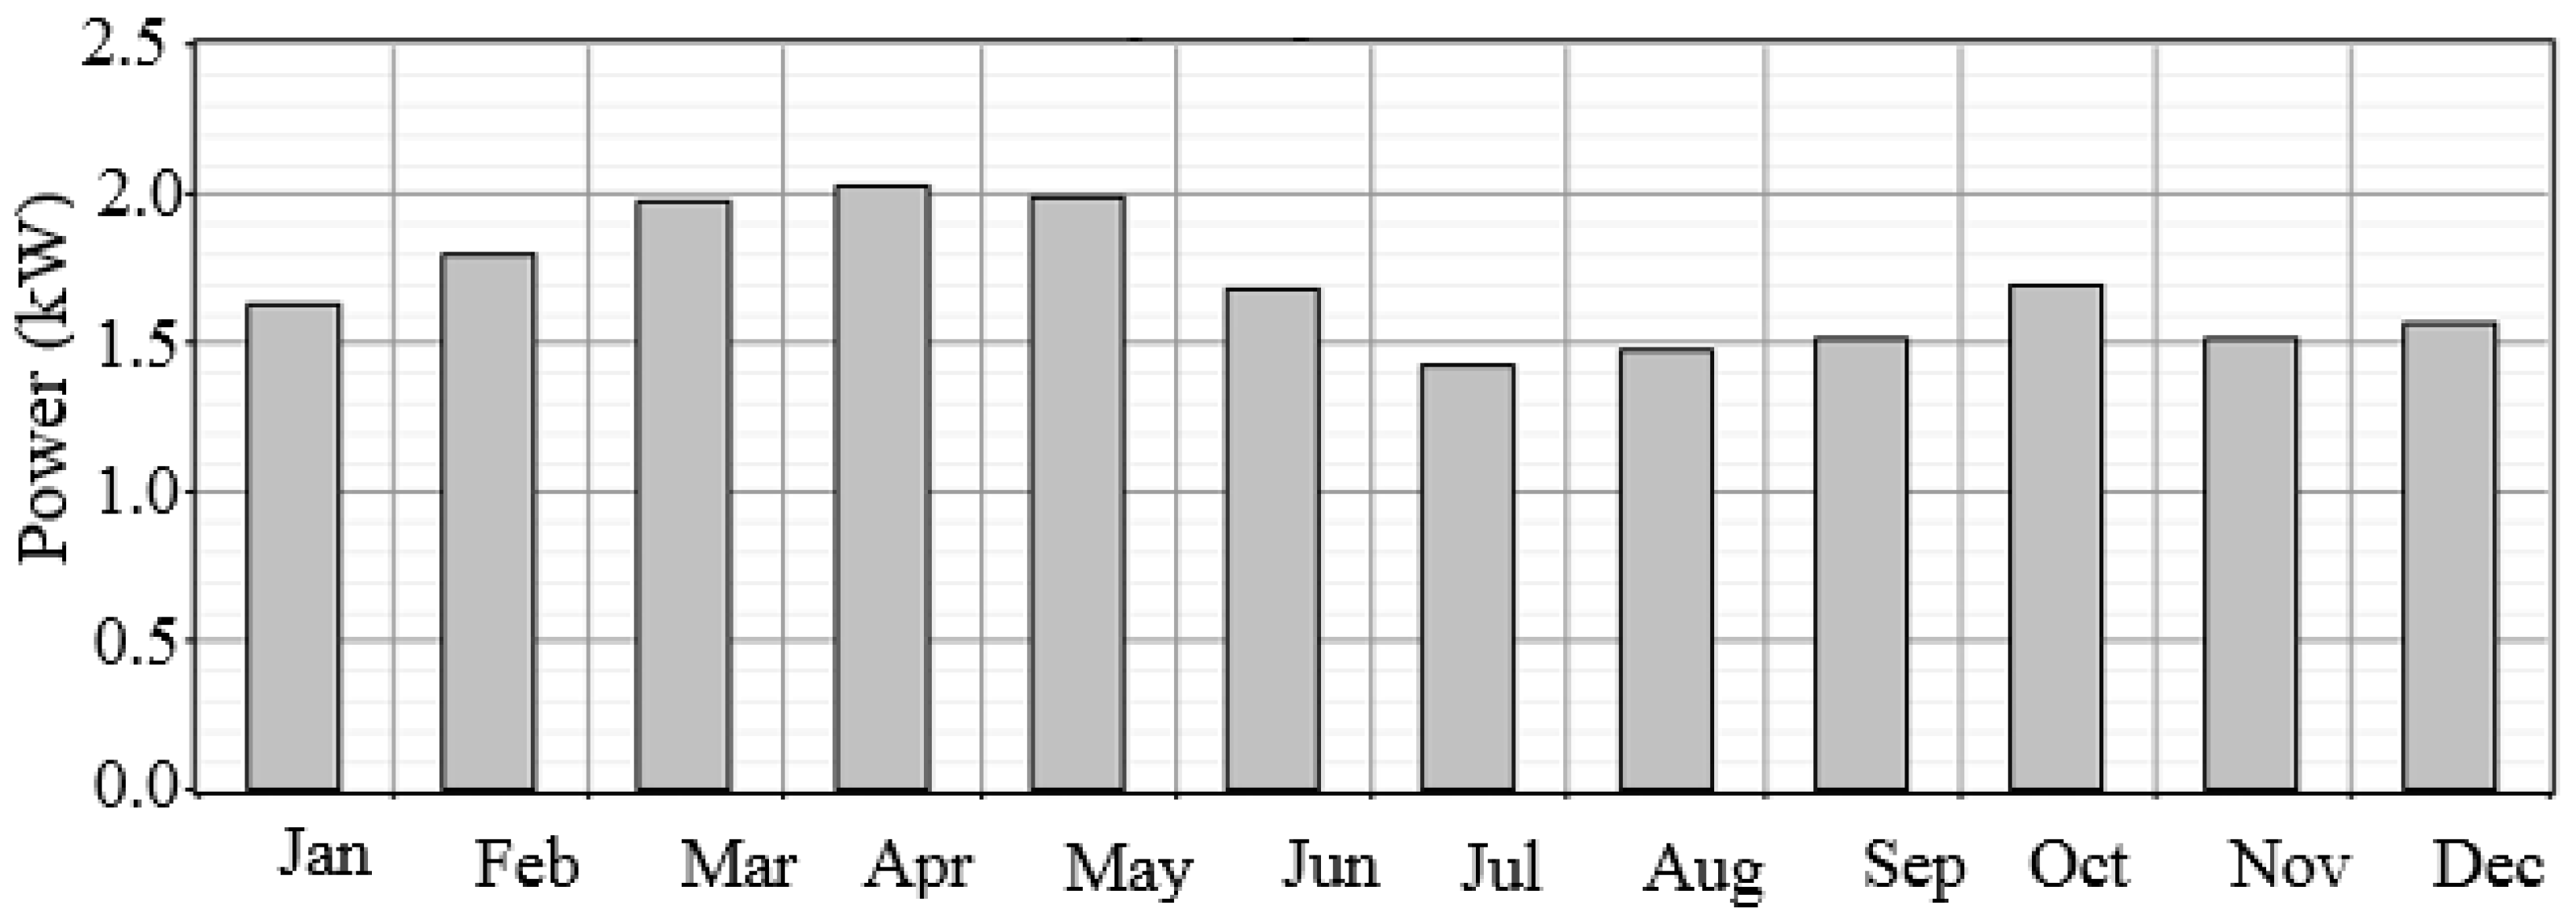
Figure 12 shows the monthly power production. The maximum output power occurs in April and May, while the minimum output power occurs in November and December.
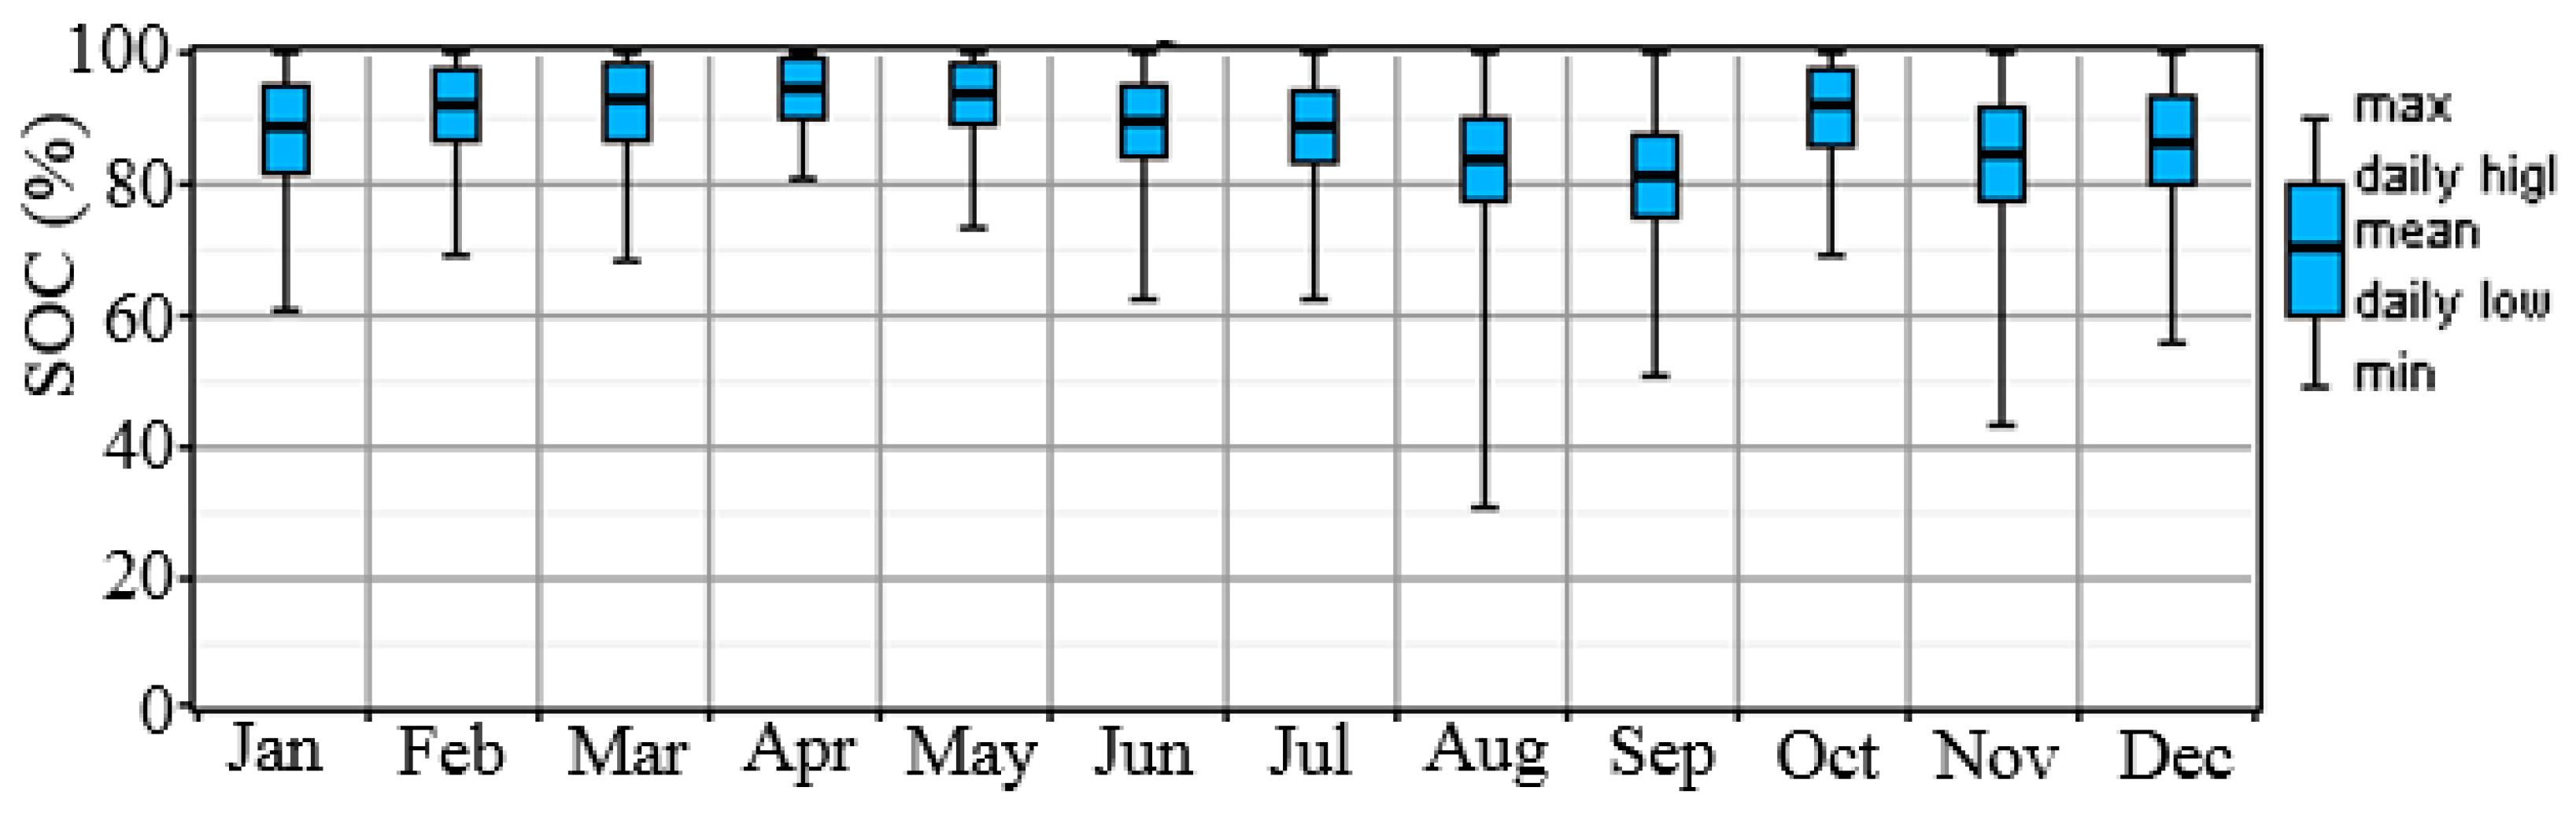
The total number of batteries is 64. The annual energy-in rate of 5997 kWh, multiplied by the efficiency of 85%, gives an annual energy-out rate of 5098 kWh. In addition, the amount of time that the battery bank can autonomously supply the LTE-macro base station is 3 days and 23.9 h, which is computed based on Equation (4) (64 batteries × 6 V nominal voltage × 360 Ah nominal capacity × DOD 0.7 × 24 h) divided by (daily average LTE-macro base station power requirement of 24.22 kWh). The total battery autonomy divided by the total number of batteries gives the autonomy for one battery, which is 1.5 h. Moreover, the expected battery life is 10 years, as computed by Equation (5). The seasonal statistics of the maximum and minimum state of charge for the battery are given in
Figure 13.
The inverter annual energy-in rate is 1005 kWh which, when multiplied by the efficiency of 95%, gives an annual energy-out rate of 955 kWh, with 8759 h/year operation (operating hours 24 h × 365 day/year). The monthly statistics of the output power for the inverter are shown in
Figure 14.
8.3. Technical Criteria
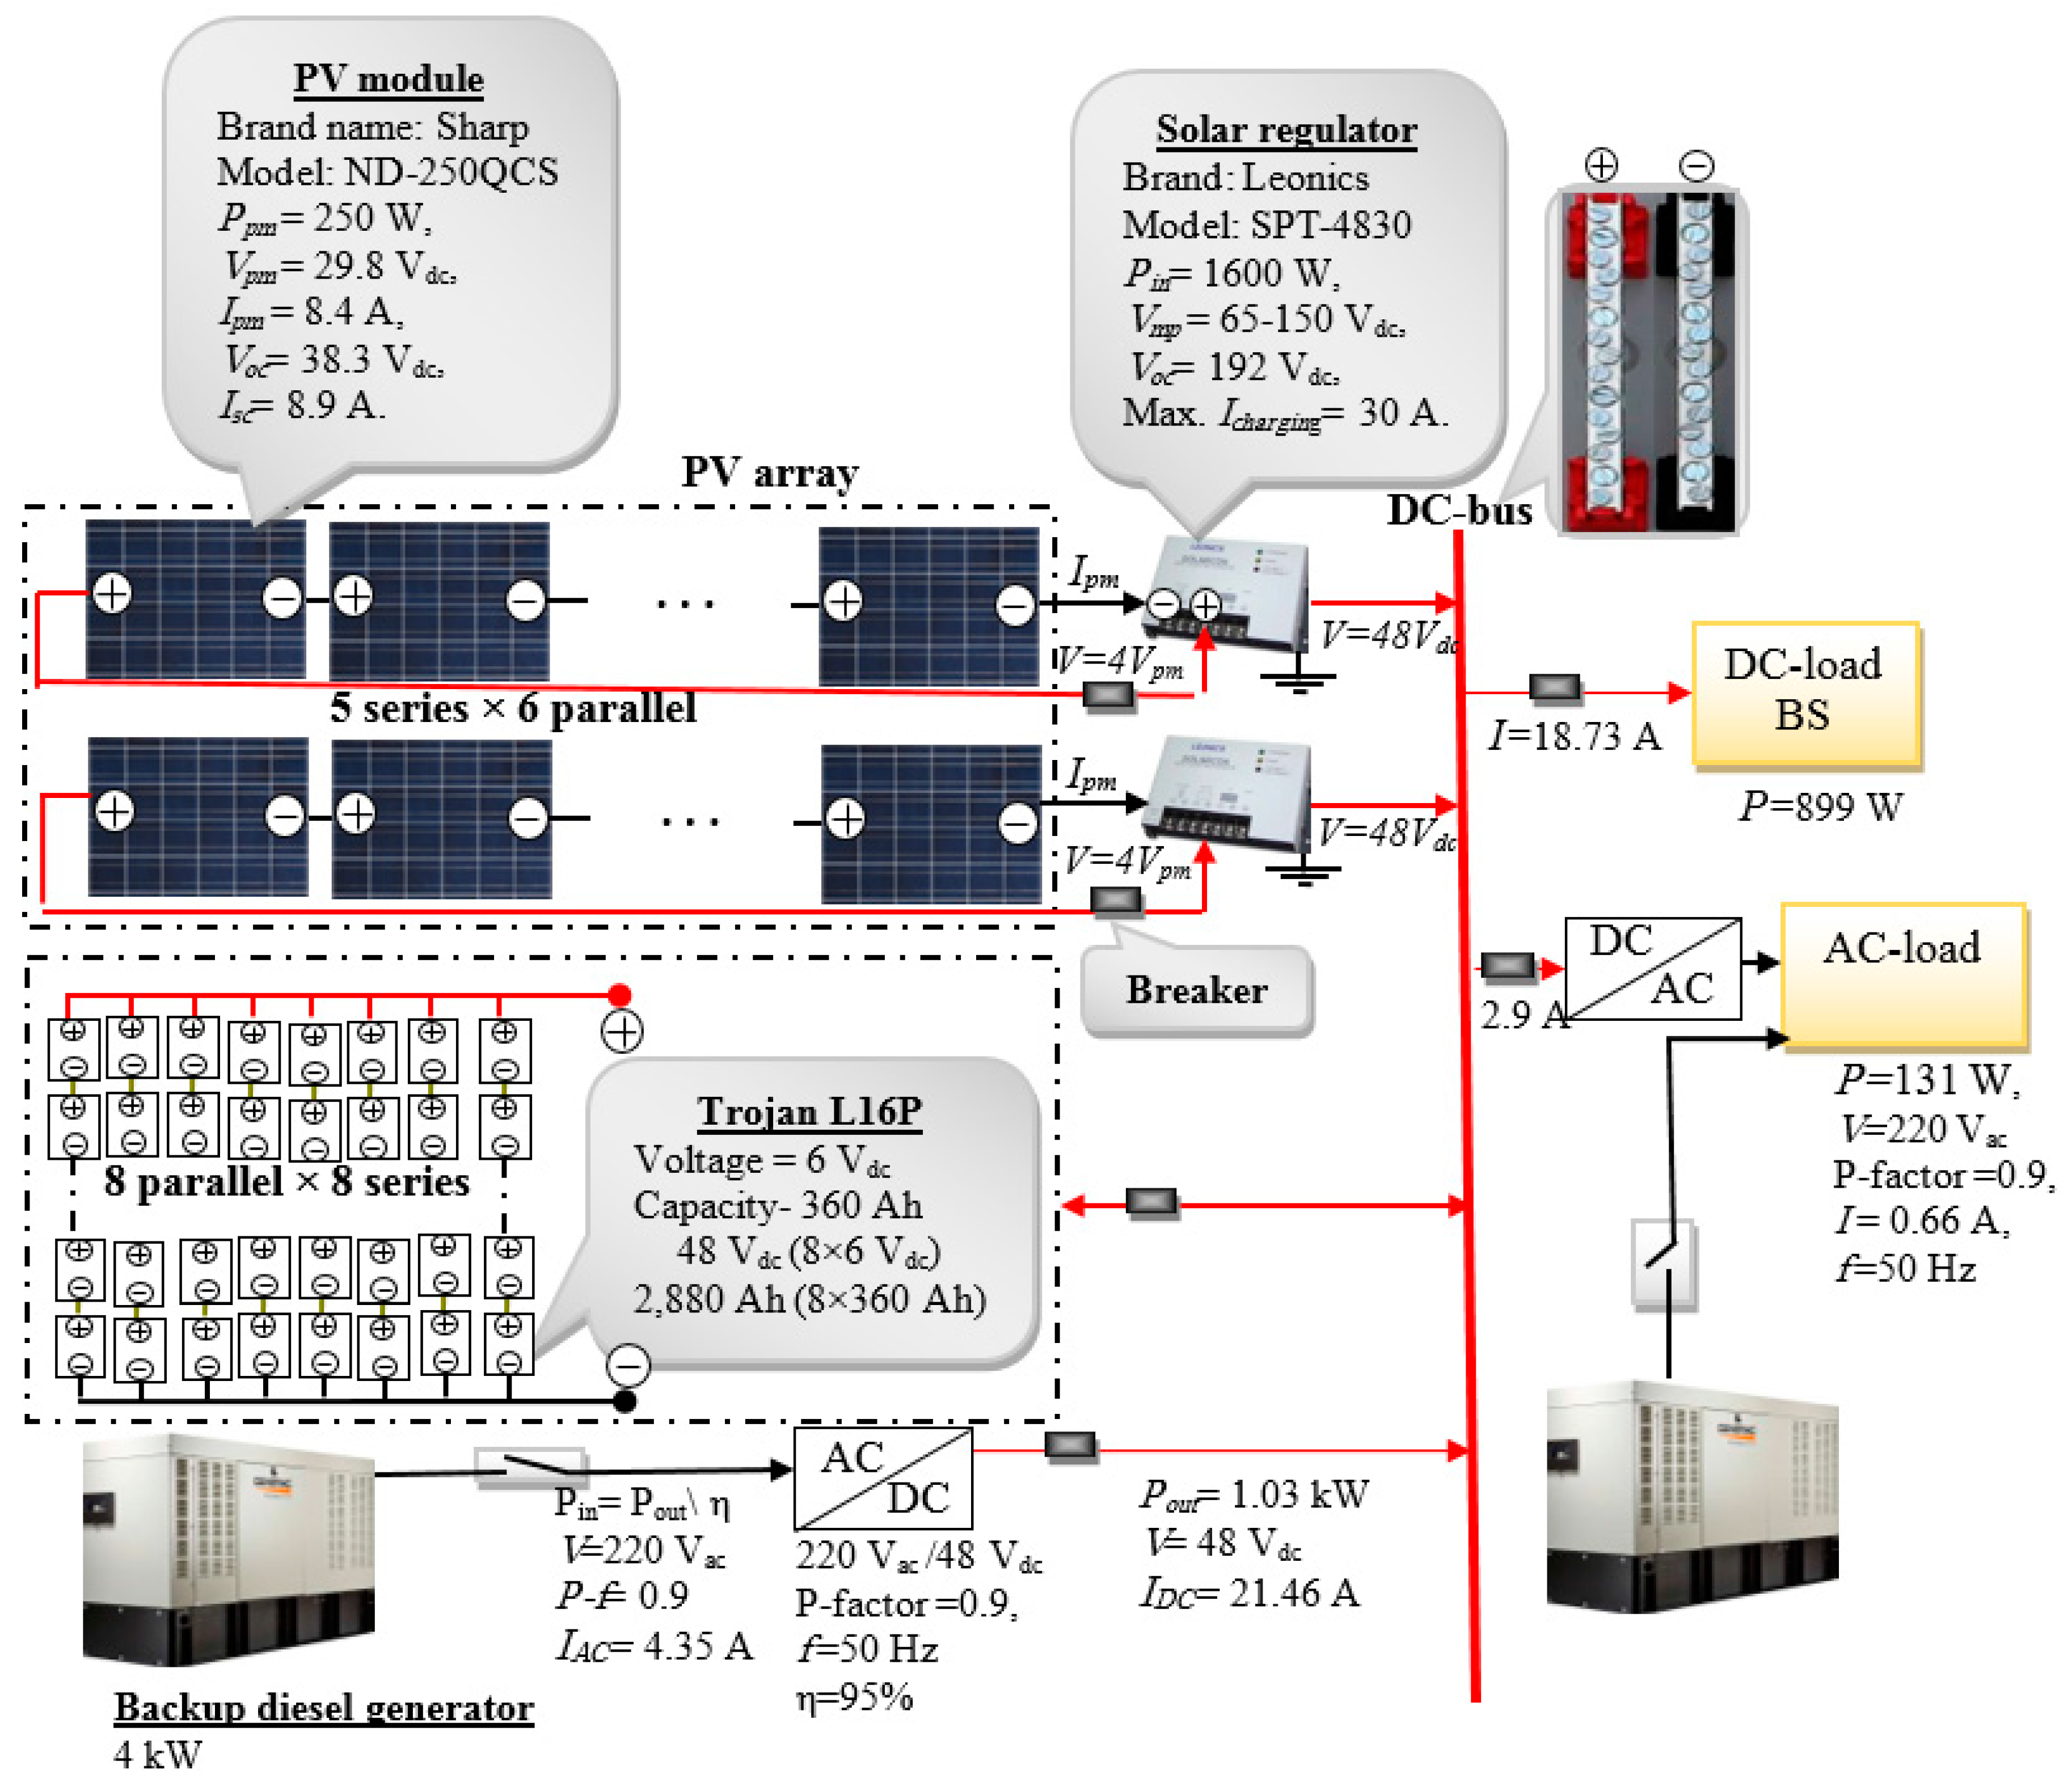
The schematic diagram of the proposed solar energy system for feeding the LTE-macro base station is presented in
Figure 15.
The capacity of the PV array is 7.5 kW. The
Sharp ND-250QCs module (polycrystalline), with a voltage of 29.80 V
dc, current of 8.40 A, and power of 250 W is a good choice [
28]. The PV array consists of 30
Sharp ND-250QCs modules, connected as five in a series and six in parallel to satisfy the requirements of the solar control regulator,
solarcon SPT-4830 [
29]: (i) the open circuit voltage for an solar control regulator (192 V
dc) should be higher than the open circuit voltage of a PV array (5 PV modules in series × open circuit voltage of a
Sharp ND-250QCs module 38.3 V
dc); and (ii) the current of the solar control regulator (30 A) should be higher than the short circuit current of a PV array (short circuit current of a
Sharp ND-250QCs module 8.90 A × 1.3 safety factor).
Since the capacity of the PV array is 7.5 kW and the capacity of the solar control regulator (solarcon SPT-4830) is 1.6 kW, five solar control regulators are needed. The solar control regulators adapt the output voltage of the PV array from 149 Vdc (5 PV modules in series × voltage of a Sharp ND-250QCs module 29.80 Vdc) to 48 Vdc, which is suitable for the DC bus-bar and battery bank. Herein, the DC bus-bar equals 48 Vdc, which is the input DC voltage to the LTE-macro base station.
The optimal number of batteries is 64. Since the single battery voltage is 6 Vdc, in order for the battery bank be compatible with the input DC voltage of the bus-bar (48 Vdc), the batteries are connected eight in a series and eight in parallel. The SU200P inverter, with a specification of 200 W, input voltage of 12/24/48 Vdc, output voltage of 220/110 Vac, and frequency of 50 Hz/60 Hz, is a good choice of inverter.
The system is designed to operate independently of the diesel generator (as discussed in
Section 4). However, the diesel generator feeds the base station during maintenance and when the base station demand is higher than the PV array power output or the maximum battery DOD is reached. The required backup diesel generator is approximately 4 kW, which is computed as (LTE-macro base station, AC and DC load 1.1 kW)/(diesel generator efficiency 30% [
2] × converter efficiency 95%). The AC loads are fed directly from the diesel generator in the case of a solar power system failure, and the DC load feed occurs via a converter (AC/DC). The required converter is 1.2 kW, which is computed as (the maximum LTE-macro base station DC load 899 W/converter efficiency 95%) multiplied by a 1.25 safety factor.
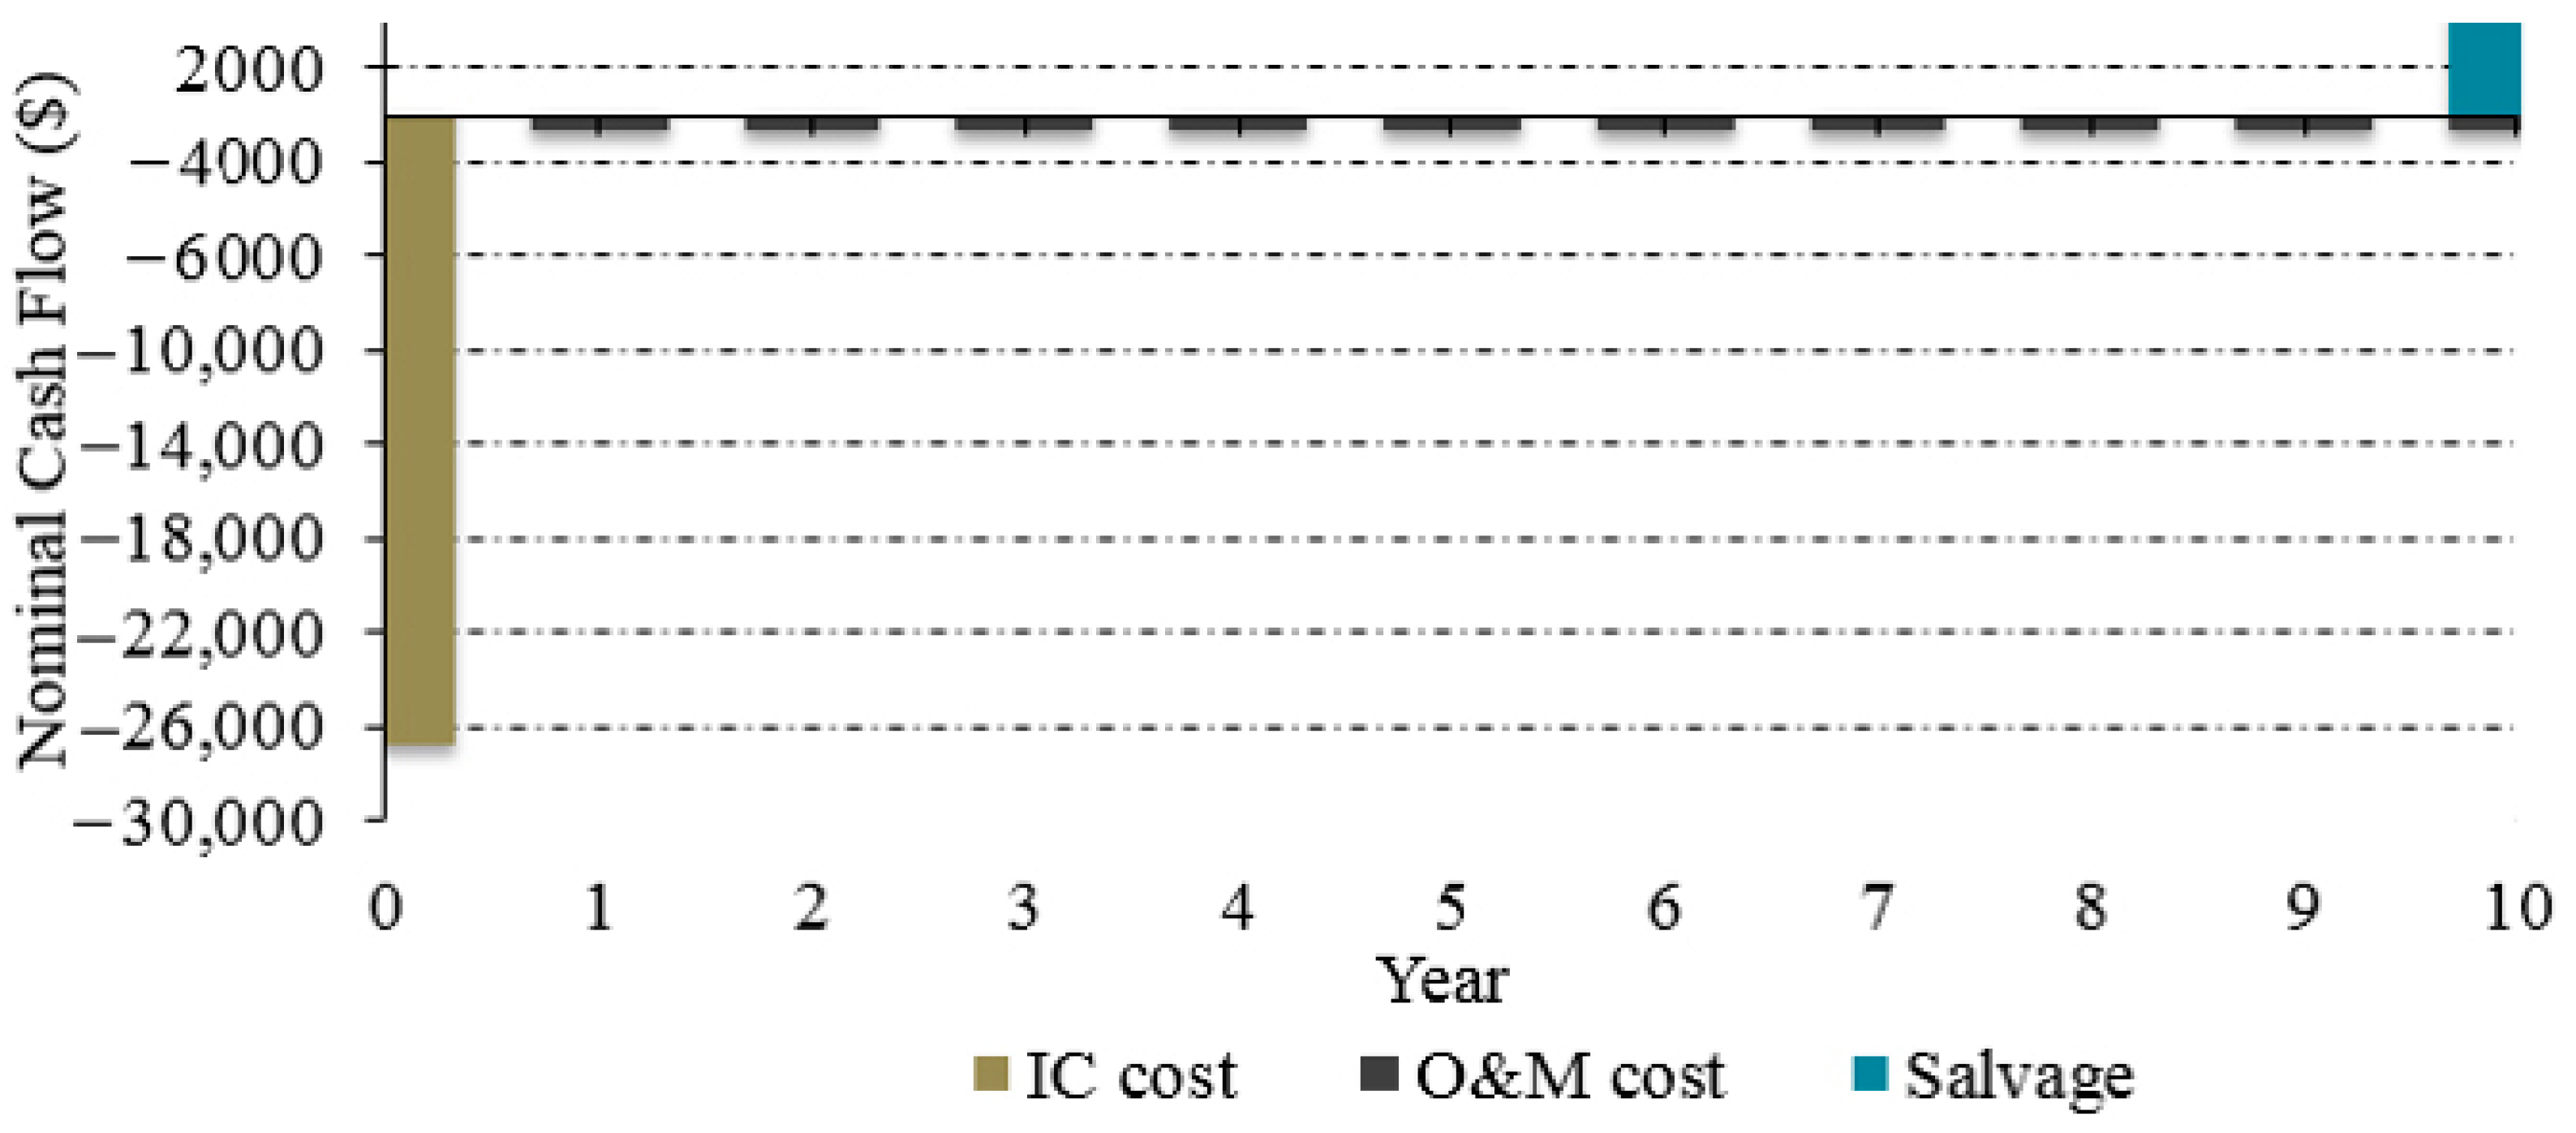
8.4. Economic Analysis
The setup cost of the solar power system proposed in this study, based on the characteristics of South Korean solar radiation exposure (4.0 kWh·m
−2), is shown in
Figure 16. The breakdown for the IC, replacement, O&M and salvage costs incurred within the project lifetime is given in the following paragraphs.
(i) The
initial cost for each element of the solar power system is listed in
Table 2. In addition, the total initial cost to set up a solar power system is $26,780, as shown in
Table 3. The total initial cost details is as follows:
- a)
The PV costs $7500 (PV size kW × initial cost $/kW).
- b)
The battery bank costs $19,200 (battery units × cost $/unit).
- c)
The inverter costs $80 (inverter size kW × cost $/kW).
(ii)
Table 2 shows the annual cost for the
maintenance and operation of different components of the solar power system.
Table 3 shows that the total annual maintenance and operation cost is $717, and the details are as follows:
- a)
The PV costs $75 (PV size kW × O&M cost $/kW).
- b)
The battery bank costs $640 (battery units × O&M cost $/unit).
- c)
The inverter costs $2 (0.2 kW × cost $10/1 kW).
The largest part of the initial capital and maintenance and operation costs is the battery bank. However, these costs can be reduced if the number of batteries is decreased, but an important issue to consider is the battery bank autonomy, which will decrease if the total number of batteries is decreased.
(iii) The replacement cost is zero because the lifetimes of the PV array and inverter are longer than the project lifecycle. In addition, the battery bank lifetime is 10 years, which equals the project lifecycle.
(iv) The
salvage value is computed at the end of the project lifetime and typically applies to components that have longer lifetimes than the project lifecycle. Herein, both the PV and inverter have longer lifetimes, as shown in
Table 2. The total salvage value of the proposed solar power system is $4527, which is computed based on Equation (9). The details are as follows:
- a)
The PV cost $4500 ($7500 × ),
- b)
The inverter cost $27 ($80 × ).
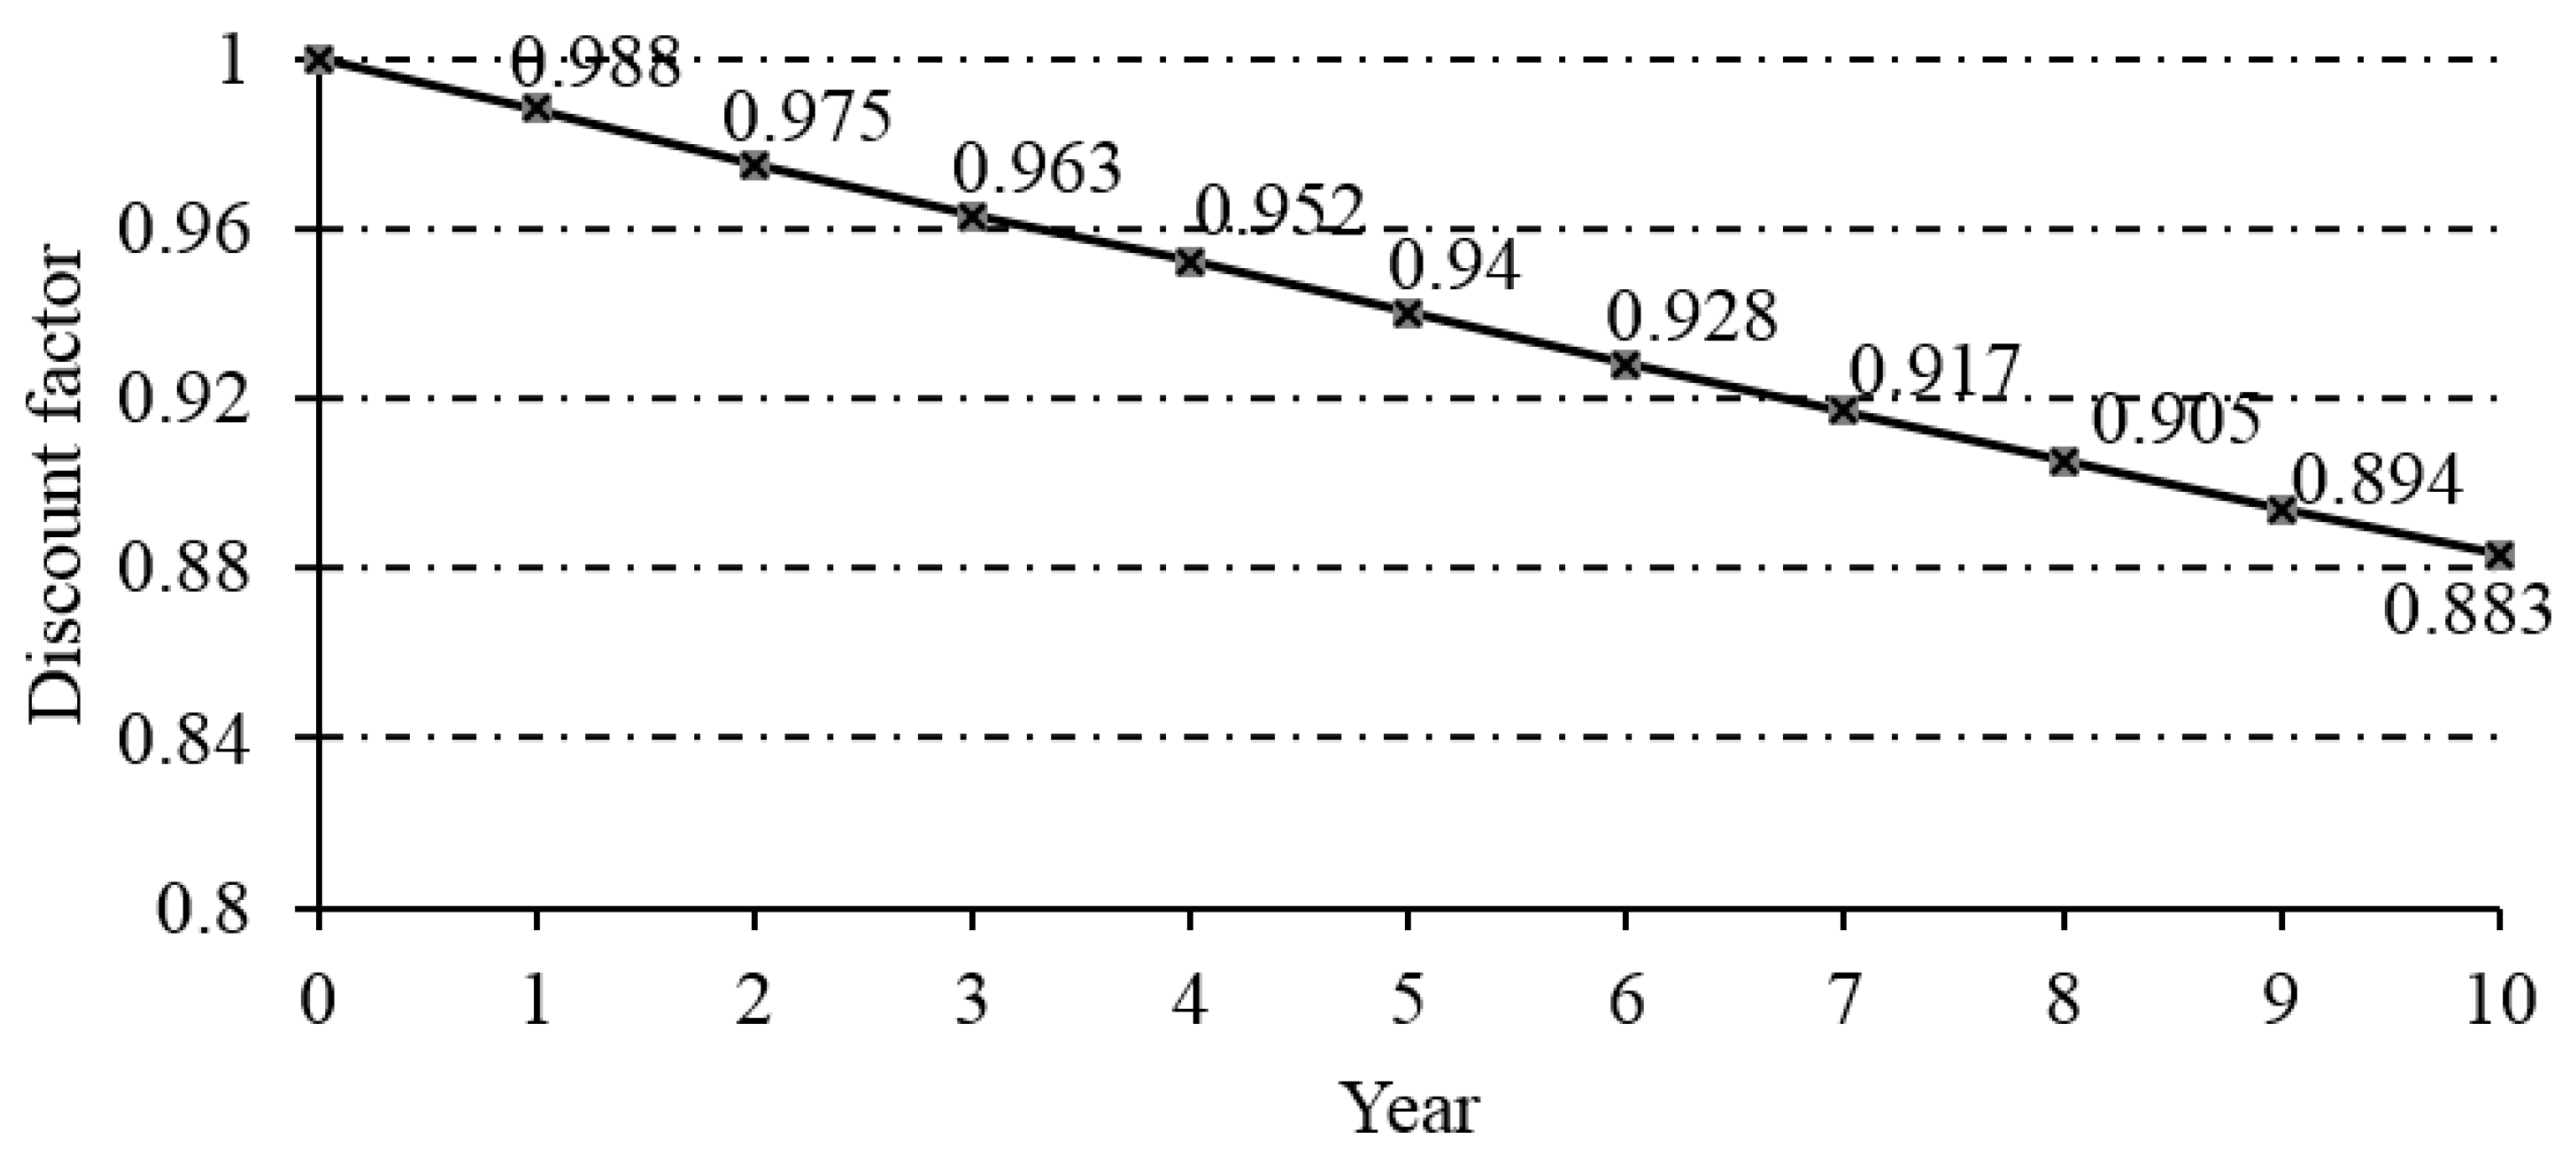
The above economic analysis is based on a nominal system. However, according to Equation (8),
Figure 17 shows the yearly discount factor during the project lifecycle.
The total NPC is calculated by summing the total discounted cash flows in each year of the project lifetime, as follows: initial capital cost $26,780 + O&M costs $6701 – salvage value $3998, which equals $29,483.
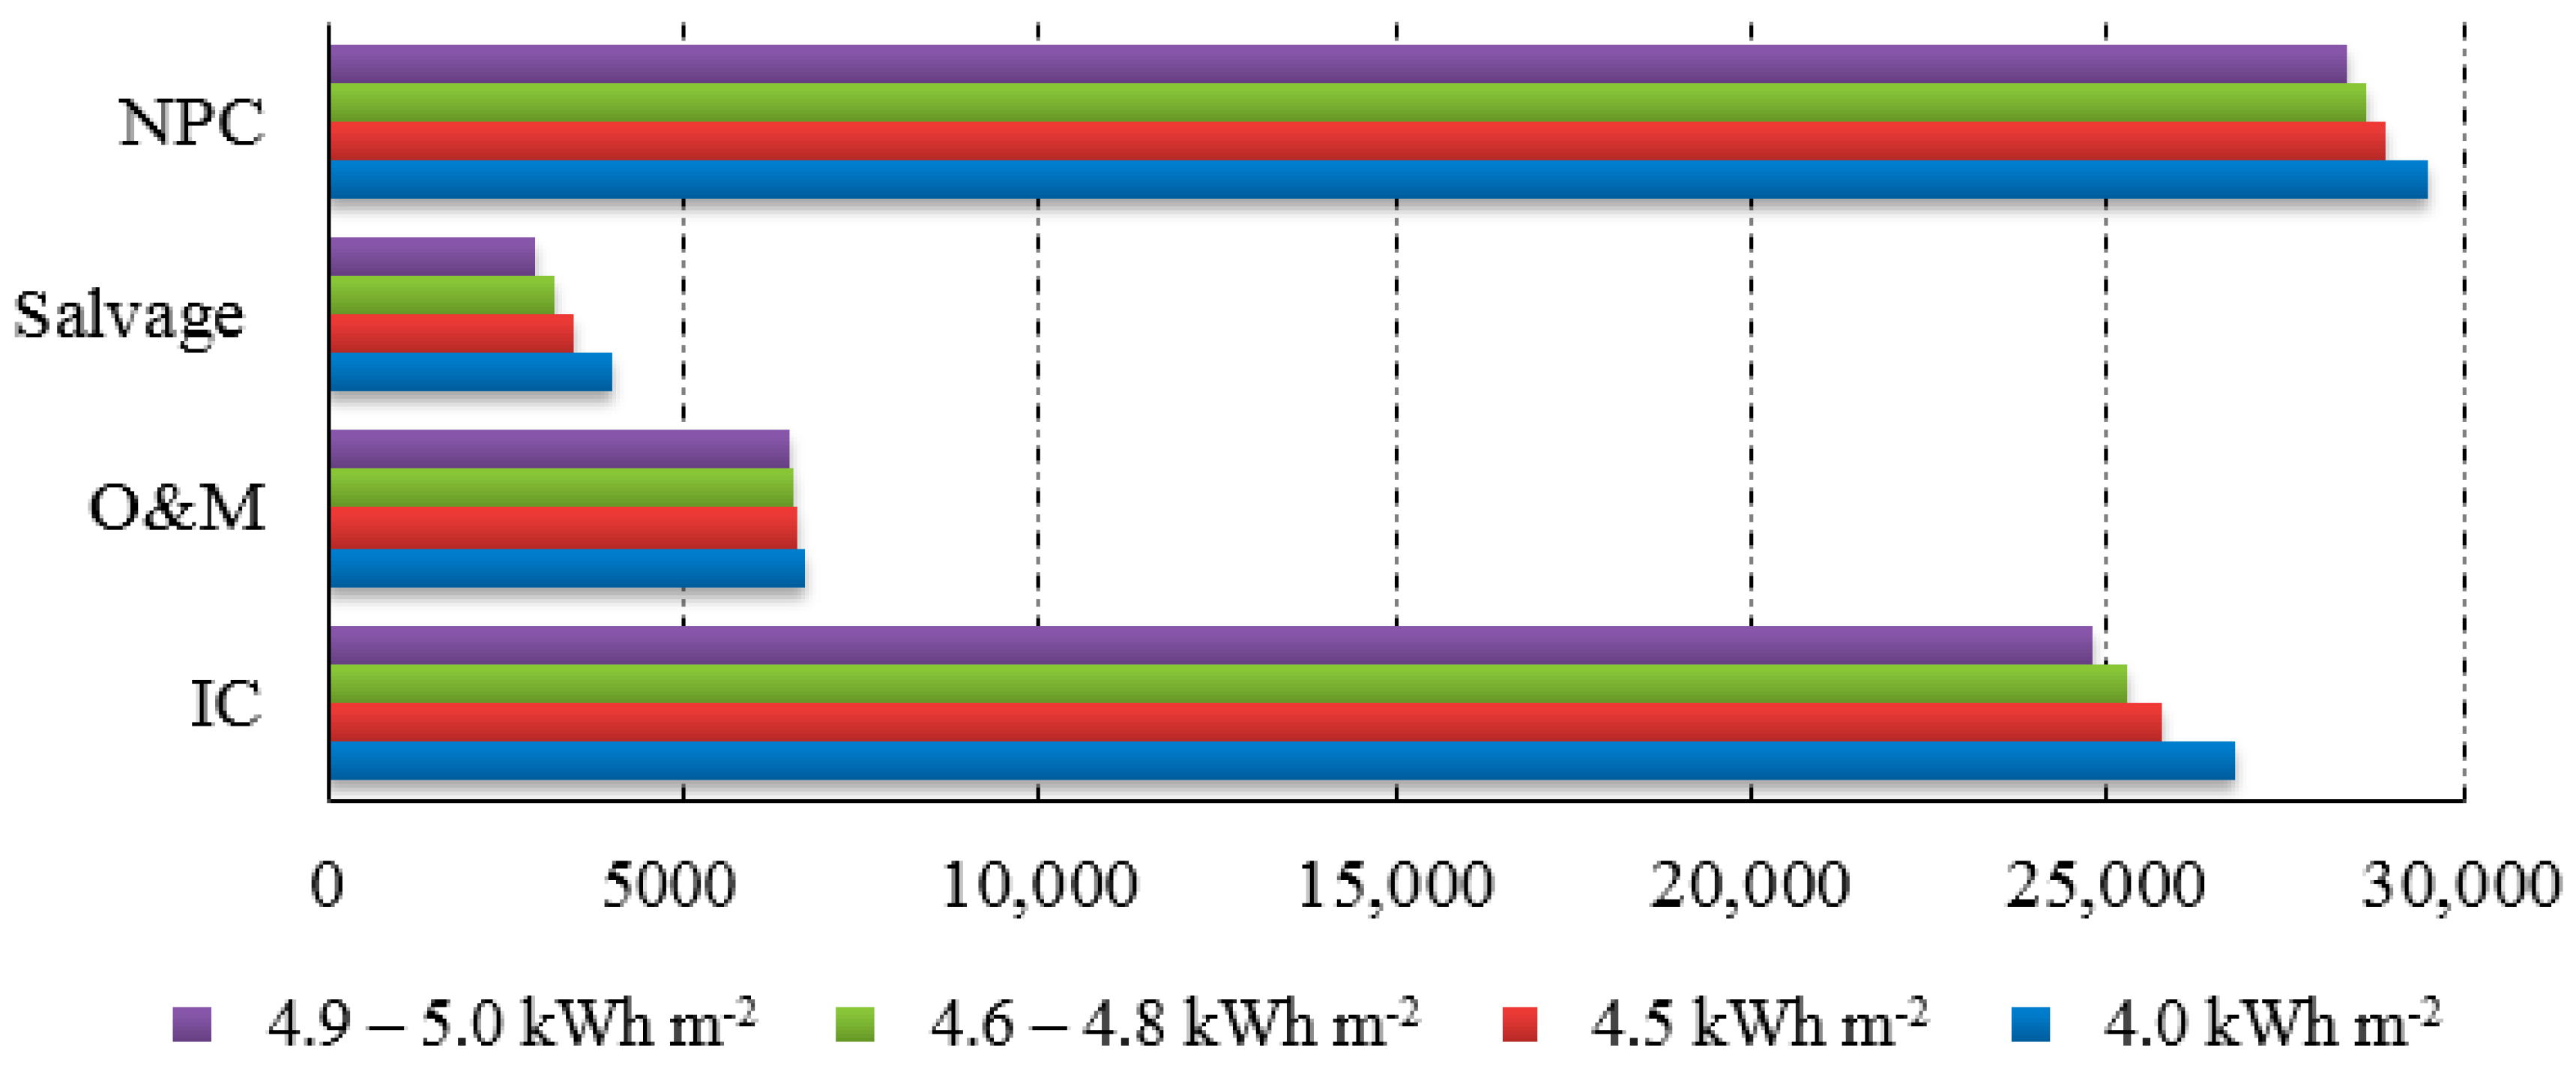
Figure 18 summarises the total discounted costs for average daily solar radiation values.
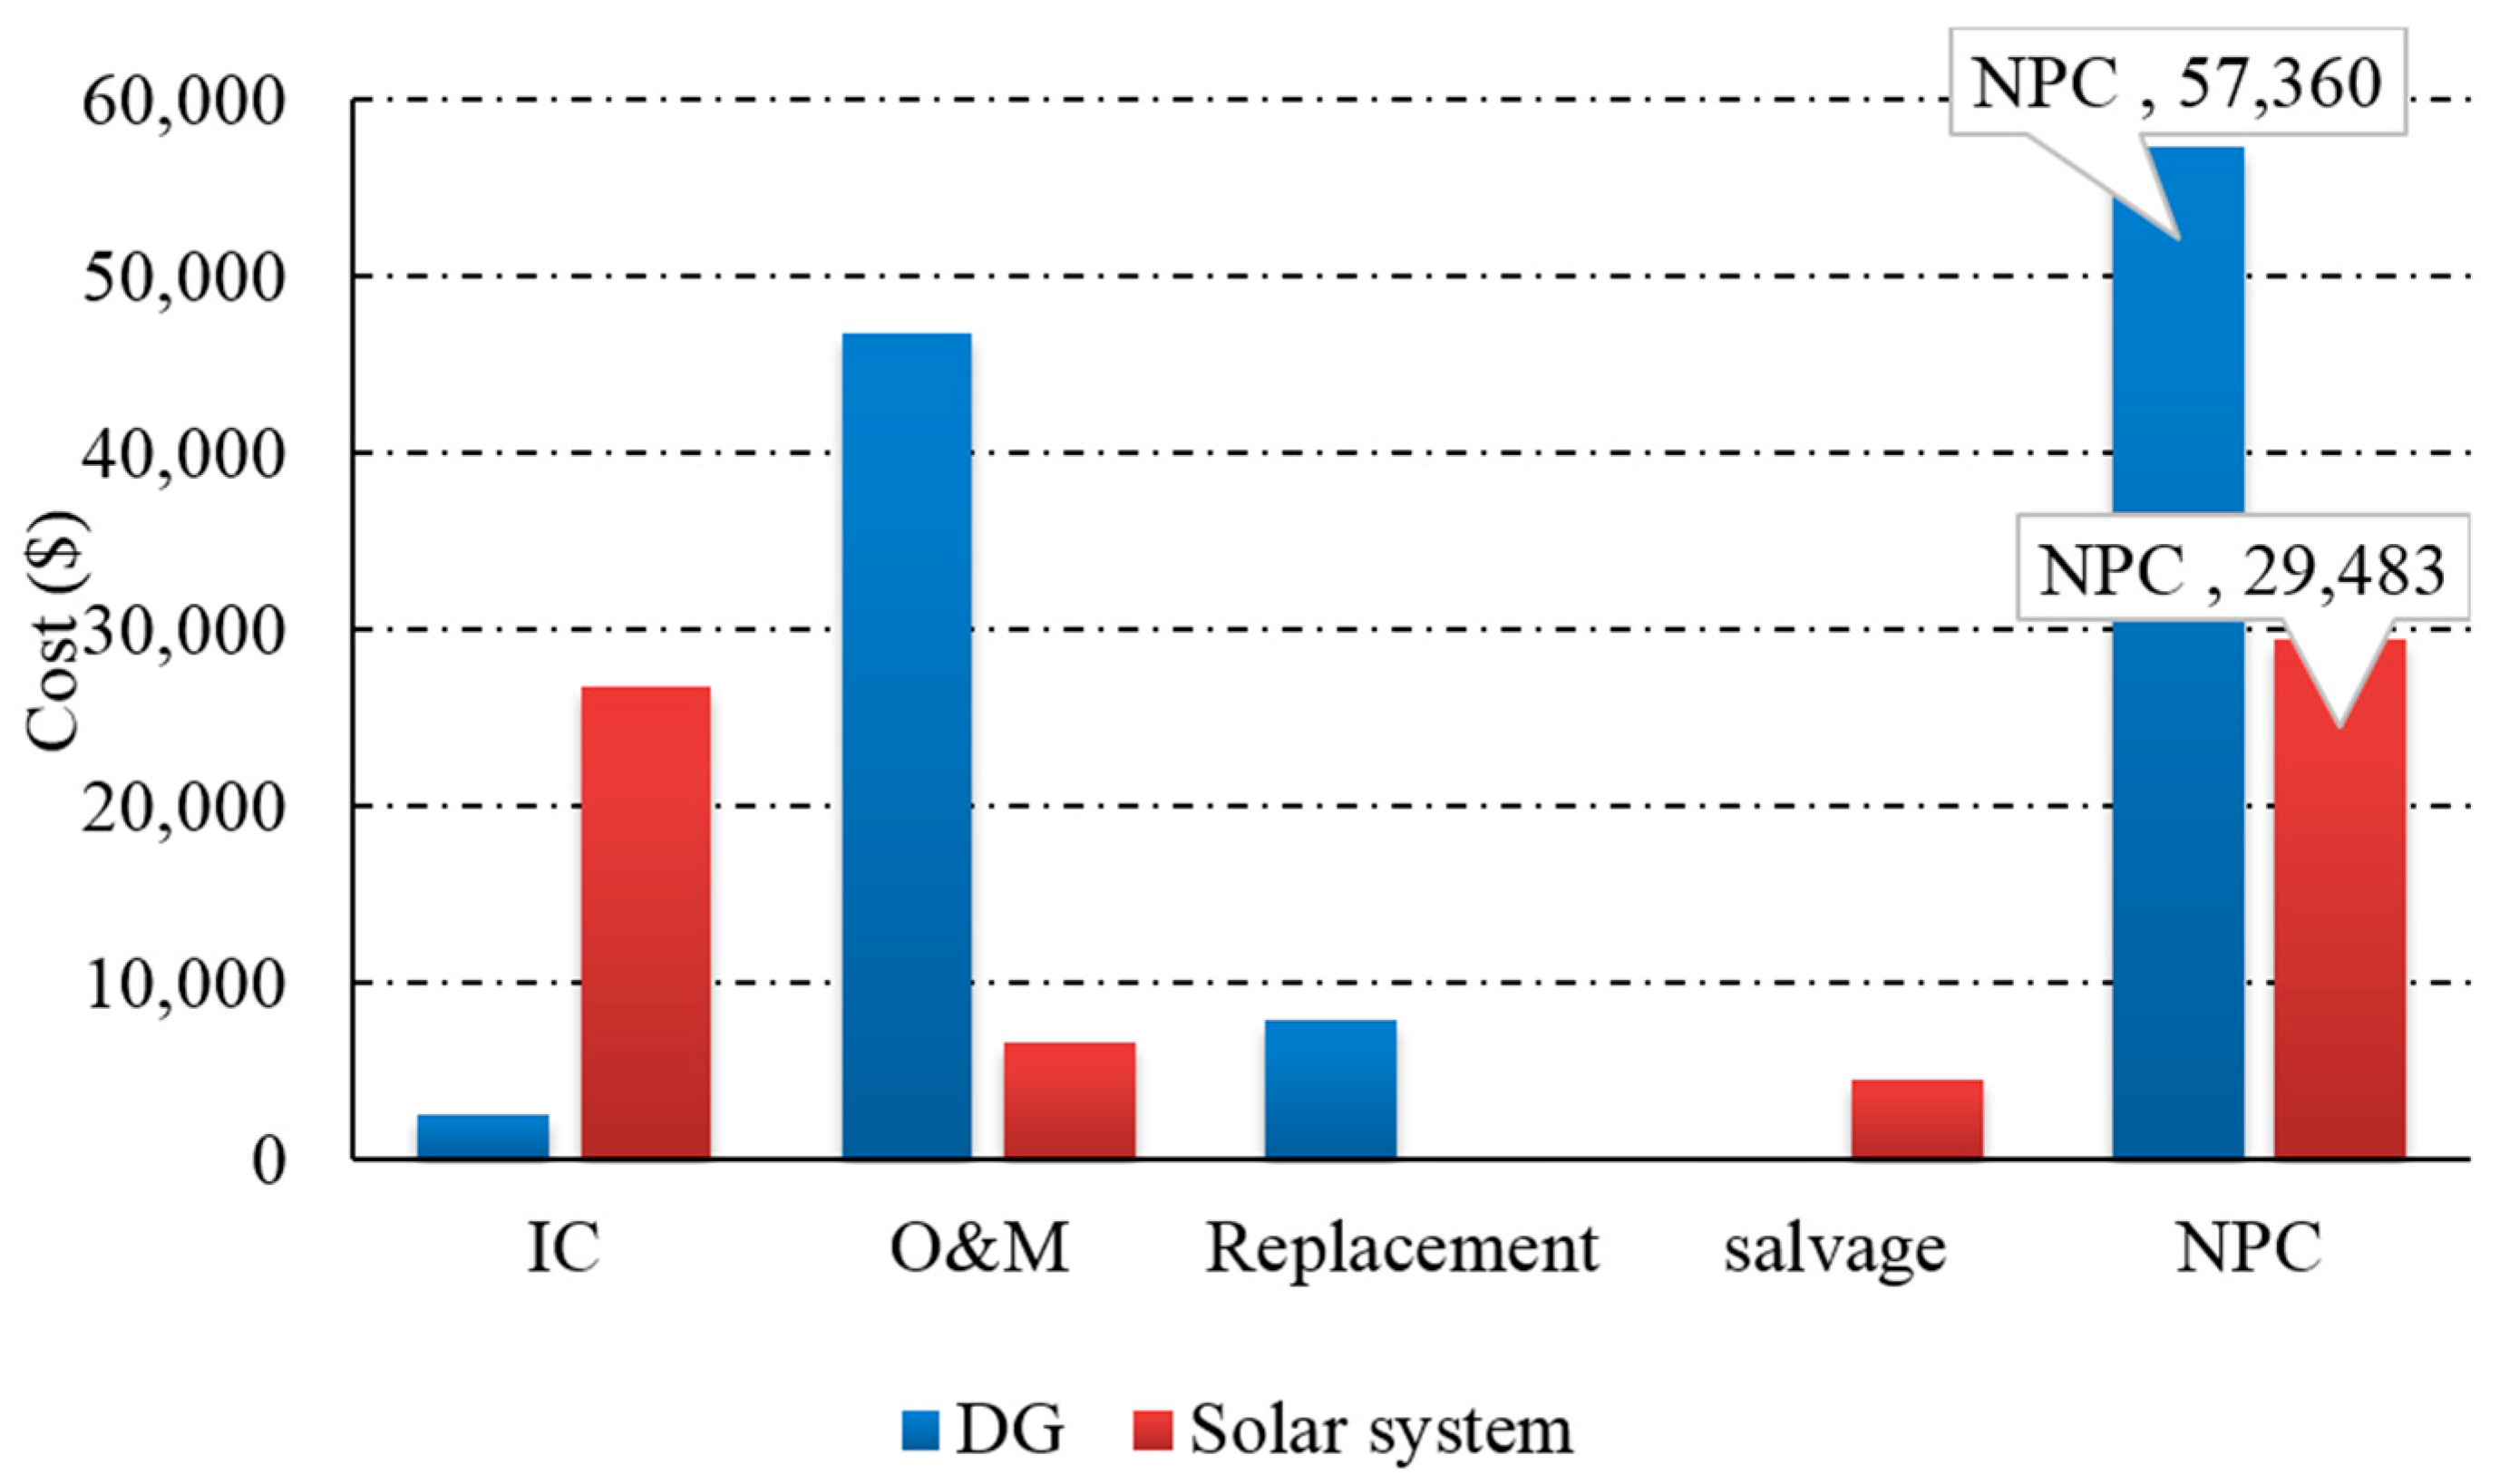
9. Economic Feasibility of Using the Proposed Solar Power System Compared with a Diesel Generator
9.1. Initial Cost (IC)
Traditional power system (diesel generator only): The diesel generator IC cost is (size 4 kW × cost $660/1 kW [
2]), equalling $2640. However, fossil fuels are not sustainable and are expensive, and the price increases continuously.
Proposed solar power system: The PV system IC cost is $26,780. The IC cost of the PV system is high because the components of the PV system are expensive compared with the diesel generator. However, the global price of PV systems is continuously decreasing.
9.2. Annual Operation and Maintenance (O&M) Costs
Traditional power system: The LTE-macro base station is fed by diesel generator only. The annual maintenance and operation costs of the diesel generator are up to $4680. The details are as follows:
- (i)
Yearly maintenance cost is $438, which is computed as (diesel generator maintenance cost of $0.05/h × annual diesel generator operating hours 8760 h).
- (ii)
Fuel cost is $4242, which is computed based on the diesel price of $1.04/L [
30] × total diesel consumption of 4079 L per year. The total diesel consumption is computed based on specific fuel consumption of 0.388 L/kWh × annual electrical production of the diesel generator of 10,512 kWh/year (diesel generator capacity 4 kW × diesel generator efficiency 0.3 × 24 h × 365 d/year).
Proposed solar power system: By applying the proposed solar power system, the LTE-macro base station is fed by a stand-alone solar power system. The annual O&M cost decreases to $717 (as discussed in
Section 8.4), yielding a savings of 84.67%.
9.3. Replacement Costs
Traditional power system: Cellular operators may need to change the diesel generator every 3 years; thus, the diesel generator will be changed at least three times during the project lifecycle. The total diesel generator replacement cost is 3 × (size 4 kW × cost $660/1 kW), totalling at least $7920.
Proposed solar power system: There are no replacement costs, as discussed in
Section 8.4.
9.4. Net Present Cost (NPC)
Traditional power system: The total NPC includes the IC costs $2640 + O&M costs $46,800 + Replacement costs $7920, totalling $57,360 over the project lifetime (10 year).
Proposed solar power system: The NPC, representing the lifecycle cost that occurs within the project lifetime, amounts to $29,483.
The total NPC that can be saved by using the proposed solar power system scheme amounts to 48.6%.
Figure 19 summarises the operational expenditures of the traditional power system (diesel generator only) compared with the proposed solar power system over the project lifetime (10 year).
10. Conclusions and Remarks
This study discussed the feasibility of remote long-term evolution (LTE)-macro base stations at off-grid sites in South Korea that are powered by solar power systems. Four key aspects have been discussed: (i) optimal system architecture; (ii) energy yield analysis; (iii) technical criteria; and (iv) economic analysis.
The simulation results showed that the solar array can meet the energy requirements of the LTE-macro base station independently without support from the battery bank. The total annual energy output of the solar array is 12,025 kWh, which covers the required amount of LTE-macro base station energy and provides 2285 kWh of excess electricity. Moreover, if the solar array fails to support the LTE-macro base station, the battery bank can supply the LTE-macro base station load autonomously for 3 days and 23 h; this is considered to be a sufficient amount of time to fix the solar array. Furthermore, if the batteries reach the maximum depth of discharge (DOD) before the malfunctions in the solar array are fixed, the diesel generator can supply the LTE-macro base station; this is considered to be a rare case because the solar array can cover the load independently.
The simulation results showed that the solar power system can save 48.6% of the total NPC cost. These results indicate that the solar power system is a good choice for telecommunication to reduce both the operational expenditures and greenhouse gases.
Finally, details of the optimum size of the different solar power system components, technical criteria, and overall cost of the proposed solar power system based on the daily solar radiation of South Korea are summarised in
Table 4.
Acknowledgments
This work was supported by the faculty research fund of Sejong University in 2016. We thank the reviewers for the fruitful suggestions, which helped us to improve the quality of this work.
Author Contributions
Mohammed H. Alsharif analysed the data and completed the first draft, and Jeong Kim wrote about the potential of applying solar energy in South Korea part and revised the final version of paper.
Conflicts of Interest
The authors declare no conflict of interest.
Abbreviations
The following abbreviations and symbols are used in this manuscript:
| Abbreviation | Meaning |
| CDMA | Code Division Multiple Access |
| CO2,NOx, SO2 | Carbon dioxide, Nitrogen oxides, Sulfur dioxide |
| CRF | Capital Recovery Factor |
| DG | Diesel Generator |
| DOD | Depth of Discharge |
| FC | Fuel Cell |
| GHG | GreenHouse Gas |
| GSM | Global System for Mobile Communication |
| HOMER | Hybrid Optimisation Model for Electric Renewables |
| IC | Initial Costs |
| KMA | Korea Meteorological Administration |
| LTE | Long-Term Evolution |
| MSW | Modified Sine-Wave |
| NPC | Net Present Cost |
| NREL | National Renewable Energy Laboratory |
| O&M | Operation and Maintenance Costs |
| PV | PhotoVoltaic |
| SCR | Solar Control Regulator |
| SOC | State of Charge |
| TAC | Total Annualised Cost |
| Pop | BS operating power |
| Power consumed by power amplifier |
| Radio frequency power |
| Baseband power |
| BS transmission power |
| Po | Normalised BS transmission power |
| PBS | Total Power Consumption for the BS |
| Pmc | Microwave backhaul power |
| Plm | Auxiliary equipment power |
| σDC | DC-DC power supply losses |
| σcool | Cooling losses |
| NTRX | Number of transceivers |
| ηPA | PA efficiency |
| α | Path loss coefficient |
| Ro | Coverage radius |
| EPV | Energy output of the PV array |
| YPV | Rated capacity of the PV array |
| fPV | PV derating factor |
| Abatt | Battery bank autonomy |
| Nbatt | Number of batteries |
| Vnom | Nominal voltage of a single battery |
| Qnom | Nominal capacity of a single battery |
| Lprim,ave | Average daily LTE-macro BS load |
| Rbatt | Battery bank lifetime |
| Qlifetime | Lifetime throughput of a single battery |
| Qthrpt | Annual battery throughput |
| Rbatt,f | Battery float life |
References
- Alsharif, M.H.; Nordin, R.; Ismail, M. Classification, recent advances and research challenges in energy efficient cellular networks. Wirel. Pers. Commun. 2014, 77, 1249–1269. [Google Scholar] [CrossRef]
- Kusakana, K.; Vermaak, H.J. Hybrid Renewable Power Systems for Mobile Telephony Base Stations in Developing Countries. Renew. Energy 2013, 51, 419–425. [Google Scholar] [CrossRef]
- Solangi, K.H.; Islam, M.R.; Saidur, R.; Rahim, N.A.; Fayaz, H. A review on global solar energy policy. Renew. Sustain. Energy Rev. 2011, 15, 2149–2163. [Google Scholar] [CrossRef]
- Korea Meteorological Administration (KMA). Annual Climatological Report 2013. Available online: http://www.kma.go.kr/weather/observation/data_monthly.jsp (accessed on 12 July 2016).
- NASA Web Site. Available online: https://eosweb.larc.nasa.gov/cgi-bin/sse/homer.cgi?email=skip%40larc.nasa.gov&step=1&lat=37.499&lon=126.54958&submit=Submit&ms=1&ds=1&ys=1998&me=12&de=31&ye=1998&daily=swv_dwn (accessed on 12 July 2016).
- Green Power for Mobile (GSMA). Community Power Using Mobile to Extend the Grid. Available online: http://www.gsma.com/mobilefordevelopment/wp-content/uploads/2012/05/Community-Power-Using-Mobile-to-Extend-the-Grid-January-2010.pdf (accessed on 12 July 2016).
- Schmitt, G. The Green Base Station. In Proceedings of the 4th International Conference on Telecommunication—Energy Special Conference (TELESCON), Vienna, Austria, 10–13 May 2009; pp. 1–6.
- John, P. Let It Shine: The 6000 Year Story of Solar Energy, Revised Edition; New World Library: Novato, CA, USA, 2013; Chapter 23. [Google Scholar]
- Nema, P.; Nema, R.; Rangnekar, S. Minimization of Green House Gases Emission by Using Hybrid Energy System for Telephony Base Station Site Application. Renew. Sustain. Energy Rev. 2010, 14, 1635–1639. [Google Scholar] [CrossRef]
- Rath, S.; Ali, S.; Iqbal, M.N. Strategic Approach of Hybrid Solar-Wind Power for Remote Telecommunication Sites in India. Int. J. Sci. Eng. Res. 2012, 3, 1–6. [Google Scholar]
- Anayochukwu, A.V.; Nnene, E.A. Simulation and Optimization of Hybrid Diesel Power Generation System for GSM Base Station Site in Nigeria. Electron. J. Energy Environ. 2013, 1, 37–56. [Google Scholar] [CrossRef]
- Imtiaz, A.W.; Hafeez, K. Stand Alone PV System for Remote Cell Site in Swat Valley. In Proceedings of the 1st International Conference on Technology and Business Management, Lahore, Pakistan, 28–29 March 2013.
- Moury, S.; Khandoker, N.M.; Haider, M.S. Feasibility Study of Solar PV Arrays in Grid Connected Cellular BTS Sites. In Proceedings of the IEEE International Conference on Advances in Power Conversion and Energy Technologies (APCET), Mylavaram, India, 2–4 August 2012.
- Martínez-Díaz, M.; Villafáfila-Robles, R.; Montesinos-Miracle, D.; Sudrià-Andreu, A. Study of Optimization Design Criteria for Stand-alone Hybrid Renewable Power Systems. In Proceedings of the International Conference on Renewable Energies and Power Quality (ICREPQ ’13), Bilbao, Spain, 20–22 March 2013.
- Kaldellis, J. Optimum hybrid photovoltaic-based solution for remote telecommunication stations. Renew. Energy 2010, 35, 2307–2315. [Google Scholar] [CrossRef]
- Serincan, F. Reliability considerations of a fuel cell backup power system for telecom applications. J. Power Sources 2016, 309, 66–75. [Google Scholar] [CrossRef]
- Aris, A.M.; Shabani, B. Sustainable power supply solutions for off-grid base stations. Energies 2015, 8, 10904–10941. [Google Scholar] [CrossRef]
- GPP System Standards. Available online: http://www.3gpp.org/news-events/3gpp-news/1614-sa_5g (accessed on 12 July 2016).
- LTE in Korea. Available online: http://www.netmanias.com/en/post/reports/6060/kt-korea-lg-u-lte-lte-a-sk-telecom-wideband-lte/lte-in-korea-2013 (accessed on 12 July 2016).
- Koo, C.; Hong, T.; Lee, M.; Park, H.S. Estimation of the Monthly Average Daily Solar Radiation using Geographic Information System and Advanced Case-Based Reasoning. Environ. Sci. Technol. 2013, 47, 4829–4839. [Google Scholar] [CrossRef] [PubMed]
- Imran, M.; Katranaras, E.; Auer, G.; Blume, O.; Giannini, V.; Godor, I.; Jading, Y.; Olsson, M.; Sabella, D.; Skillermark, P. Energy Efficiency Analysis of the Reference Systems, Areas of Improvements and Target Breakdown; EC-IST Office: Brussels, Belgium, 2011. [Google Scholar]
- Auer, G.; Giannini, V.; Desset, C.; Godor, I.; Skillermark, P.; Olsson, M.; Imran, M.A.; Sabella, D.; Gonzalez, M.J.; Blume, O. How much energy is needed to run a wireless network? IEEE Wirel. Commun. 2011, 18, 40–49. [Google Scholar] [CrossRef]
- Lambert, T.; Gilman, P.; Lilienthal, P. Micropower System Modeling with HOMER. 2006. Available online: http://homerenergy.com/documents/MicropowerSystemModelingWithHOMER.pdf (accessed on 12 July 2016).
- Borhanazad, H.; Mekhilef, S.; Saidur, R.; Boroumandjazi, G. Potential Application of Renewable Energy for Rural Electrification in Malaysia. Renew. Energy 2013, 59, 210–219. [Google Scholar] [CrossRef]
- Trojan Battery Incorporation. Available online: http://www.trojanbattery.com/ (accessed on 12 July 2016).
- Ge, X.; Cheng, H.; Guizani, M.; Han, T. 5G wireless backhaul networks: Challenges and research advances. IEEE Netw. 2014, 28, 6–11. [Google Scholar] [CrossRef]
- The Bank of Korea Monetary Policy. Available online: http://www.bok.or.kr/baserate/baserateList.action?%20menuNaviId=33 (accessed on 12 July 2016).
- Sharp Solar Electricity Incorporation. Available online: http://www.sharpusa.com/SolarElectricity.aspx (accessed on 12 July 2016).
- Leonics Incorporation, SolarCon SPT-Series. Available online: http://www.leonics.com/product/renewable/solar_charge_controller/dl/spt-074.pdf (accessed on 12 July 2016).
- Global Petrol Prices. Available online: http://www.globalpetrolprices.com/South-Korea/diesel_prices/ (accessed on 12 July 2016).
© 2016 by the authors; licensee MDPI, Basel, Switzerland. This article is an open access article distributed under the terms and conditions of the Creative Commons Attribution (CC-BY) license (http://creativecommons.org/licenses/by/4.0/).


