Article

Extended FMEA for Sustainable Manufacturing: An Empirical Study in the Non-Woven Fabrics Industry

1
Office of Scientific Research, Lac Hong University, Dong Nai, Vietnam
2
Department of Industrial Engineering and Management, National Kaohsiung University of Applied Sciences, Kaohsiung City 80778, Taiwan
3
Department of Industrial Engineering and Management, Cheng Shiu University, Kaohsiung City 83347, Taiwan
*
Author to whom correspondence should be addressed.
Sustainability 2016, 8(9), 939; https://doi.org/10.3390/su8090939
Submission received: 30 July 2016 / Revised: 5 September 2016 / Accepted: 8 September 2016 / Published: 13 September 2016
(This article belongs to the Special Issue Competitive and Sustainable Manufacturing in the Age of Globalization)

Abstract

:
Failure modes and effects analysis ( F M E A ) substantially facilitates the efforts of industrial manufacturers in prioritizing failures that require corrective actions to continuously improve product quality. However, the conventional approach fails to provide satisfactory explanation of the aggregate effects of a failure from different perspectives such as technical severity, economic severity, and production capacity in some practical applications. To fulfill the existing gap in the F M E A literature, this paper proposes an extension by considering associated quality cost and the capability of failure detection system as additional determinants to signify the priority level for each failure mode. The quality cost and capacity are considered as key factors for sustainable survival and development of an industrial manufacturer in the fierce competition market these days. The performance of the extended scheme was tested in an empirical case at a non-woven fabrics manufacturer. Analytical results indicate that the proposed approach outperforms the traditional one and remarkably reduces the percentage of defective fabrics from about 2.41% before the trial period to 1.13%,thus significantly reducing wastes and increasing operation efficiency, thereby providing valuable advantages to improve organizational competition power for their sustainable growth.

1. Introduction

Nowadays, in the context of globalization and international integration, the competition in the marketplace becomes more and more severe; and winners are usually the ones with critical advantages. In such a business environment, every company needs innovative differentiation for its survival and sustainable thriving [1] because customers prefer high value added and risk-free quality products/services. Hence, focusing on improving the quality of a product/service with high speed and low wastage production has been highly appreciated over the last few years. Companies also well recognize that they must distinguish themselves from their rivals by standing high in their quality standards of their manufactured products/catering services. With a good quality scheme, a company can sustain its development by gaining its critical competitive advantages over its competitors, high yield and low wastage. Montgomery [2] considers several approaches for ongoing quality improvement. Among them, the failure mode and effects analysis ( F M E A ) is a systematic technique initially employed to define, identify, and prevent known and/or potential failures from the process before the final products reach the customer; thus, it can effectively enhance the quality of a system by minimizing the losses in manufacturing time due to the problems that arise in the machining process, thereby increasing customers’ safety and satisfaction [3]. Literally, the F M E A can also be sufficiently implemented as a system or process design tool. It possesses notable capabilities of disclosing insidious failure modes, quantifying the causes and effects of failure modes from varying chunks of the system and components, and determining a list of prevention priorities that could reduce chance of failures. Over the design stage of the system and processes, our focus is on warding off the failure modes in advance as the analytical results of F M E A yield significant benefits for the company in terms of time and cost [4].
F M E A was first introduced in the 1960s by the aerospace industry [5]. It has been well regarded as a beneficial and prominent tool in assessing potential failures and preventing their occurrence [6], rendering both qualitative and quantitative measures to prioritize the prohibition order of failures and their effects towards the quality of products/service [7]. Consequently, the execution of F M E A has been long deployed in diverse industries, such as automotive [8,9,10,11], nuclear, electronics [12,13], chemistry [14,15], lead-free solder control plan [16], sugar mill boiler [17], fuel cells [18], paper [19], metal forming [4], tanker equipment [20], waste [21,22], Hazard Analysis and Critical Control Points audition [23], households [24], engineering systems [25], energy plants [26,27,28], medical devices [29], pharmacy [30,31,32], health care services [33,34,35,36,37,38], e-commerce [39], management [40,41,42,43], software [44], electronic paper display [45], and product design [46,47].
Traditionally, in F M E A , the metric of the criticality and risk assessment is the evaluation index, which is called risk priority number ( R P N ). It is established by consideration of three key ratings on a scale of ten based on the guidelines in Table 1, namely Severity rating ( S ) , Occurrence rating ( O ) , and Detection rating ( D ) [2].
From the above ratings, the R P N for a certain failure mode is determined by Equation (1). The failure modes with a larger R P N are more prioritized in taking corrective actions to either eradicate or diminish failures. As such, Sawhney et al. [48] and Daily [49] pointed that F M E A is a potent tool in determining the order for dealing with a series of failures according to their relative importance that requires corrective actions to improve product quality:
R P N = S × O × D .
Despite the traditional F M E A being deliberated as one of the upmost tools for preemptive avoidance of failures in the system and processes design, on the basis of the R P N measure, it has been stressed over lacking the required quality for ranking preventive failure orders [50]. Emphatically, the R P N measure fails to deliver an ample discrimination power in some circumstances due to its allocation of the identical weight for S, O, and D ratings [48,51,52], indicating that this weighting scheme places three ratings with an indistinguishable amount on the R P N . However, literally, the S and O are two major affecting factors that should be more prioritized [53]. We consider three failure modes A, B, and C, for example, whose ratings are respectively given as ( S A = 8 , O A = 5 , D A = 4 ), ( S B = 10 , O B = 4 , D B = 4 ), and ( S C = 5 , O C = 4 , D C = 8 ). Obviously, the R P N for three failure modes is all equal to 160. Regardless of the ratings of severity, occurrence, and detection in this case, where the R P N metric is the only decision index, three modes are equally emphasized, leading to dispersion and ineffectual utilization of accessible resources as certain modes have more negative impact than others [48]. Hence, if each of the rating components is prudently scrutinized, a more rational decision can be offered. For instance, although A occurs more frequently than B, B should be probed before A because B has shown to be more severe than A. Likewise, B and C have the same occurrence rating of four and the detection of C is really low, say 8 in 10, but B still requires more priority in practice because C has exhibited less severity than B. Based on the analyses, we conclude that corrective actions should be foremost allotted for B.
To conquer the above shortcomings, a number of scholars have proposed alternatives or modifications of the R P N index; for example, Xiao et al. [54] borrowed the minimum cut sets (MCS) theory to establish their index by combining multiple failure modes into a single one and incorporating the importance of failures and assessing their impact on system reliability; Liu et al. [50] contributed a certain measure dealing with lean manufacturing systems; Gargama and Chaturvedi [55] proposed a fuzzy F M E A model for prioritizing failure modes based on the degree of match and fuzzy rule-base to tackle the limitation of traditional F M E A . However, their strategies still left some room for amelioration. Sawhney et al. [48] proposed a substitute index named Risk Assessment Value ( R A V ) , which is determined by Equation (2). In their method, they believed that effectual detection and control of failures play a salient role in minimizing failure occurrence as well as severity [56]. Furthermore, according to bench-marking the performance between R P N and R A V , Kirthik et al. [56] found that R A V provides a better list of priority order. Nonetheless, with the aforementioned case, their R A V of A, B, and C are respectively obtained as R A V A = 10 , R A V B = 10 , and R A V C = 2.5 . That is, which one of A and B is of importance is still undecided. In short, although the R A V scheme performs better than the R P N one, in certain cases, it still demonstrates insufficiently in the submission of a justifiable determination:
R = O × S / D .
Moreover, Gilchrist [57] and Kmenta and Ishii [58] suggested constructing a so-called “expected cost” to present S, whereas probability of severity is embedded to the O and D measurements. Nonetheless, for the practical viewpoint, their definition of the expected cost neglects three costs pertaining to technical issues. The first one is the failure costs incurred from the faulty products; especially when they are not fully detected before being delivered to consumers, the accompanied warranty and compensation costs due to customers’ possession of the defectives would inundate. Likewise, the intangible cost rises from losing business reputation that seriously sabotages the comparative advantage of the whole organization. Finally, the varying maintenance costs emerge from heterogeneous failure modes such as repairable or irreparable ones. Consequently, to remedy the above drawbacks and enhance the discrimination power of F M E A , in this paper, we redefine the cost in a more general term called “quality cost”; that is, we recognize the quality cost as a crucial factor and integrate it into the conventional R P N formula. Our proposed scheme is called an “Extended Risk Priority Number” measure, denoted as E R P N .
The rest of this paper is organized as the following. Section 2 presents our extended F M E A approach with the construction procedure of E R P N , while an empirical case study at a non-woven fabrics manufacturer is discussed in Section 3 in demonstration of the applicability of our proposed E R P N index. Some managerial implications and concluding remarks assemble the last section.

2. Our Extended FMEA Approach

This section presents the development of our proposed extended risk priority number ( E R P N ) . Assume that there are n identified failure modes existing in a production process. For jth mode ( j = 1 , 2 , . . , n ), the following denotations are used.
  • P O j : occurrence probability of the mode;
  • P D j : detection probability of the mode;
  • S T j : severity level of the mode from a technical perspective (in service industry, S T j is actually the timing of the process), evaluated on a traditional scale of 10;
  • S I j : severity level from an economic perspective in internally dealing with the mode; thus, it closely relates to so-called “internal failure costs”;
  • S E j : severity level from an economic perspective in externally dealing with the mode; i.e., the level of external costs occurred after non-detected faulty product/service is delivered to external customers; thus, it is actually a part of so-called “external failure costs”;
  • p o c j : the probability of a casualty caused by the mode if the faulty item fails to be detected before delivery;
  • S C j : severity level from economic perspective for a casualty caused by the mode. If the failure mode may lead to fatal losses, the S C j is assigned with an extreme value so that it can be carefully considered in the manufacturing and quality controlling processes. Hence, it is actually another part of so-called “external failure costs”.
Kremer [59] stated that a failure rated with D = 1 can be 100% detected, whereas D = 10 means no chance for the detection. Thus, based on the reviews by Chang and Wen [60], Chang et al. [61], General Motor Corp [62], and Liu et al. [63], and Table 1, we formulate the relationships between O j and P O j , or between D j and P D j , are as in Equations (3) and (4):
P O j = O j / 10 ,
P D j = ( 10 - D j ) / 9 .
Then, the modified index E R P N j of the jth failure mode is determined by
E R P N j = P O j × S T j × P D j × S I j + 1 - P D j × p o c j × S C j + 1 - p o c j S E j .
Equation (5) with the quantity of 1 - P D j obviously considers the effects of a failure when it is not detected by the control system. In addition, E R P N and the conventional R P N have some similar characteristics; for example, the lower detection probability in E R P N (i.e., smaller) is respectively to the higher of D in R P N , as shown in Equation (4). Moreover, 1 - P D j also reflects the impacts of external failure costs on the amplitude of E R P N ; specifically, if the probability of detecting failures is low, the chance of a faulty product/service delivered to customers is certainly high, resulting in higher E R P N , implying that the jth failure mode would be more prioritized. The values of S T j , S I j , S E j , and S C j are evaluated as the following.

2.1. Evaluation of Severity of Failures from Technical Perspective S T

The severity level of technical failures ( S T ) is determined based on key requirements about technology, aesthetics, fundamental characteristics and specified standards. Basically, the failures may result from input materials, production process, control methods, labor, facilities, and even from the impacts of working environment. Hence, for each failure (potential or detected), vigilant identification of its major causes is required so that we can assess the remedial possibilities in terms of technology, process, facilities, control methods and labor forces. It is also critical to gauge its inferior disturbance on the next stages in the production process, product quality and customer perception. Thus, the severity S T in E R P N is actually the severity level S in the traditional R P N . Table 2 illustrates an example of evaluation of the technical severity S T used for non-woven fabrics manufactured in Company P, which is mentioned in Section 3.

2.2. Evaluation of Severity of Failures from an Economic Perspective

As mentioned above, quality cost closely related to quality assurance of semi-products and finished products in all stages of production process from inputs to outputs and using period by customers. The quality cost can be divided into four groups: (1) prevention costs; (2) appraisal costs; (3) internal failure costs; and (4) external failure costs [2]. Among them, the first two groups are controllable while the last two ones directly relate to production process, which accounts for a significant part of the total cost of an organization. Thus, this paper investigates the last two groups as a key component in our proposed E R P N .
Internal Failure Cost (IFC) I F C are actually the costs that occur due to the quality of incompliance of any component, part, material, product, and/or related service provided that defective products are detected before being delivered to the customer. I F C takes a value of 0 if no defective product is found prior to delivery. Particularly, it consists of the following components: scrap; rework; retest; failure analysis; downtime; and yield losses, etc.
External Failure Cost (EFC) E F C includes all costs occurred due to the failures detected after products are delivered to customers. It takes a value of 0 when all products meet specified requirements. E F C consists of the following components: (1) without-casualty costs ( W o C ) : field servicing and handling complaints; recalls, returns, replacements; warranty; other indirect costs because defective products/services lead to the dissatisfaction of customers and their negative impression about the products/services and the manufacturers/providers; consequently, damage customer good-will, lose sales due to bad reputation, etc.; and (2) casualty costs ( C C ) : costs for compensating any possible casualty to customers due to the faulty item, or I F C = W o C + C C . Therefore, for every failure mode, we need to fully identify associated I F C and E F C so that proper solutions for quality improvement can be achieved.
Additionally, I F C and E F C can be respectively converted into S I and S E with the following procedure. Assume that we have n failure modes in the production process of a product. Let I F C j , W o C j , and C C j j = 1 , n ¯ individually denote the internal, without-casualty, and casualty costs of the j t h mode. S I j , S E j and S C j are then determined by:
S I j = I F C j / F C m i n ; S E j = W o C j / F C m i n ; S C j = C C j / F C m i n ,
where F C m i n = min I F C 1 , I F C 2 , . . . , I F C n , W o C 1 , W o C 2 , . . . , W o C n , C C 1 , C C 2 , . . . , C C n .
The determination of S I j , S E j and S C j shown in Equation (6) obviously not only combat the shortcomings of the R P N in a conventional F M E A approach and the R A V proposed by Sawhney et al. [48], but also contemplates the severity level of two prominent quality costs, namely I F C and E F C of the same failure mode; i.e., for a failure whose S E is higher than S I , we can conclude that the inspection for defects should be especially concerned in the final stage of quality control to minimize defective products delivered to customers because its external cost is higher than that if internally detected; or, if S I is higher than S E , we need to carefully investigate and eliminate the causes for the failures in each stage of the production process. Precisely, our proposed index is disparate from that of Nguyen et al. [64] with respect to the detailed distinction of the external costs, especially the cost for casualty.

3. Practical Application

In order to evaluate the applicability of the proposed E R P N for sustainable manufacturing, we conduct a practical study of a manufacturer of non-woven fabrics.

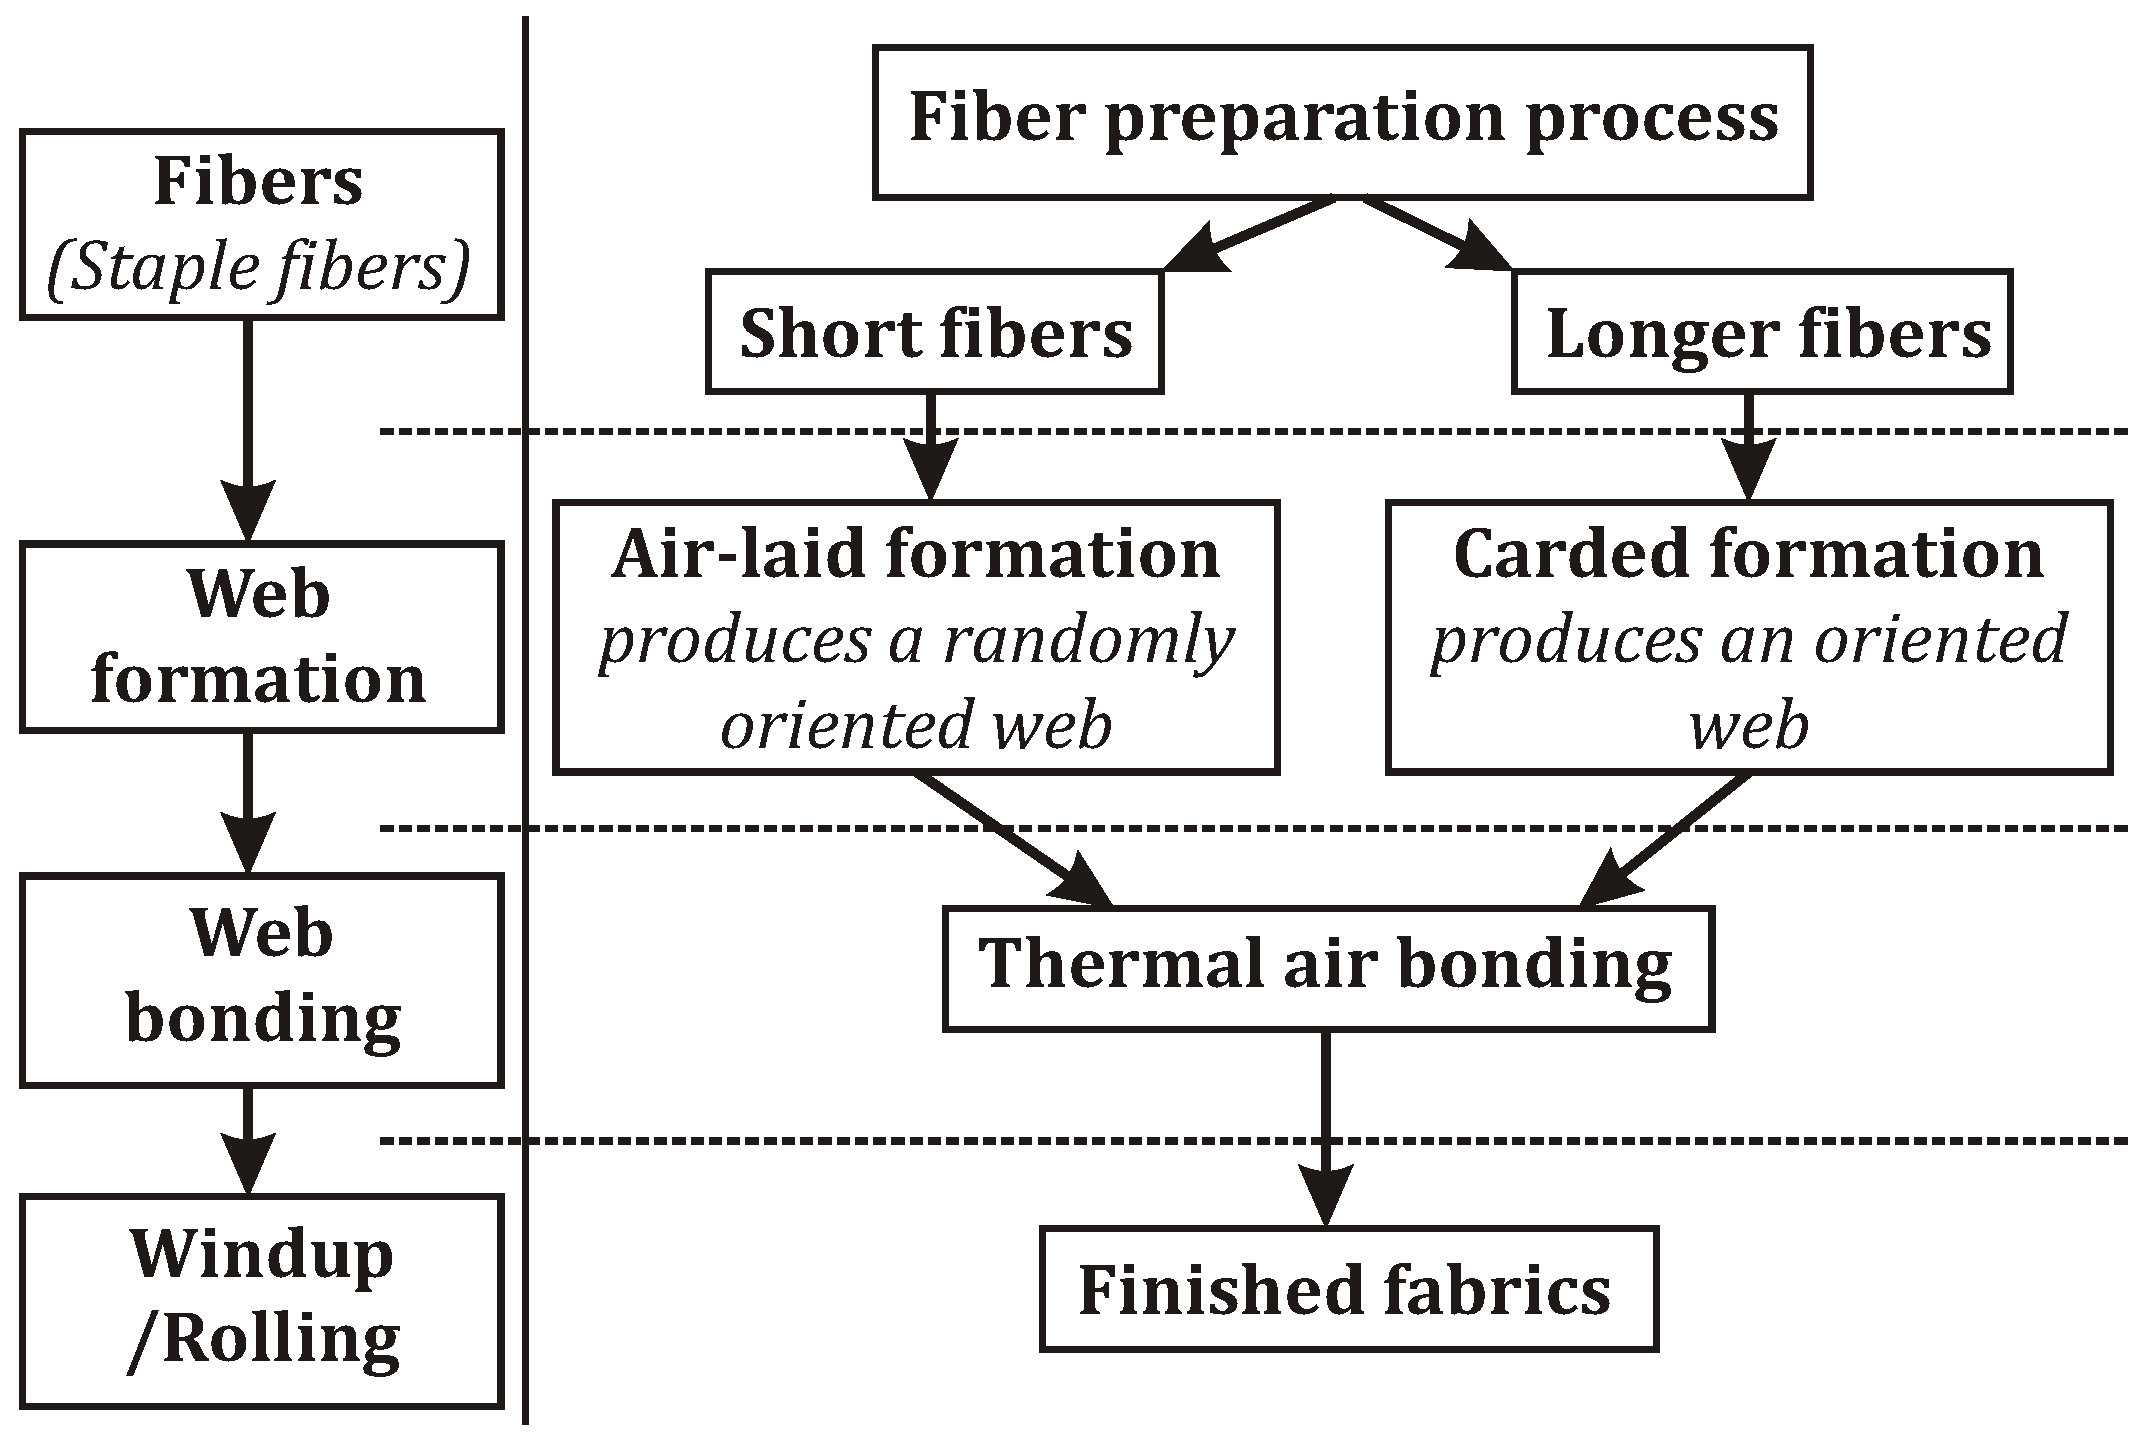
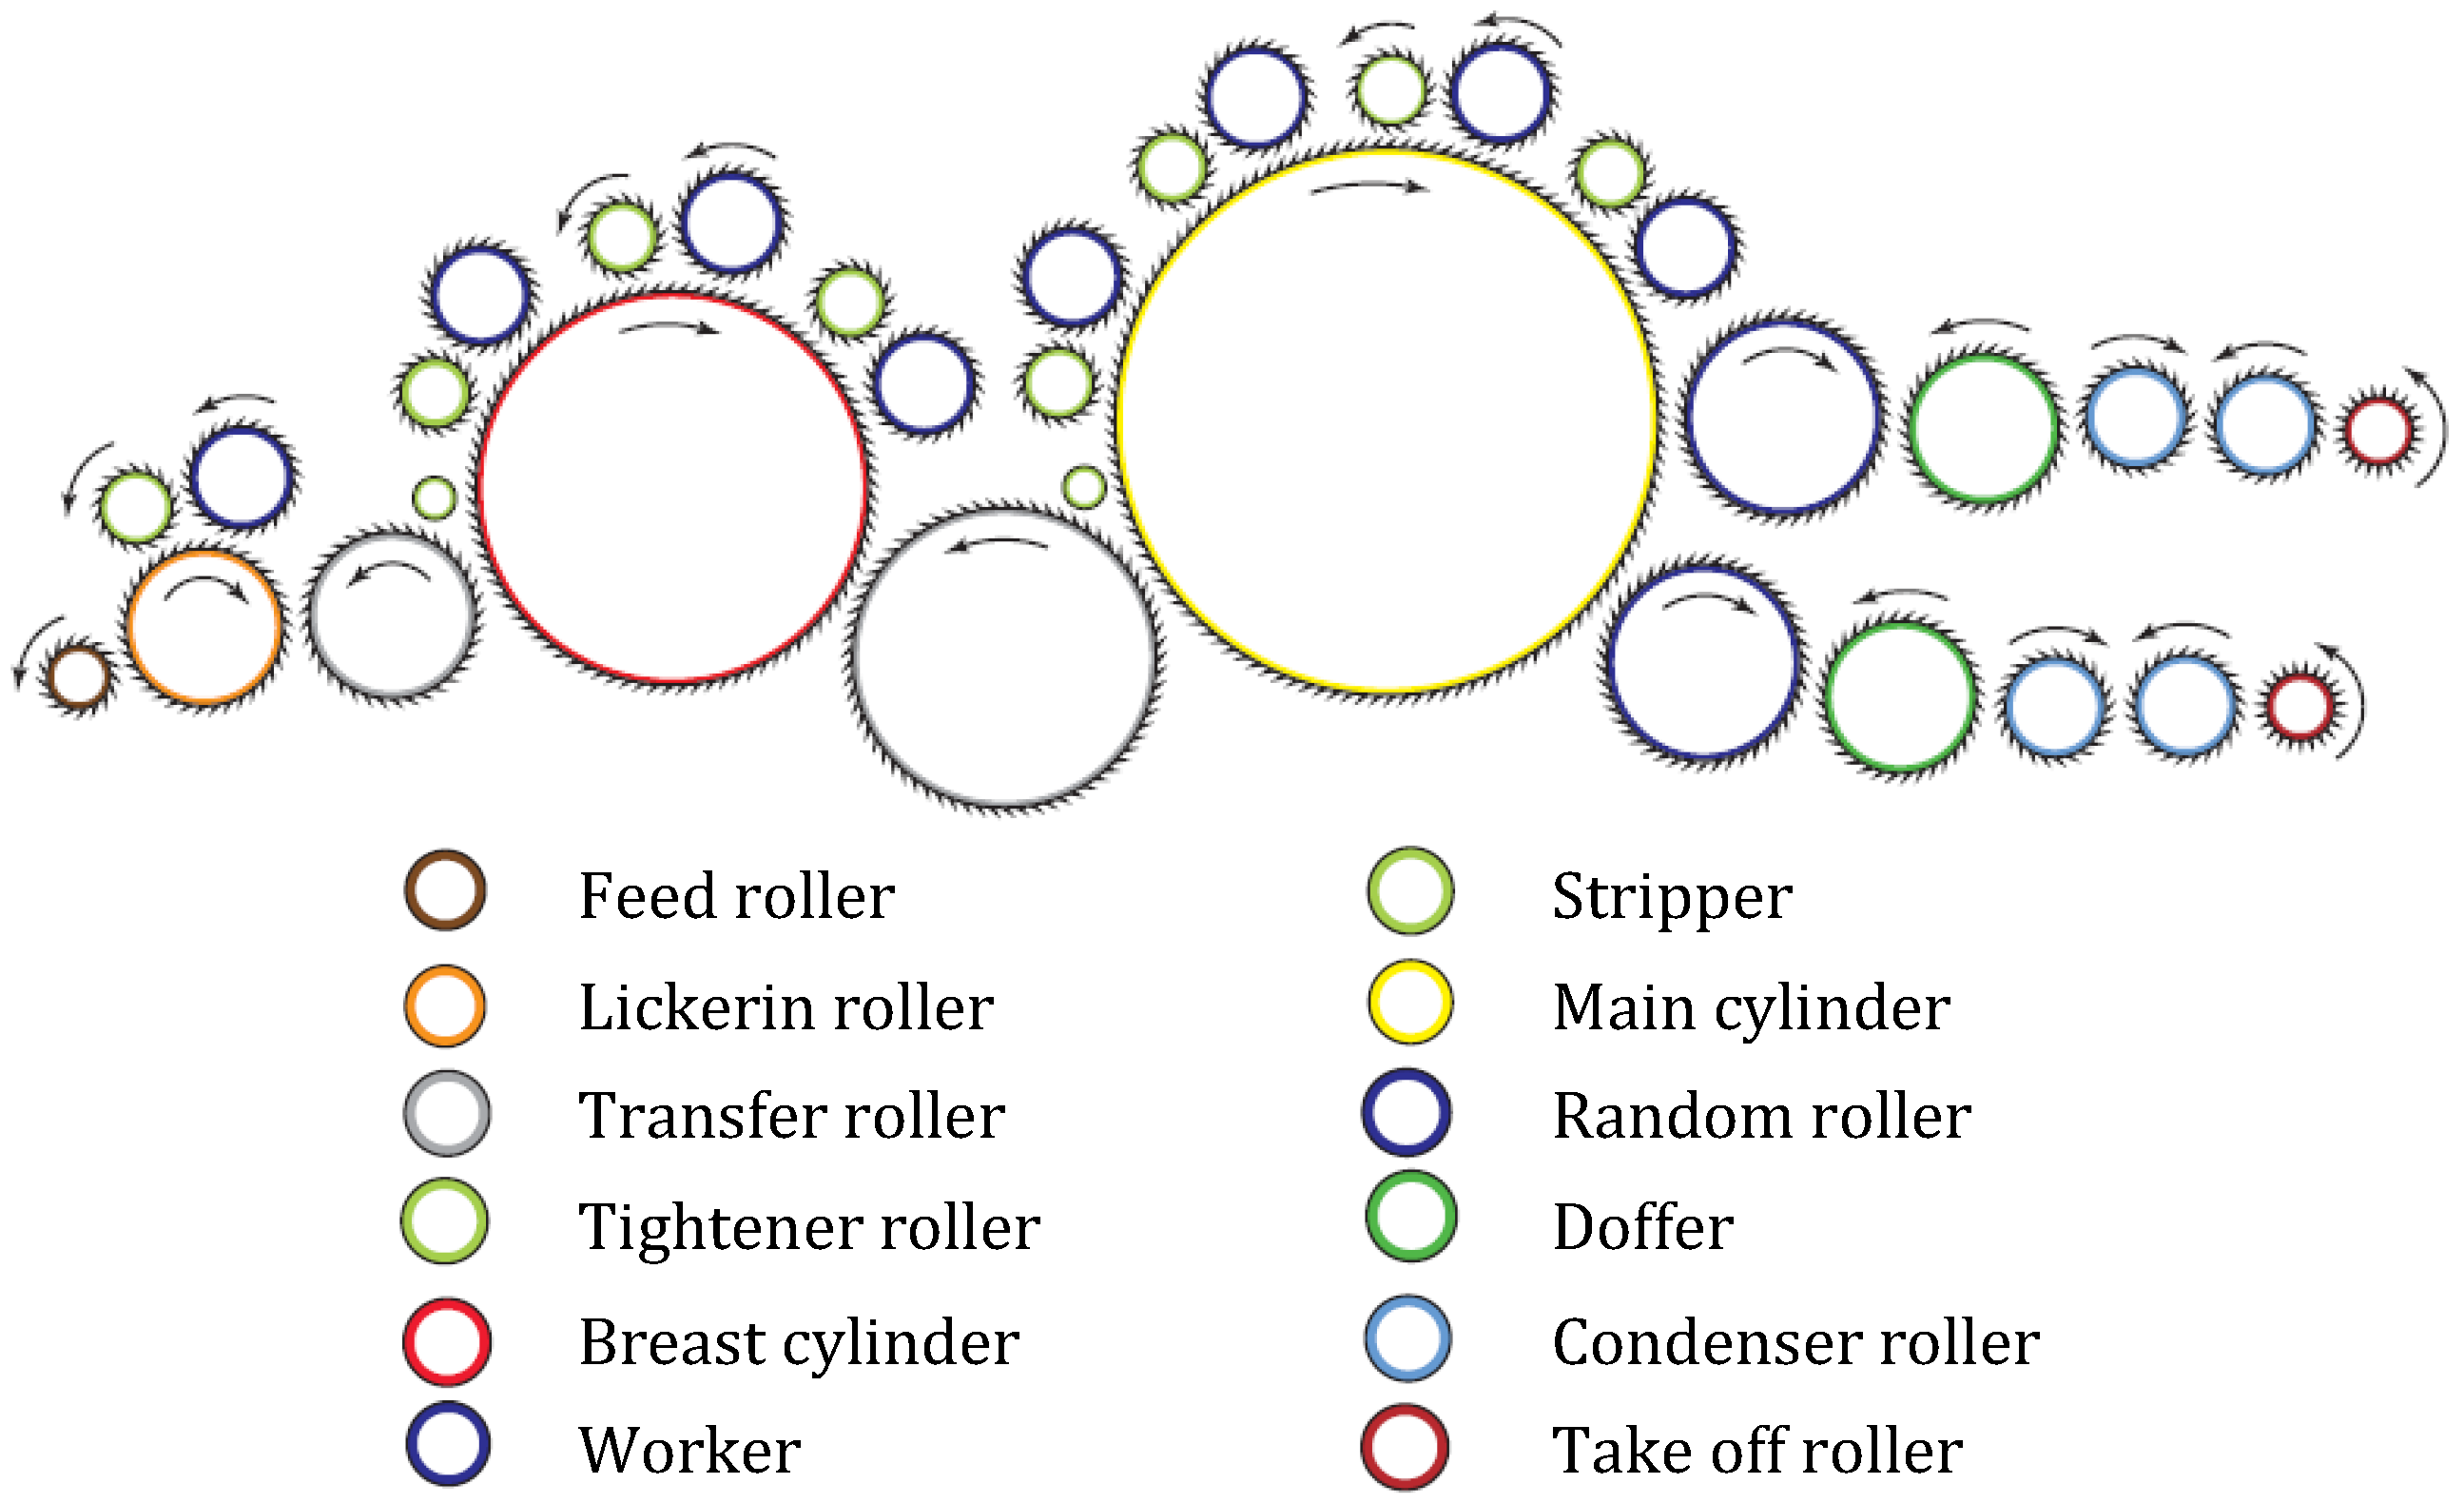
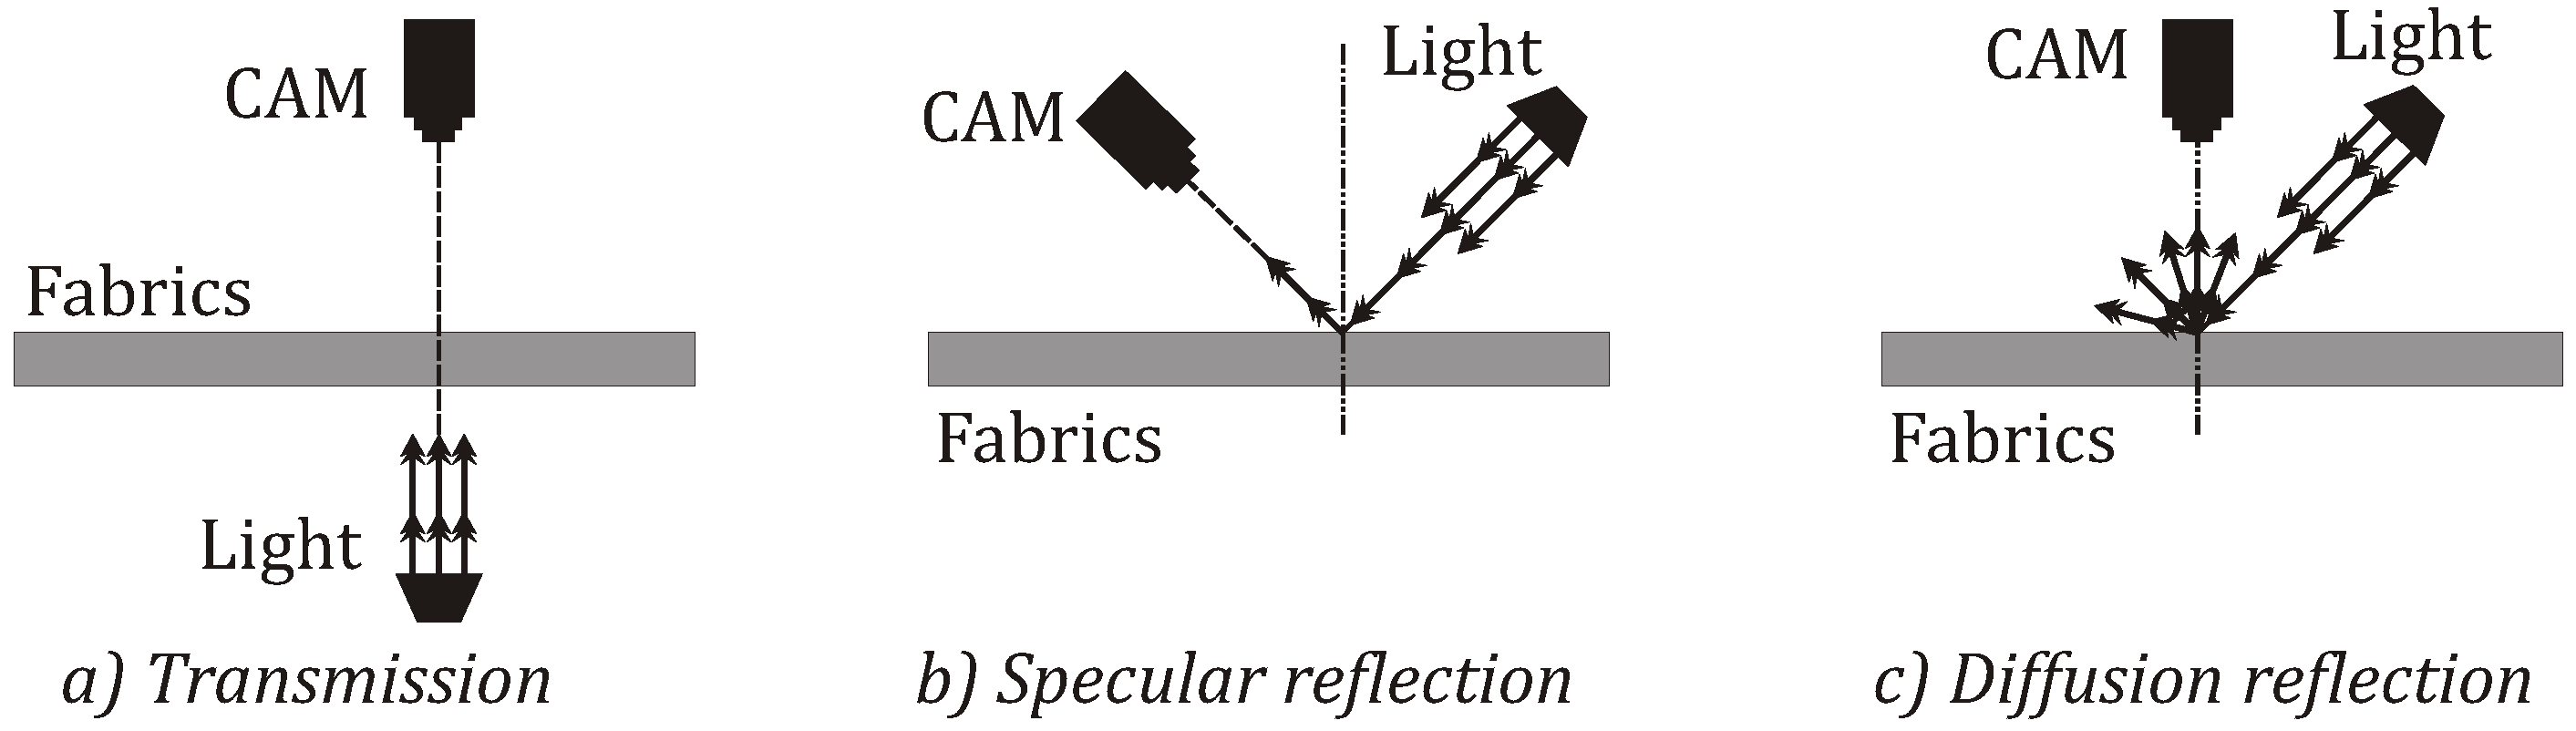
3.1. Overview of the Non-Woven Fabrics Industry

In the non-woven fabrics industry, all non-woven fabrics are based on fibrous webs and so the characteristic of the web determines the physical properties of the final product. The manufacturing of non-woven fabrics customarily consists of two discrete phases: forming of webs and bonding of webs. A satisfactory web for non-woven fabric production of a specific weight is produced with minimum weight variation along its length or across its width. In the bonding process, the sheet’s characteristic can be controlled by a number of parameters that depends on the type of entanglement used in the process.
The general manufacturing process is briefly presented in Figure 1. After being unloaded, staple fibers are fed into an opener machine in which a series of sharp hinges separate the fibers from the bundle into small pieces suitable to be conveyed by the air blowers. Then, a cotton-mixer blends the fibers and breaks them into clusters. After that, the fibers are transported to a store cotton machine that is resorted to store the fibers and send them to the carding machine when needed. Whenever the carding machine needs the fiber input, it automatically sends a signal to the cotton storage machine and other ones. To minimize manual intervention and thereby maintain a flawless production environment, qualified sensors and relays are usually used in the automatic processes.
In the fiber preparation and web formation, the fibers are straightened and separated into individual fibers with minimum or low fiber breakage and distributed in a parallel manner before being transformed into the form of a web. The principal mechanism in these processes are shown in Figure 2, where the rollers are positioned, colored, and named accordingly.
The rollers presented in Figure 2 handle various types of actions including: combing, carding, stripping and doffing. Specifically, the combing action is the first process in the web formation where the fibers are arranged in a straight and parallel manner; thus, short fibers and longer ones are accordingly separated along with the impurities by combs that are structured similarly to the rollers and brushes. After that, the fibers are carded, i.e., fibers are blended and oriented by the flat roll and cylinder to get uniformly arranged fibers. With different speed of rollers rotating in opposite directions, a parallelized fiber web is obtained. In the stripping and doffing actions, strippers move the fibers from the cylinder to the doffer wheel by means of speed differentiation maintained between the two rollers. The doffer rotates at a lower speed than that of the cylinder so that the doffer can collect the fibers and make them into a web. Traditionally, for a multilayered web, more than one carding machine is required. However, this can be done with a random carding technique by operating two doffer rollers in the same machine. The number of machines demanded in the non-woven line for the production of multi-layered webs can be minimized by the manipulation of the random card.
Finally, a web consisting of two or more layers needs to be bonded by either mechanical or chemical or thermal methods. Among which, the thermal air bonding is preferably deployed because it is environmentally-friendly without any latex binder, and it also consumes less energy compared to foam bonding or hydro entanglement bonding. In this type of bonding, it is in charge of controlled and heated air inside a chamber with varying temperature zones to allow the thermoplastic fibers to be melted and softened before they are cooled down to become a bonded sheet with a smooth surface and high strength that can be applied in various applications. Typically, the temperature is responsible for the texture and the strength if the final fabric, i.e., a low temperature produces an uneven bonded soft sheet or a weak tensile, while a high temperature leads to a hard texture and a plastic-like sheet. In the case of more complicated fabrics, patterns/textures and colors can be created and embedded on two sides of the sheet by using hot patterned rollers with suitable pressure and temperature.
Importantly, before delivered, the sheets deserve to be attentively inspected to assure they meet certain customers’ standards/specifications. Thus, an acceptable quality inspection system is mandatory. It should consist of multiple CCD (charge-coupled device) high speed cameras to detect any contamination, flaws and impurities like dust or insects present on the sheet. Practically, common defects in the non-woven manufacturing include wrinkles, stains, tears, holes, insects, and different colored fibers. Thus, the system can effectively help its manufacturer satisfy its customers with flawless products.
There are three common approaches for the system setup including light transmission, specular reflection and diffusion reflection as shown in Figure 3. The first approach works based on the fact that the presence of foreign materials or impurities leads to the change in the intensity of the light while the second one works based on the fact that uneven surfaces or impurities can affect the amount of light reflected to the camera due to the light diffusion. Moreover, in the diffusion approach, the change in the level of the light reflected from the sheet can of great help to identify defects by the diffusion properties of light; thus, it is usually employed in the non-woven fabrics industry.

3.2. EFMEA at Company P

This study examines the feasibility of the proposed approach at Company P, which is a non-woven fabrics manufacturer located in Ho Chi Minh City, Vietnam. Basically, the company usually has unfavorable problems in terms of delay of delivery schedules and wastes of materials due to their defective fabrics that account for about 2.41% of total manufacturing. Such a high percentage of defectives certainly reduce the annual performance of the company. To deal with this problem and minimize the volume of noncomforming products, an F M E A team is formed that consists of 12 members who are administrators, top engineers, group leaders, and quality engineers responsible for distinct processes.
Through the inspection system, the F M E A team has identified the following major 18 failure modes: Holes; Eyebrows; Polymer Drips; Broken Filaments; Dirt; Wrinkles; Bond Points; Fusions; Light Spots; Dark Spots; Thin Spots; Thick Spots; Calendar Cuts; Meltblown Filament Drops; Scratches; Streaks; Clumps; and Contamination. Some of their typical images are shown in Figure 4.
Related costs, I F C and E F C , of the failures were deliberated by the F M E A team as shown in Table 3. Notably, the F M E A team believed that there is no chance of a casualty caused by these failure modes; therefore, for j = 1 , 18 ¯ , p o c j always gets a value of 0 and the external failure costs for casualty were disregarded in this empirical study. Consequently, only external without-casualty costs ( W o C ) were considered in E F C . With these costs, the values of S I j , and S E j in Equation (6) were easily obtained as illustrated in Table 4.
With the conventional F M E A approach and the extended one, the team determine the relevant values for the specified parameters in Equations (1) and (5) as shown in Table 4 from which the risk priorities based on the traditional R P N and E R P N are accordingly obtained as illustrated in the columns “Pri-F” and “Pri-E”. Table 4 clearly shows that each approach identifies eight key failure modes with the highest values of either R P N or E R P N . However, the two approaches may lead to different failure modes detected; thus, the risks are differently prioritized as ranked in the two columns. To have a fair comparison, eight failure modes with the highest values of R P N and E R P N were selected and carefully investigated for root causes. Consequently, actual corrective actions between the two approaches can be different and may lead to different results.
By observing the results in Table 4, the F M E A team investigated 11 failures in total for causes and then proposed feasible solutions to rectify the problems. Moreover, to evaluate the performance of our proposed E R P N in comparison with the traditional R P N , the F M E A team chose two production lines with the homogeneous production conditions (facilities and worker’s ability). Each line focused on their most prioritized solutions; specifically, the first line (Line 1) works with the solutions for failure modes selected under the traditional F M E A approach, and the second line (Line 2) works under the extended one as briefly presented in Table 5. After corrective actions and adjustments have been properly implemented, the two investigated lines concurrently produced trial lots in five consecutive working days. We then checked all of the produced fabrics sheets of each line separately, and found that the defective products in the line are, respectively, 1.49% and 1.13% of the total manufactured sheets. These figures indicate that the priority order obtained from our extended approach outperforms that from the conventional F M E A .

4. Discussion

The F M E A approach has been broadly applied in analyzing failure modes and their effects towards product/service quality as it can help manufacturers/service providers to identify failures/defects of their products/services as well as the failures’ severity levels and impacts on related stakeholders and their business performance. However, the conventional approach fails to provide satisfactory explanation of the aggregate effects of a failure from different perspectives such as technical severity, economic severity, and production capacity in some practical applications. The incorporation of associated quality cost and the capability of failure detection system in our extended R P N overcomes such shortcomings. The performance of the extended scheme was tested in an empirical case at a non-woven fabrics manufacturer. In particular, the extended approach proposed in this paper results in remarkable reduction of the percentage of defective fabrics from about 2.41% before the trial period to 1.13% in the trial with the proposed E R P N . In comparison with the defective percentage of 1.49% with the traditional R P N , we can conclude that the E R P N outperforms R P N in identifying priority order to deal with detected failures. This can be explained by the fact that the E R P N considers the severity of failures from not only a technical perspective but also an economic one including internal cost and external cost for any failures undetected before the products are delivered to customers.
As such, the extended F M E A approach can provide effective identification of key failure modes, from which we can easily investigate for root causes and establish feasible solutions to either eliminate or reduce the volume of defectives. These corrective actions greatly help the production lines run intermittently and productively. The low malfunction rate of the processes not only significantly decreases the waste of related resources in terms of materials, labor, and time, thereby reducing the overall cost of the manufacturing operations, but also assures the production capacity and quality of the fabrics, which are actually the key factors for the sustainable survival and development of an industrial manufacturer in the fierce competition market these days. This is because when they deliver their products on time with expected quality, they can gain the special trust from their customers, thereby increasing their customers’ satisfaction and royalty. These qualities are all considered as valuable advantages to improving their competition power.

5. Conclusions

Failure modes and effects analysis ( F M E A ) substantially facilitates the efforts of industrial manufacturers in prioritizing failures that require corrective actions to continuously improve product quality. However, the traditional approach with the R P N consisting of three components, namely occurrence rating, detection rating and severity level, reveals certain disadvantages in prioritizing failures to be solved. Thus, this paper proposes an advanced index by extending the conventional R P N with associated quality cost and the capability of the failure detection system because the capability intimately relates to the possibility of defective products/services delivered to customers; i.e., such capability can either establish or damage the quality reputation of an organization. The performance of our extended index E R P N was tested in an empirical case at a non-woven fabrics manufacturer. Analytical results indicate that the proposed approach outperforms the traditional one and remarkably reduces the percentage of defective fabrics from about 2.41% before the trial period to 1.13%,thus significantly reducing wastes and increasing operation efficiency, thereby providing valuable advantages to improve organizational competition power for their sustainable growth. Consequently, the E R P N can fulfill the existing gap in the F M E A literature. However, we suggest further investigation of the E R P N in different business sectors, industries and benchmarks with other existing indices before we can firmly ascertain its remarkable performance.

Acknowledgments

This research was partially supported by the Ministry of Science and Technology of Taiwan under the grant MOST104-2221-E-151-018-MY3.

Author Contributions

Thanh-Lam Nguyen, Ming-Hung Shu and Bi-Min Hsu reviewed the current literature of failure mode and effects analysis and proposed the extended approach; Bi-Min Hsu collected the data at the company; Thanh-Lam Nguyen and Ming-Hung Shu analyzed the data and wrote the paper.

Conflicts of Interest

The authors declare no conflict of interest.

Abbreviations

The following abbreviations are used in this manuscript:
ERPNExtended Risk Priority Number
FMEAFailure Mode and Effects Analysis
RPNRisk Priority Number
VNDVietnam Dong

References

  1. Alakeson, V.; Sherwin, C. Innovation for sustainable development. Forum Future 2004, 10, 142–149. [Google Scholar]
  2. Montgomery, D.C. Statistical Quality Control —A Modern Introduction; Wiley & Sons: Singapore, 2013. [Google Scholar]
  3. Stamatis, D.H. Failure Mode and Effect Analysis: FMEA from Theory to Execution; ASQC Press: New York, NY, USA, 1995. [Google Scholar]
  4. Pantazopoulos, G.; Tsinopoulos, G. Process failure modes and effects analysis (PFMEA): A structured approach for quality improvement in the metal forming industry. J. Fail. Anal. Prev. 2005, 5, 5–10. [Google Scholar] [CrossRef]
  5. Bowles, J.B.; Peláez, C.E. Fuzzy logic prioritization of failures in a system failure mode, effects and criticality analysis. Reliab. Eng. Syst. Saf. 1995, 50, 203–213. [Google Scholar] [CrossRef]
  6. Sankar, N.R.; Prabhu, B.S. Modified approach for prioritization of failures in a system failure mode and effects analysis. Int. J. Qual. Reliab. Manag. 2001, 18, 324–336. [Google Scholar] [CrossRef]
  7. Chen, J.K. Utility priority number evaluation for FMEA. J. Fail. Anal. Prev. 2007, 7, 321–328. [Google Scholar] [CrossRef]
  8. Chin, K.S.; Wang, Y.M.; Poon, G.K.K.; Yang, J.B. Failure mode and effects analysis using a group-based evidential reasoning approach. Comput. Oper. Res. 2009, 36, 1768–1779. [Google Scholar] [CrossRef]
  9. Aldridge, J.R.; Taylor, J.; Dale, B.G. The application of failure mode and effects analysis at an automotive components manufacturer. Int. J. Qual. Reliab. Manag. 1991, 8, 83–90. [Google Scholar] [CrossRef]
  10. Kolich, M. Using failure mode and effects analysis to design a comfortable automotive driver seat. Appl. Ergon. 2014, 45, 1087–1096. [Google Scholar] [CrossRef] [PubMed]
  11. Cicek, K.; Celik, M. Application of failure modes and effects analysis to main engine crankcase explosion failure on-board ship. Saf. Sci. 2013, 51, 6–10. [Google Scholar] [CrossRef]
  12. Chang, K.H.; Cheng, C.H. Evaluating the risk of failure using the fuzzy OWA and DEMATEL method. J. Intell. Manuf. 2011, 22, 113–129. [Google Scholar] [CrossRef]
  13. Horng, R.-H.; Lin, R.-C.; Chiang, Y.-C.; Chuang, B.-H.; Hu, H.-L.; Hsu, C.-P. Failure modes and effects analysis for high-power GaN-based light-emitting diodes package technology. Microelectron. Reliab. 2012, 52, 818–821. [Google Scholar] [CrossRef]
  14. Jiang, Y.; Jiang, H.; Ding, S.; Liu, Q. Application of failure mode and effects analysis in a clinical chemistry laboratory. Clin. Chim. Acta 2015, 448, 80–85. [Google Scholar] [CrossRef] [PubMed]
  15. Wang, Y.; Cheng, G.; Hu, H.; Wu, W. Development of a risk-based maintenance strategy using FMEA for a continuous catalytic reforming plant. J. Loss Prev. Process Ind. 2012, 25, 958–965. [Google Scholar] [CrossRef]
  16. Lillie, E.; Sandborn, P.; Humphrey, D. Assessing the value of a lead-free solder control plan using cost-based FMEA. Microelectron. Reliab. 2015, 55, 969–979. [Google Scholar] [CrossRef]
  17. Mariajayaprakash, A.; Senthilvelan, T. Failure detection and optimization of sugar mill boiler using FMEA and Taguchi method. Eng. Fail. Anal. 2013, 30, 17–26. [Google Scholar] [CrossRef]
  18. Whiteley, M.; Dunnett, S.; Jackson, L. Failure mode and effect analysis, and fault tree analysis of polymer electrolyte membrane fuel cells. Int. J. Hydrog. Energy 2016, 41, 1187–1202. [Google Scholar] [CrossRef] [Green Version]
  19. Sharma, R.K.; Kumar, D.; Kumar, P. Systematic failure mode effect analysis (FMEA) using fuzzy linguistic modelling. Int. J. Qual. Reliab. Manag. 2005, 22, 986–1004. [Google Scholar] [CrossRef]
  20. Zhou, Q.; Thai, V.V. Fuzzy and grey theories in failure mode and effect analysis for tanker equipment failure prediction. Saf. Sci. 2016, 83, 74–79. [Google Scholar] [CrossRef]
  21. Sutrisno, A.; Gunawan, I.; Tangkuman, S. Modified failure mode and effect analysis (FMEA) model for accessing the risk of maintenance waste. Procedia Manuf. 2015, 4, 23–29. [Google Scholar] [CrossRef]
  22. Chen, W.C.; Wu, W.F. Constructing an effective prevention mechanism for MSW lifecycle using failure mode and effects analysis. Waste Manag. 2015, 46, 646–652. [Google Scholar] [CrossRef] [PubMed]
  23. Trafialek, J.; Kolanowski, W. Application of failure mode and effect analysis (FMEA) for audit of HACCP system. Food Control 2014, 44, 35–44. [Google Scholar] [CrossRef]
  24. Afshari, H.; Issa, M.H.; Radwan, A. Using failure mode and effects analysis to evaluate barriers to the greening of existing buildings using the leadership in energy and environmental design rating system. J. Clean. Prod. 2016, 127, 195–203. [Google Scholar] [CrossRef]
  25. Yang, Z.; Wang, J. Use of fuzzy risk assessment in FMEA of offshore engineering systems. Ocean Eng. 2015, 95, 195–204. [Google Scholar] [CrossRef]
  26. Feili, H.R.; Akar, N.; Lotfizadeh, H.; Bairampour, M.; Nasiri, S. Risk analysis of geothermal power plants using failure modes and effects analysis (FMEA) technique. Energy Convers. Manag. 2013, 72, 69–76. [Google Scholar] [CrossRef]
  27. Arabian-Hoseynabadi, H.; Oraee, H.; Tavner, P.J. Failure modes and effects analysis (FMEA) for wind turbines. Int. J. Electr. Power Energy Syst. 2010, 32, 817–824. [Google Scholar] [CrossRef] [Green Version]
  28. Colli, A. Failure mode and effect analysis for photovoltaic systems. Renew. Sustain. Energy Rev. 2015, 50, 804–809. [Google Scholar] [CrossRef]
  29. Lin, Q.L.; Wang, D.J.; Lin, W.G.; Liu, H.C. Human reliability assessment for medical devices based on failure mode and effects analysis and fuzzy linguistic theory. Saf. Sci. 2014, 62, 248–256. [Google Scholar] [CrossRef]
  30. AL-Tahat, M.D.; Jawwad, A.K.M.A.; Nahleh, Y.L.A. Ordinal logistic regression model of failure mode and effects analysis (FMEA) in pharmaceutical tabletting tools. Eng. Fail. Anal. 2013, 27, 322–332. [Google Scholar] [CrossRef]
  31. Kaljević, O.; Djuriš, J.; Djurić, Z.; Ibrić, S. Application of failure mode and effects analysis in quality by design approach for formulation of carvedilol compression coated tablets. J. Drug Deliv. Sci. Technol. 2016, 32, 56–63. [Google Scholar] [CrossRef]
  32. Bonnabry, P.; Cingria, L.; Sadeghipour, F.; Ing, H.; Fonzo-Christe, C.; Pfister, R.E. Use of a systematic risk analysis method to improve safety in the production of pediatric parenteral nutrition solutions. Qual. Saf. Health Care 2005, 14, 93–98. [Google Scholar] [CrossRef] [PubMed]
  33. Chanamool, N.; Naenna, T. Fuzzy FMEA application to improve decision-making process in an emergency department. Appl. Soft Comput. 2016, 43, 441–453. [Google Scholar] [CrossRef]
  34. Abrahamsen, H.B.; Abrahamsen, E.B.; Høyland, S. On the need for revising healthcare failure mode and effect analysis for assessing potential for patient harm in healthcare processes. Reliab. Eng. Syst. Saf. 2016, 155, 160–168. [Google Scholar] [CrossRef]
  35. Mayadev, J.; Dieterich, S.; Harse, R.; Lentz, S.; Mathai, M.; Boddu, S.; Kern, M.; Courquin, M.; Stern, R.L. A failure modes and effects analysis study for gynecologic high-dose-rate brachytherapy. Brachytherapy 2015, 14, 866–875. [Google Scholar] [CrossRef] [PubMed]
  36. Masini, L.; Donis, L.; Loi, G.; Mones, E.; Molina, E.; Bolchini, C.; Krengli, M. Application of failure mode and effects analysis to intracranial stereotactic radiation surgery by linear accelerator. Pract. Radiat. Oncol. 2014, 4, 392–397. [Google Scholar] [CrossRef] [PubMed]
  37. Benjamin, D.M. Reducing medication errors and increasing patient safety: Case studies in clinical pharmacology. J. Clin. Pharmacol. 2003, 43, 768–783. [Google Scholar] [CrossRef] [PubMed]
  38. Montesi, G.; Lechi, A. Prevention of medication errors: Detection and audit. Br. J. Clin. Pharmacol. 2009, 67, 651–655. [Google Scholar] [CrossRef] [PubMed]
  39. Linton, J. Facing the challenges of service automation: An enabler for e-commerce and productivity gain in traditional services. IEEE Trans. Eng. Manag. 2003, 50, 478–484. [Google Scholar] [CrossRef]
  40. Lolli, F.; Ishizaka, A.; Gamberini, R.; Rimini, B.; Messori, M. FlowSort-GDSS—A novel group multi-criteria decision support system for sorting problems with application to FMEA. Expert Syst. Appl. 2015, 42, 6342–6349. [Google Scholar] [CrossRef] [Green Version]
  41. Kumru, M.; Kumru, P.Y. Fuzzy FMEA application to improve purchasing process in a public hospital. Appl. Soft Comput. 2013, 13, 721–733. [Google Scholar] [CrossRef]
  42. Liao, C.J.; Ho, C.C. Risk management for outsourcing biomedical waste disposal —Using the failure mode and effects analysis. Waste Manag. 2014, 34, 1324–1329. [Google Scholar] [CrossRef] [PubMed]
  43. Geum, Y.; Cho, Y.; Park, Y. A systematic approach for diagnosing service failure: Service-specific FMEA and grey relational analysis approach. Math. Comput. Model. 2011, 54, 3126–3142. [Google Scholar] [CrossRef]
  44. Park, G.-Y.; Kim, D.H.; Lee, D.Y. Software FMEA analysis for safety-related application software. Ann. Nucl. Energy 2014, 70, 96–102. [Google Scholar] [CrossRef]
  45. Su, C.T.; Lin, H.C.; Teng, P.W.; Yang, T. Improving the reliability of electronic paper display using FMEA and Taguchi methods: A case study. Microelectron. Reliab. 2014, 54, 1369–1377. [Google Scholar] [CrossRef]
  46. Davidson, G.; Lib, A. Learning from failures: Design improvements using a multiple criteria decision-making process. J. Aerosp. Eng. 2003, 217, 207–216. [Google Scholar] [CrossRef]
  47. Hsiao, S. Concurrent design method for developing a new product. Int. J. Ind. Ergon. 2002, 29, 41–55. [Google Scholar] [CrossRef]
  48. Sawhney, R.; Subburaman, K.; Sonntag, C.; Capizzi, C.; Rao, P.V. A modified FMEA approach to enhance reliability of lean systems. Int. J. Qual. Reliab. Manag. 2010, 27, 832–855. [Google Scholar] [CrossRef]
  49. Daily, K.W. The FMEA Pocket Handbook; DW Publishing Co.: Orlando, FL, USA, 2004. [Google Scholar]
  50. Liu, H.C.; Liu, L.; Liu, N. Risk evaluation approaches in failure mode and effects analysis: A literature review. Expert Syst. Appl. 2013, 40, 828–838. [Google Scholar] [CrossRef]
  51. Cox, L.A., Jr.; Babajev, D.; Huber, W. Some limitations of qualitative risk rating systems. Risk Anal. 2007, 25, 651–662. [Google Scholar] [CrossRef] [PubMed]
  52. Cox, L.A., Jr. What’s wrong with risk matrices? Risk Anal. 2008, 28, 497–512. [Google Scholar] [PubMed]
  53. Patrick, D. Practical Reliability Engineering, 4th ed.; Publish House of Electronics Industry: Beijing, China, 2004. [Google Scholar]
  54. Xiao, N.C.; Huang, H.Z.; Li, Y.F.; He, L.P.; Jin, T.D. Multiple failure modes analysis and weighted risk priority number evaluation in FMEA. Eng. Fail. Anal. 2011, 18, 1162–1170. [Google Scholar] [CrossRef]
  55. Gargama, H.; Chaturvedi, S.K. Criticality assessment models for failure mode effects and criticality analysis using fuzzy logic. IEEE Trans. Reliab. 2011, 60, 102–110. [Google Scholar] [CrossRef]
  56. Karthik, S.; Sivakumar, A.; Sevvel, P. Comparative study of risk assessment value against risk priority number. Int. J. Innov. Res. Sci. Technol. 2015, 4, 114–123. [Google Scholar]
  57. Gilchrist, W. Modeling failure modes and effects analysis. Int. J. Qual. Reliab. Manag. 1993, 10, 16–23. [Google Scholar] [CrossRef]
  58. Kmenta, S.; Ishii, K. Scenario-based failure modes and effects analysis using expected cost. J. Mech. Des. 2004, 126, 1027–1035. [Google Scholar] [CrossRef]
  59. Kremer, D. Design FMEA (Failure Modes Effects Analysis). Ohio University Mechanical Engineering Sr. Design 2007–2008. 2007–2008. Available online: https://www.ohio.edu/mechanical/design/snrdesign07_08/me471/fmea&reliability.pdf (accessed on 23 May 2015).
  60. Chang, K.H.; Wen, T.C. A novel efficient approach for DFMEA combining 2-tuple and the OWA operator. Expert Syst. Appl. 2010, 37, 2362–2370. [Google Scholar] [CrossRef]
  61. Chang, K.H.; Cheng, C.H.; Chang, Y.C. Reprioritization of failures in a silane supply system using an intuitionistic fuzzy set ranking technique. Soft Comput. 2010, 14, 285–298. [Google Scholar] [CrossRef]
  62. General Motor Corp. Potential Failure Mode and Effects Analysis (FMEA) Reference Manual; Automotive Industry Action Group: Southfield, MI, USA, 2008. [Google Scholar]
  63. Liu, H.C.; Liu, L.; Liu, N.; Mao, L.X. Risk evaluation in failure mode and effects analysis with extended VIKOR method under fuzzy environment. Expert Syst. Appl. 2012, 39, 12926–12934. [Google Scholar] [CrossRef]
  64. Nguyen, T.L.; Tai, D.H.; Shu, M.H. Modifying risk priority number in failure modes and effects analysis. Int. J. Adv. Appl. Sci. 2016, 3, 76–81. [Google Scholar]
Figure 1. Manufacturing process of non-woven fabrics.
Sustainability 08 00939 g001
Figure 2. Rollers for preparing and forming fiber webs.
Sustainability 08 00939 g002
Figure 3. Inspection approaches.
Sustainability 08 00939 g003
Figure 4. Some typical failure modes.
Sustainability 08 00939 g004
Table 1. Rating scale guidelines.
No.Aspect Rating Values
1 Sustainability 08 00939 i00110
1Severityinsignificant Sustainability 08 00939 i001catastrophic
2Occurrenceextremely unlikely Sustainability 08 00939 i001inevitable
3Detectionabsolutely certain to detect Sustainability 08 00939 i001no control exists
Table 2. Evaluation of severity level S T from a technical perspective.
SeverityImpact LevelEvaluation Criteria
10Extremely serious, unpredictableTechnical failures can not be detected from production process
9Extremely serious, predictableTechnical failures only detected after checking finished products
8SeriousTechnical failures only detected after completing production
7HighTechnical failures require a long time to be remedied
6Quite highFailures affecting next stages
5SignificantFailures affecting finished product beauty
4Quite significantFailures due to equipment can be immediately remedied
3LowFailures due to operational failures
2Very lowNormal failures only affect the cost of materials
1Extremely lowAlmost no impact on product quality
Table 3. Internal costs (IFC) and external without-casualty costs (WoC). Unit: 1000 VND */m 2 .
No.FailureIFCWoCNo.FailureIFCWoC
1Bond point612153010Holes3061530
2Broken Filaments2295382511Light Spots9181530
3Calendar Cuts2754382512Meltblown F. Drops **13773825
4Clumps2142336613Polymer Drips12241530
5Contamination2295275414Scratches15303060
6Dark Spots2142336615Streaks18362754
7Dirt153153016Thick Spots22953366
8Eyebrows459153017Thin Spots7651530
9Fusions1989275418Wrinkles9181530
Notes: * VND: Vietnam Dong; ** F. Drops: Filament Drops.
Table 4. Risk priorities based on R P N and E R P N .
Failure ModesS( S T )OD RPN Pri-F * P O P D S I S E ERPN Pri-E **
Bond point655150 0.50.55641030.11
Broken Filaments963162 0.60.7781525110.974
Calendar Cuts105420040.50.6671825146.601
Clumps1053150 0.50.778142294.426
Contamination1043120 0.40.778151875.98
Dark Spots754140 0.50.667142282.79
Dirt548160 0.40.22211022.56
Eyebrows744112 0.40.66731019.12
Fusions103618060.30.444131898.365
Holes85624030.50.44421036.25
Light Spots66725220.60.33361074.47
Meltblown F.Drops104624030.40.444925118.683
Polymer Drips927126 0.20.33381045.64
Scratches86419250.60.667102087.957
Streaks963162 0.60.778121886.378
Thick Spots105420040.50.6671522124.112
Thin Spots67729410.70.33351077.07
Wrinkles763126 0.60.77861034.52
Notes: F. Drops: Filament Drops; * R P N : Risk Priority of F M E A ; ** E R P N : Risk Priority of Extended F M E A .
Table 5. Risk priorities based on R P N and E R P N .
No.Proposed SolutionsLine
1Regular check and maintenance of: mixer system, blower units, feeding units, suction units, power transmission units, pressurized air system, guide sensors, etc.1, 2
2Adjust torque and speed level depending upon the required weight of the fabric1, 2
3Check for the proper pressure levels in the indicator and level of oil1
4Correct speed regulation and consistent cleaning of the guide sensors1, 2
5Employ experienced labor and educate them about removing foreign particles2
6Maintain suitable torque depending upon the fabric and make adjustments if necessary1, 2
7Proper operation control using experienced manual labor2
8Regulate continuous flow of the coolant across the rollers1
9Regulate the speed and pressure setting depending upon the sheet’s required texture1, 2
10Repair and align the gap in between the rollers properly1
11Replace the tube lights for proper illumination and clean the lenses periodically2

