Article

China’s Input-Output Efficiency of Water-Energy-Food Nexus Based on the Data Envelopment Analysis (DEA) Model

School of Management Science and Engineering, Central University of Finance and Economics, Beijing 100081, China
*
Author to whom correspondence should be addressed.
Sustainability 2016, 8(9), 927; https://doi.org/10.3390/su8090927
Submission received: 3 July 2016 / Revised: 23 August 2016 / Accepted: 31 August 2016 / Published: 12 September 2016
(This article belongs to the Section Environmental Sustainability and Applications)

Abstract

:
An explanation and quantification of the water-energy-food nexus (WEF-Nexus) is important to advance our understanding of regional resource management, which is presently in its infant stage. Evaluation of the current states, interconnections, and trends of WEF-Nexus, in cities, has largely been ignored due to quantification hurdles and the lack of available data. Based on the interaction of WEF-Nexus with population system, economic system, and environmental system, this paper builds the input output index system at the city level. Using the input output index system, we evaluate the WEF-Nexus input-output efficiency with the data envelopment analysis (DEA) model. We regard the decision making unit as a “black box”, to explore the states and trends of WEF-Nexus. In the empirical study based on data from China, we compare the input-output efficiency of WEF-Nexus in 30 provinces across China, from 2005 to 2014, to better understand their statues and trends of the input-output efficiency holistically. Together with the Malmquist index, factors leading to regional differences in the fluctuation of input-output efficiency are explored. Finally, we conclude that the DEA model indicates the regional consumption of WEF resources in the horizontal dimension and the trends in vertical dimension, together with the Malmquist index, to explain the variations for proposing specific implications.

1. Introduction

Water, energy, and food (WEF) are the most important resources in social and economic systems. They not only meet human life’s basic needs, but they also play important roles in environmental protection [1]. Many studies show the importance of nexus research among these three resources on regional economic and social sustainability. The World Economic Forum defines the Water-Energy-Food Nexus (WEF-Nexus) as one of three important clusters of risk and emphasizes the serious unintended consequences resulting from strategies that focus on only one part of WEF-Nexus without considering its interconnection risks [1]. This research therefore studies the regional production and consumption of WEF as a whole and focuses on its interconnections, or nexus, to ensure the security of regional WEF resources.
The Hoff has introduced the holistic perspective in WEF research, but it is still in the infant stage [2]. The essential elements are the explanation of the internal interconnections and the quantification of these interconnections. There is a large body of literature on this subject. Some studies, using the case study method, explore the complex interconnections and core factors among the WEF-Nexus in varied regions [2,3,4] and illustrate the effects of the production and consumption of WEF resources on regional economic, social, and environmental systems [5,6]. Other research, using multivariate statistical analysis [7] and system dynamics [8], attempts to quantify the interconnections. This literature has contributed to our understanding of the complex interconnections. However, the significant weakness within the existing research is the methodological hurdle in WEF interconnection quantification. In addition, the existing quantification literature remains scarce [9]. The major trends in previous studies are case-study based empirical analyses using watersheds as the main research object [10,11]. Theoretical breakthroughs have been hard to achieve, although important advances have been made on the improvement of the immature nexus concept and framework [12,13], the understanding of regional sustainable development [6], and the tool of nexus platform for policy formation [14,15].
Recently developed benefit-cost analysis (BCA) and input-output analysis (IOA) have advanced our capability to study the economics of WEF resources. Utilizing the benefit-cost model (BCM), BCA focuses on the tradeoffs in the integration of WEF and the benefit-cost of government coordination, supported by decisions based on information from the micro level [16,17,18]. On the other hand, with input-output tables, IOA focuses on the economic and environmental impacts resulting from the consumption of WEF resources and has been successfully applied to single resource evaluations [19,20,21]. However, regional economic and environmental impact studies originating from the consumption of WEF resources are still rare.
The selection of the most appropriate, early stage research method remains a major concern among policy makers, NGOs, and research institutes. As such, research methods have become diversified. Endo summarized the quality and quantity of current research methods [18]. Quality research methods include: ontology engineering, questionnaire surveys, and integrated maps. Quantity research methods include: physical models, BCA, integrated indices, social network analysis, and optimization management models; but they should still incorporate multivariate statistics, multisector system analysis [3,22], system dynamics [23], and the Nexus Tool 2.0 [24]. Since there are difficulties in the quantification of WEF, evaluating the regional input-output efficiency from a holistic perspective would contribute to understanding the status and trends of the regional consumption of WEF resources, leading to better informed policy making, WEF security, and regional sustainability. Therefore, the method of data envelopment analysis (DEA) is the reasonable approach to not only evaluate regional input-output efficiency holistically [25,26], but also to select the best index in order to overcome hurdles in data collection and operate the DEA method in its best performance.
To address these gaps in the research, this paper explains the DEA model (Section 2), and then builds the input-output index system (Section 3). Our empirical analysis uses data from China (2005–2014) to examine the index system and DEA model. Results and Outcomes are presented in Section 4 followed by Discussion (Section 5), Conclusion and Suggestions for Future Research (Section 6).

2. The DEA Model

DEA [25] is a nonparametric technique for measuring the relative efficiencies of a set of decision-making units (DMUs) that consume multiple inputs to produce multiple outputs. Each DMU is regarded as a “black box” when employing the DEA method, which means that the function and weight of the input and output can be ignored, facilitating evaluation of the efficiencies in a holistic perspective. With its multiple characteristics, the external social economic and environmental systems can be integrated into the account. The most popular and widely used forms of the DEA model are the C2R model and the BC2 model.

2.1. The Essential Definition

Let us consider a set of DMUs { DMU j : j = 1 , 2 , , n } , where D M U j consumes multiple positive inputs x i j ( i = 1 , 2 ,   , m ) to produce multiple positive outputs y r j ( r = 1 , 2 ,   , s ) . x i j ( i = 1 , 2 ,   , m ) is the ith input factor of the j unit and which is the same with y r j ( r = 1 , 2 ,   , s ) . Suppose that inputs and outputs for D M U j are denoted by x j = ( x 1 j , x 2 j , , x m j ) T and y j = ( y 1 j , y 2 j , , y s j ) T and x j > 0 , y j > 0 ( j = 1 , 2 , , n ). Then v   and   u are the weight of the input and output vectors, respectively, for v = ( v 1 , v 2 , , v m ) T   a n d   u = ( u 1 , u 2 , , u s ) T . x 0   and   y 0 are, respectively, the input vector and the output vector of the evaluated unit D M U 0 and λ is the weight in dual form. The following models are all based on these definitions.

2.2. The C2R and BC2 Model

2.2.1. The C2R Model

There are multiple DEA models, each with different economic interpretations, but the C2R model is the first model of DEA. The input-C2R model, which means that the decision maker is trying to reduce input in the condition of constant output, is as follows:
max u T y 0 v T x 0 = V p I s . t .    u T y i v T x i 1 ,   j = 1 , 2 , , n v 0 ,   u 0
With Charnes-Cooper’s change [25], we can achieve the most popular form of the C2R model. That is where t = 1 v T x 0 ,   μ = t u   a n d   w = t v , the model is reformed into a linear programming model to solve as follows:
  Max μ T y 0 = V ( C 2 R ) I ( P C 2 R I ) { w T x j μ T y j 0 ,   j = 1 , 2 , , n w T x 0 = 1 μ 0 ,   w 0
This then follows its dual form:
  min θ ( D C 2 R I ) { j = 0 n λ j X j θ X j 0 j = 0 n λ j Y j Y j 0 λ j 0 ,   j = 0 , 1 , 2 , , n
Both Equations (2) and (3) have the optimal solution, and V C 2 R I 1 when:
(1)
If V C 2 R I = 1 , and w 0 > 0 ,   μ 0 > 0 in Equation (2), then DMU is DEA efficiency;
(2)
If V C 2 R I = 1 , then DMU is weak DEA efficiency; and
(3)
If V C 2 R I < 1 , then DMU is no DEA efficiency, which means that the DMU does not reach a proper ratio.
Constant returns to scale is an implied hypothesis in the C2R model. That is, all the DMUs are in their best production scale, together with constant scaling of input and output data, and the results of overall efficiency in every DMU. However, not all of the DMUs are in fact satisfied with the implied hypothesis in the C2R model. For example, in the WEF-Nexus system, the results of the ath input are not equal with ath output.

2.2.2. The BC2 Model

To overcome this flaw, Banker and Charnes et al. (1984) added constraints to the C2R model [25], building the BC2 model, which has another advantage in providing both overall efficiency, and technical and scaling efficiencies. In the BC2 model, the results of the ath input are not equal with the ath output, facilitating the application of the DEA method to the complex system, such as the WEF-Nexus system.
The constraint that added to the C2R model is a bound term in the weight of its dual form. That is j = 1 n λ j = 1 , Equation (5), but diagnosis of the DEA efficiency is done in the same way. The most popular form, and dual form of the BC2model, are displayed as follows:
  max ( μ T Y 0 μ 0 ) ( P C 2 R I ) { w T X j μ T Y j + μ 0 0 ,   j = 1 , 2 , , n w T X 0 = 1 μ 0 ,   w 0 ,   μ 0 E 1 ,
Then the dual form is:
  min θ ( D C 2 R I ) { j = 1 n λ j X j θ X 0 j = 1 n λ j Y j Y 0 j = 1 n λ j = 1 λ j 0 ,   j = 1 , 2 , , n , θ E 1
In order to apply the DEA method properly, all DMUs are homogeneous and the number of DMUs should not be less than twice the total number of indicators of the input and output index system.

2.3. The Malmquist Index Model

The Malmquist index model depicts the productivity with distance function. It assumes that there is a production possibility set S , like that shown in Equation (6). S represents the ability to achieve the transformation of x to y , and the point ( x , y ) in the S at which it can achieve the largest output y in every given input x is in the production frontier. With production possibility set S , the distance function in time t (1, 2, …, T) is shown in Equation (7).
S = { ( x ,   y ) x y }
D ( x ,   y ) = i n f { θ ( x , y / θ ) S } = ( sup { θ ( x , θ y ' ) S } ) 1
where: D ( x , y ) 1 , if and only if point ( x , y ) S ; and D ( x , y ) = 1 , if and only if point ( x , y ) is in the production frontiers.
So, the Malmquist index is defined as Equation (8).
M ( x t + 1 ,   y t + 1 , x t ,   y t ) = [ ( D t ( x t + 1 , y t + 1 ) D t ( x t , y t ) ) × ( D t + 1 ( x t + 1 , y t + 1 ) D t + 1 ( x t , y t ) ) ] 1 / 2
We have included two distance functions, D t and D t + 1 , in time t and t + 1, which vary in production technology. Equation (8) is constituted by two ratios. The first is the ratio in the distance function D t , between the most possible output with input in time t + 1 and its real output with the input time t. The second is the distance function D t + 1 , between the real output in t + 1 and the greatest possible output with the same input in time t.
If the Malmquist index value (M value) is larger than one, then the WEF input-output efficiency is rising. If the M value is less than one, the WEF input-output efficiency is declining.
The Malmquist index can be broken into efficiency change (EC) and technique change (TC), as shown in Equations (9) and (10), respectively. EC represents the change in relative efficiency from time t to time t + 1. When EC > 1, the efficiency is rising, largely due to the reform of the institute or the increase in production scale, which is not in a sustainable way. In addition, the EC can be subdivided into pure efficiency change (PC) and scale change (SC). TC is the movement in the production frontier in the period from time t to time t + 1, resulting from innovation or the application of new technology. When TC > 1, technical merit rises along with efficiency, which brings in sustainable economic growth.
EC = D t + 1 ( x t + 1 , y t + 1 ) D t ( x t , y t )
TC = ( D t ( x t + 1 , y t + 1 ) D t + 1 ( x t + 1 , y t + 1 ) × D t ( x t , y t ) D t + 1 ( x t , y t ) ) 1 / 2

2.4. Applicability of the DEA Model in WEF-Nexus

In the WEF-Nexus framework (Figure 1), lots of factors or drivers are interwoven, including WEF resources, climate change, environment, urbanization, and population [1,2]. The regional WEF-Nexus system therefore has multiple inputs and multiple outputs, on the one hand, and it is much more like a WEF black box, on the other hand, for it is hard to quantify the specific relationships in the Nexus system. Since the DEA model has been successfully applied to evaluate relative efficiency in varied areas [26,27,28], this system analysis method has advantages in addressing the “black box”, for it ignores specific complex relationships in the system, and the multi-inputs and multi-outputs system, as descripted above.

3. Input-Output Index System

3.1. Economic Implications of Input-Output Efficiency

The building of an input-output index system is based on the target evaluation of input-output efficiency. Since it is a relative concept, which means that different output indexes result in different efficiencies, there need to be strong interconnections between the input and output indexes. When it comes to the WEF-Nexus system, higher input-output efficiency means that the system can achieve larger output benefits with less WEF consumption and fewer environmental costs. In weak sustainability [29], resources are not the only focus of sustainable development, the human factor affects sustainable development either directly or indirectly because the population is the principle component in the sustainable development system and the continuum in production and consumption [30]. Since the security in water, energy, and food is interwoven with human, economic, and environmental sustainability [31,32], there is strong interdependence between the WEF-Nexus and the population system, economic system, and environmental system (Figure 1).
In the basic Cobb Douglas production function Y = Af(K,L), K and L are important input factors among which K represents capital and L is the labor force. f means the institutions, while A means the innovations or other factors which can also affect the output Y. Therefore, on the input side of this production function, we treat the consumption of WEF resources as K, and the permanent resident population as L, while on the output side, both the economy and environment are taken into consideration [33,34,35,36]. Furthermore, we determine the DEA efficiency to evaluate the input-output efficiency of WEF resources. Since innovation and management can both enhance efficiency [37], in the WEF-Nexus system we consider only the management approach to enhance efficiency, so Part A in the function has been taken into consideration. On the other hand, the key point of input-output efficiency is the human factor, which definitely needs to be enhanced, while the facilities are secondary. Therefore, the effective way is to focus on the human factor through resource governance in order to enhance input-output efficiency.

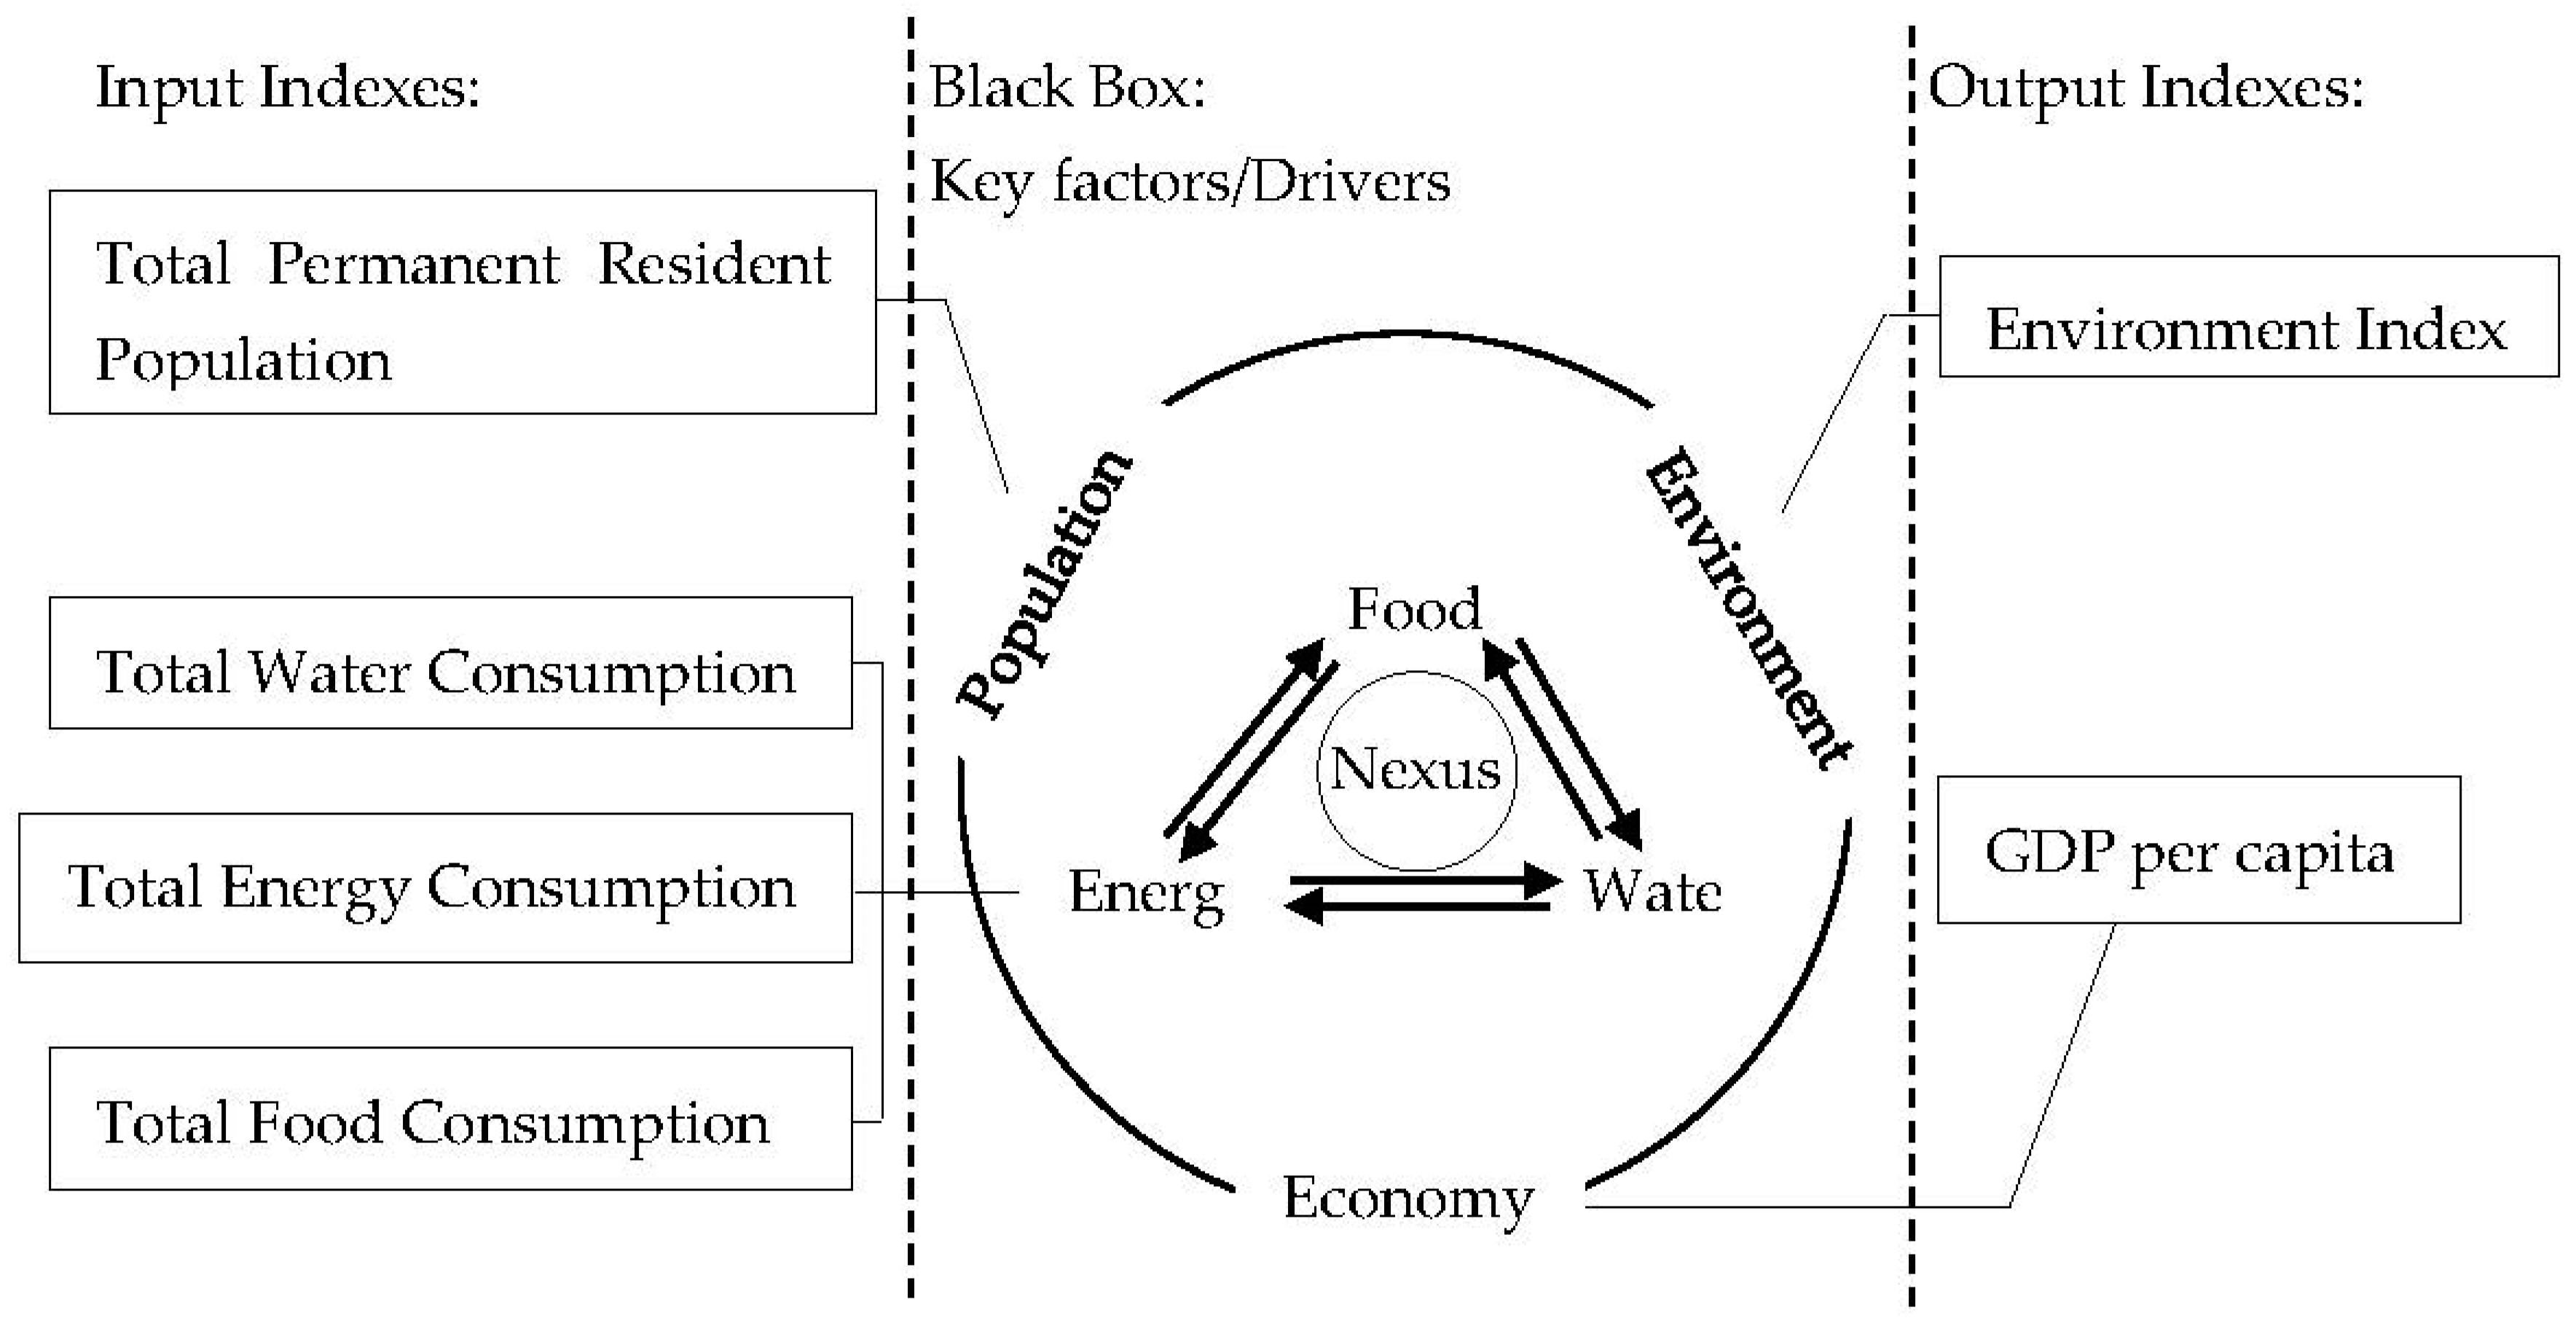
3.2. Selection of Input and Output Indexes

When we build the suitable index system, we select the most practical and effective input-output indexes, which are place specific. In practice, we take advantage of the available data. Figure 2 shows the sources of specific indexes in the WEF-Nexus framework.
Input indexes. Input indexes include both direct and indirect inputs. Direct input is the total amount of regional WEF consumption; that is, total water consumption, total energy consumption, and total food consumption. The indirect input is closely related to the output indexes and importantly, is also complementary to the direct input; that is, the permanent resident population.
Output indexes. Output indexes include the economy and environment, while considering the single input-output efficiency resources. We therefore consider both sides when evaluating the efficiency of WEF resources in the holistic perspective. On the economy side, although the consumption of WEF resources can enhance regional economic development, the goal of resource consumption is to improve the living standards of regional families. Gross domestic product (GDP) per capita is, therefore, a much better index than GDP itself. On the environment side, consumption of WEF resources inevitably generates waste that affects the security of the regional environment, including waste water, waste gas, and solid waste. To balance the input and output indexes, the environment output indexes should be weighted into the environment index.
With its place-specific characteristics, in the background of China, food for human consumption is the major consumptive approach [38], so total food consumption can be substituted by the expenditure of food consumption in China. On the environment side, the total waste water discharged, the volume of sulphur dioxide emissions, the volume of soot and dust emissions, and the total industrial solid wastes produced are selected to determine the environment index using the Entropy Method. Table 1 shows the index system.

3.3. Verification of the Validity in Index System

The validity of the input and output index systems is that the index system is satisfied with the DEA premise that there is no strong linear dependence among indexes. The trend graph, shown below, is a useful tool to compare the changing trends among indexes. With its differential units, standardization, and dimensionless form should be applied among the indexes. The Standardized Values (SV) of indexes are computed with Equation (11), in which x i j is the value of index j (j = 1, 2, …, 6) in the ith year (i = 1, 2, …, 10), that is, SV   = 100 * y i j . Figure 3 shows the validity of the index system in our Chinese case. Although they are all increasing in the input indexes, or fluctuating in the same pace in the output indexes, speed shows the greatest difference, which means that they are independent. With China’s one child policy, permanent resident population stays stable, which is similar to total water consumption because of its water scarcity. However, total energy consumption fluctuates in the same pace with GDP per capita, while environmental index is always rising with the nature of cumulative, and fluctuates in contrast to the total energy consumption and GDP per capita. The total food consumption rises stably in the period of 2005–2014. In addition, the strong interconnection in the consumption of WEF resources has been verified.

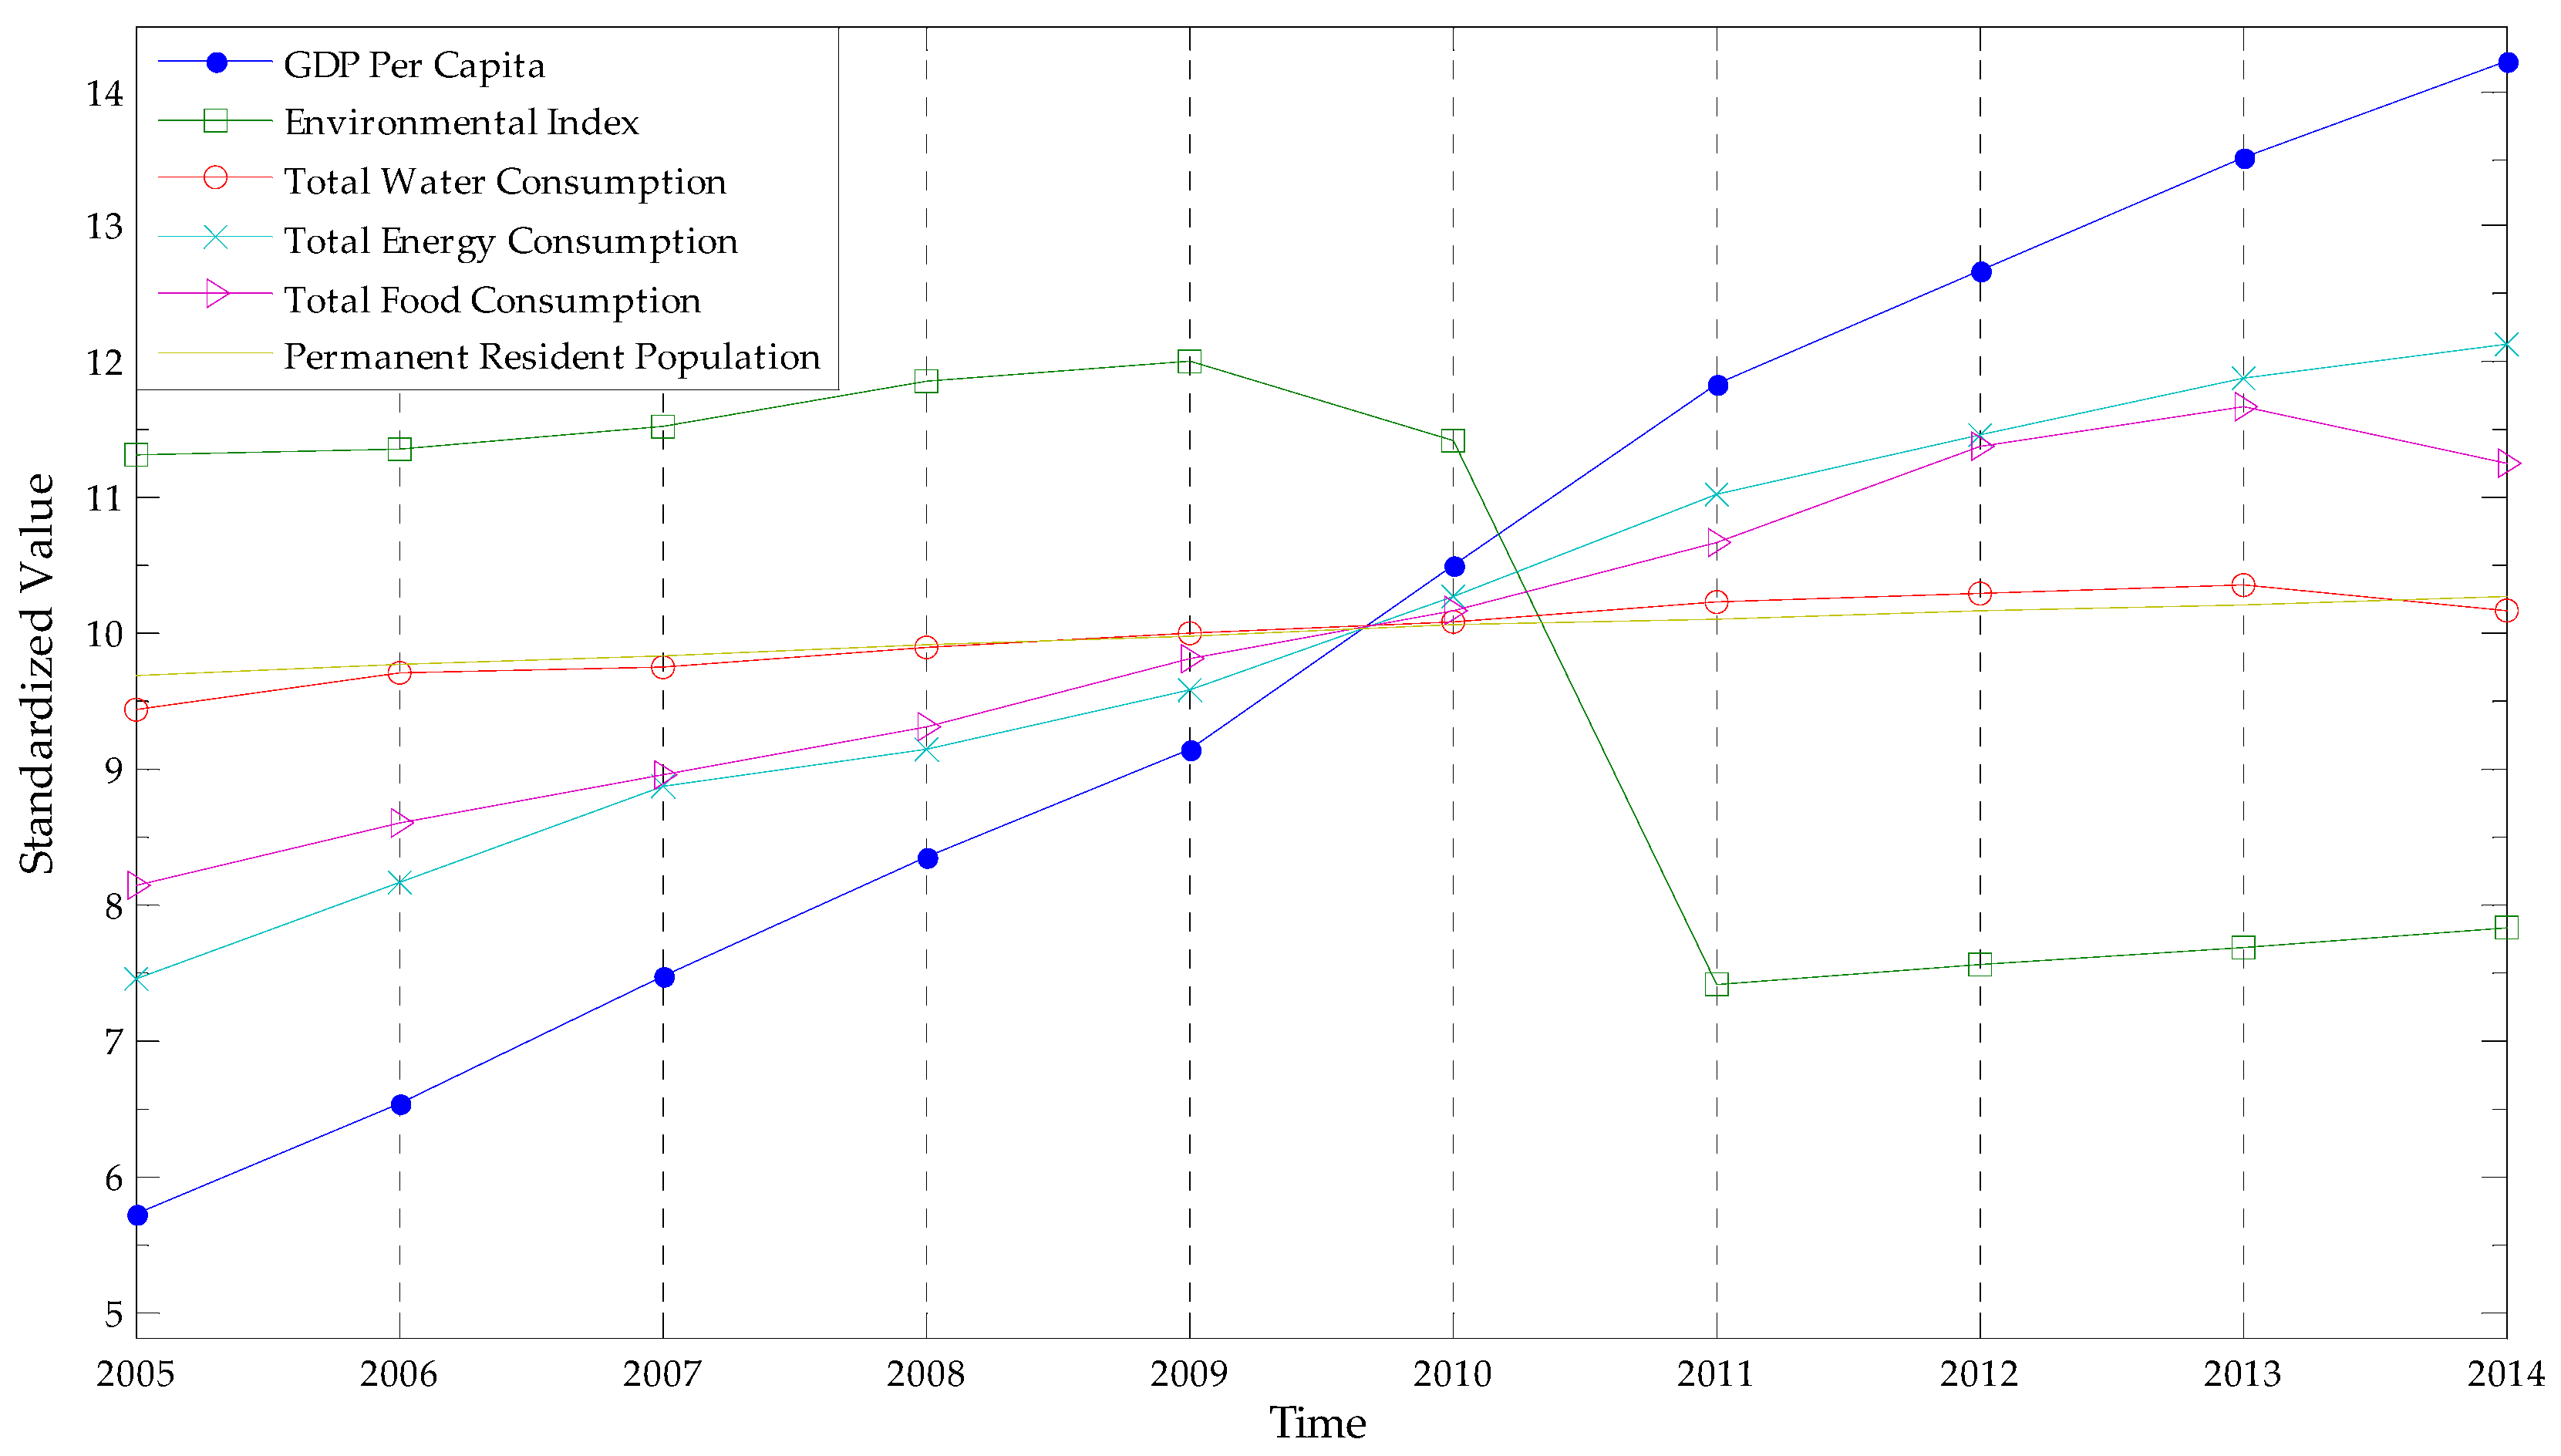
3.4. Data Preprocessing

With the primary data, we need to eliminate the inflation in monetary indexes and build the Environment Index with Entropy Method [39]. The true value is much more reliable than nominal value in the evaluation to compare the efficiency in varied years. With the base year and corresponding price index, we can achieve the true value with the primary data. However, it would be much more difficult in building the Environment index. First, index standardization, x i j is the value of index j (j = 1, 2, …, m) in the ith region (i = 1,2, …, n), Equation (11); Then, computing the entropy and weight of the jth index, Equation (12) and Equation (13); Finally, obtaining the Environment index in the ith region, Equation (14).
y i j = x i j i = 1 n x i j
f j = 1 l n   n i = 1 n y i j l n y i j
w j = 1 f j j = 1 m ( 1 f j )
p i = 1 j = 1 m y i j w j

4. Results and Outcomes

With primary data from the CHINA STATISTICAL YEARBOOK (2006 –2015), CHINA ENERGY STATISTICAL YEARBOOK (2013–2015) and some regional WATER RESOURCES BULLETINS (2006–2015), 30 provinces were selected, including four municipalities and four autonomous regions, excluding Tibet because of data deficiency, from 2005 to 2014. In the Win4Deap platform, the horizontal and vertical dimension efficiency of each region during this 10-year time period is calculated, and then with the Malmquist index, the fluctuation of the efficiency is explored.

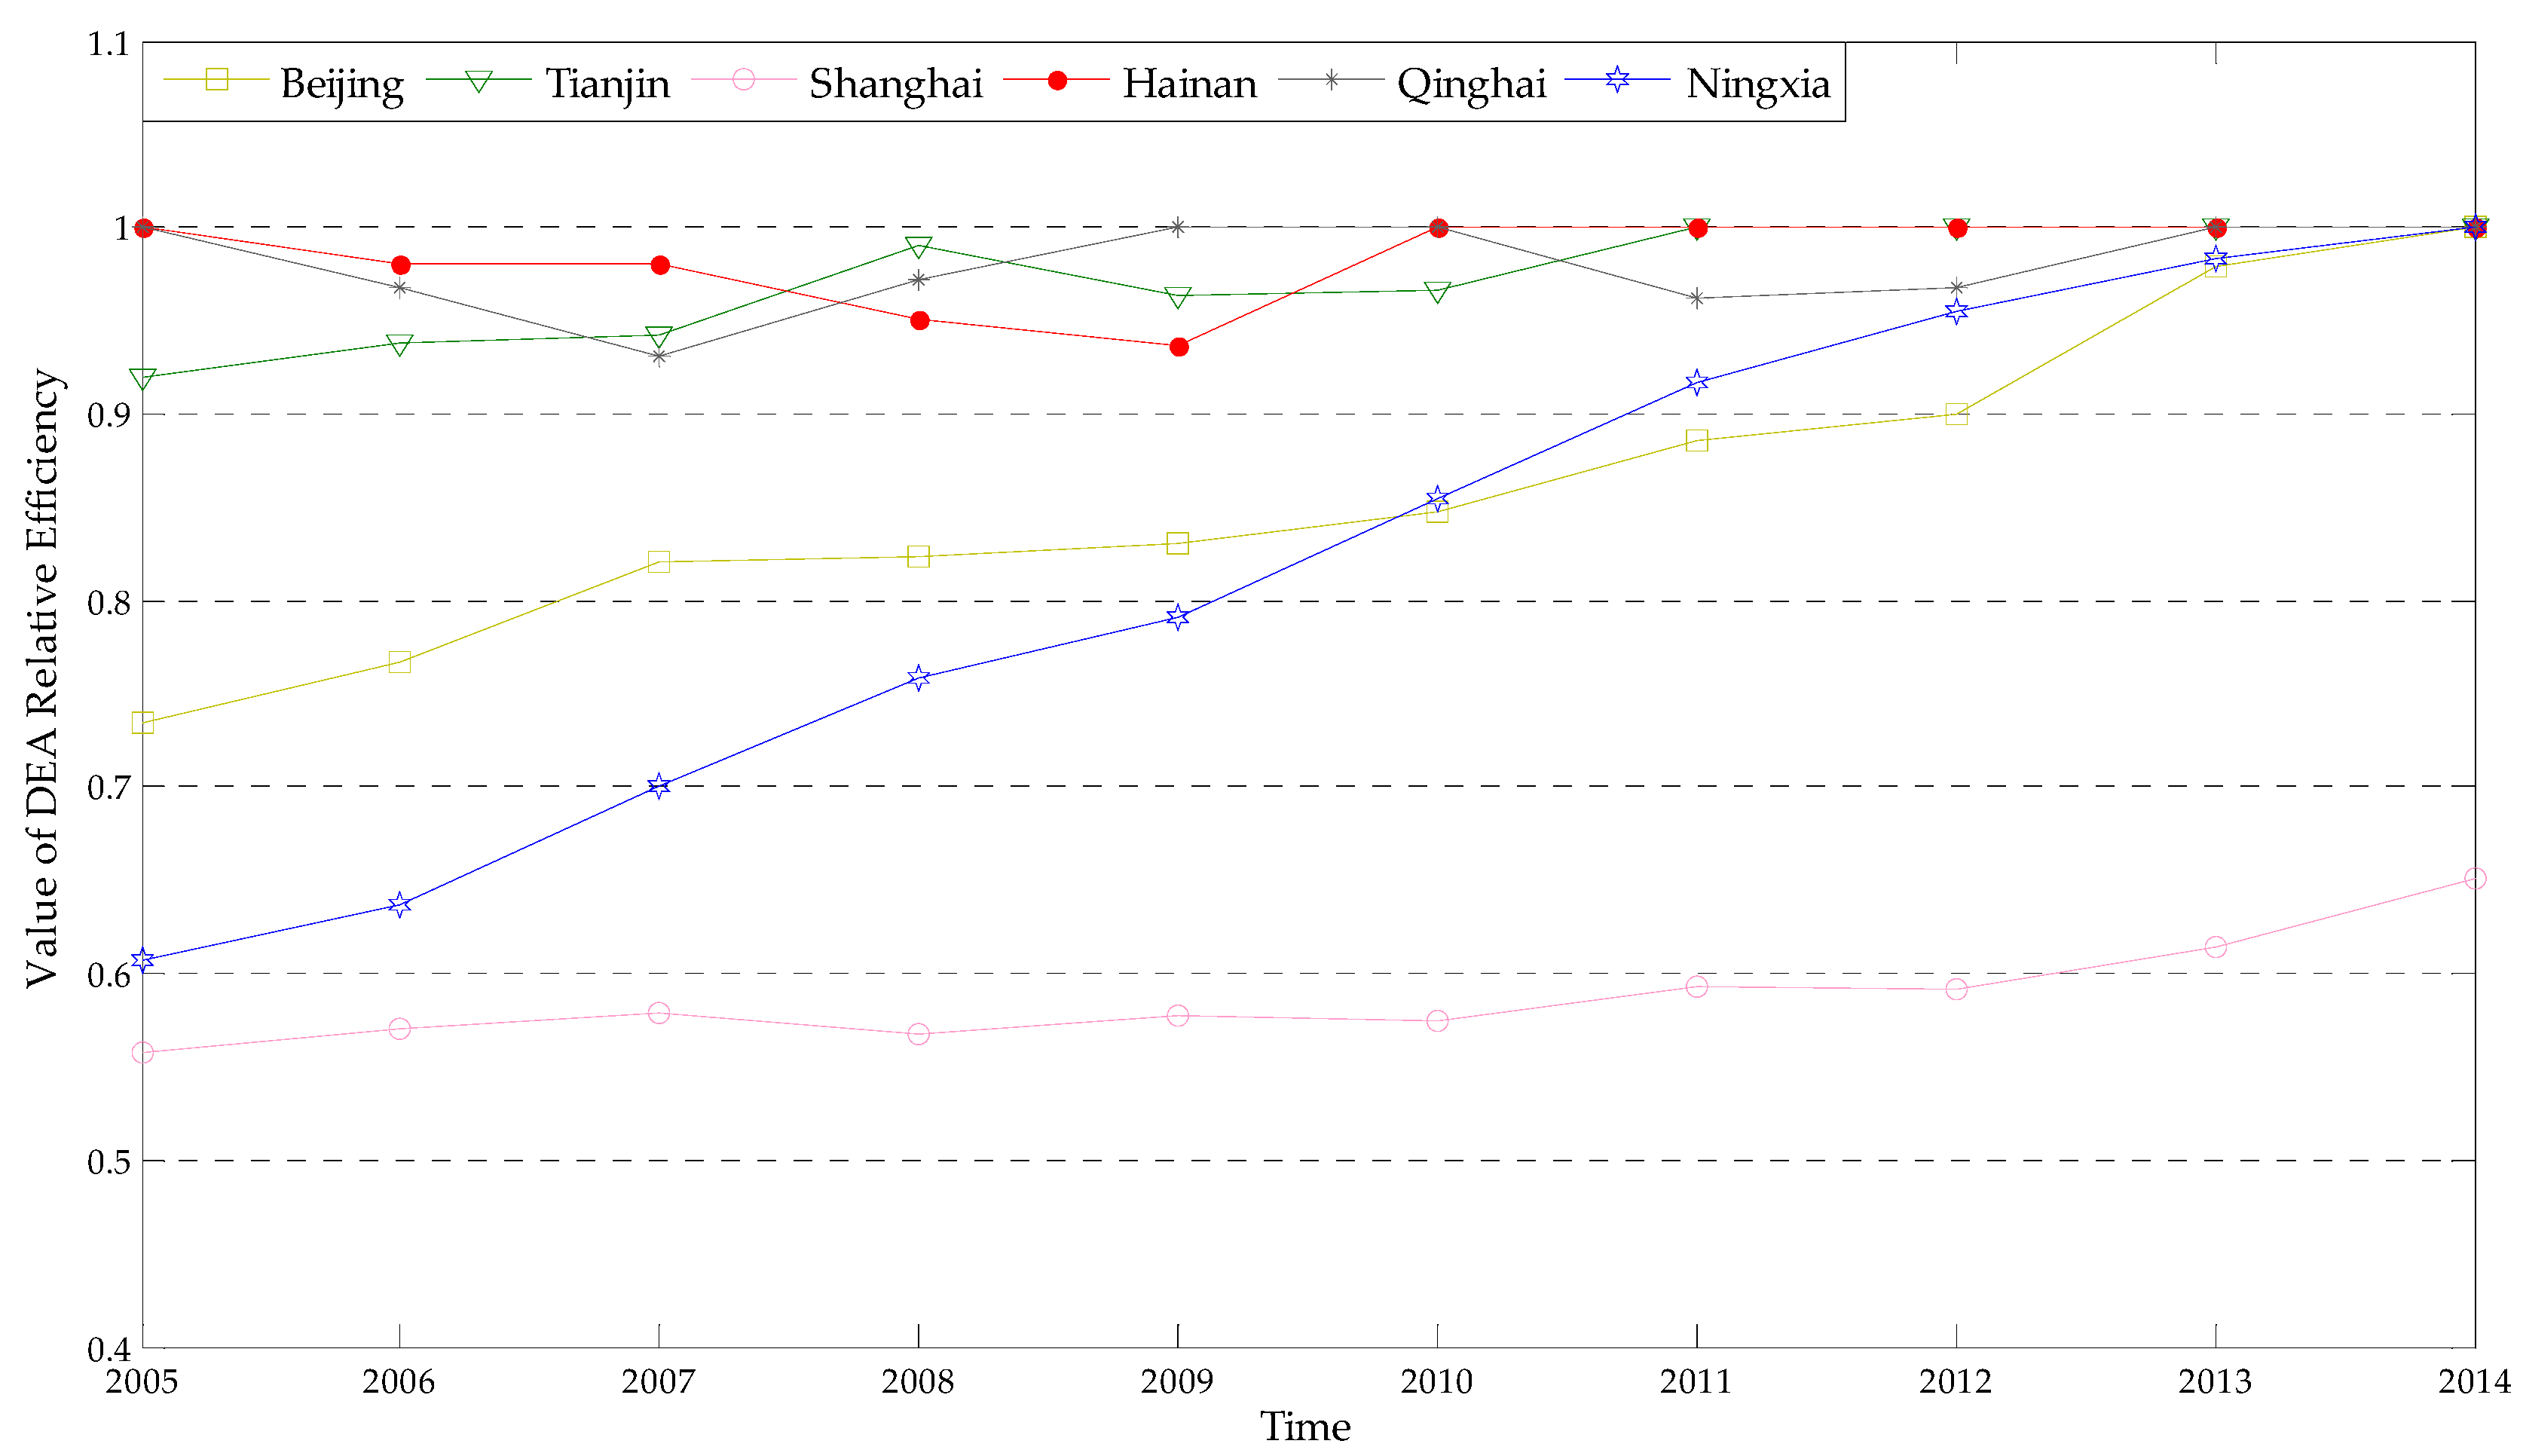
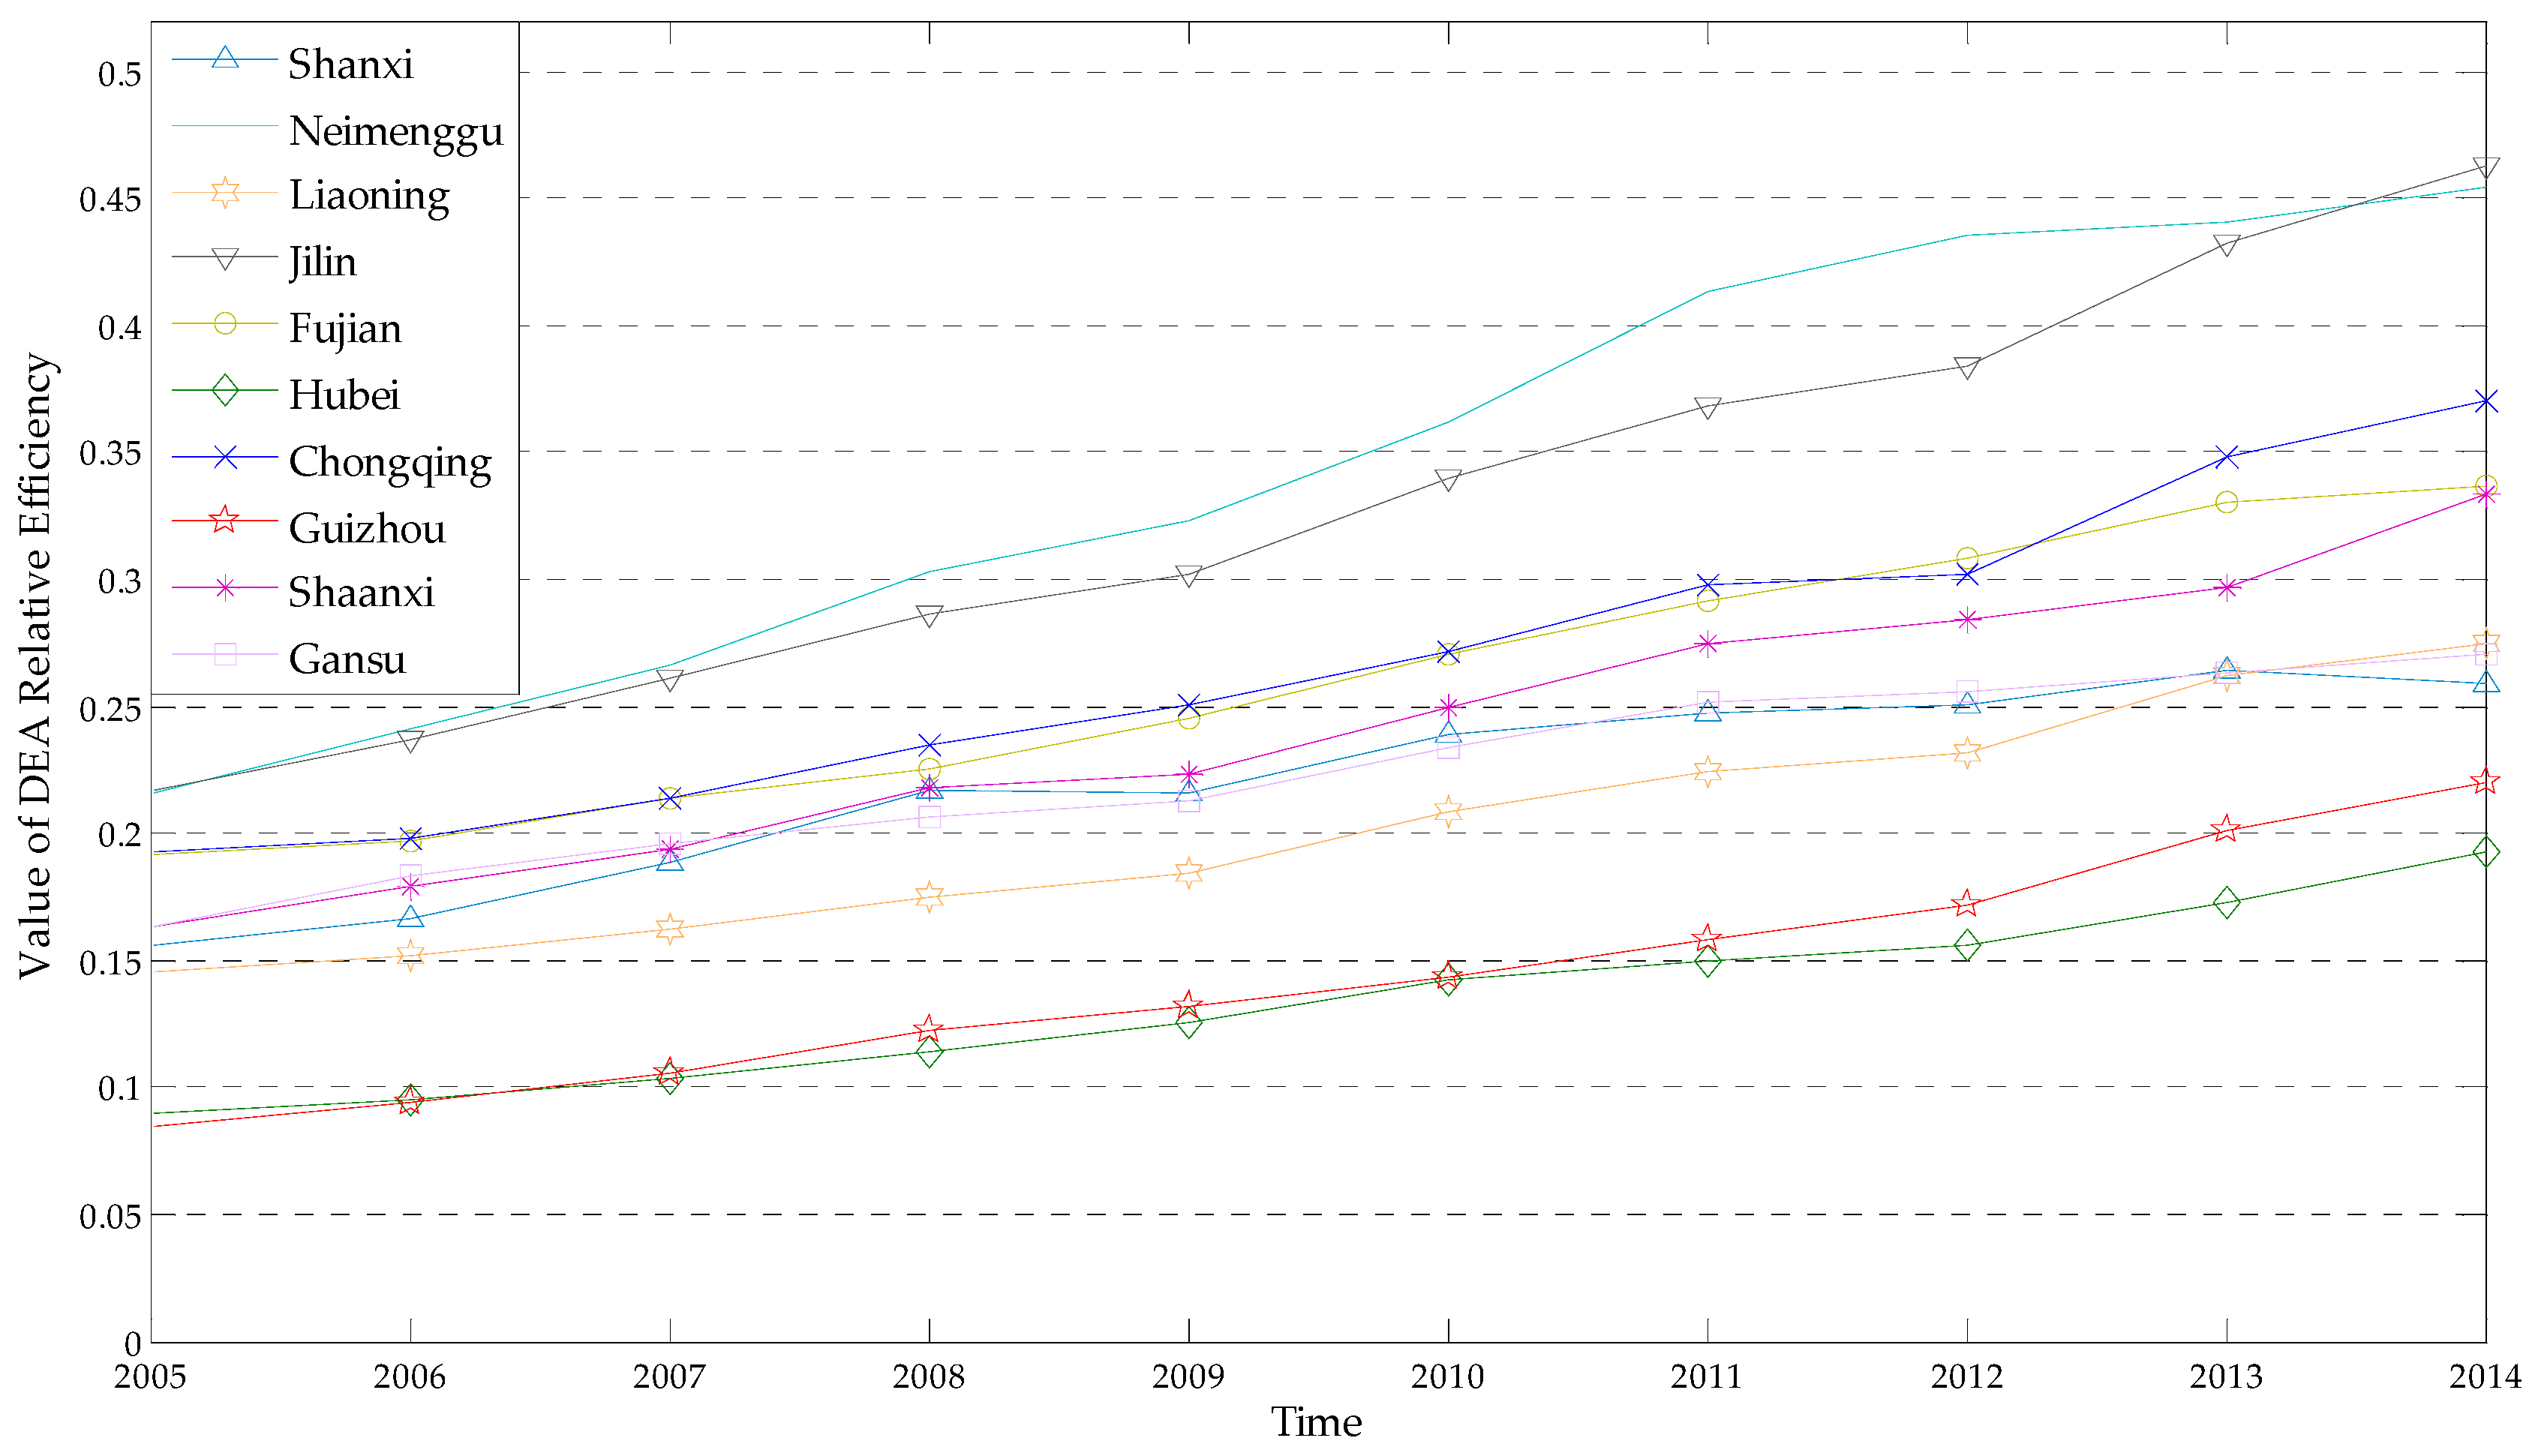
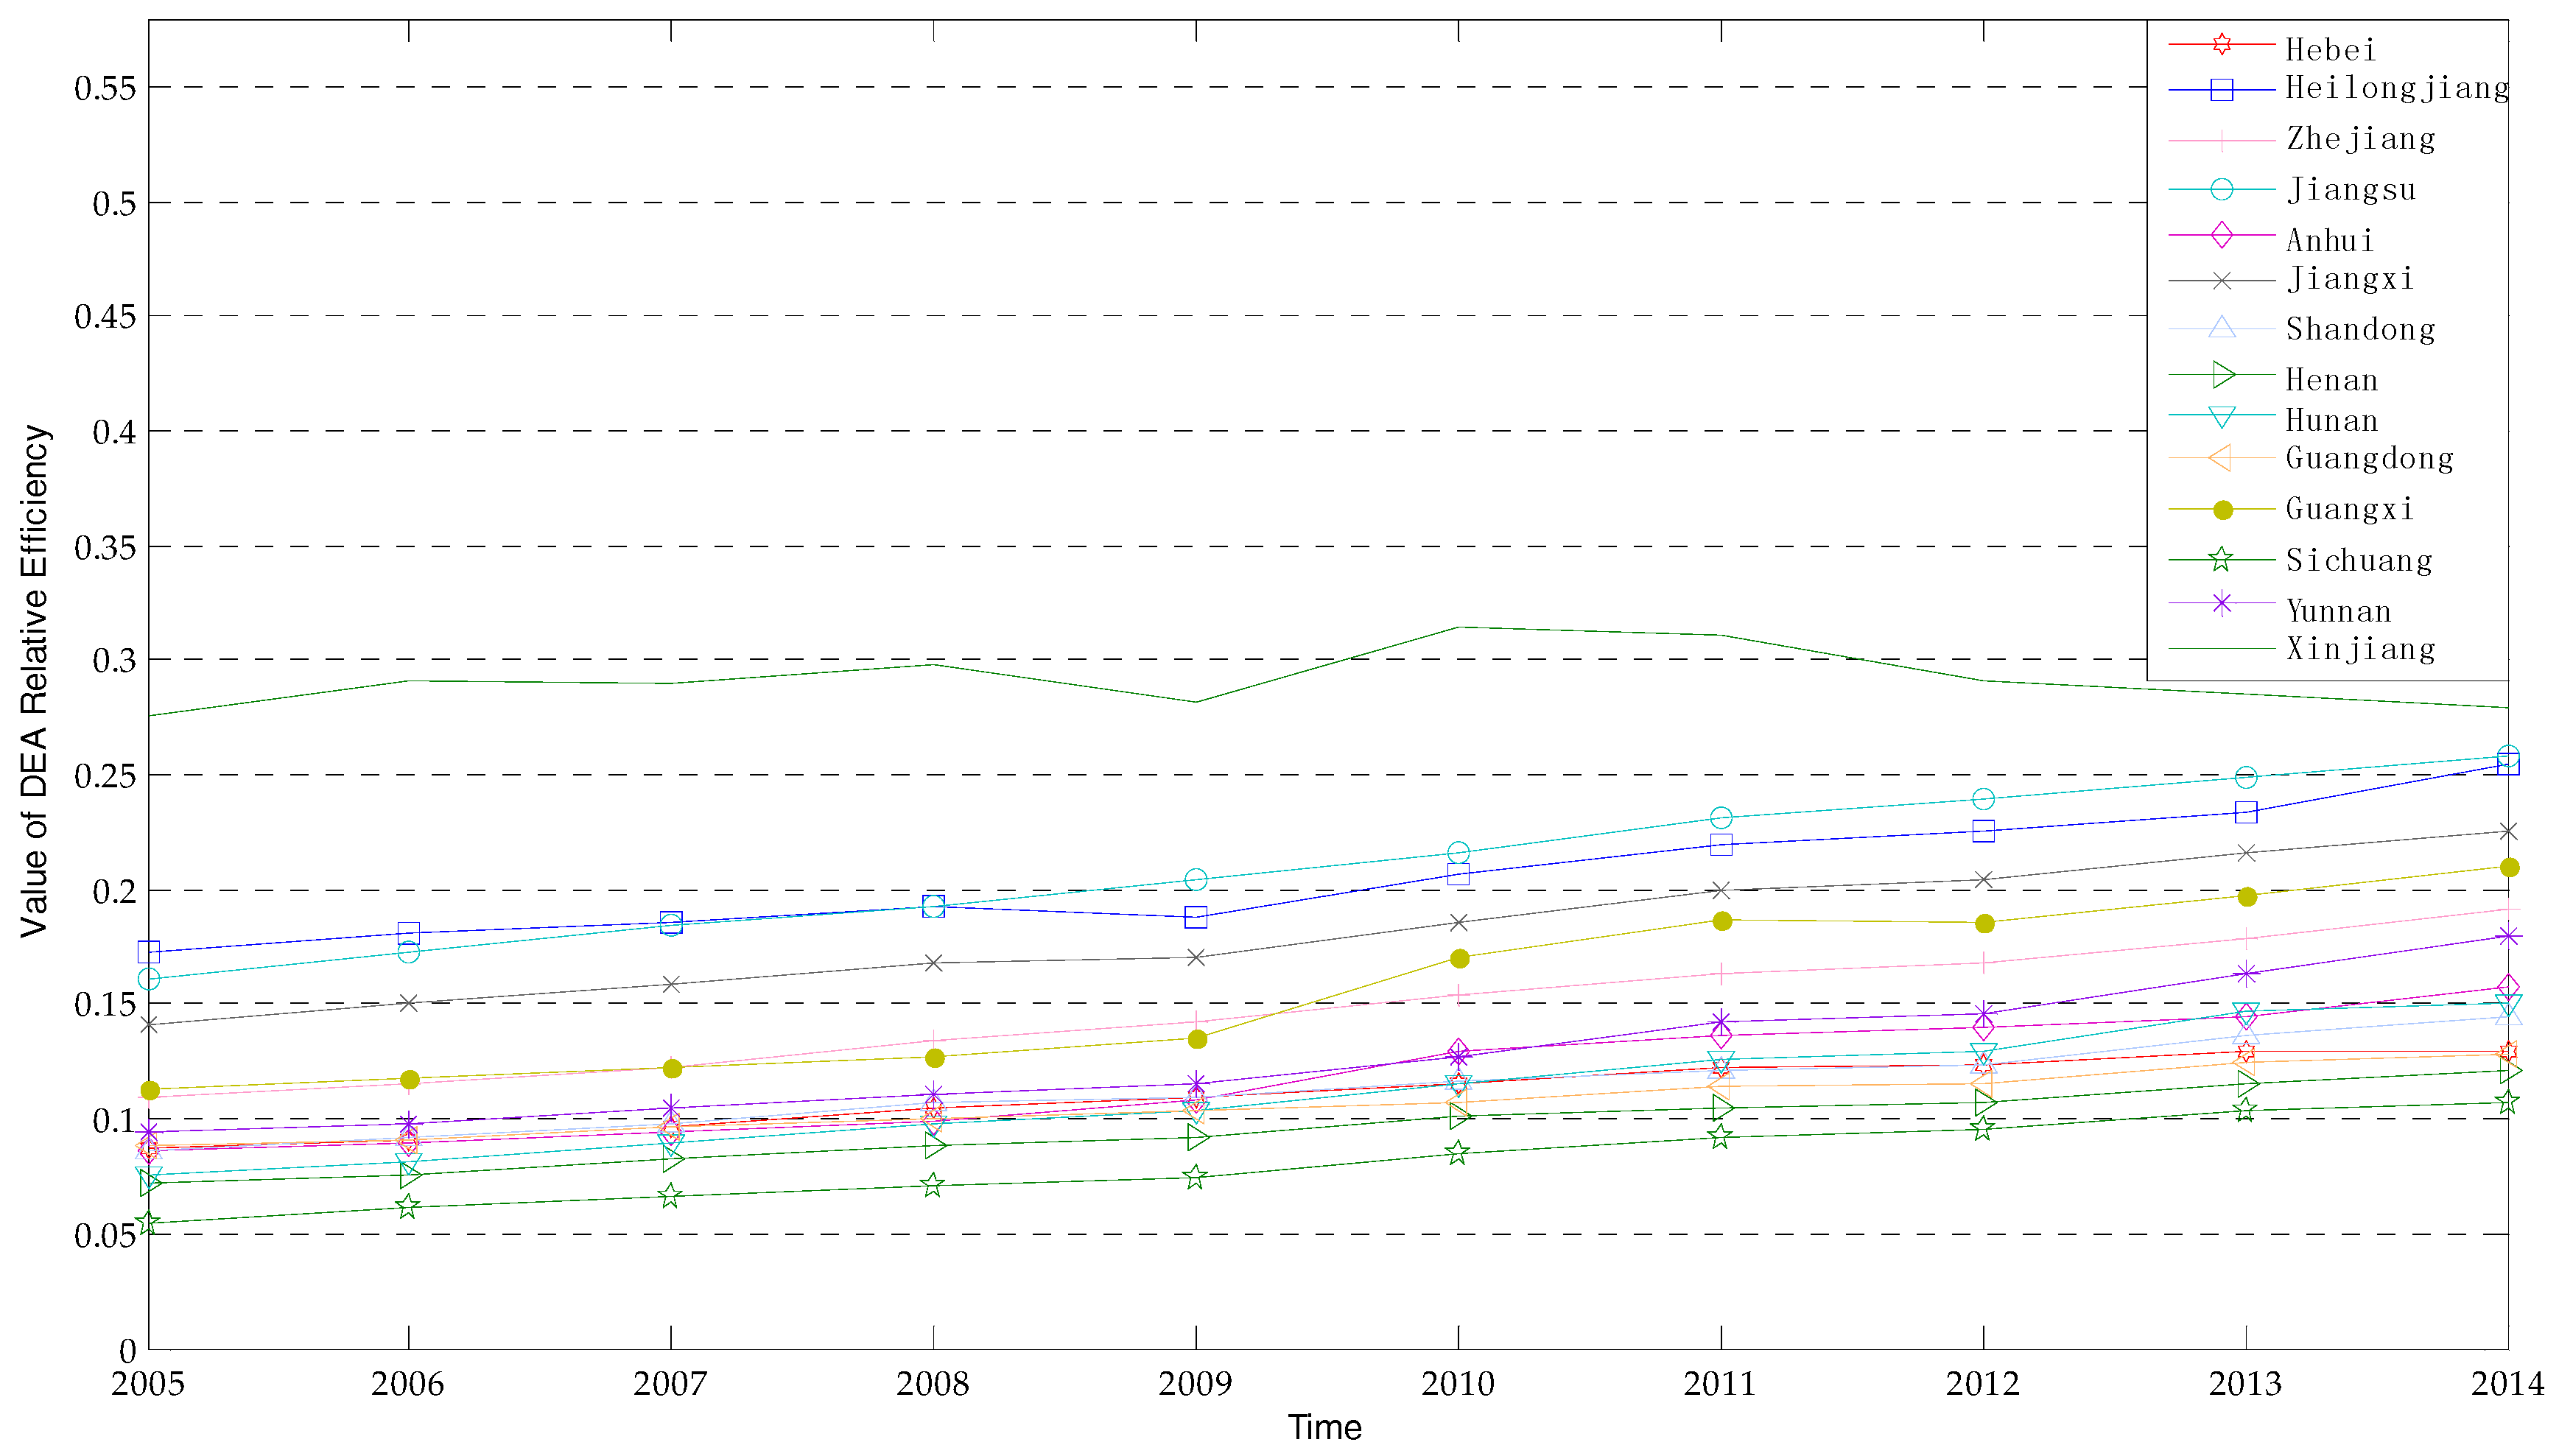
4.1. DEA Model Results

In the horizontal dimension, 10 production possibility sets (PPSs) are built, by year, and 30 DMUs are contained in each PPS. The results of efficiency are shown in Table 2. On one hand, the change of regional efficiency disparity is decreasing, during which the ratio between the maximum and minimum falls from 14 to 9, but the regions that achieved DEA efficiency (efficiency value = 1) is still a small number, which are: Beijing, Tianjin, Hainan, Qinghai, and Ningxia. Therefore, a large number of regions in China are still in a low level of characteristics of polarization. Both China’s less developing and developed regions are in high input-output efficiency, while the rapidly developing regions are at a low level. So, the current decentralized policies on WEF resources can enhance efficiency to some degree, but there is still room for improvement.
In the vertical dimension, one PPS is constructed, which contains 300 DMUs from 30 regions during 10 years. Table 3 shows the results of the trends from 2005–2014. Table 3 also shows that the input-output efficiency of all the regions, during this period, is increasing. This occurs because in each region the value variation has been magnified between 2005 and 2014 because it is larger than the variation in Table 2, but with different speeds that mainly result from the variations in development levels, policies, and in the natural environment. Based on its rising characteristics, 30 regions can be divided into three types: stable with high efficiency area, rapidly increasing with low efficiency area, and slowly increasing with low efficiency area.
The stable with high efficiency area (Figure 4). There are six regions in this area: Beijing, Tianjin, Shanghai, Ningxia, Hainan, and Qinghai that can be divided into two kinds of regions—developed regions and undeveloped regions. Beijing, Tianjin, and Shanghai are at the high economic development and urbanization level, which attracts skilled labor, capital, and advanced technologies. Through the adjustment and upgrading of its industrial structure, the input-output efficiency in these regions has been enhanced. In Beijing, for example, since the relocation of the Capital Steel Cooperation into Caofeidian, in Hebei province in 2005, Beijing has experienced rapidly rising WEF input-output efficiency and achieved DEA efficiency by optimizing its industrial structure and implementing innovation-driven strategies. To optimize its industrial structure and innovation- driven strategies to enhance WEF input-output efficiency, Shanghai has relocated many of its industries into cities in the Yangtze River Delta region. However, the latter three regions: Hainan, Qinghai, and Ningxia, which are representative of undeveloped regions, can also achieve DEA efficiency with a smaller population and fewer industries. This is enhanced largely due to the central government’s accurate policy support. In Ningxia, for example, which is a semi-arid region with scarce water but abundant coal resources [40], the goal of building the exemplary province on water-saving in social construction has promoted water saving irrigation technology since 2008, achieved food security with higher water efficiency [41], and stimulated rapid economic development. Although both the developed regions, Beijing and Tianjin, and undeveloped regions, Hainan, Qinghai, and Ningxia, achieved DEA efficiency and can also be exemplary regions, differences remain in working as exemplary regions. In the rapidly developing area, the developed one is much better and easier, while in the slowly developing area, the undeveloped one is better and easier, because of its similar development conditions and significant tradeoffs in environment.
Rapidly increasing with low efficiency area (Figure 5). There are 10 provinces in this area, mainly located in the Midwest and Northeast region, experiencing faster rising input-output efficiency. Industrial relocation from east to west would be facilitated by the adjustment and upgrading of their industrial structures, with industry and advanced technology shifting from the eastern provinces and presumably achieving DEA efficiency in this area in the near future. This area would therefore be the ideal area on pilot WEF integrated strategy, which could enhance the cross-sector governance ability to achieve faster rising of its input-output efficiency.
Slowly increasing with low efficiency area (Figure 6). There are 14 provinces in this area, mainly located in coastal and border regions, and their rising in input-output efficiency is slow or fluctuating like Xinjiang. Coastal developed provinces, such as like Guangdong, Jiangsu, and Zhejiang, and Coordinated Development Areas, like Hebei, should adjust and upgrade their industrial structures to enhance efficiency. However, border regions like Guangxi, Yunnan, and Heilongjiang, should obtain accurate policy support from the central government to facilitate their development, protect the environment, and simultaneously achieve DEA efficiency.

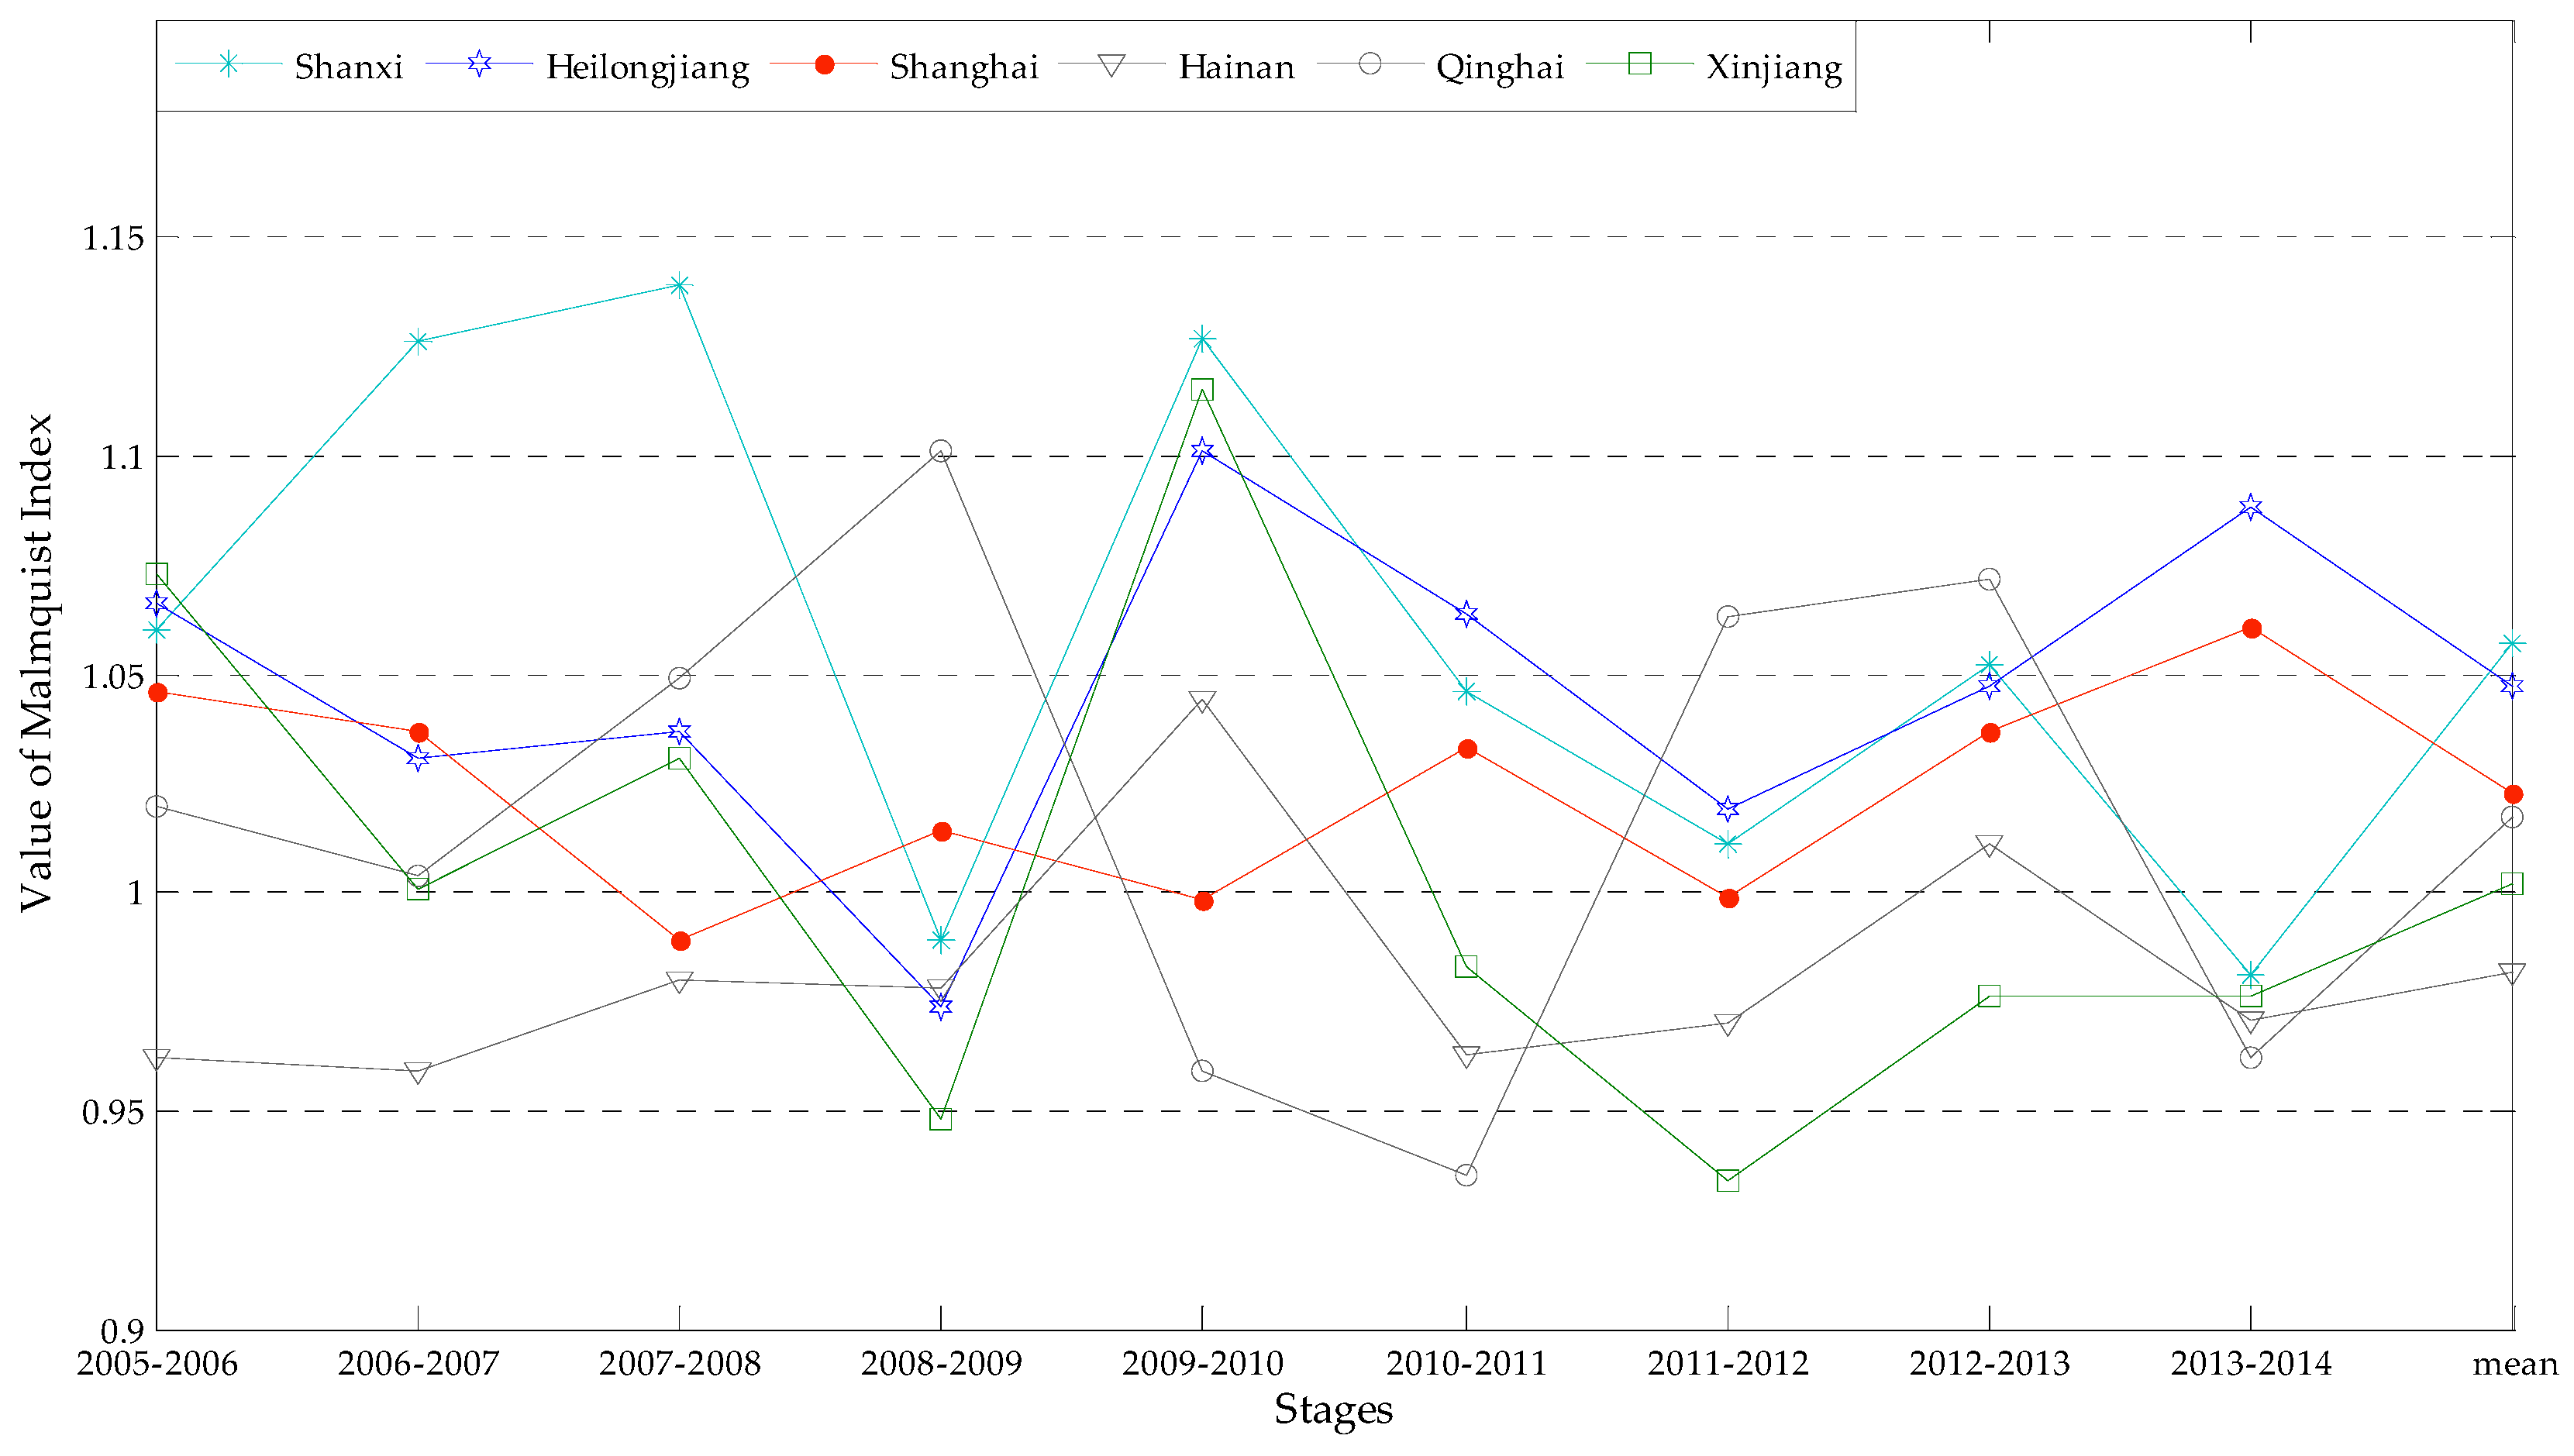
4.2. Malmquist Index Results

With the division of the Malmquist index value (M value) into the TC and EC values, we further explore reasons for the fluctuation of efficiency in varied regions. Results show that the M value of most regions is greater than one, which means that their input-output efficiencies are all rising, conforming to our earlier results using the DEA Model; but there are still some regions, including Shanxi, Heilongjiang, Shanghai, Hainan, Qinghai, and Xinjiang, with an M value less than one in some years, which means that their efficiency is decreasing during the 9 stages in the period of 2005–2014 (Figure 7). Among these six provinces, only Shanxi and Heilongjiang are mainly in the 2008–2009 stage, which is impacted by external events. Because the 2008 financial crisis has shocked their industrial structures, which are dominated by the coal industry, the decline on coal sales leads to decreasing of GDP, and finally affects the input-output efficiency. So the fluctuation of latter ones except Shanxi and Heilongjiang should be divided.
In Shanghai city, the division of the M value shows that its EC value in most stages is less than one (Table 4), while the TC value is greater than one. Shanghai city has therefore not achieved its maximum output in constant technology. Furthermore, the division on its EC value shows that in most stages the SC value is less than one. To enhance Shanghai’s WEF input-output efficiency, the focus should be on enlarging the productive scale.
The division of M values in Hainan and Qinghai shows that their EC values are all larger than one, while TC values are not (Table 5). The reason for their fluctuations is, therefore, the hurdle in technology. These regions should promote regional techniques, introduce new techniques and importantly implement an innovation driven strategy; but in Xinjiang, the division of its M value shows that most of its EC values are less than one (Table 5) and the subdivision of its EC value shows that its PC values are less than one in most stages. So to enhance its WEF input-output efficiency, Xinjiang should focus on institutional reform to maximize output.

5. Discussion

Analyzing Chinese primary data, we successfully apply the DEA model and Malmquist index model with the input-output index system to evaluate the WEF input-output efficiency. Although results conform to Chinese actual situations, which the input-output efficiency is rising, some results are different from the evaluation of a single resource.
In the horizontal dimension, there is a regional difference in WEF input-output efficiency, which is the same result obtained when evaluating a single resource [33]. However, the DEA efficiency on WEF appears not only on rapid development regions with high GDP per capita, but also on undeveloped regions with low total GDP and better ecological environments. There is a conflict here between the efficiency on WEF and the single resource. For example, the DEA efficiency on water resources has only appeared in the rapid development regions with high total GDP [42], because these regions have always gathered large amounts of capital, technology, and skilled labor. As such, there are interconnections between WEF necessitating a holistic evaluation of WEF resources.
In the vertical dimension, China’s WEF input-output efficiency rose annually from 2005–2014, which conforms with the evaluation on a single resource. For example, the efficiency on energy resources was rising during the period 2000–2010 [43]. Policies on single resources can enhance efficiency on WEF, but many regions with low efficiency and low speed have indicated that the effect on WEF efficiency from a single resource policy is limited. So, to enhance the WEF input-output efficiency and achieve governance across sectors, integrated resource management should be implemented.
Finally, utilizing the Malmquist index, factors leading to regional differences in the fluctuation of input-output efficiency are explored. On the one hand, regional industrial structure has always been a main factor in the fluctuation, so the adjustment and optimization of the industrial structure can enhance WEF input-output efficiency, like the developed regions Beijing and Tianjin. On the other hand, innovation (or technical level) is another factor that has a significant effect on efficiency. The innovation (or technical level) in the Malmquist index is not aimed at a new technology, but rather refers to the average level in the region. Education and relocation of industry are necessary in order to improve average regional technical levels.

6. Conclusions and Suggestions for Future Research

Explanation and quantification of the WEF-Nexus is significant to the development of WEF-Nexus research. Presently, the explanation of interconnections in WEF-Nexus is limited to the qualitative approach. We acknowledge that hurdles remain in the quantification method, but our exploration of the status of regional WEF input-output efficiency—using DEA—broadens this research method and facilitates decision making. Since the data available on regional WEF resources is a major hurdle on WEF-Nexus quantification, we built an index system at the local level. This index system is particularly suitable at the provincial or state levels, because their data is much more comprehensive than the regional or global level. With the DEA model, we can compare varied regions in a horizontal dimension to better understand their statues on the one hand, and in a vertical dimension to learn about their trends during constant periods. Finally, with the Malmquist index, we can explore the variations and pose specific implications on enhancing WEF input-output efficiency. The interconnections of WEF resources, however, are still the central issue. Although limited by the availability of data, the DEA method facilitates increased understanding of the current status of regions.
However, the construction of theoretical framework in WEF-Nexus research is the core issue, and the DEA method is an important part in the theoretical framework. On the other hand, with the index system and specific indexes, integrating data that currently operates at different spatial and temporal scales is another promising issue.

Acknowledgments

The authors gratefully acknowledge the financial support received from the Chinese National Science Fund (Grant No. 71473285, 71301175) and the Fundamental Research Funds for the Central Universities. Acknowledgements are also addressed to two anonymous reviewers for their valuable comments, which substantially improved the quality of this paper.

Author Contributions

Guijun Li designed the research; all authors conducted the DEA model and wrote the paper.

Conflicts of Interest

The authors declare no conflict of interest.

References

  1. World Economic Forum. Global Risks 2011 Report, 6th ed.; World Economic Forum: Cologne, Germany, 2011. [Google Scholar]
  2. Hoff, H. Understanding the Nexus: Background Paper for the Bonn 2011 Conference: The Water, Energy and Food Security Nexus; Stockholm Environment Institute: Stockholm, Sweden, 2011. [Google Scholar]
  3. Howells, M.; Hermann, S.; Welsch, M.; Bazilian, M.; Segerstrom, R.; Alfstad, T.; Gielen, D.; Rogner, H.; Fischer, G.; Van Velthuizen, H.; et al. Integrated analysis of climate change, land-use, energy and water strategies. Nat. Clim. Chang. 2013, 3, 621–626. [Google Scholar] [CrossRef]
  4. Ringler, C.; Bhaduri, A.; Lawford, R. The nexus across water, energy, land and food (WELF): Potential for improved resource use efficiency. Curr. Opin. Environ. Sustain. 2013, 5, 617–624. [Google Scholar] [CrossRef]
  5. Wong, J.L. The Food-Energy-Water Nexus: An Integrated Approach to Understanding China’s Resource Challenges. Harv. Asia Quart. 2010, 12, 15–19. [Google Scholar]
  6. Foran, T. Node and Regime: Interdisciplinary analysis of water-energy-food nexus in the Mekong region. Water Altern. 2015, 8, 665–674. [Google Scholar]
  7. Gulati, M.; Jacobs, I.; Jooste, A.; Naidoo, D.; Fakir, S. The water-energy-food security nexus: Changes and opportunities for food security in South Africa. Aquat. Procedia 2013, 1, 150–164. [Google Scholar] [CrossRef]
  8. Sahin, O.; Stewart, R.A.; Richards, R.G. Addressing the water-energy-climate nexus conundrum: A system approach. In Proceedings of the 7th International Congress on Environment Modelling and Software, San Diego, CA, USA, 15–19 June 2014.
  9. Chang, Y.; Li, G.; Yao, Y.; Zhang, L.; Chang, Y. Quantifying the Water-Energy-Food Nexus: Current Status and Trends. Energies 2016, 9, 1–17. [Google Scholar] [CrossRef]
  10. Keskinen, M.; Someth, P.; Salmivaara, A.; Kummu, M. Water-Energy-Food Nexus in a Transboundary River Basin: The Case of Tonle Sap Lake, Mekong River Basin. Water 2015, 7, 5416–5436. [Google Scholar] [CrossRef]
  11. Karabulut, A.; Egoh, B.N.; Lanzanova, D.; Grizzetti, B.; Bidoglio, G.; Pagliero, L.; Bouraoui, F.; Aloe, A.; Reynaud, A.; Maes, J.; et al. Mapping water provisioning services to support the ecosystem-water-food-energy nexus in the Danube river basin. Ecosyst. Serv. 2016, 17, 278–292. [Google Scholar] [CrossRef]
  12. Allouche, J.; Middleton, C.; Gyawali, D. Technical veil, hidden politics: Interrogating the power linkages behind the nexus. Water Altern. 2015, 8, 610–626. [Google Scholar]
  13. Mohtar, R.H.; Daher, B. Water-energy-food nexus framework for facilitating multi-stakeholder dialogue. Water Int. 2016. [Google Scholar] [CrossRef]
  14. Mohtar, R.H.; Lawford, R. Present and future of the water-energy-food nexus and the role of the community of practice. J. Environ. Stud. Sci. 2016, 6, 192–199. [Google Scholar] [CrossRef]
  15. Scott, C.A.; Kurian, M.; Wescoat, J.L., Jr. The Water-Energy-Food Nexus: Enhancing Adaptive Capacity to Complex Global Challenges. In Governing the Nexus: Water, Soil and Waste Resources Considering Global Change; Kurian, M., Ardakanian, R., Eds.; Springer International Publishing: Cham, Switzerland, 2015; pp. 15–38. [Google Scholar]
  16. Larson, D.F. Introducing water to an analysis of alternative food security policies in the Middle East and North Africa. Aquat. Procedia 2013, 1, 30–43. [Google Scholar] [CrossRef]
  17. Soliev, I.; Wegerich, K.; Kazbekov, J. The Costs of Benefit Sharing: Historical and Institutional Analysis of Shared Water Development in the Ferghana Valley, the Syr Darya Basine. Water 2015, 7, 2728–2752. [Google Scholar] [CrossRef]
  18. Endo, A.; Burnett, K.; Orencio, P.M.; Kumazawa, T.; Wada, C.A.; Ishii, A.; Tsurita, I.; Taniguchi, M. Methods of the Water-Energy-Food Nexus. Water 2015, 7, 5806–5830. [Google Scholar] [CrossRef]
  19. Liao, H.C.; Dong, Y.M. Utilization efficiency of water resources in 12 western provinces of China based on the DEA and Malmquist TFP index. Resour. Sci. 2011, 33, 273–279. [Google Scholar]
  20. Qiu, L.; Shen, Y.M.; Ren, W.B.; Yan, T.T. Analysis on regional disparity and its influential factors of energy utilization efficiency in China. J. Nat. Resour. 2008, 28, 920–929. [Google Scholar]
  21. Haie, N. Sefficiency (sustainable efficiency) of water-energy-food entangled systems. Int. J. Water Resour. Dev. 2015. [Google Scholar] [CrossRef]
  22. Walker, R.V.; Beck, M.B.; Hall, J.W.; Dawson, R.J.; Heidrich, O. The energy-water-food nexus: Strategic analysis of technologies for transforming the urban metabolism. J. Environ. Manag. 2014, 141, 104–115. [Google Scholar] [CrossRef] [PubMed]
  23. Mi, H.; Zhou, W. The system simulation of China’s grain, fresh water and energy demand in the next 30 years. Popul. Econ. 2010, 31, 1–7. [Google Scholar]
  24. Daher, B.T.; Mohtar, R.H. Water-energy-food (WEF) nexus tool 2.0: Guiding integrative resource planning and decision-making. Water Int. 2015, 40, 748–771. [Google Scholar] [CrossRef]
  25. Wei, Q.L. Data Envelopment Analysis; Science Press: Beijing, China, 2004; pp. 2–20. [Google Scholar]
  26. Li, Z.F.; Li, Y.L. An empirical study on performance evaluation of infrastructure investment of China based on DEA method from 2003 to 2007. J. Syst. Manag. 2009, 18, 309–315. [Google Scholar]
  27. Cooper, W.W.; Seiford, L.M.; Tone, K. Data Envelopment Analysis; Kluwe Academic Publishers: Boston, MA, USA, 2000. [Google Scholar]
  28. Chen, Y.W. Evaluation on the efficiency of the input and output of science and technology based on composite DEA and Malmquist Index. Oper. Res. Manag. Sci. 2011, 20, 196–204. [Google Scholar]
  29. Liu, H.M.; Deng, J.G. Review on the two paradigms of research on sustainable development theory. Econ. Rev. 2010, 20, 874–907. [Google Scholar]
  30. Zeng, Z.X.; Gu, P.L. System Analysis and Evaluation on Sustainable Development; Science Press: Beijing, China, 2000. [Google Scholar]
  31. Bhaduri, A.; Ringler, C.; Dombrowski, I.; Mohtar, R.; Scheumann, W. Sustainability in the water-energy-food nexus. Water Int. 2015, 40, 723–732. [Google Scholar] [CrossRef]
  32. Ferroukhi, R.; Nagpal, D.; Lopez-Peña, A.; Hodges, T.; Mohtar, R.H. Renewable Energy in the Water, Energy & Food Nexus; International Renewable Energy Agency (IRENA): Abu Dhabi, United Arab Emirates, 2015. [Google Scholar]
  33. Qian, W.J.; He, C.F. China’s regional difference of water resource use efficiency and influencing factors. China Popul. Resour. Environ. 2011, 11, 54–60. [Google Scholar]
  34. Li, G.P.; Guo, J. The study of the ecological environment restoration in energy-rich region. China Popul. Resour. Environ. 2013, 23, 42–48. [Google Scholar]
  35. Shi, P.H.; Fang, C.L.; Chen, T.B. Sustainable development: grain production, natural resource and environment in China. China Popul. Resour. Environ. 1998, 8, 69–74. [Google Scholar]
  36. Liu, C.M.; Wang, H.R. An analysis of the relationship between water resources and population-economy-society-environment. J. Nat. Resour. 2003, 18, 635–644. [Google Scholar]
  37. Fare, R.; Grosskopf, S.; Norris, M.; Zhang, Z. Productivity growth, technical progress, and efficiency change in industrialized countries. Am. Econ. Rev. 1994, 84, 66–83. [Google Scholar]
  38. Research Group of Chongqing Survey National Bureau of Statistics. The demand and supply of China’s food and it trends in the thirteenth Five-Year. World Surv. Res. 2015, 28, 3–6. [Google Scholar]
  39. Li, X. The Efficiency of Energy Utilization Evaluation Index System and Applied Research of China. Ph.D. Thesis, China University of Geosciences, Beijing, China, 2013. [Google Scholar]
  40. Li, X.Y. Understanding the Water-Energy Nexus: A Case Study of Ningxia. Master’s Thesis, Sustainable Development at Uppsala University, Uppsala University, Uppsala, Sweden, 2014. [Google Scholar]
  41. Jiang, J. Application of water saving irrigation technology in Ningxia: Practice and prospect. China Water Resour. 2010, 61, 63–65. [Google Scholar]
  42. Gao, Y.Y.; Xu, X.Y.; Wang, H.R.; Gao, X.; Yin, S.L. New model for water use efficiency evaluation of China and its application. Syst. Eng. Theory Pract. 2013, 33, 776–784. [Google Scholar]
  43. Xue, J.J.; Shen, L.; Liu, L.T.; Gao, T.M. Coordinated development between regional energy efficiency and the economy in China. Resour. Sci. 2013, 35, 713–721. [Google Scholar]
Figure 1. Key factors/drivers in WEF-Nexus framework.
Sustainability 08 00927 g001
Figure 2. Sources of specific indexes in the WEF-Nexus framework.
Sustainability 08 00927 g002
Figure 3. Trend graph of index system in China’s case.
Sustainability 08 00927 g003
Figure 4. Stable with high efficiency area.
Sustainability 08 00927 g004
Figure 5. Rapidly increasing with low efficiency area.
Sustainability 08 00927 g005
Figure 6. Slowly increasing with low efficiency area.
Sustainability 08 00927 g006
Figure 7. M value less than one (The value of the mean is the geometric mean of all stages’ values).
Sustainability 08 00927 g007
Table 1. Input-Output Index System and the Chinese Case (2005–2014).
TypesIndexesChinese CaseUnits
InputTotal Water ConsumptionTotal Water Use100 million m3
Total Energy ConsumptionTotal Energy Consumption10,000 tons of SCE
Total Food ConsumptionTotal Food Consumption Expenditures10,000 Yuan
Total Permanent Resident PopulationTotal Population at Year-end10,000 people
OutputGDP per capitaGDP per capitaYuan per person
Environment IndexTotal Waste GasTotal Volume of Sulphur Dioxide Emissions; Total Volume of Soot and Dust Emissions10,000 tons
Total Waste WaterTotal Waste Water Discharged10,000 tons
Total Solid WasteTotal Industrial Solid Wastes Produced10,000 tons
Table 2. Results of WEF Input-Output Efficiency in Horizontal Dimension.
DMURegions2005200620072008200920102011201220132014
1Beijing0.890.9310.940.9711111
2Tianjin1111111111
3Hebei0.120.120.130.130.130.140.130.130.130.13
4Shanxi0.230.230.250.270.270.280.270.270.270.26
5Inner Mongolia0.340.360.380.400.440.450.460.460.450.46
6Liaoning0.170.170.180.180.200.220.230.240.260.28
7Jilin0.260.280.300.310.340.360.390.410.450.47
8Heilongjiang0.200.210.210.210.210.220.230.240.240.26
9Shanghai0.720.710.700.640.630.630.640.630.620.65
10Jiangsu0.140.140.150.150.160.170.170.180.180.19
11Zhejiang0.220.230.240.230.240.250.260.260.250.26
12Anhui0.120.120.130.120.130.140.150.150.150.16
13Fujian0.270.280.290.290.310.320.330.330.340.34
14Jiangxi0.170.180.190.200.200.200.220.220.230.23
15Shandong0.100.100.110.110.120.120.120.130.140.15
16Henan0.080.090.090.100.100.110.110.110.120.12
17Hubei0.110.120.130.130.150.150.160.170.180.20
18Hunan0.100.100.110.120.120.130.140.140.150.15
19Guangdong0.130.130.130.130.130.130.130.130.130.13
20Guangxi0.140.150.160.160.170.190.200.200.210.21
21Hainan1111111111
22Chongqing0.250.260.260.270.280.290.310.320.350.37
23Sichuan0.070.080.080.090.090.090.100.100.110.11
24Guizhou0.100.110.120.130.150.150.170.180.210.22
25Yunnan0.120.120.130.130.140.140.150.160.170.18
26Shaanxi0.200.210.220.240.250.270.290.300.300.34
27Gansu0.200.220.230.230.240.250.270.270.270.28
28Qinghai1111111111
29Ningxia0.910.890.950.94111111
30Xinjiang0.380.370.350.330.310.330.330.300.290.29
Table 3. Results of WEF Input-Output Efficiency in Vertical Dimension.
Regions2005200620072008200920102011201220132014
Beijing0.740.770.820.820.830.850.890.900.981.00
Tianjin0.920.940.940.990.960.971.001.001.001.00
Hebei0.090.090.100.110.110.120.120.120.130.13
Shanxi0.160.170.190.220.220.240.250.250.260.26
Inner Mongolia0.220.240.270.300.320.360.410.440.440.45
Liaoning0.150.150.160.180.180.210.220.230.260.28
Jilin0.220.240.260.290.300.340.370.380.430.46
Heilongjiang0.170.180.190.190.190.210.220.230.230.26
Shanghai0.560.570.580.570.580.580.590.590.610.65
Jiangsu0.110.120.120.130.140.150.160.170.180.19
Zhejiang0.160.170.180.190.200.220.230.240.250.26
Anhui0.090.090.090.100.110.130.140.140.150.16
Fujian0.190.200.210.230.250.270.290.310.330.34
Jiangxi0.140.150.160.170.170.190.200.210.220.23
Shandong0.090.090.100.110.110.120.120.120.140.15
Henan0.070.080.080.090.090.100.110.110.120.12
Hubei0.090.100.100.110.130.140.150.160.170.19
Hunan0.080.080.090.100.100.120.130.130.150.15
Guangdong0.090.090.100.100.100.110.110.120.130.13
Guangxi0.110.120.120.130.140.170.190.190.200.21
Hainan1.000.980.980.950.941.001.001.001.001.00
Chongqing0.190.200.210.240.250.270.300.300.350.37
Sichuan0.060.060.070.070.070.090.090.100.100.11
Guizhou0.090.090.110.120.130.140.160.170.200.22
Yunnan0.090.100.110.110.120.130.140.150.160.18
Shaanxi0.160.180.190.220.220.250.280.280.300.33
Gansu0.160.180.200.210.210.230.250.260.260.27
Qinghai1.000.970.930.971.001.000.960.971.001.00
Ningxia0.610.640.700.760.790.850.920.960.981.00
Xinjiang0.280.290.290.300.280.320.310.290.290.28
Table 4. Division of M and EC Values in Shanghai and Xinjiang.
StagesShanghai M ValueShanghai EC ValueXinjiang EC Value
ECTCM ValueECPCSCECPCSC
2005–20060.9871.061.0460.98710.9870.9810.981
2006–20070.9871.051.0370.98710.9870.9420.9381.004
2007–20080.9071.0910.9890.90710.9070.9450.9510.993
2008–20090.9871.0281.0140.98710.9870.9530.951.003
2009–20101.0020.9960.9981.00211.0021.0431.0381.005
2010–20111.0071.0261.0331.0070.6471.5560.9970.9941.003
2011–20120.9951.0030.9990.9950.9970.9980.9310.9330.998
2012–20130.981.0591.0370.980.9681.0130.9460.9480.999
2013–20141.0521.0091.0611.0521.0550.9971.0031.0170.987
Table 5. Division of M value in Hainan, Qinghai, and Xinjiang.
StagesHainanQinghaiXinjiang
ECTCM ValueECTCM ValueECTCM Value
2005–200610.9620.96211.021.020.9811.0941.073
2006–200710.9590.95911.0041.0040.9421.0631.001
2007–200810.980.9811.0491.0490.9451.0911.031
2008–200910.9780.97811.1011.1010.9530.9950.948
2009–201011.0441.04410.9590.9591.0431.0691.115
2010–201110.9630.96310.9350.9350.9970.9850.983
2011–201210.970.9711.0631.0630.9311.0030.934
2012–201311.0111.01111.0721.0720.9461.0310.976
2013–201410.9710.97110.9620.9621.0030.9720.976

