
Scenarios of Carbon Emissions from the Power Sector in Guangdong Province

Abstract
:1. Introduction
2. Methods
2.1. Gross CO2 Emissions from Electricity Consumption
2.2. Share of Non-Fossil Fuels in Total Energy Consumption
2.3. Decomposition of CO2 Emissions
2.4. Data Sources
3. Results and Discussion
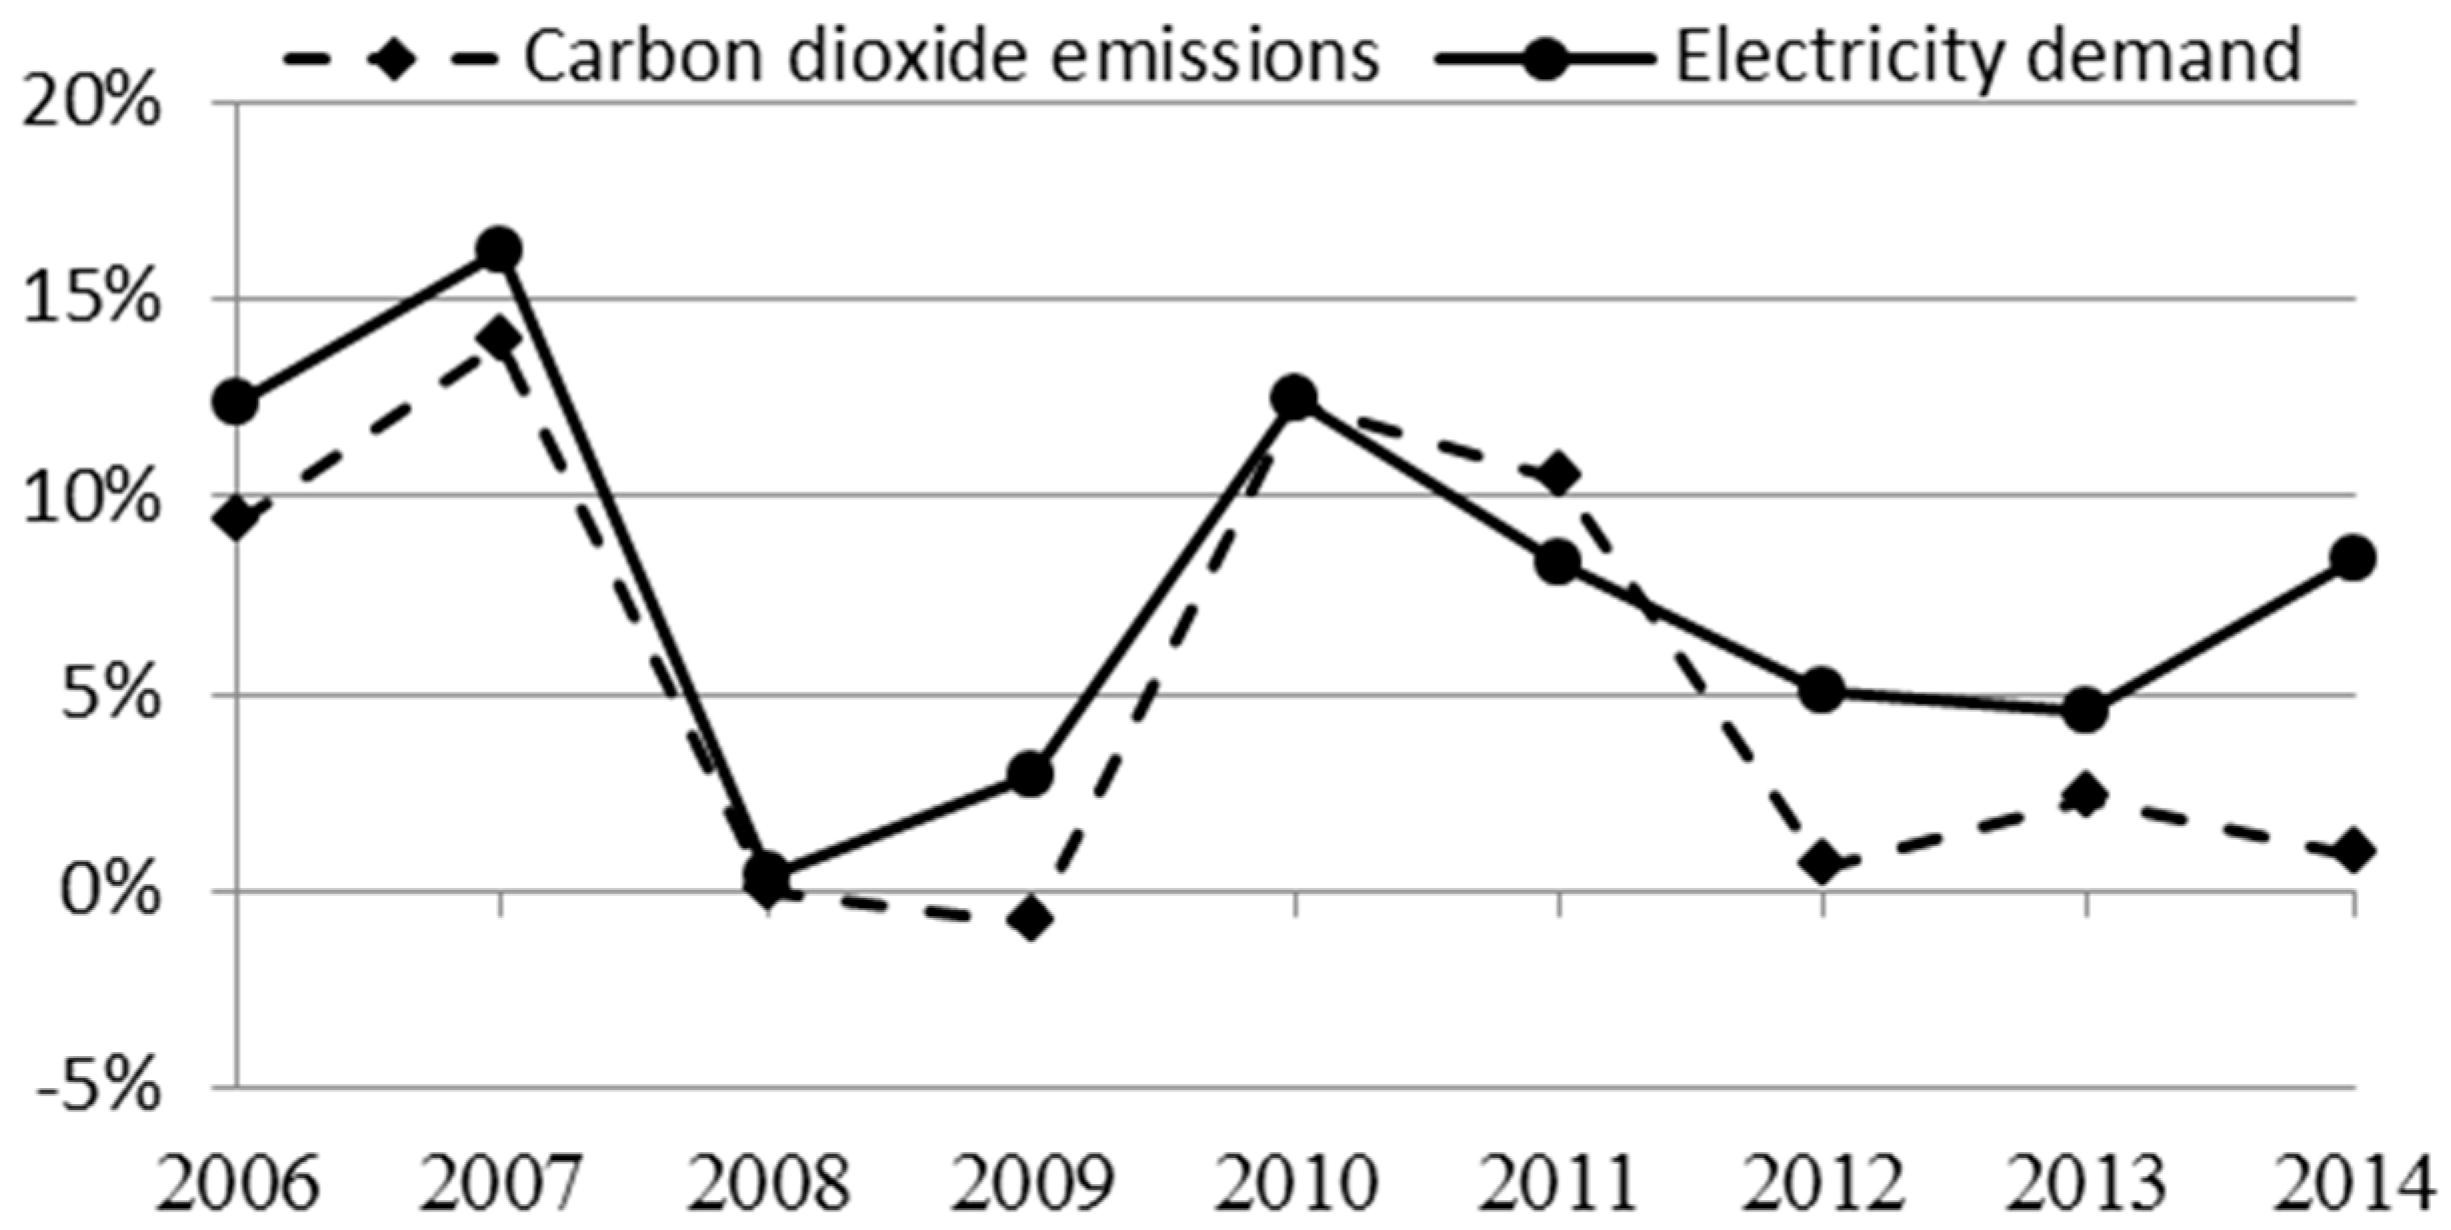
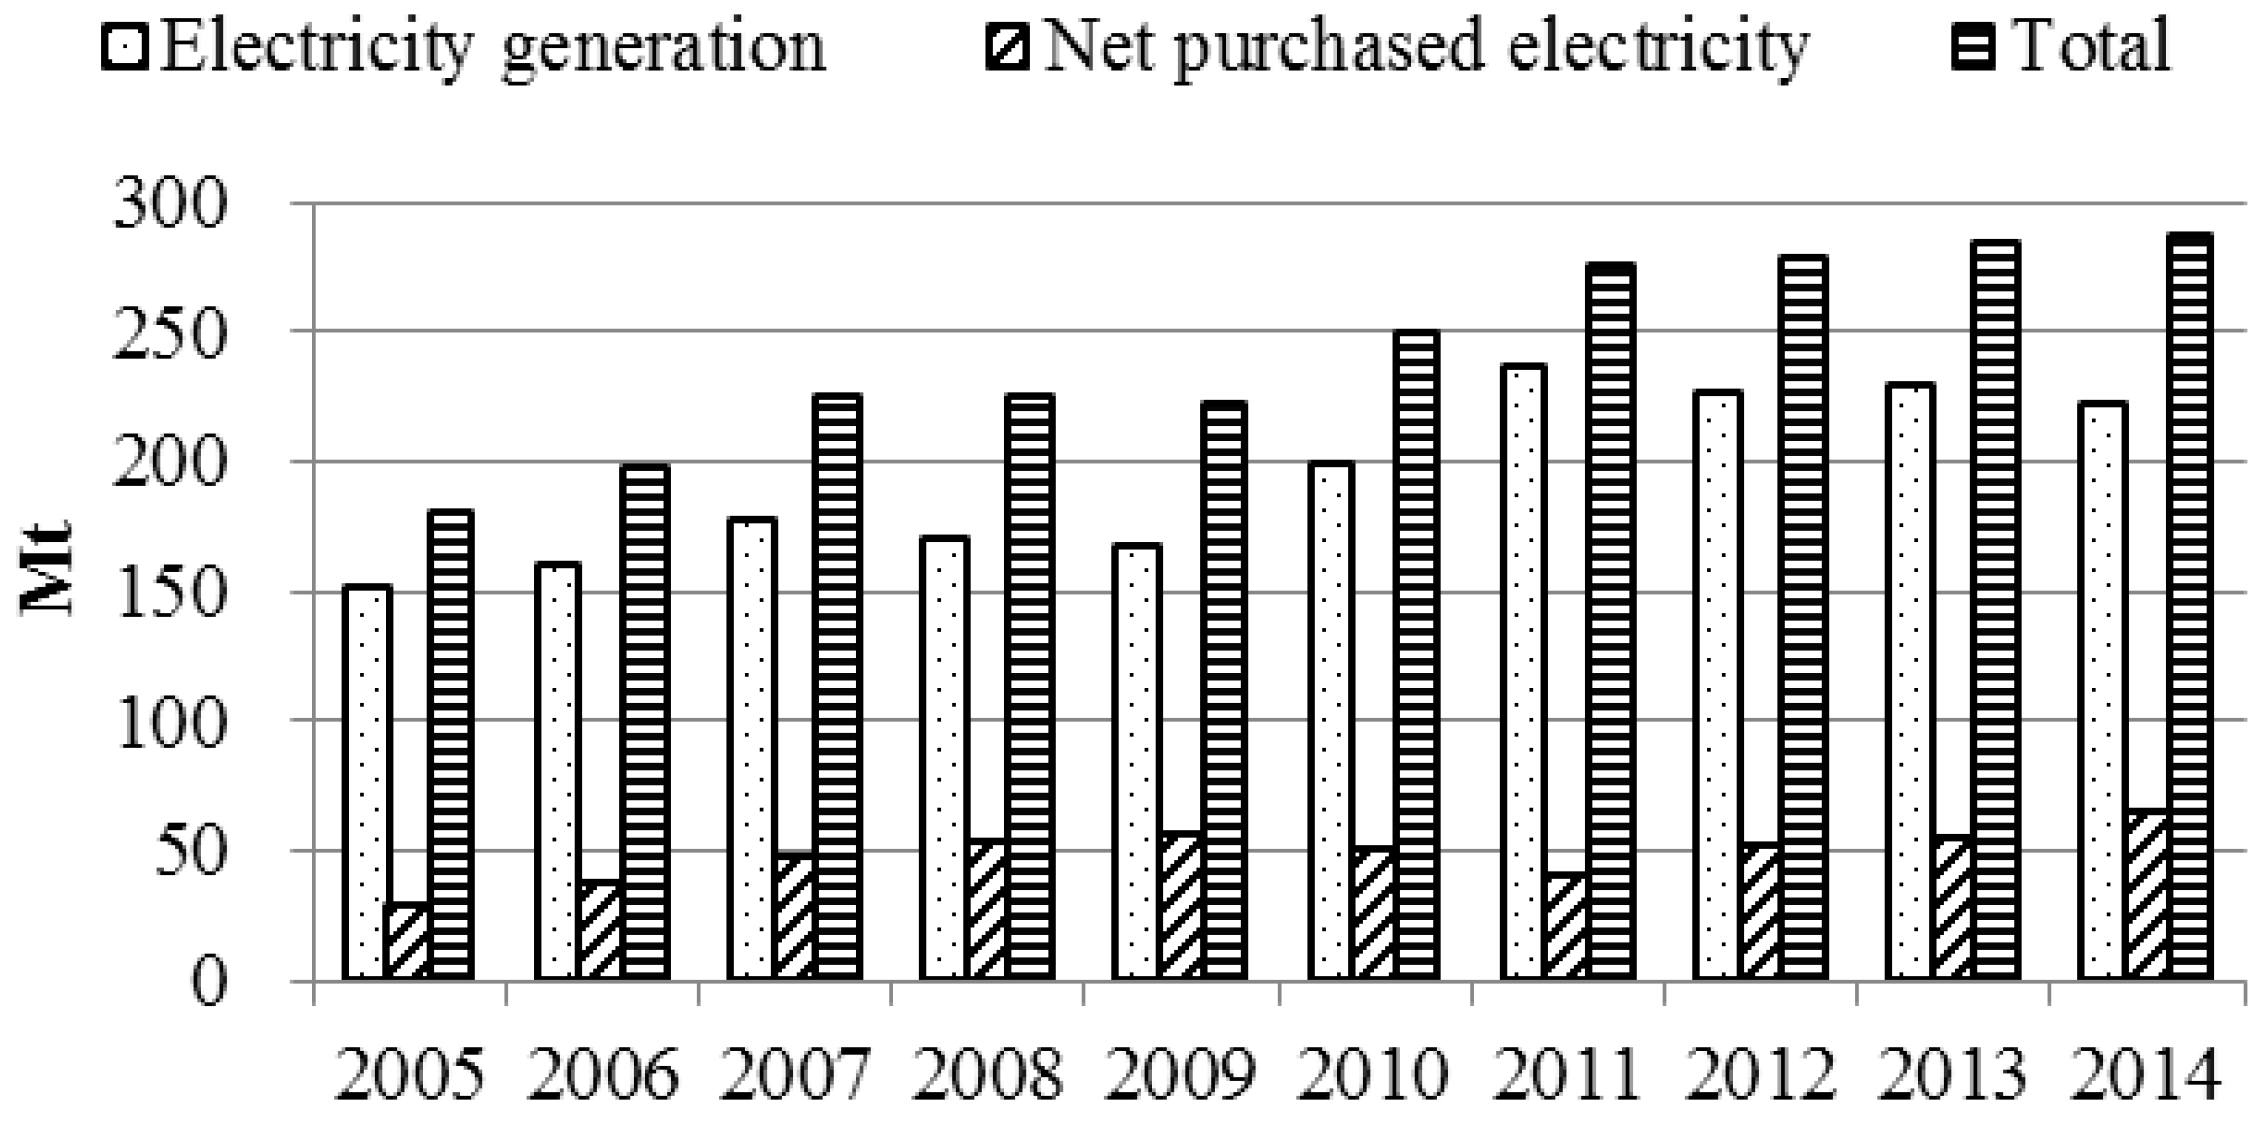
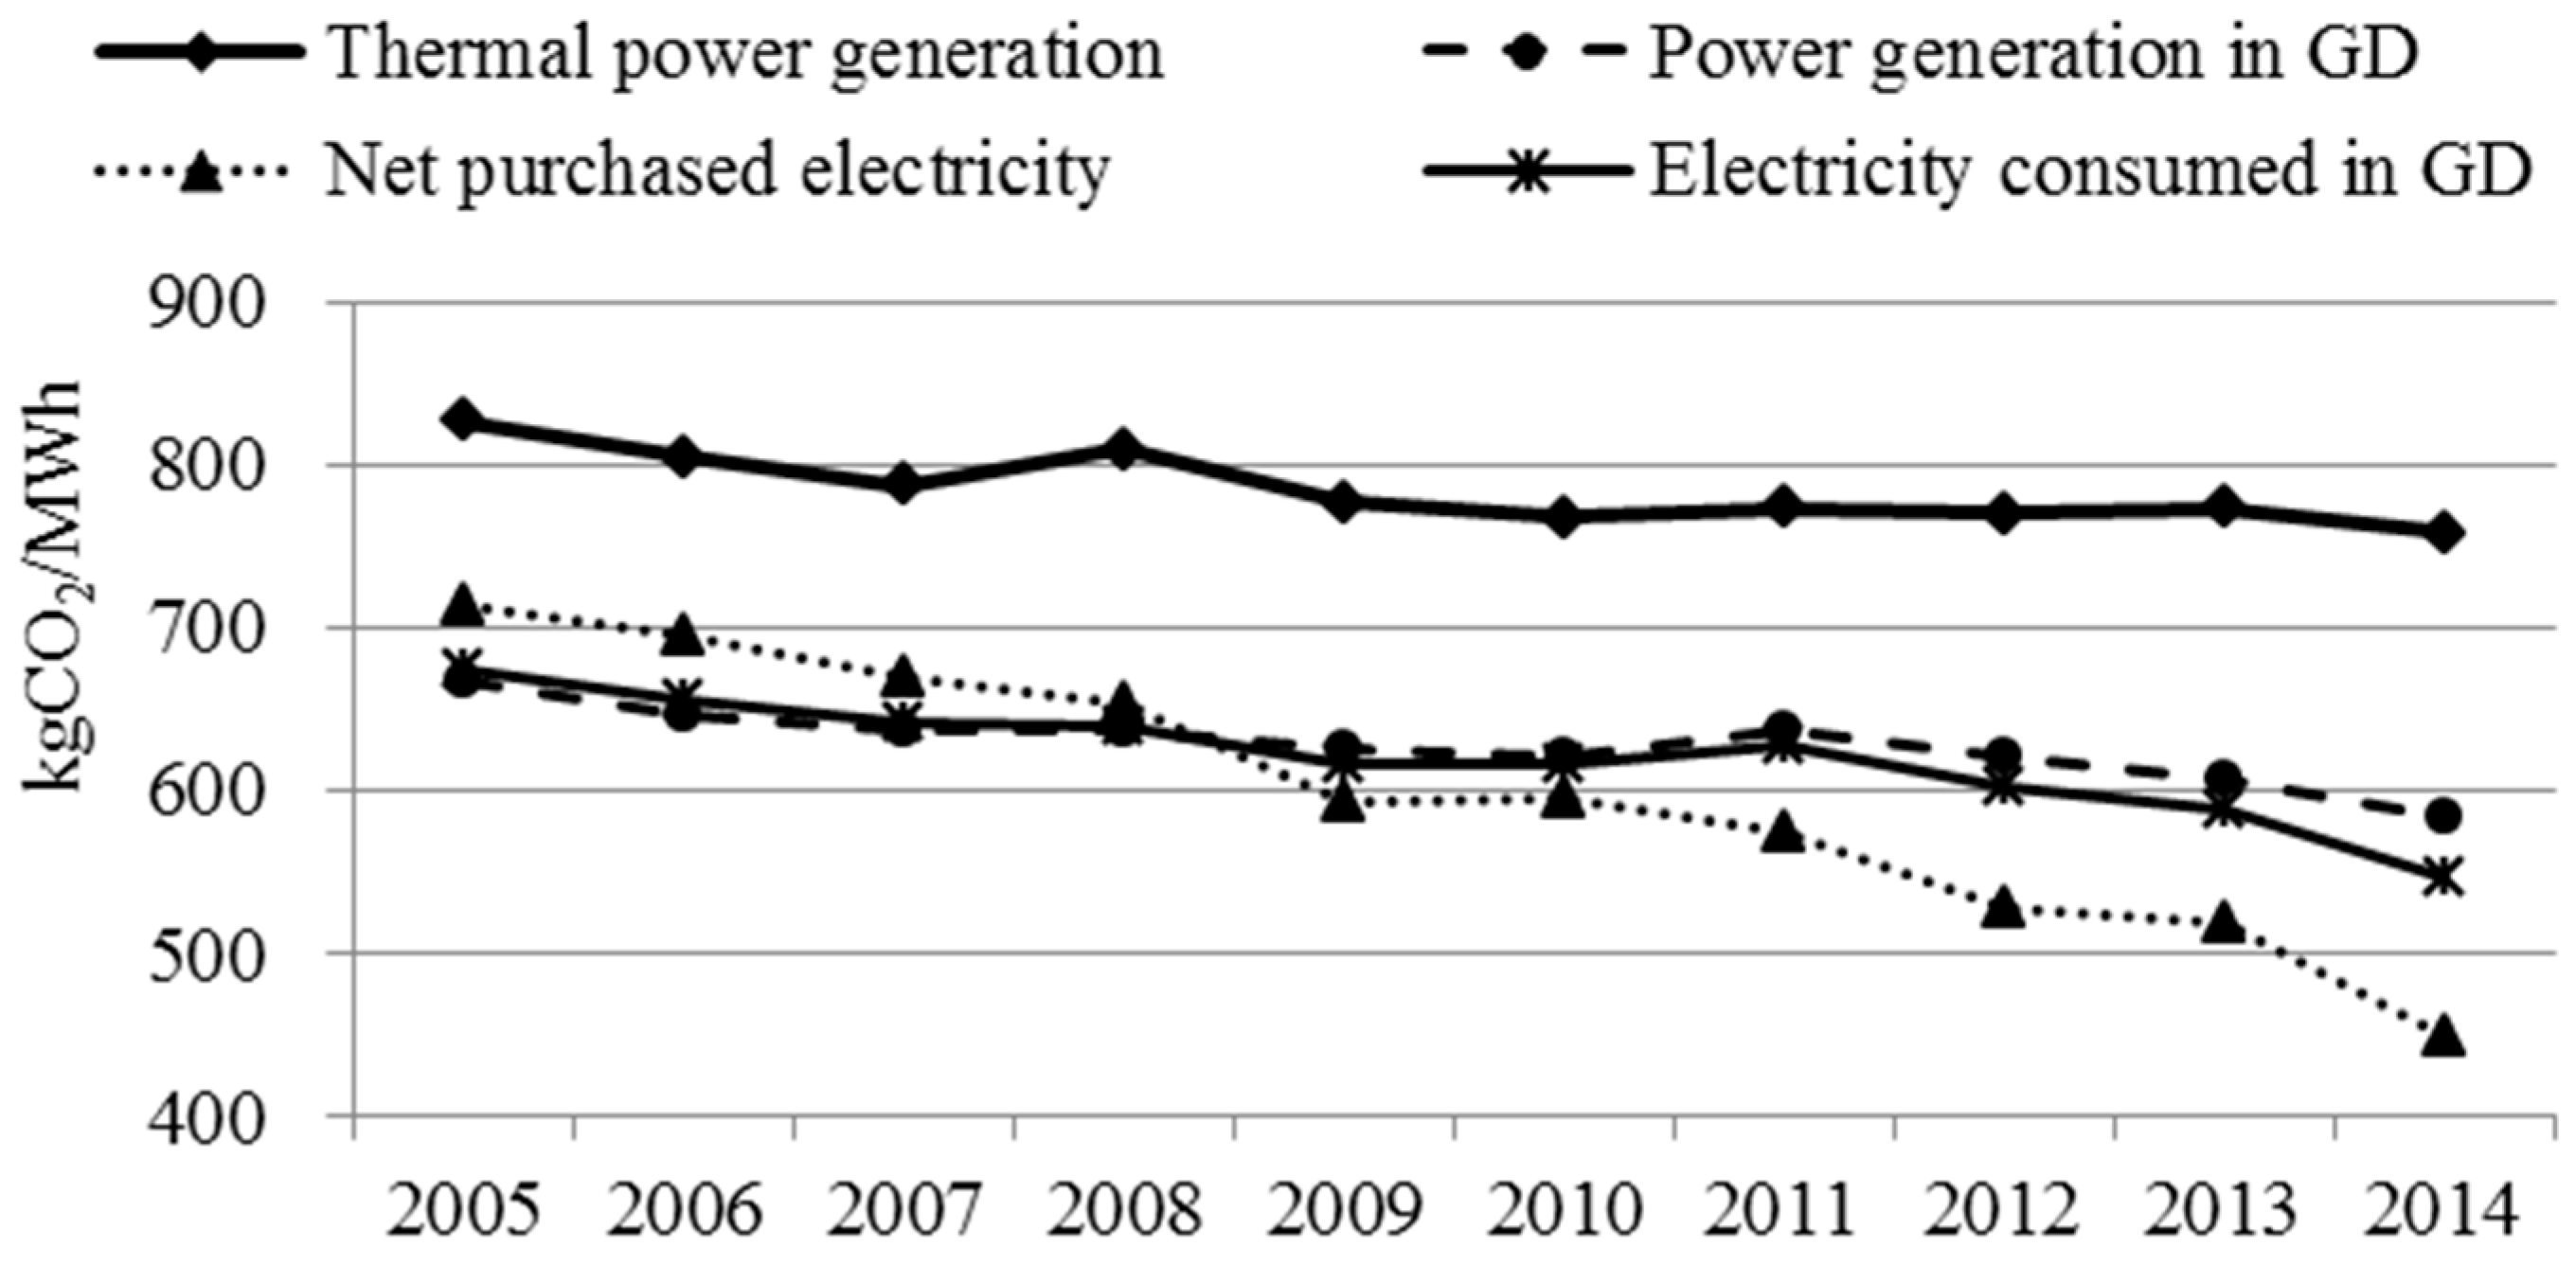
3.1. Evolution of CO2 Emissions
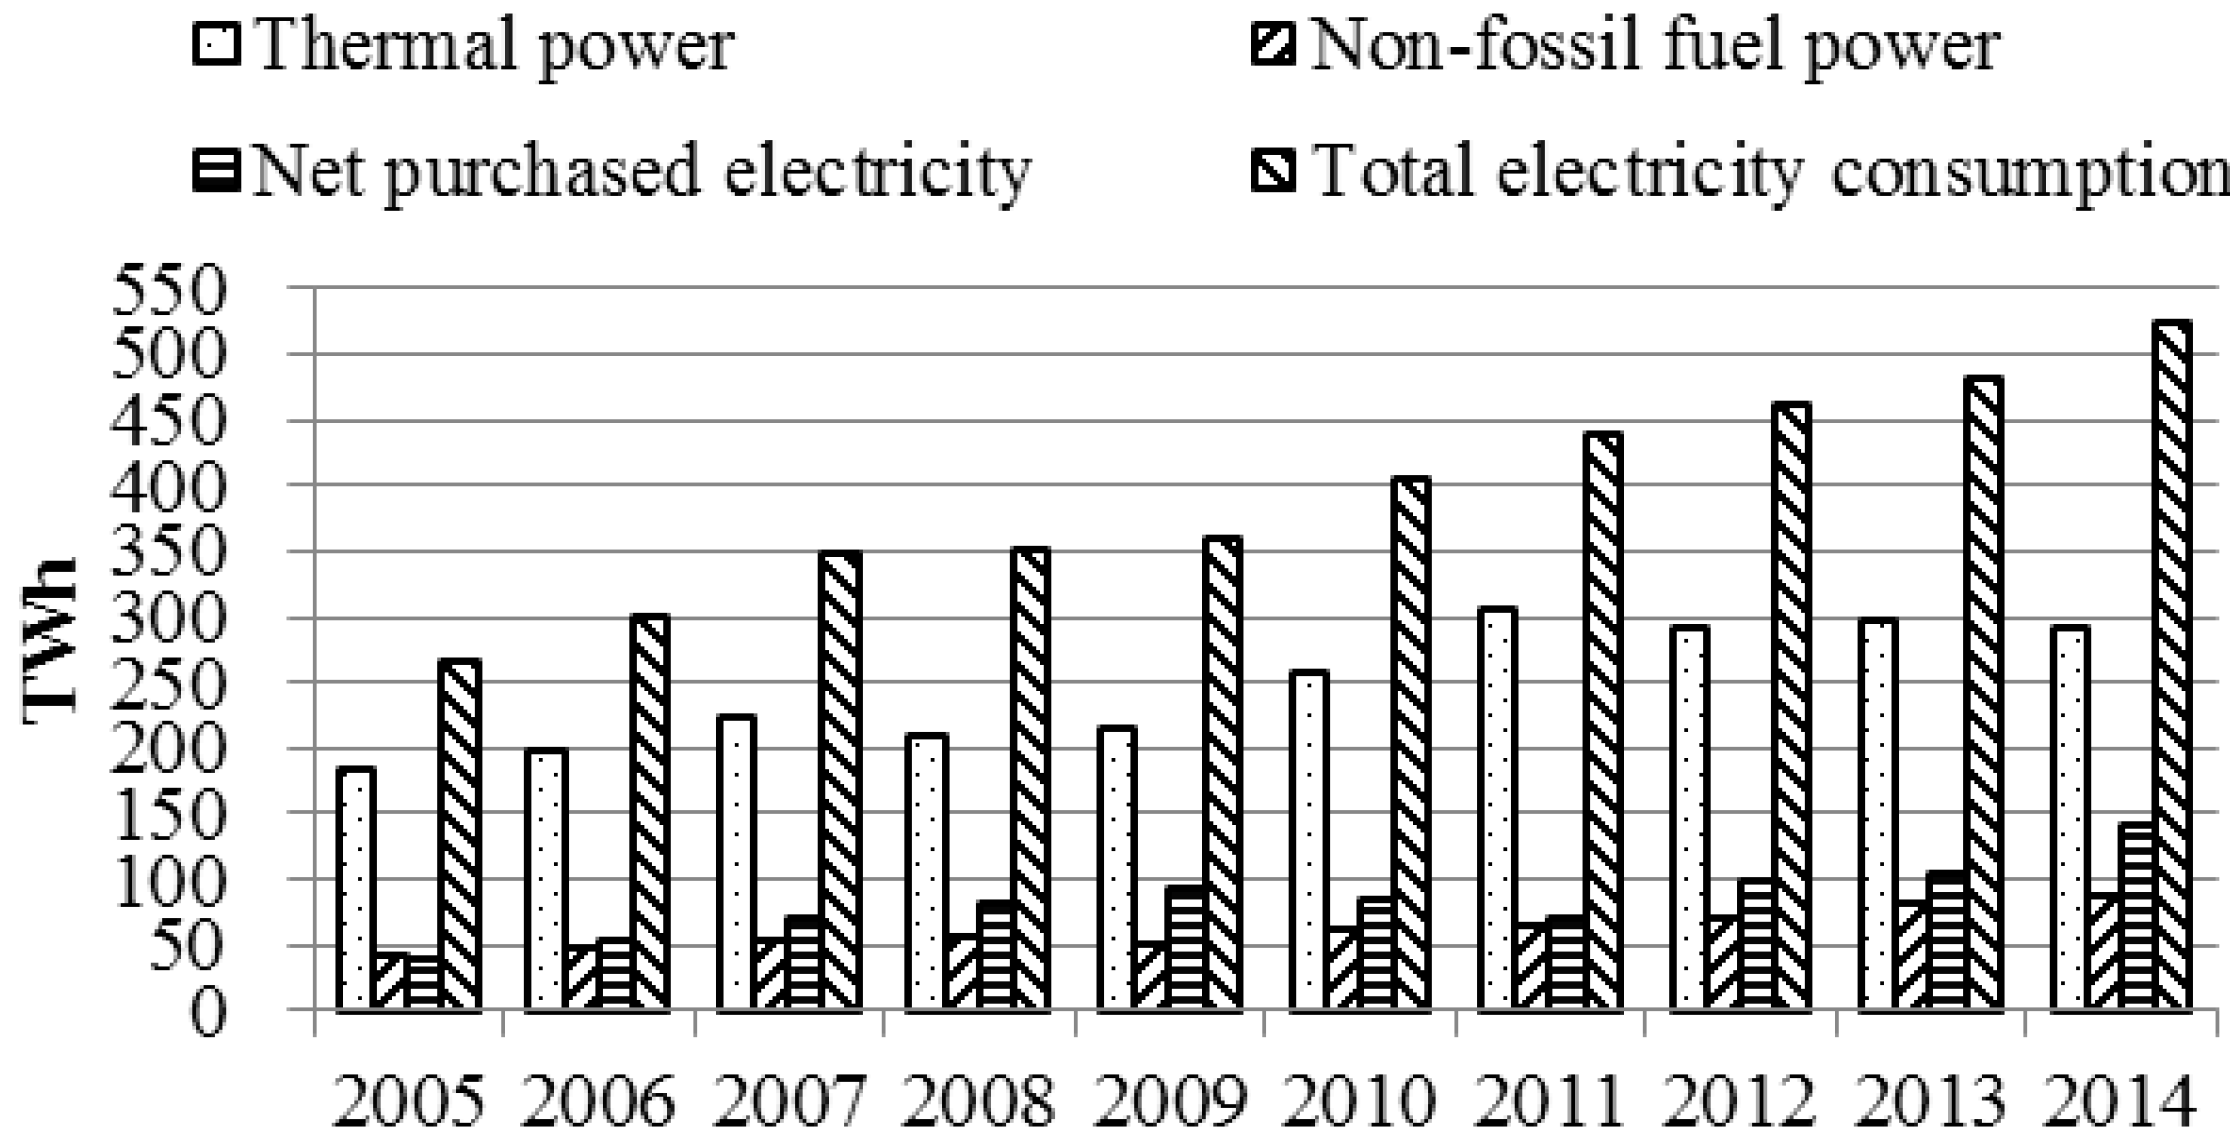
3.2. Share of Non-Fossil Fuel Energy to the Total Energy Consumption
3.3. LMDI Decomposition Results
4. 2020 Scenario Analysis
4.1. Data Sources
4.2. GDP and Total Energy Consumption of GD
4.3. Policies to Promote Energy Efficiency and Non-Fossil Power Generation
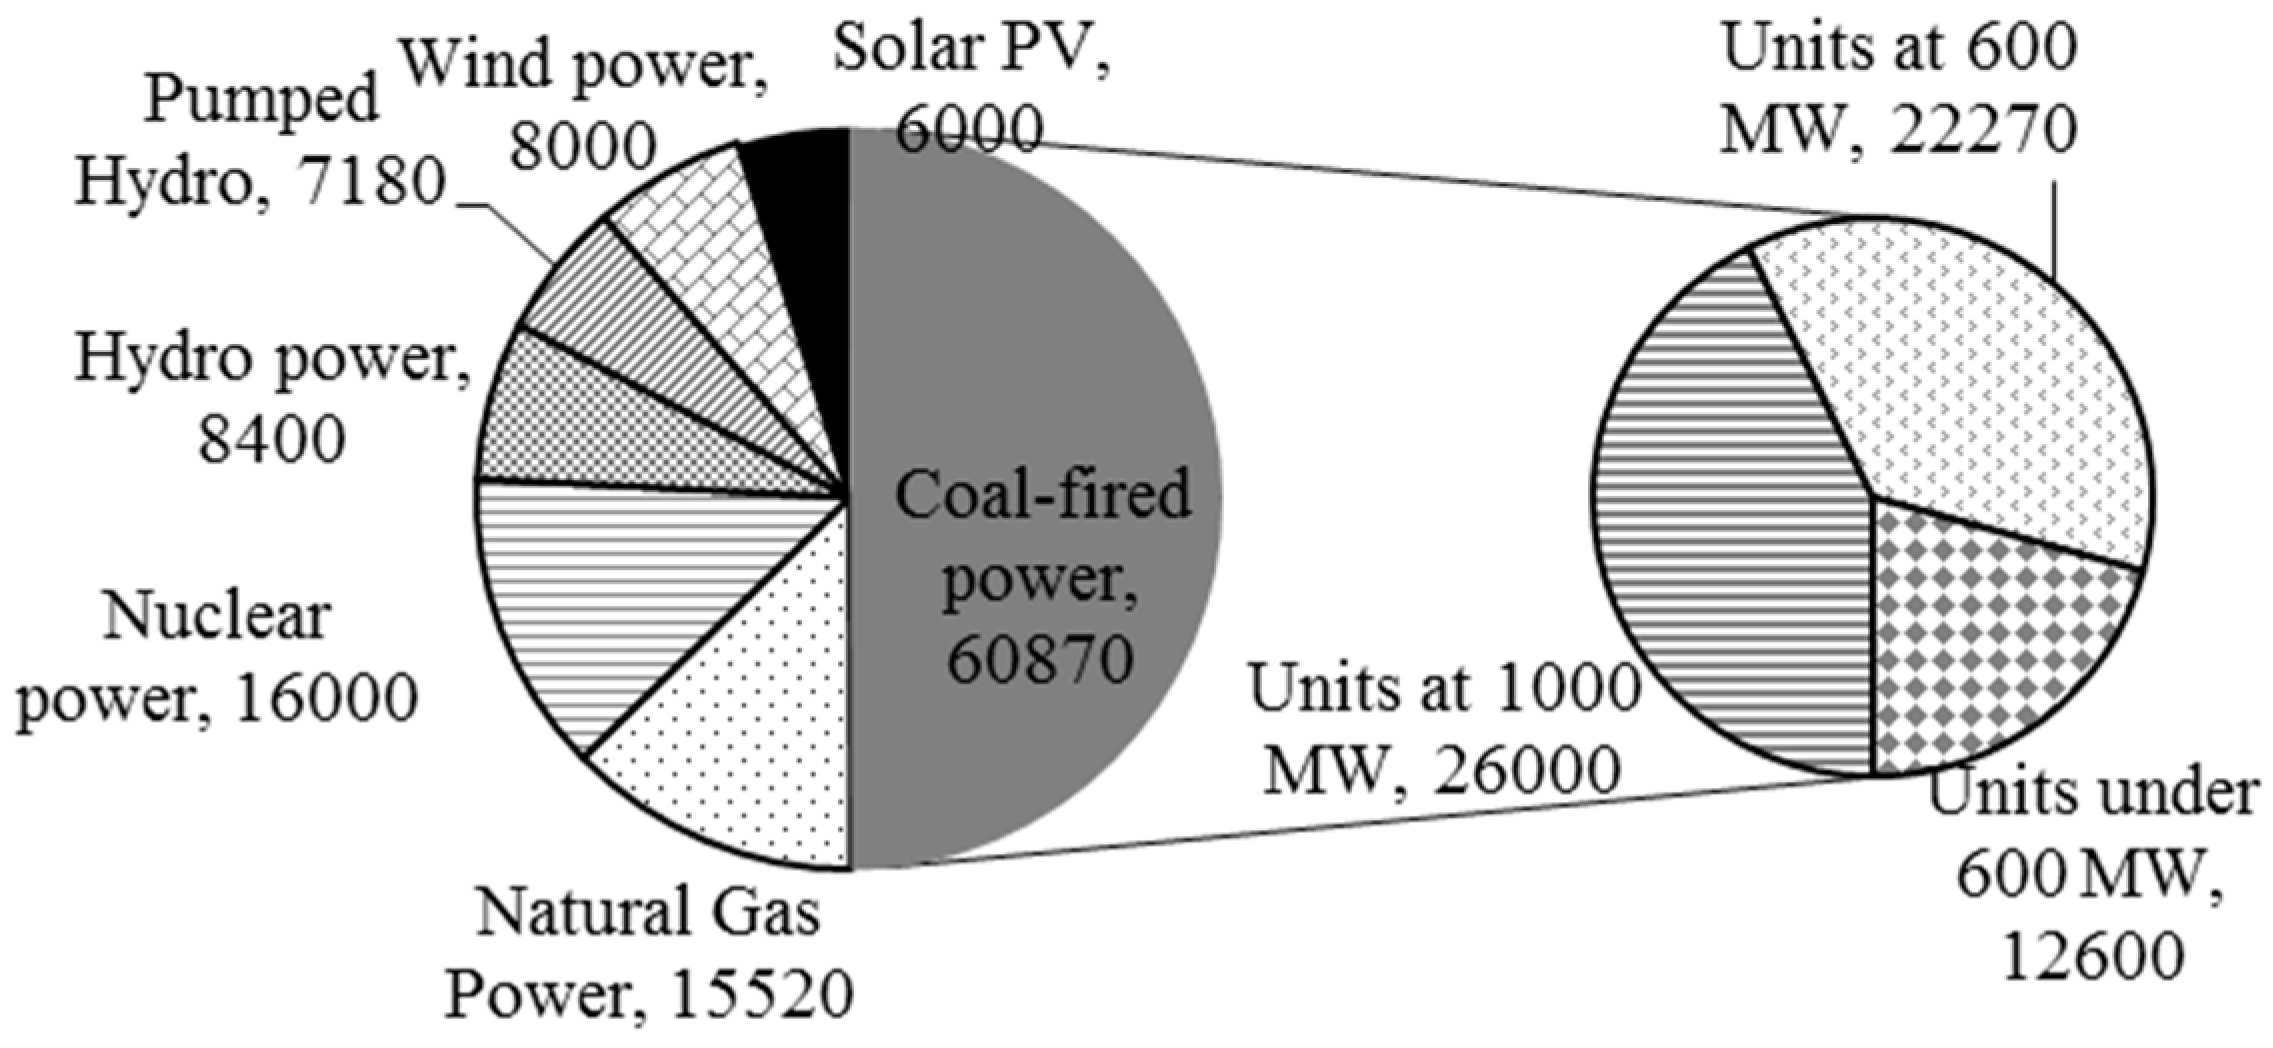
4.4. Electricity Demand and Supply
4.5. Thermal Power Generation Efficiency
4.6. Carbon Emission Scenarios
4.7. Contribution of the Non-Fossil Fuel Energy
5. Conclusions and Policy Implications
Acknowledgments
Author Contributions
Conflicts of Interest
References
- Yuan, J.; Xu, Y.; Zhang, X.; Hu, Z.; Xu, M. China’s 2020 clean energy target: Consistency, pathways and policy implications. Energy Policy 2014, 65, 692–700. [Google Scholar] [CrossRef]
- Xinhuanet. China-U.S. joint announcement on climate change. Xinhuanet, 12 November 2014. (In Chinese) [Google Scholar]
- Yu, S.; Wei, Y.; Wang, K. Provincial allocation of carbon emission reduction targets in China: An approach based on improved fuzzy cluster and Shapley value decomposition. Energy Policy 2014, 66, 630–644. [Google Scholar] [CrossRef]
- People’s Government of Guangdong Province. The Provincial 13th Five-Year Plan for Economic and Social Development of Guangdong. Available online: http://zwgk.gd.gov.cn/006939748/201605/t20160509_654321.html (accessed on 26 August 2016). (In Chinese)
- Ang, B.W. Decomposition analysis for policymaking in energy: Which is the preferred method? Energy Policy 2004, 32, 1131–1139. [Google Scholar] [CrossRef]
- Ang, B.W.; Liu, N. Handling zero values in the logarithmic mean Divisia index decomposition approach. Energy Policy 2007, 35, 238–246. [Google Scholar] [CrossRef]
- Malla, S. CO2 emissions from electricity generation in seven Asia-Pacific and North American countries: A decomposition analysis. Energy Policy 2009, 37, 1–9. [Google Scholar] [CrossRef]
- Zhang, M.; Liu, X.; Wang, W.; Zhou, M. Decomposition analysis of CO2 emissions from electricity generation in China. Energy Policy 2013, 52, 159–165. [Google Scholar] [CrossRef]
- Karmellos, M.; Kopidou, D.; Diakoulaki, D. A decomposition analysis of the driving factors of CO2 (Carbon dioxide) emissions from the power sector in the European Union countries. Energy 2016, 94, 680–692. [Google Scholar] [CrossRef]
- Ang, B.W.; Su, B. Carbon emission intensity in electricity production: A global analysis. Energy Policy 2016, 94, 56–63. [Google Scholar] [CrossRef]
- Özer, B.; Görgün, E.; İncecik, S. The scenario analysis on CO2 emission mitigation potential in the Turkish electricity sector: 2006–2030. Energy 2013, 49, 395–403. [Google Scholar] [CrossRef]
- Hawkes, A.D. Long-run marginal CO2 emissions factors in national electricity systems. Appl. Energy 2014, 125, 197–205. [Google Scholar] [CrossRef]
- Pineda, S.; Bock, A. Renewable-based generation expansion under a green certificate market. Renew. Energy 2016, 91, 53–63. [Google Scholar] [CrossRef]
- Jiusto, S. The differences that methods make: Cross-border power flows and accounting for carbon emissions from electricity use. Energy Policy 2006, 34, 2915–2928. [Google Scholar] [CrossRef]
- Tao, X.; Wang, P.; Zhu, B. Measuring the Interprovincial CO2 Emissions Considering Electric Power Dispatching in China: From Production and Consumption Perspectives. Sustainability 2016, 8, 5066. [Google Scholar] [CrossRef]
- Andrews-Speed, P.; Dow, S.; Oberheitmann, A.; Ramsay, B.; Smith, V.; Wei, B. First steps in power sector reform the case of China’s Guangdong Province. Util. Policy 2003, 11, 169–183. [Google Scholar] [CrossRef]
- Wang, J.; Dong, Y.; Jiang, H. A study on the characteristics, predictions and policies of China’s eight main power grids. Energy Convers. Manag. 2014, 86, 818–830. [Google Scholar] [CrossRef]
- Segers, R. Three options to calculate the percentage renewable energy: An example for a EU policy debate. Energy Policy 2008, 36, 3243–3248. [Google Scholar] [CrossRef]
- Modahl, I.S.; Raadal, H.L.; Gagnon, L.; Bakken, T.H. How methodological issues affect the energy indicator results for different electricity generation technologies. Energy Policy 2013, 63, 283–299. [Google Scholar] [CrossRef]
- Statistics Bureau of Guangdong Province, Guangdong Survey Office of National Bureau of Statistics. Guangdong Statistical Yearbook, 2006–2015; China Statistical Press: Beijing, China, 2006–2015. (In Chinese)
- National Bureau of Statistics of China. China Energy Statistical Yearbook, 2006–2015; China Statistical Press: Beijing, China, 2006–2015. (In Chinese)
- Chen, Q.; Kang, C.; Ming, H.; Wang, Z.; Xia, Q.; Xu, G. Assessing the low-carbon effects of inter-regional energy delivery in China’s electricity sector. Renew. Sustain. Energy Rev. 2014, 32, 671–683. [Google Scholar] [CrossRef]
- Climate Change Division of the National Development and Reform Commission of China. Average CO2 Emission Factor for Provincial and Regional Power Grids in 2010 in China; Climate Change Division of the National Development and Reform Commission of China: Beijing, China, 2013. (In Chinese)
- Climate Change Division of the National Development and Reform Commission of China. Average CO2 emission Factor for Regional Power Grid in 2011 and 2012 in China; Climate Change Division of the National Development and Reform Commission of China: Beijing, China, 2014. (In Chinese)
- China Electrical Power Press. China Electric Power Yearbook, 2006–2015; China Electrical Power Press: Beijing, China, 2006–2015. (In Chinese) [Google Scholar]
- Tian, Z.-H.; Yang, Z.-L.; Cai, R.-X. Study on Contribution of Power Industry for Regional Energy Conservation and Carbon Intensity Reduction Goal. Electr. Power 2015, 48, 150–155. [Google Scholar]
- Tian, Z.-H.; Yang, Z.-L.; Cai, R.-X. Analysis of Guangdong carbon emissions from energy consumption and the driving factors of its intensity change. China Environ. Sci. 2015, 35, 1885–1891. [Google Scholar]
- Guangdong Provincial Development and Reform Commission. Energy Development Planning for the 13th Five-Year Plan of Guangdong Province; Guangdong Provincial Development and Reform Commission: Guangzhou, China, 2016. (In Chinese) [Google Scholar]
- Tian, Z.-H.; Zhang, L. Study on 13th Five-Year Plan of Energy Conservation and Emission Reduction in GD; Guangdong Energy Conservation Center: Guangzhou, China, 2016. (In Chinese) [Google Scholar]
- National Energy Administration. Development Planning of South Power Grid (2013–2020); National Energy Administration: Beijing, China, 2013. (In Chinese)
- Zhao, Z.; Chen, Y.; Chang, R. How to stimulate renewable energy power generation effectively? China’s incentive approaches and lessons. Renew. Energy 2016, 92, 147–156. [Google Scholar] [CrossRef]
- Hong, L.; Zhou, N.; Fridley, D.; Raczkowski, C. Assessment of China’s renewable energy contribution during the 12th Five Year Plan. Energy Policy 2013, 62, 1533–1543. [Google Scholar] [CrossRef]
- Wu, J.; Huang, Y. Electricity portfolio planning model incorporating renewable energy characteristics. Appl. Energy 2014, 119, 278–287. [Google Scholar] [CrossRef]
- National Development and Reform Commission of China. Action Plan for the Transformation and Upgrading of Coal Power Energy Conservation and Emission Reduction (2014–2020); National Development and Reform Commission of China: Beijing, China, 2014. (In Chinese)
- Zhao, X.; Ma, C. Deregulation, vertical unbundling and the performance of China’s large coal-fired power plants. Energy Econ. 2013, 40, 474–483. [Google Scholar] [CrossRef]


| Year | Total Energy Consumption (Mtce) | Fuels Consumed by Thermal Power | bT (gce/kWh) | fT (tCO2/tce) | λ | ||||
|---|---|---|---|---|---|---|---|---|---|
| Total (Mtce) | Coal Products Share | Oil Products Share | Natural Gas Share | Others Share | |||||
| 2005 | 179.21 | 62.43 | 76.7% | 21.5% | 0.2% | 1.7% | 339.2 | 2.436 | 15.8% |
| 2006 | 199.71 | 65.62 | 80.9% | 15.6% | 1.6% | 1.9% | 330.2 | 2.439 | 16.8% |
| 2007 | 222.17 | 73.23 | 82.7% | 9.7% | 5.8% | 1.7% | 325. | 2.424 | 18.2% |
| 2008 | 234.76 | 69.24 | 83.9% | 7.5% | 6.8% | 1.8% | 328.7 | 2.464 | 19.6% |
| 2009 | 246.54 | 69.51 | 84.4% | 4.3% | 9.0% | 2.3% | 324.4 | 2.396 | 19.3% |
| 2010 | 249.72 | 82.38 | 87.1% | 1.8% | 9.0% | 2.0% | 318.1 | 2.414 | 18.7% |
| 2011 | 264.31 | 96.76 | 89.3% | 0.6% | 8.8% | 1.3% | 317.0 | 2.440 | 16.1% |
| 2012 | 277.53 | 92.61 | 88.2% | 0.7% | 8.0% | 3.0% | 315.9 | 2.439 | 19.2% |
| 2013 | 284.80 | 93.47 | 90.4% | 0.6% | 7.7% | 1.3% | 314.3 | 2.461 | 20.5% |
| 2014 | 295.93 | 91.14 | 87.3% | 0.6% | 9.3% | 2.7% | 310.8 | 2.440 | 24.2% |
| Years | ∆CA | ∆CI | ∆Cb | ∆Cf | ∆Cs | ∆C |
|---|---|---|---|---|---|---|
| 2005–2006 | 2602 | −406 | −508 | 16 | −30 | 1674 |
| 2006–2007 | 2916 | 257 | −326 | −204 | 97 | 2740 |
| 2007–2008 | 2226 | −2138 | 242 | 111 | −442 | −1 |
| 2008–2009 | 2069 | −1423 | −293 | −924 | 377 | −194 |
| 2009–2010 | 2765 | 7 | −461 | 268 | 166 | 2744 |
| 2010–2011 | 2500 | −397 | −90 | 82 | 520 | 2613 |
| 2011–2012 | 2175 | −822 | −98 | −383 | −708 | 163 |
| 2012–2013 | 2281 | −1029 | −136 | 130 | −612 | 634 |
| 2013–2014 | 2132 | 164 | −326 | −964 | −756 | 250 |
| 2005–2014 | 21,665 | −5786 | −1997 | −1869 | −1389 | 10,624 |
| Years | ∆CA | ∆CI | ∆Cb | ∆Cf | ∆Cs |
|---|---|---|---|---|---|
| 2005–2006 | 155% | −24% | −30% | 1% | −2% |
| 2006–2007 | 106% | 9% | −12% | −7% | 4% |
| 2007–2008 | −242,924% | 233,267% | −26,412% | −12,108% | 48,277% |
| 2008–2009 | −1068% | 735% | 151% | 477% | −195% |
| 2009–2010 | 101% | 0% | −17% | 10% | 6% |
| 2010–2011 | 96% | −15% | −3% | 3% | 20% |
| 2011–2012 | 1331% | −503% | −60% | −234% | −433% |
| 2012–2013 | 360% | −162% | −21% | 21% | −97% |
| 2013–2014 | 853% | 66% | −131% | −386% | −302% |
| 2005–2014 | 204% | −54% | −19% | −18% | −13% |
| Fuels Consumed by Thermal Power (Mtce) | Gross Coal Consumption Rate (gce/kWh) | Emission Coefficient (tCO2/tce) | |||||
|---|---|---|---|---|---|---|---|
| Total | Coal Products | Oil Products | Natural Gas | Others | |||
| Scenario 1 | 90.05 | 73.58 | 0.05 | 15.35 | 1.08 | 282.12 | 2.40 |
| Scenario 2 | 94.72 | 78.19 | 0.05 | 15.35 | 1.14 | 282.60 | 2.41 |
| Scenario 3 | 99.49 | 82.90 | 0.05 | 15.35 | 1.19 | 283.07 | 2.42 |
| Scenario 4 | 104.35 | 87.70 | 0.05 | 15.35 | 1.25 | 283.51 | 2.42 |
| Scenario 1 | Scenario 2 | Scenario 3 | Scenario 4 | |
|---|---|---|---|---|
| Electricity generated in GD | 216.16 | 228.11 | 240.32 | 252.77 |
| Net purchased electricity | 68.80 | 68.80 | 68.80 | 68.80 |
| Total | 284.96 | 296.91 | 309.12 | 321.57 |
| Annual GDP Growth Rate | Scenario 1 | Scenario 2 | Scenario 3 | Scenario 4 |
|---|---|---|---|---|
| 7.0% | 27.5% | 27.6% | 27.6% | 27.7% |
| 7.5% | 26.9% | 27.0% | 27.0% | 27.0% |
| 8.0% | 26.3% | 26.3% | 26.4% | 26.4% |
© 2016 by the authors; licensee MDPI, Basel, Switzerland. This article is an open access article distributed under the terms and conditions of the Creative Commons Attribution (CC-BY) license (http://creativecommons.org/licenses/by/4.0/).
Share and Cite
Tian, Z.-H.; Yang, Z.-L. Scenarios of Carbon Emissions from the Power Sector in Guangdong Province. Sustainability 2016, 8, 863. https://doi.org/10.3390/su8090863
Tian Z-H, Yang Z-L. Scenarios of Carbon Emissions from the Power Sector in Guangdong Province. Sustainability. 2016; 8(9):863. https://doi.org/10.3390/su8090863
Chicago/Turabian StyleTian, Zhong-Hua, and Ze-Liang Yang. 2016. "Scenarios of Carbon Emissions from the Power Sector in Guangdong Province" Sustainability 8, no. 9: 863. https://doi.org/10.3390/su8090863
APA StyleTian, Z.-H., & Yang, Z.-L. (2016). Scenarios of Carbon Emissions from the Power Sector in Guangdong Province. Sustainability, 8(9), 863. https://doi.org/10.3390/su8090863