1. Introduction
Over the last 15 years, low carbon technologies to achieve sustainable buildings have become more popular, mainly because of the aim to reduce the greenhouse effect and to save energy and resources. The EU is working to achieve the reduction of greenhouse gas emission by 20% compared with the emission levels of 1990 by 2020. The built environment contributes with almost 35% of the total European CO
2 emissions [
1]. Residential buildings represent 77% of the total built environment energy use [
1]. Consequently the residential sector represents an important percentage in which CO
2 emissions could be reduced. Therefore, the authorities should push the implementation of low carbon technologies in the residential built environment to meet the targets for sustainable development. Unfortunately, there are still barriers in the national laws that make it difficult.
The present sustainable building design approach is based on natural ventilation (NV). NV is a passive ventilation method based on wind and/or buoyancy pressure differences to refresh air from indoor spaces with outdoor air [
2]. The lower energy cost in comparison with mechanical ventilation and the improved indoor environment air quality are the main benefits of NV [
3]. Furthermore, many parameters should be analysed carefully to achieve these benefits. NV requires an appropriate understanding of building pressurization, façade design [
4], wind patterns and local climate conditions. Accurately predicting and evaluating the NV performance, before and after building construction, is essential to reduce building energy use since the early design stage.
The energy reduction as a result of NV should be considered from the early building design stage in which building location, orientation and envelope have primary impact on building energy performance [
5]. Last but not least, wind flow also influences building ventilation, infiltration rates and the associated heat losses or gains. Therefore, building envelope bears much importance in the buildings energy behaviour. The façade performance should be improved according to the surrounding environment conditions and the neighbouring constructions that may modify the local flow causing unexpected flow effects. However, the fact remains that building designers often do not consider it due to the lack of tools and expertise for evaluating and implementing it. Thus, this lack of knowledge in the field may result in poorly designed, constructed and operated naturally ventilated buildings.
Many methods are used to predict ventilation [
6]. Among them, computational fluid dynamics (CFD) has been the most popular method for predicting NV nowadays [
7,
8,
9,
10], especially in studies that cannot be done in laboratories. Thus, CFD empowers building designers to optimize the building solutions by simulation instead of trial-and-error techniques that require much effort, time and resources. Moreover, several standards and guidelines [
11,
12,
13,
14,
15] have been developed to assist designers in the CFD model definition. The current research is therefore based on CFD to assist building designers to optimize NV building behaviour.
The present design approach is suitable to be used in a regional scale, thereby becoming it in a smart energy region. In any case the “smart energy region” definition is not simple. The definition involves many issues, i.e., energy, technology, social, economic and environmental aspects of territory, etc. in a regional scale [
16]. Furthermore, some strategies can be common in a regional scale and their global analysis permits designers to have tools for taking decisions when regional conditions are similar.
In this context, the NV design approach is presented through a residential house—case study in the Mediterranean region. Although the design approach is applied in a residential house, it can be used in the whole built environment. The case study analyses the repercussion of distinct façade opening configurations on the indoor airflow distribution to achieve an air sweeping effect to improve the NV building behaviour. The particular Mediterranean coast environmental conditions are analyzed. Finally, the energy saving potential of the low carbon design approach used in the future new buildings is evaluated over the complete region.
2. Case Study Description
2.1. Region Description
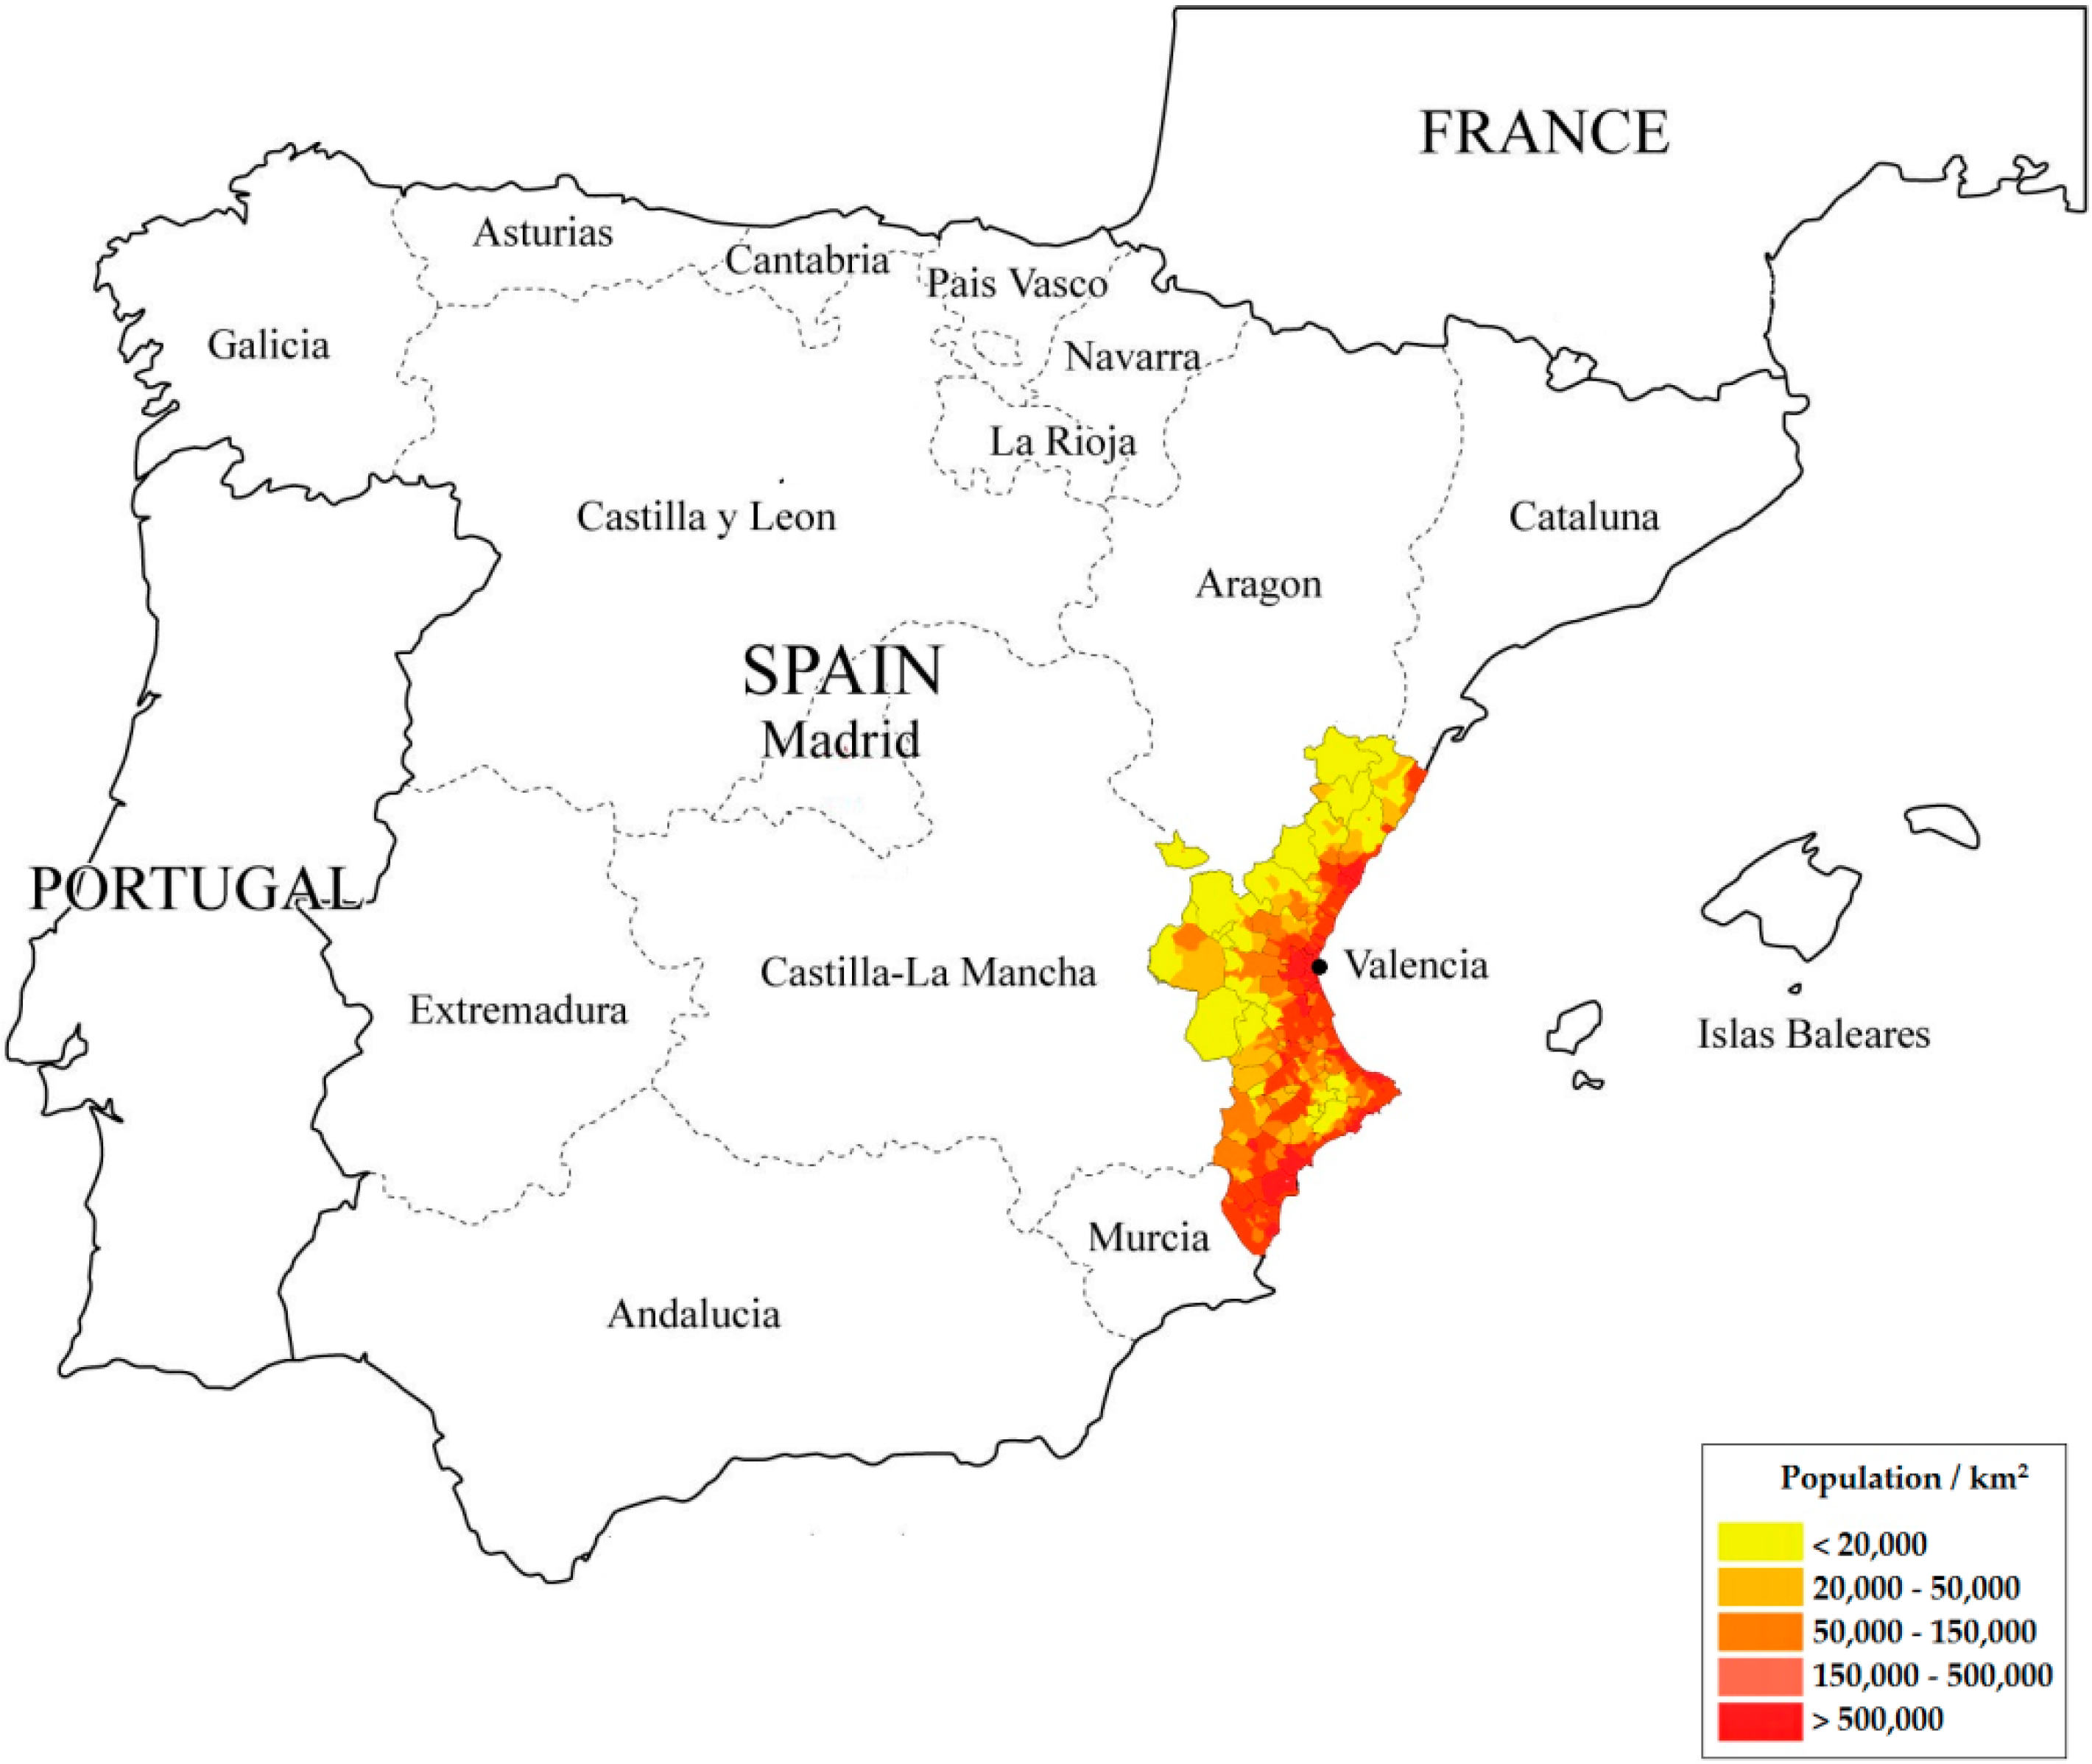
The research is focused on the Valencian Community Mediterranean coast (Spain). The Valencian Community is located along the Mediterranean Sea coast in the east of the Iberian Peninsula. The most important cities are Valencia, Alicante and Castellon. The Valencian Community has a large mountain range and a thin coastal strip along the whole region. The Iberian mountain range is placed in the inland part of the region. This part is craggy with mountain ranges higher than 1000 m high and mountain peaks higher than 1300 m (Penyagolosa 1813 m, Aitana 1558 m, Montcabrer 1390 m). The temperatures in the inland part are lower than comfort conditions in winter and higher in summer. Oppositely, the rather thin coastal strip is a very plain terrain and the temperatures are more averaged during the whole year due to the Mediterranean Sea effect. Accordingly most of the population lives along the thin coastal strip.
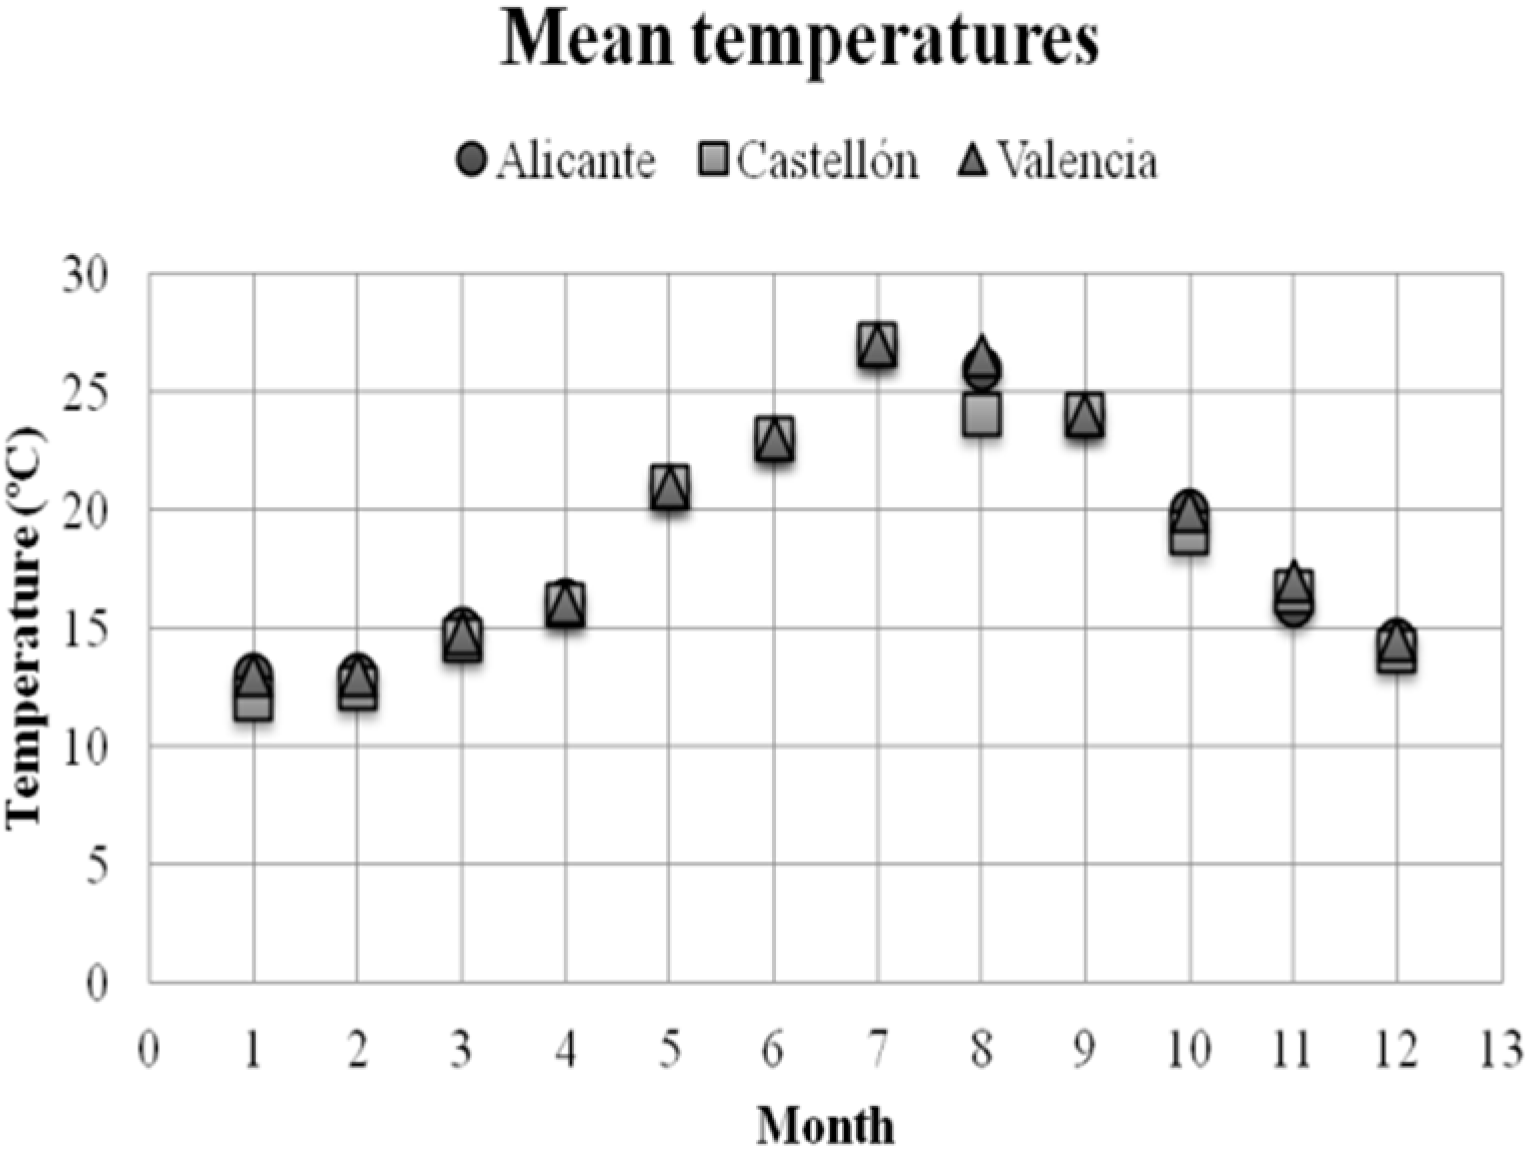
Climatic conditions in Valencian Community coastal zones are also common and particularly interesting to implement construction strategies based on NV. On the one hand, temperatures are averaged during spring and autumn (temperature is near 20 °C). The mean temperatures are little bit higher than 25 °C during July and August and a little bit lower than 15 °C during winter (see
Figure 1) [
17].
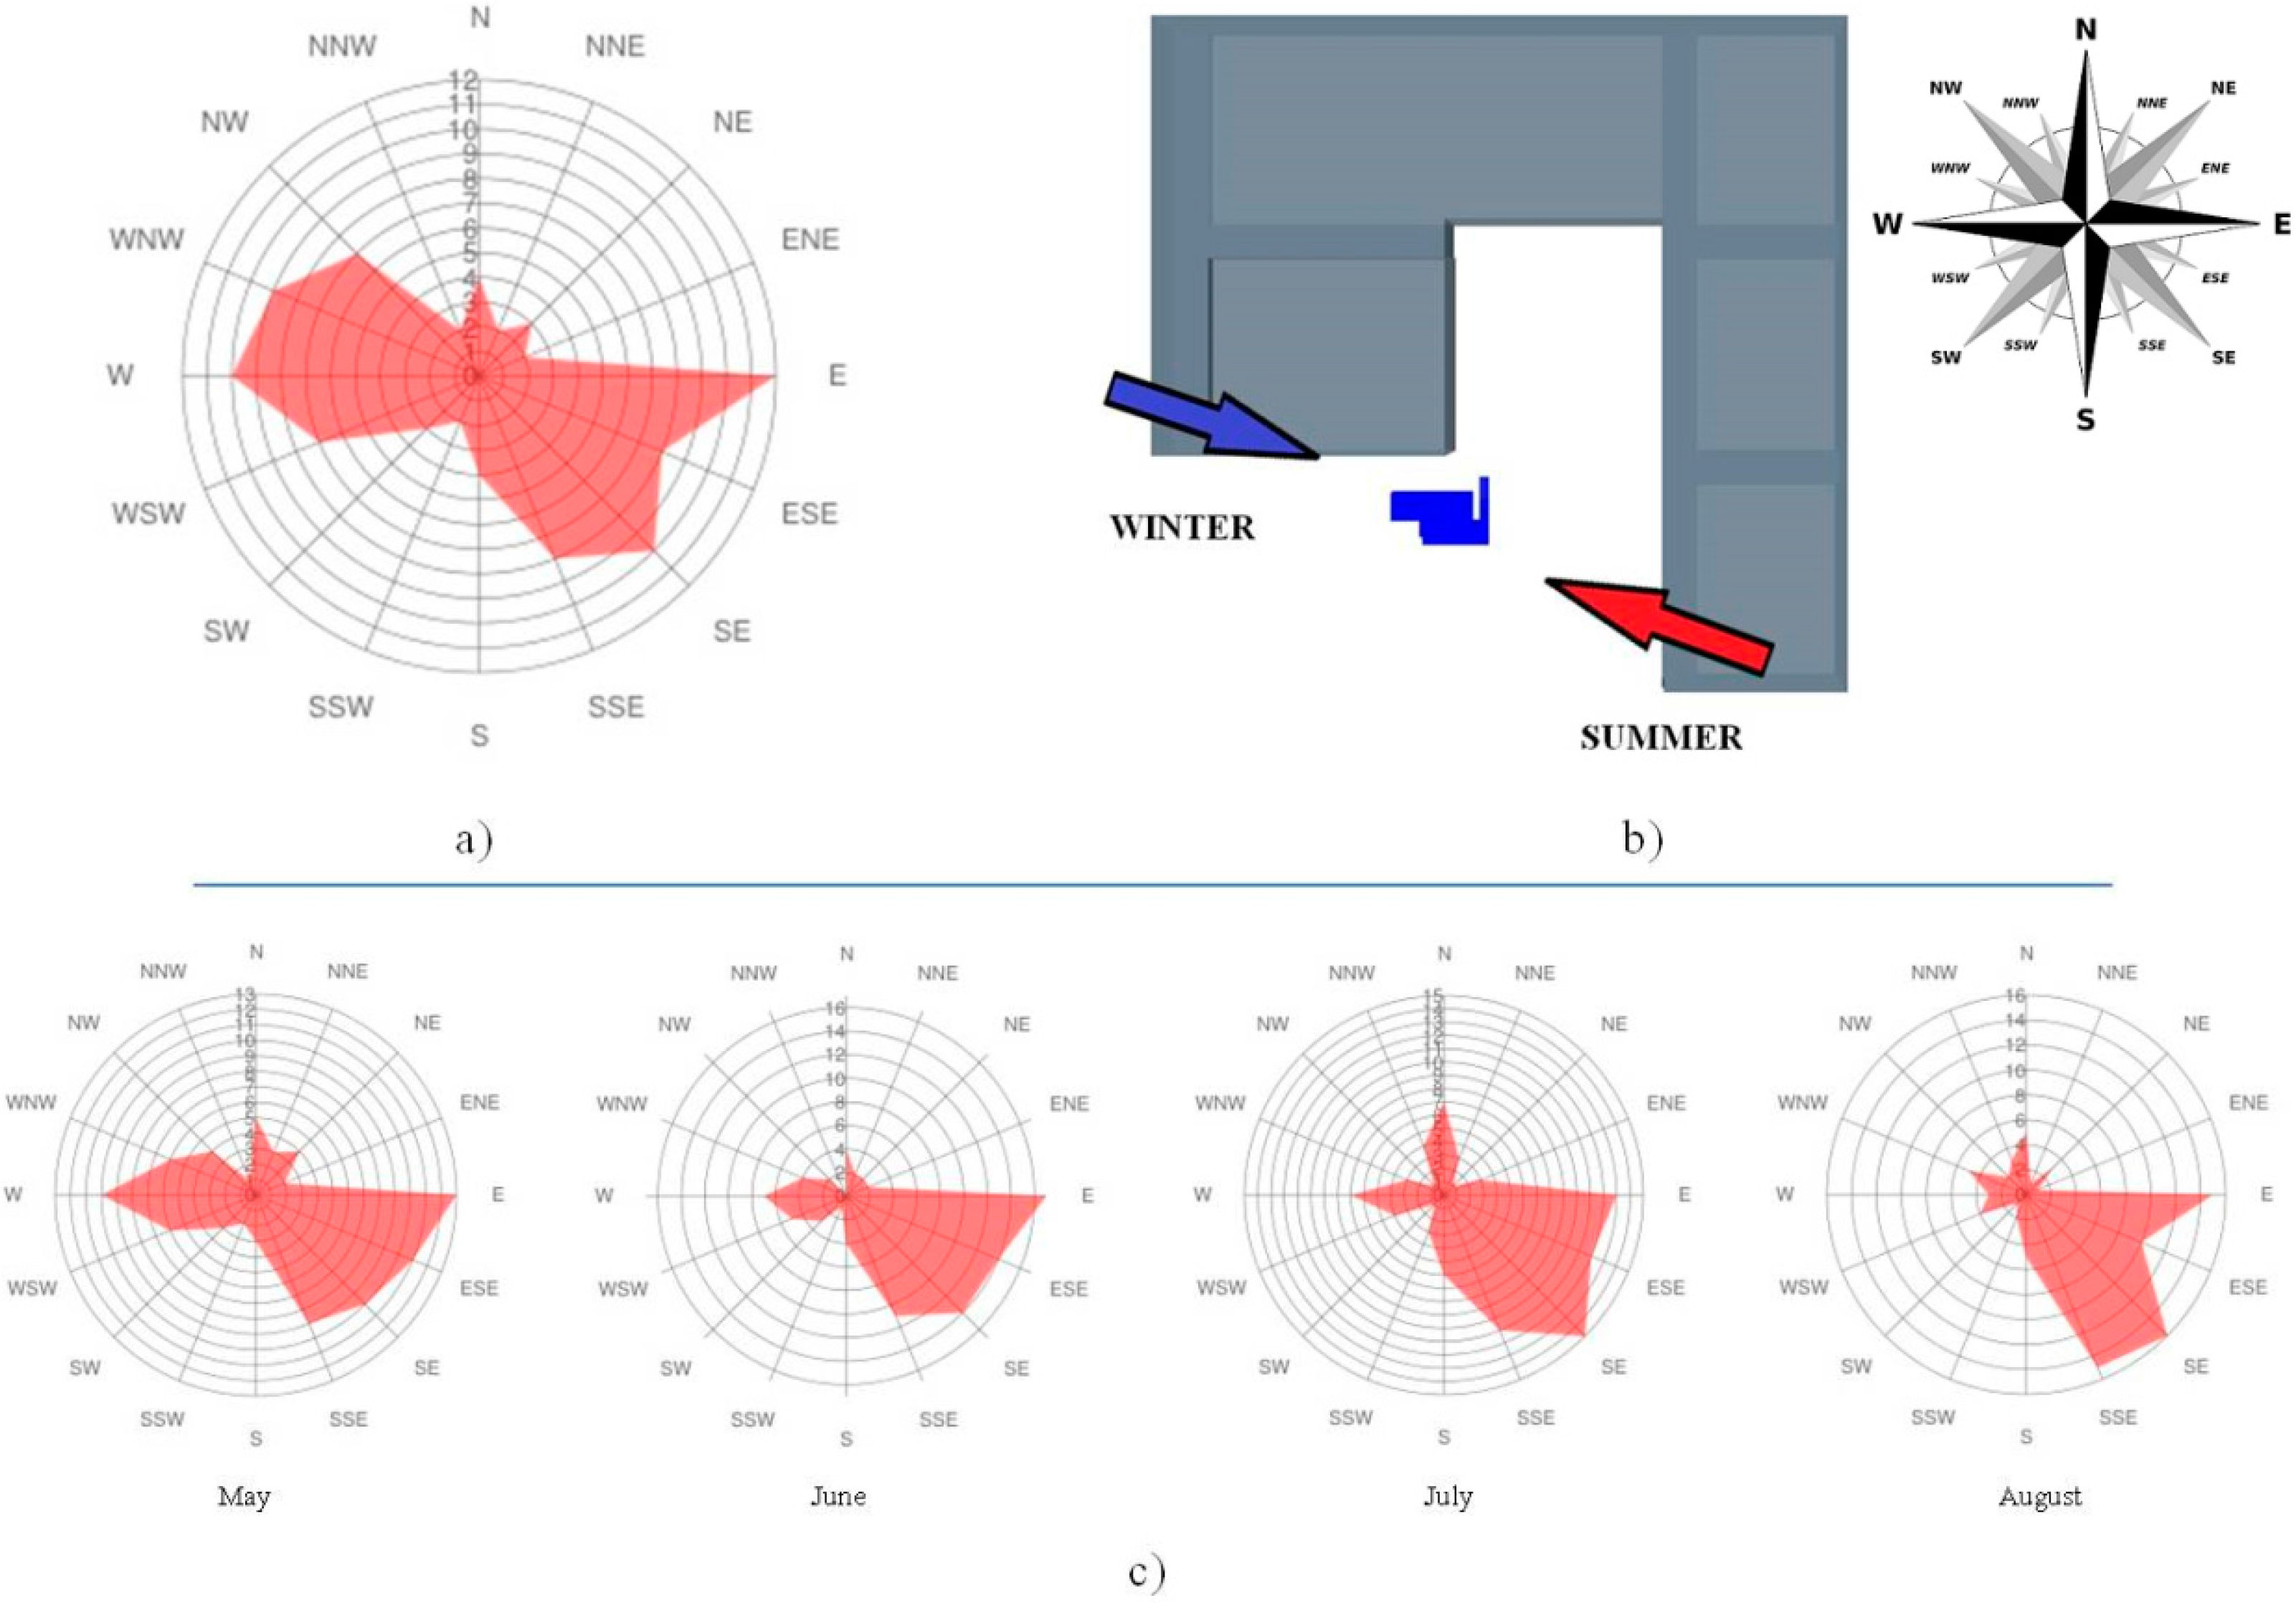
On the other hand, the sea location has a paramount influence in wind directions. The wind main direction determination is important for the efficient NV implementation as a low carbon technology. In this case, the predominant winds are in the main direction SW-NE in all the coastal regional zones [
18]. Consequently, façades opening orientation and distribution analysis will be strongly recommended in the building design stage to ensure and increase NV effect.
The Valencian Community has a population of near 5,000,000 people distributed as shown in
Figure 2 [
17]. Moreover, the coastal strip is a national and international touristic area, so the population is hugely increased during vacation. The 20% of the residential houses are considered as secondary dwellings [
17]. Thus, the potential CO
2 savings in the residential sector acquires a relevant weight during holiday periods (from March to October). Therefore, the design of the buildings placed within the coastal strip has a special interest during spring, summer and autumn time, when the occupancy is high and the indoor temperature might rise above the comfort limit.
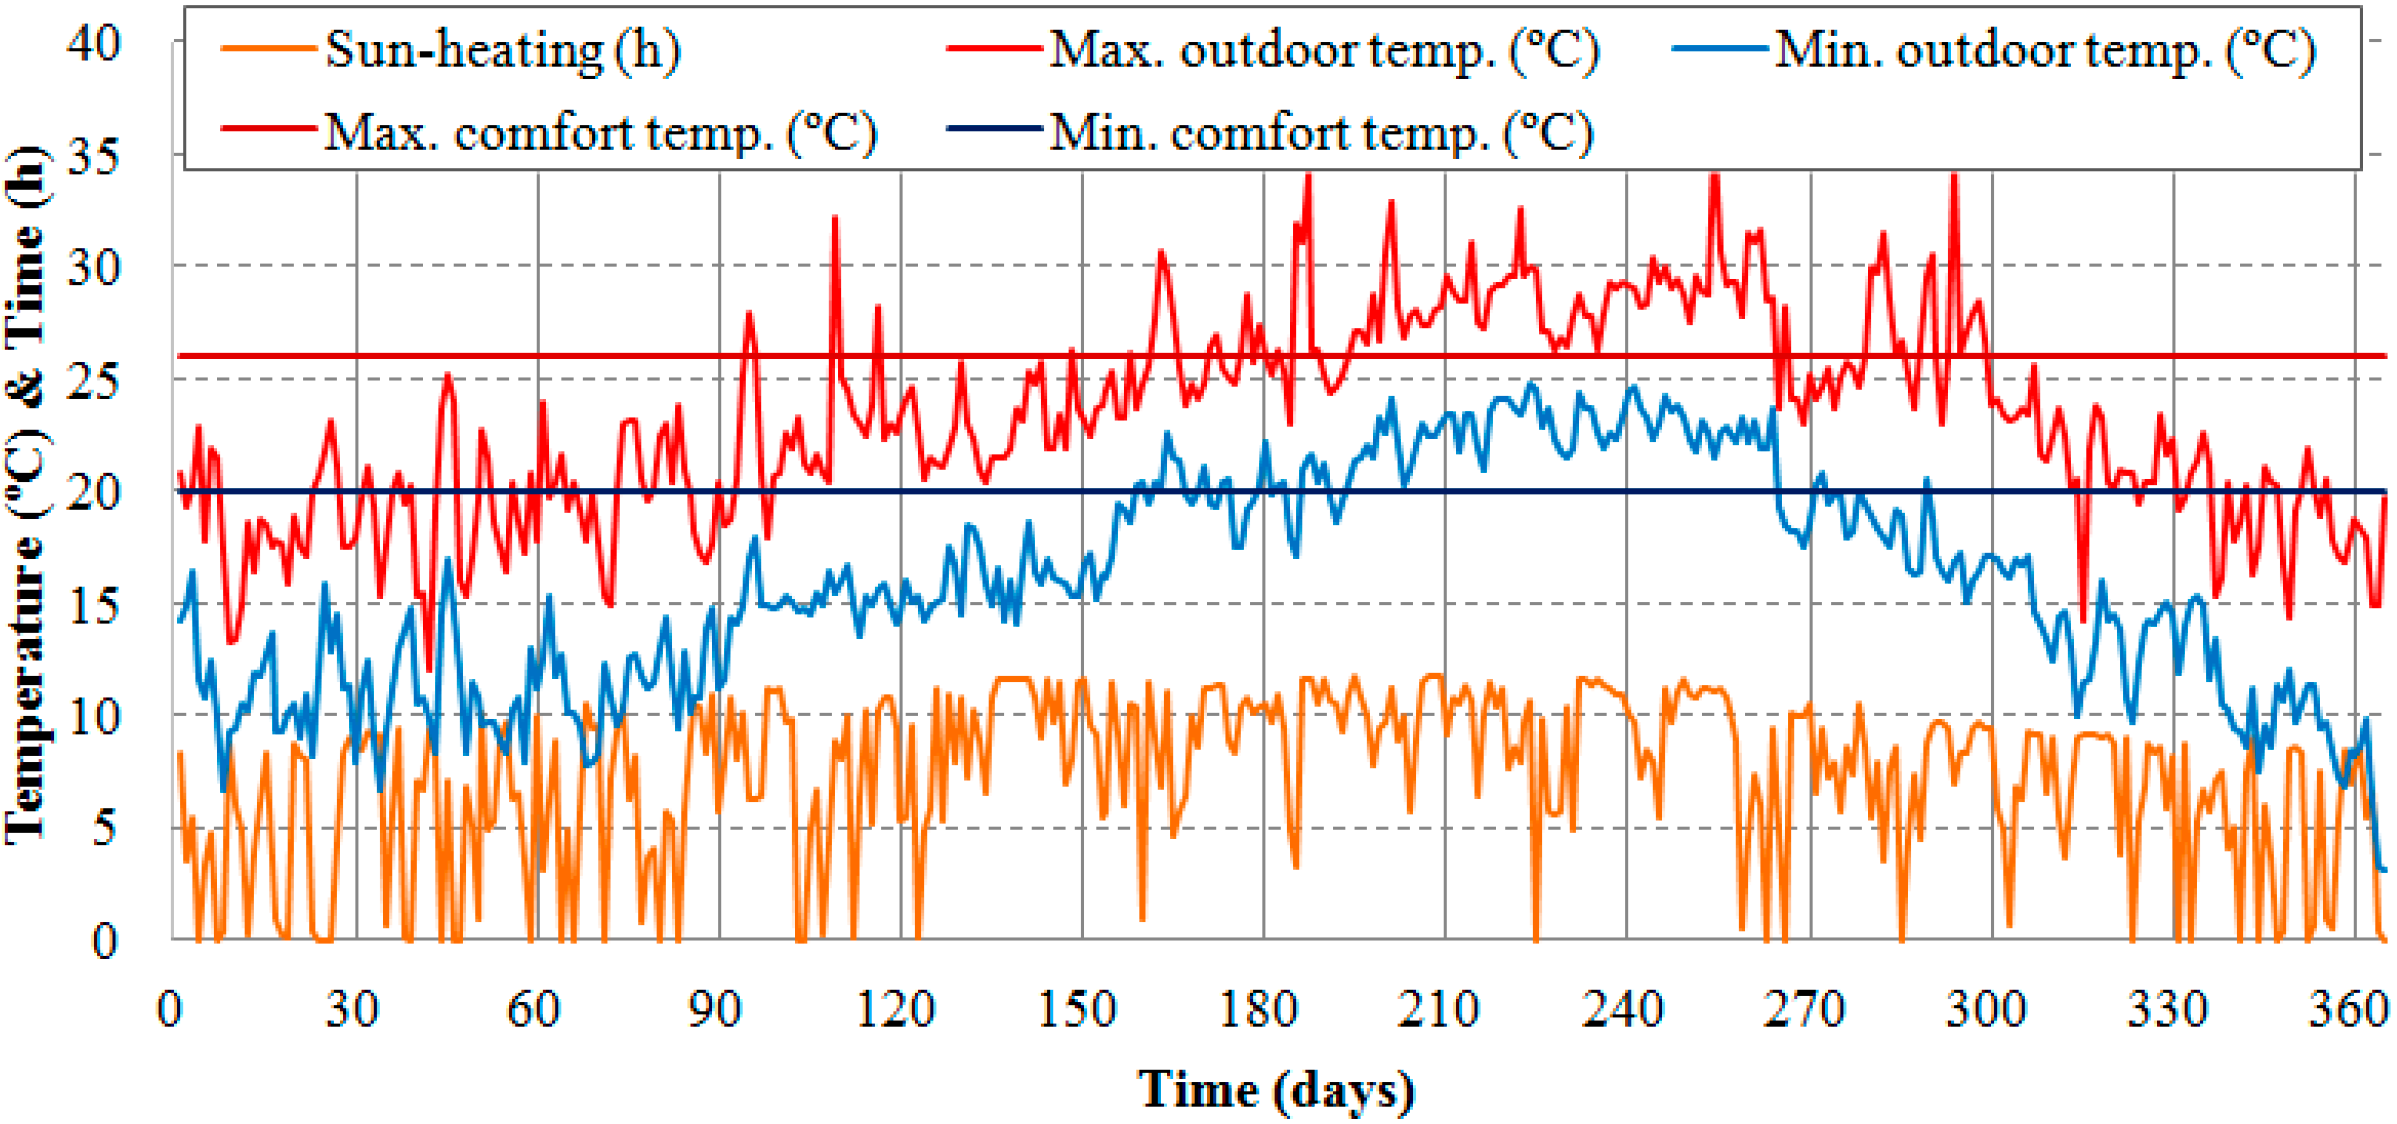
It should be remarked that the complete region is a very high sun-heated area (average of 8.3 h/day) so the building heat gains due to sun complicate the energy efficiency during the cooling period.
Figure 3 shows the sun hours along the year [
19].
Although the sun-heated period is long, the outdoor temperatures are most of the time within the comfort range [
19] as shown in
Figure 3. These conditions are particularly suitable to maximize the NV use to improve buildings energy efficiency in the region. Thus, a good building design should ensure achieving indoor comfort conditions while having low CO
2 emissions related to the building energy consumption.
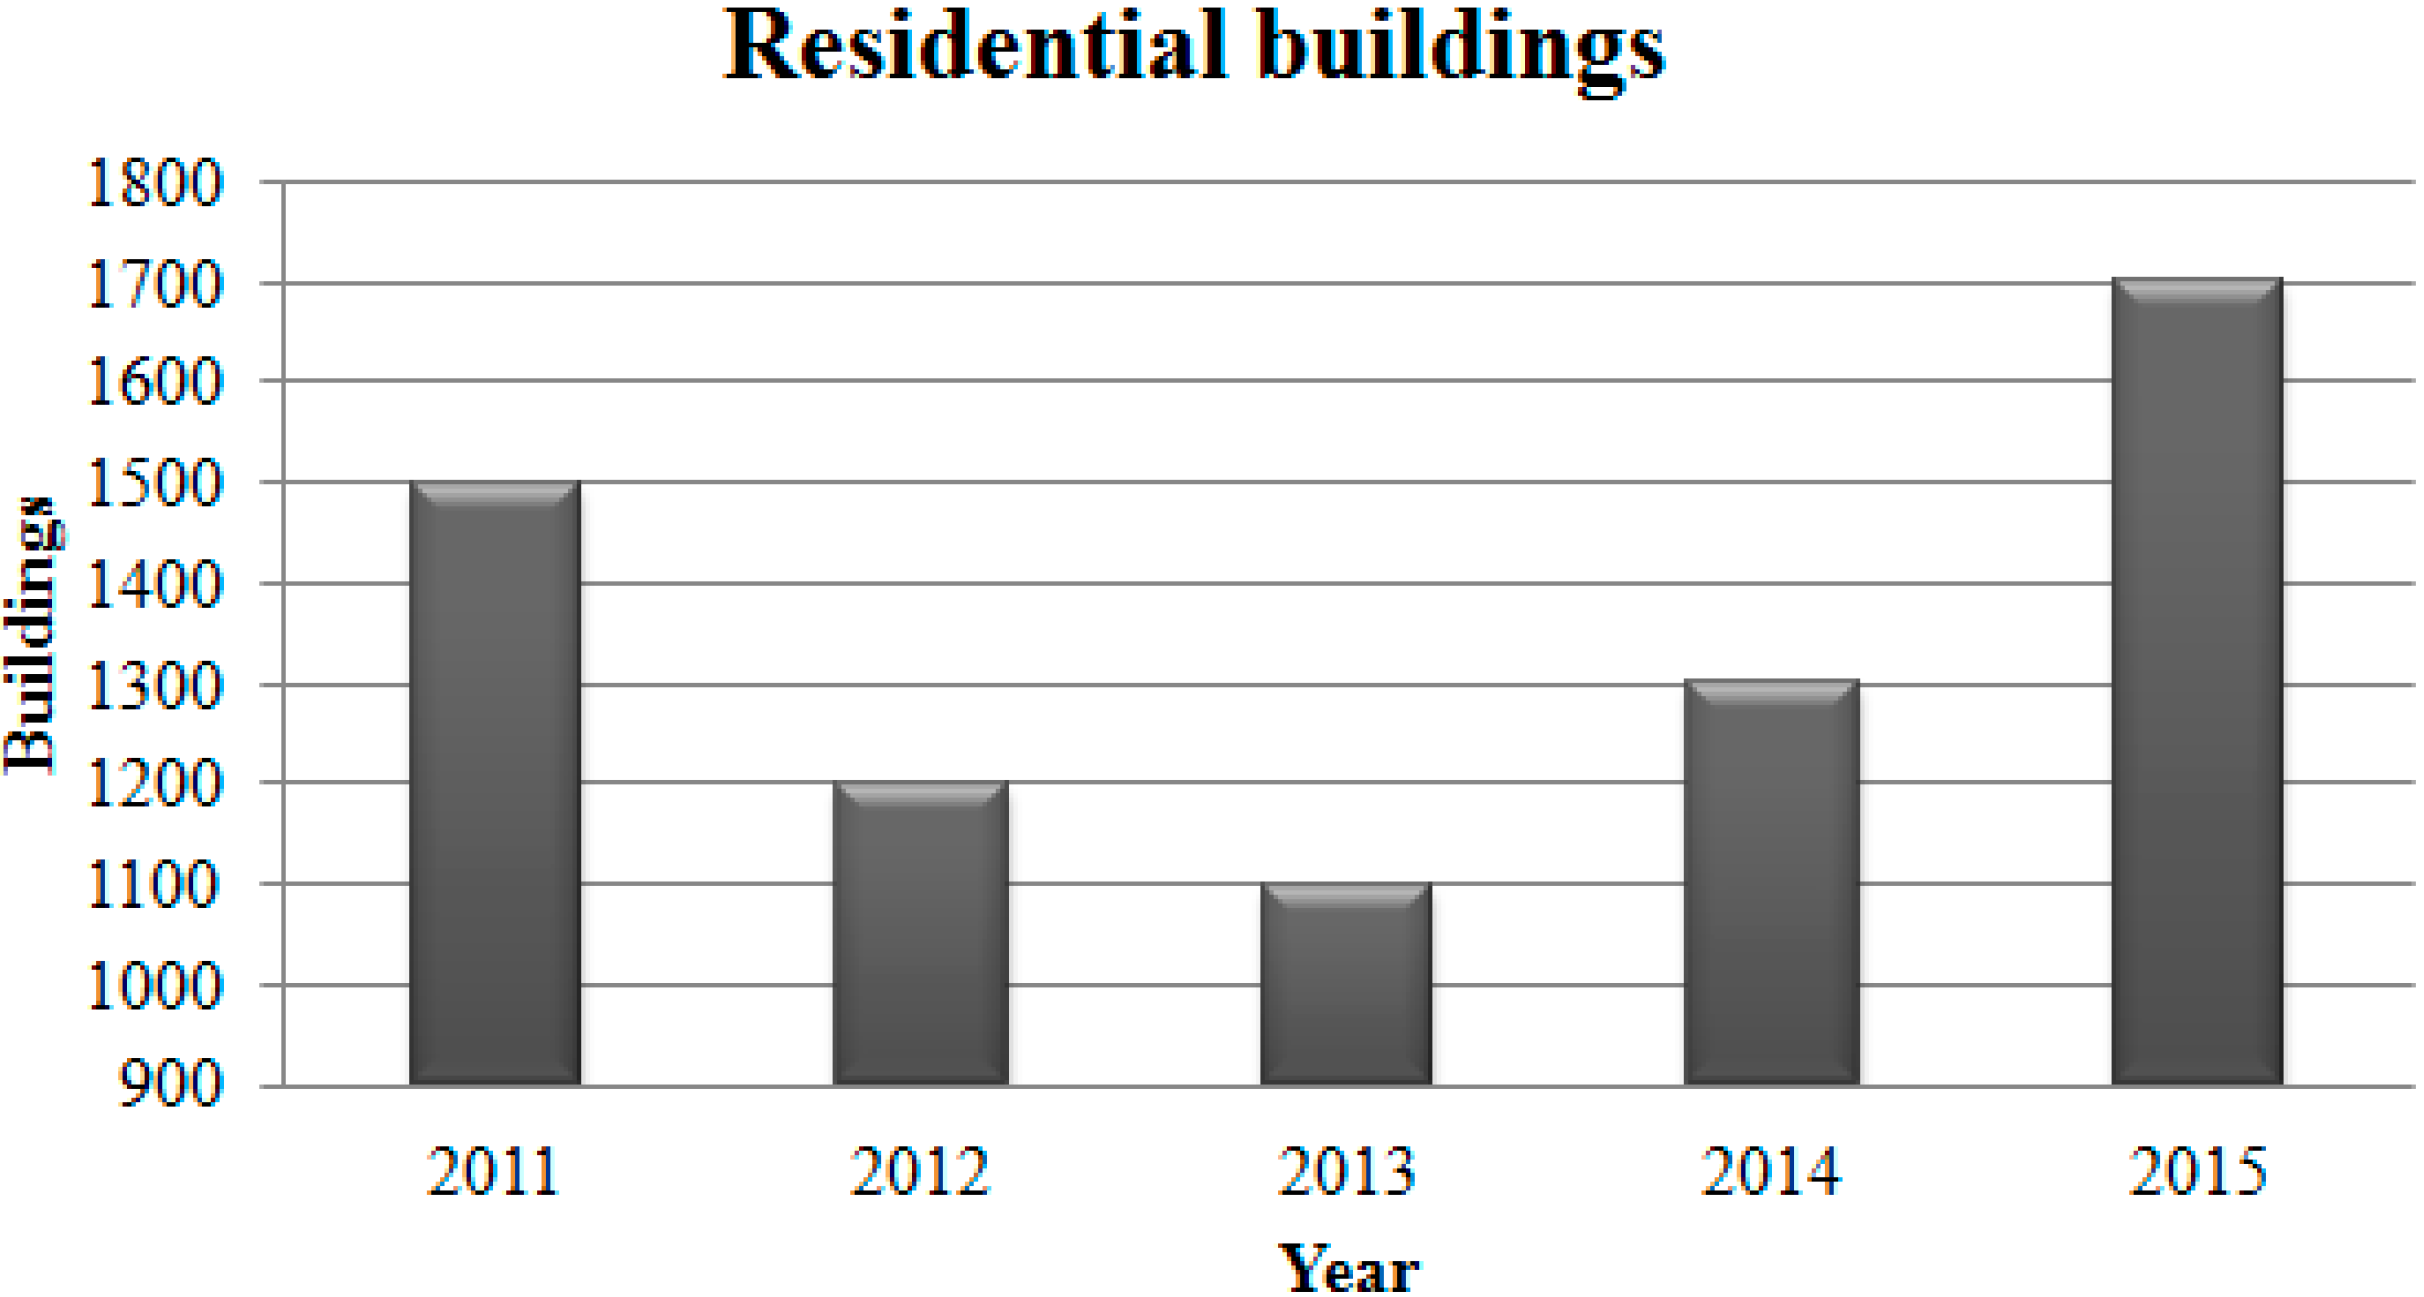
The dwellings are growing continuously in the Valencian region.
Figure 4 [
17] shows the new residential building construction evolution during the last five years. Although there has been a decrease in the number of buildings during some years due to extraordinary economic conditions, the new buildings have been increased until near 1700 constructed buildings during 2015.
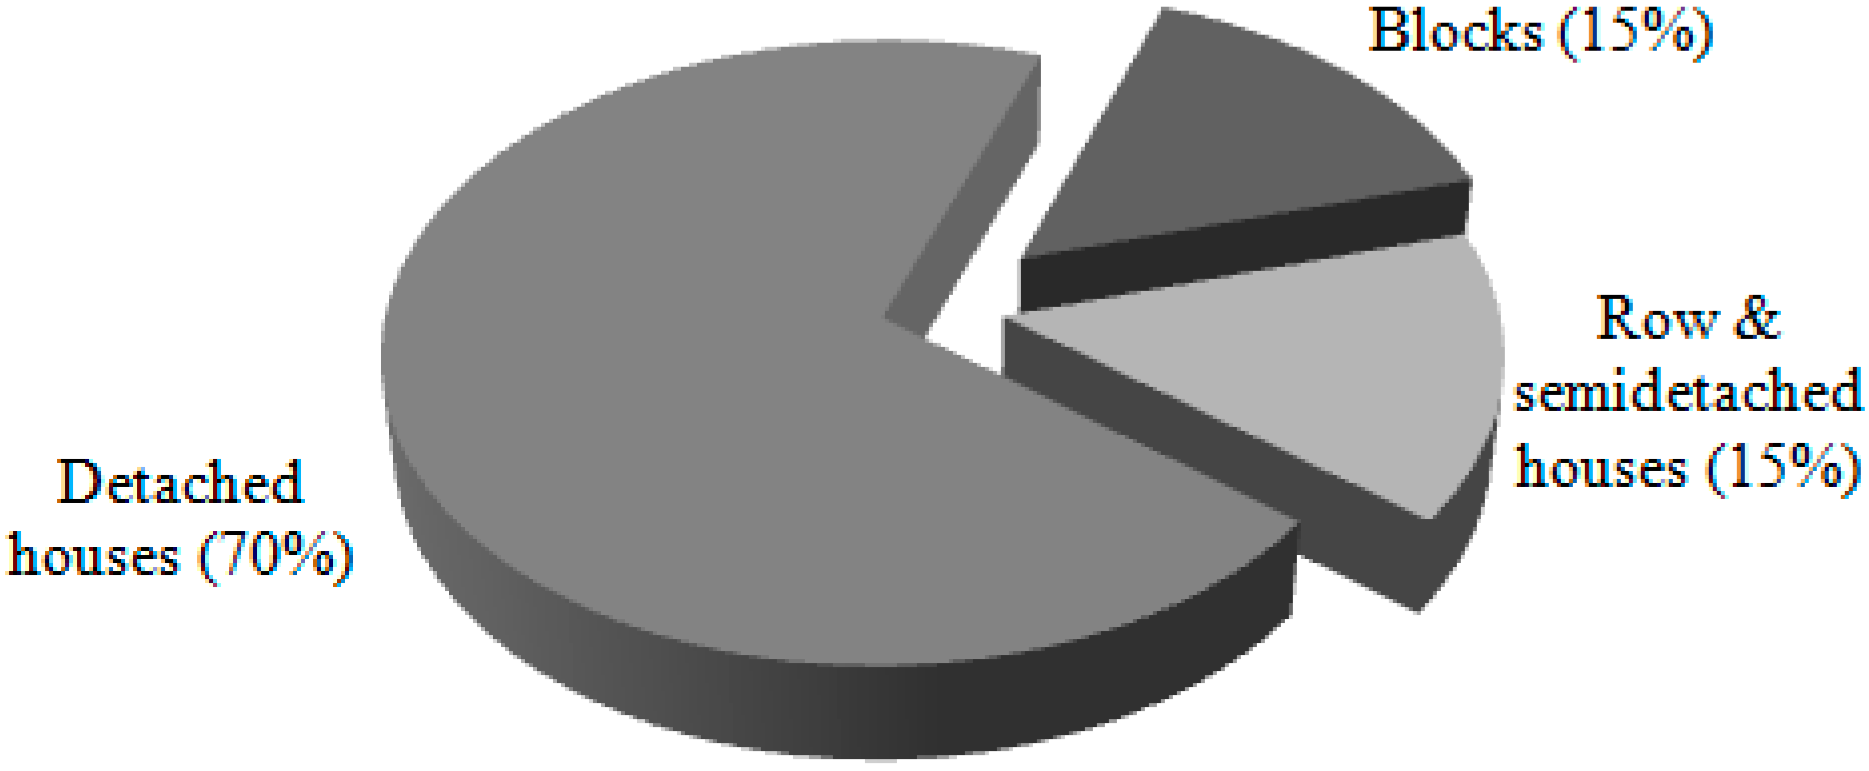
Multi dwelling, single family houses, detached and semi-detached houses are included in the data shown in
Figure 4. Likewise, buildings can be classified into three categories: blocks, semidetached and detached houses. Seventy percent of new houses built during 2015 are detached houses (see
Figure 5) [
17], the most important new buildings when compared to blocks, row and semidetached houses. Consequently, the case study building selected is a detached house to cover the most probable building typology.
2.2. Drivers and Barriers to Natural Ventilation Implementation
The building laws are not too permissive regarding NV in Spain, as the installation of mechanical ventilation is mandatory in most of buildings. The ventilation applicability in buildings is regulated through the rules laid down in the “Código Técnico de la Edificación (CTE)” (building technical rules) [
20] and the “Reglamento de Instalaciones Térmicas en los Edificios (RITE)” (thermal building installations regulations) [
21].
The residential dwellings, among others, need to comply with the regulation “DB HS3 Calidad de aire interior” (indoor air quality regulation) included in the CTE. A minimum air flow change is required, depending on building dimensions and occupancy. Therefore only mechanical and hybrid ventilation are currently accepted. Oppositely, the RITE allows NV use in some critical scenarios as fire smoke evacuation and/or due to too high CO
2 concentration. In this case, NV systems could work by opening or closing the NV duct gates. In any case, the normal conditions ventilation through building openings or windows is not actually allowed in the Spanish regulation. Conversely, countries such as Denmark use the NV techniques although having a colder climate than Spain [
22].
The only NV use is not allowed in order to guarantee the minimum ventilation rate always, even under thermal inversion conditions. The minimum ventilation rate is calculated depending on the outdoor and the target indoor air quality requirement [
21]. The problem arises when the bad indoor air quality allowed requires the air to be filtered by a high efficient filter. Consequently the NV use becomes more difficult due to the additional filter pressure loss.
In the end, although the applicable regulation is not too permissive, NV use is allowed if the minimum ventilation rate, the thermal comfort and the indoor air quality are ensured. Hence there should be no problem to use only NV if the building designs are properly done to ensure it. In this sense, the Spanish regulation suggests CFD use to assist building designers to ensure it. Accordingly the building energy efficiency behaviour is increased and the building operation CO2 emissions are reduced.
2.3. Case Study Building Description
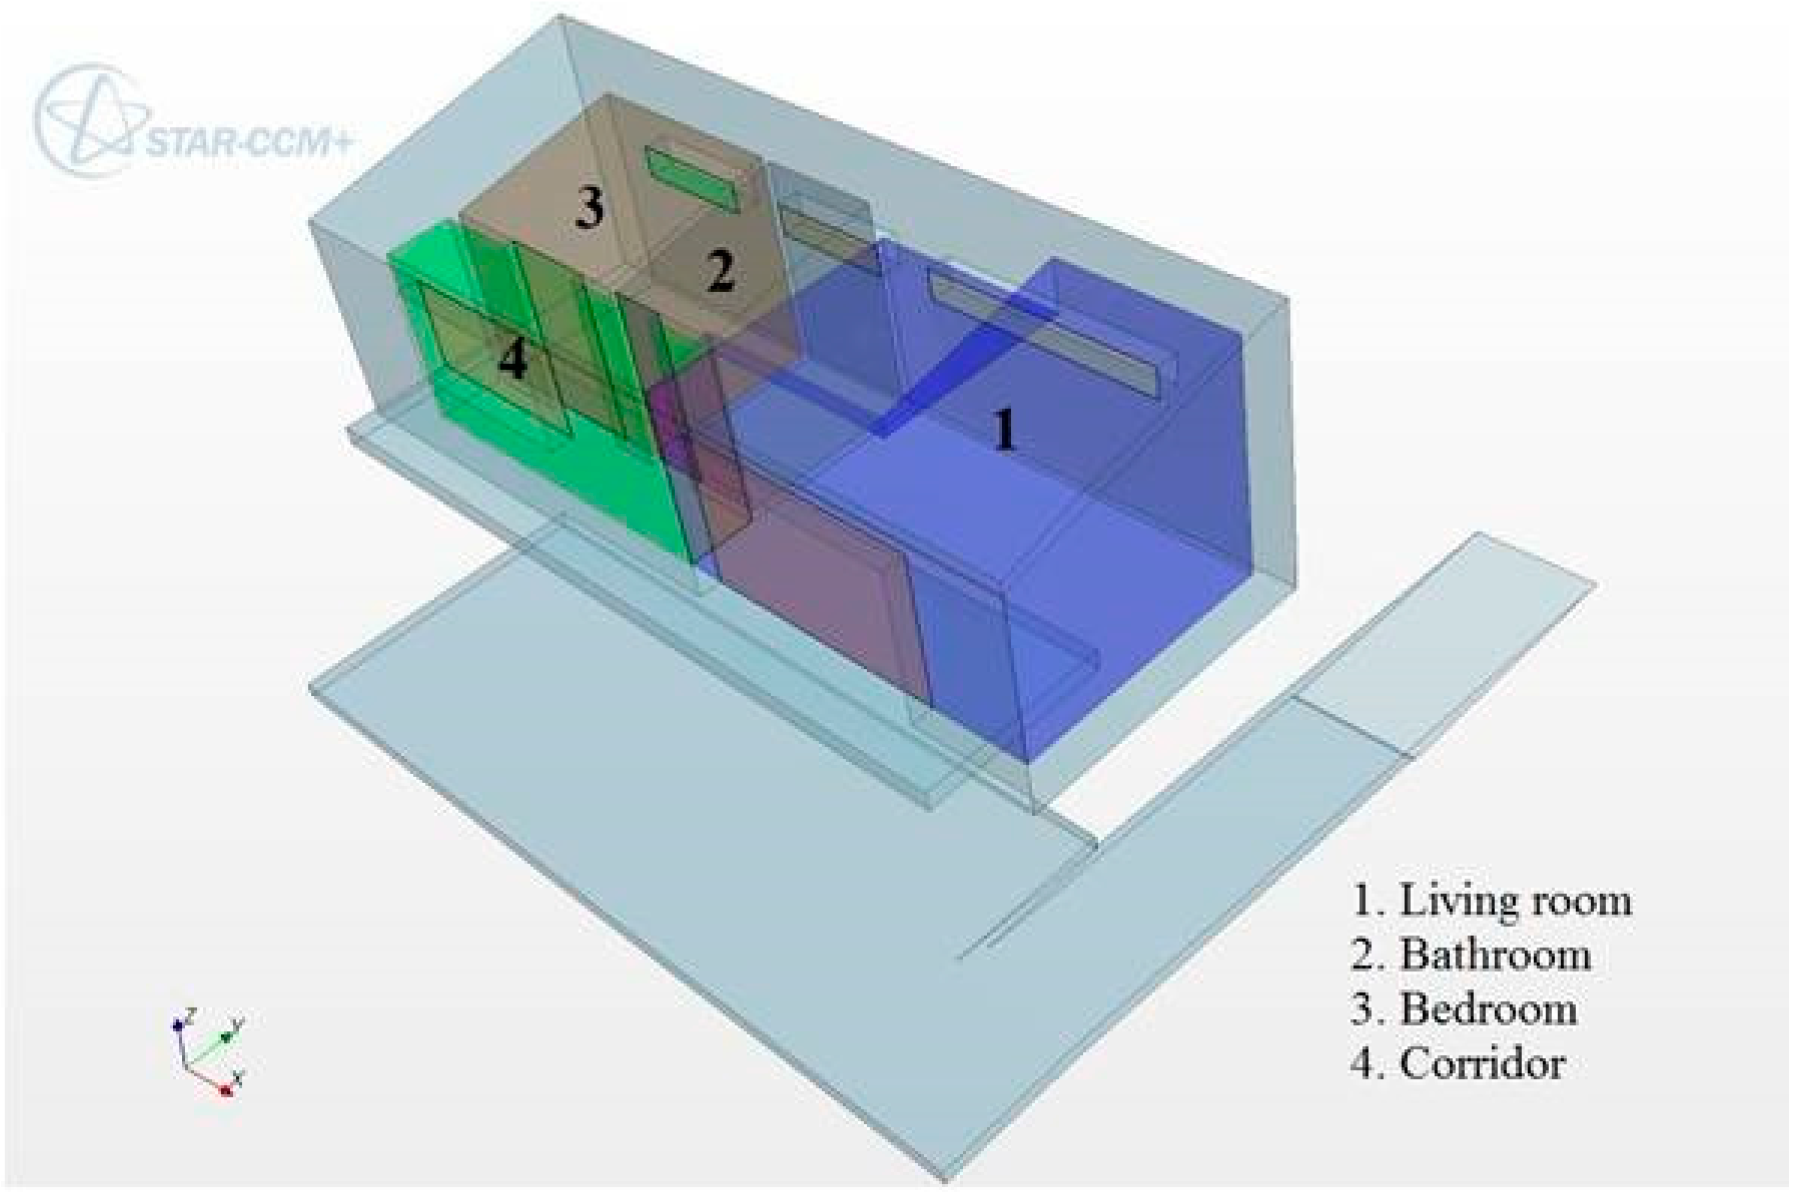
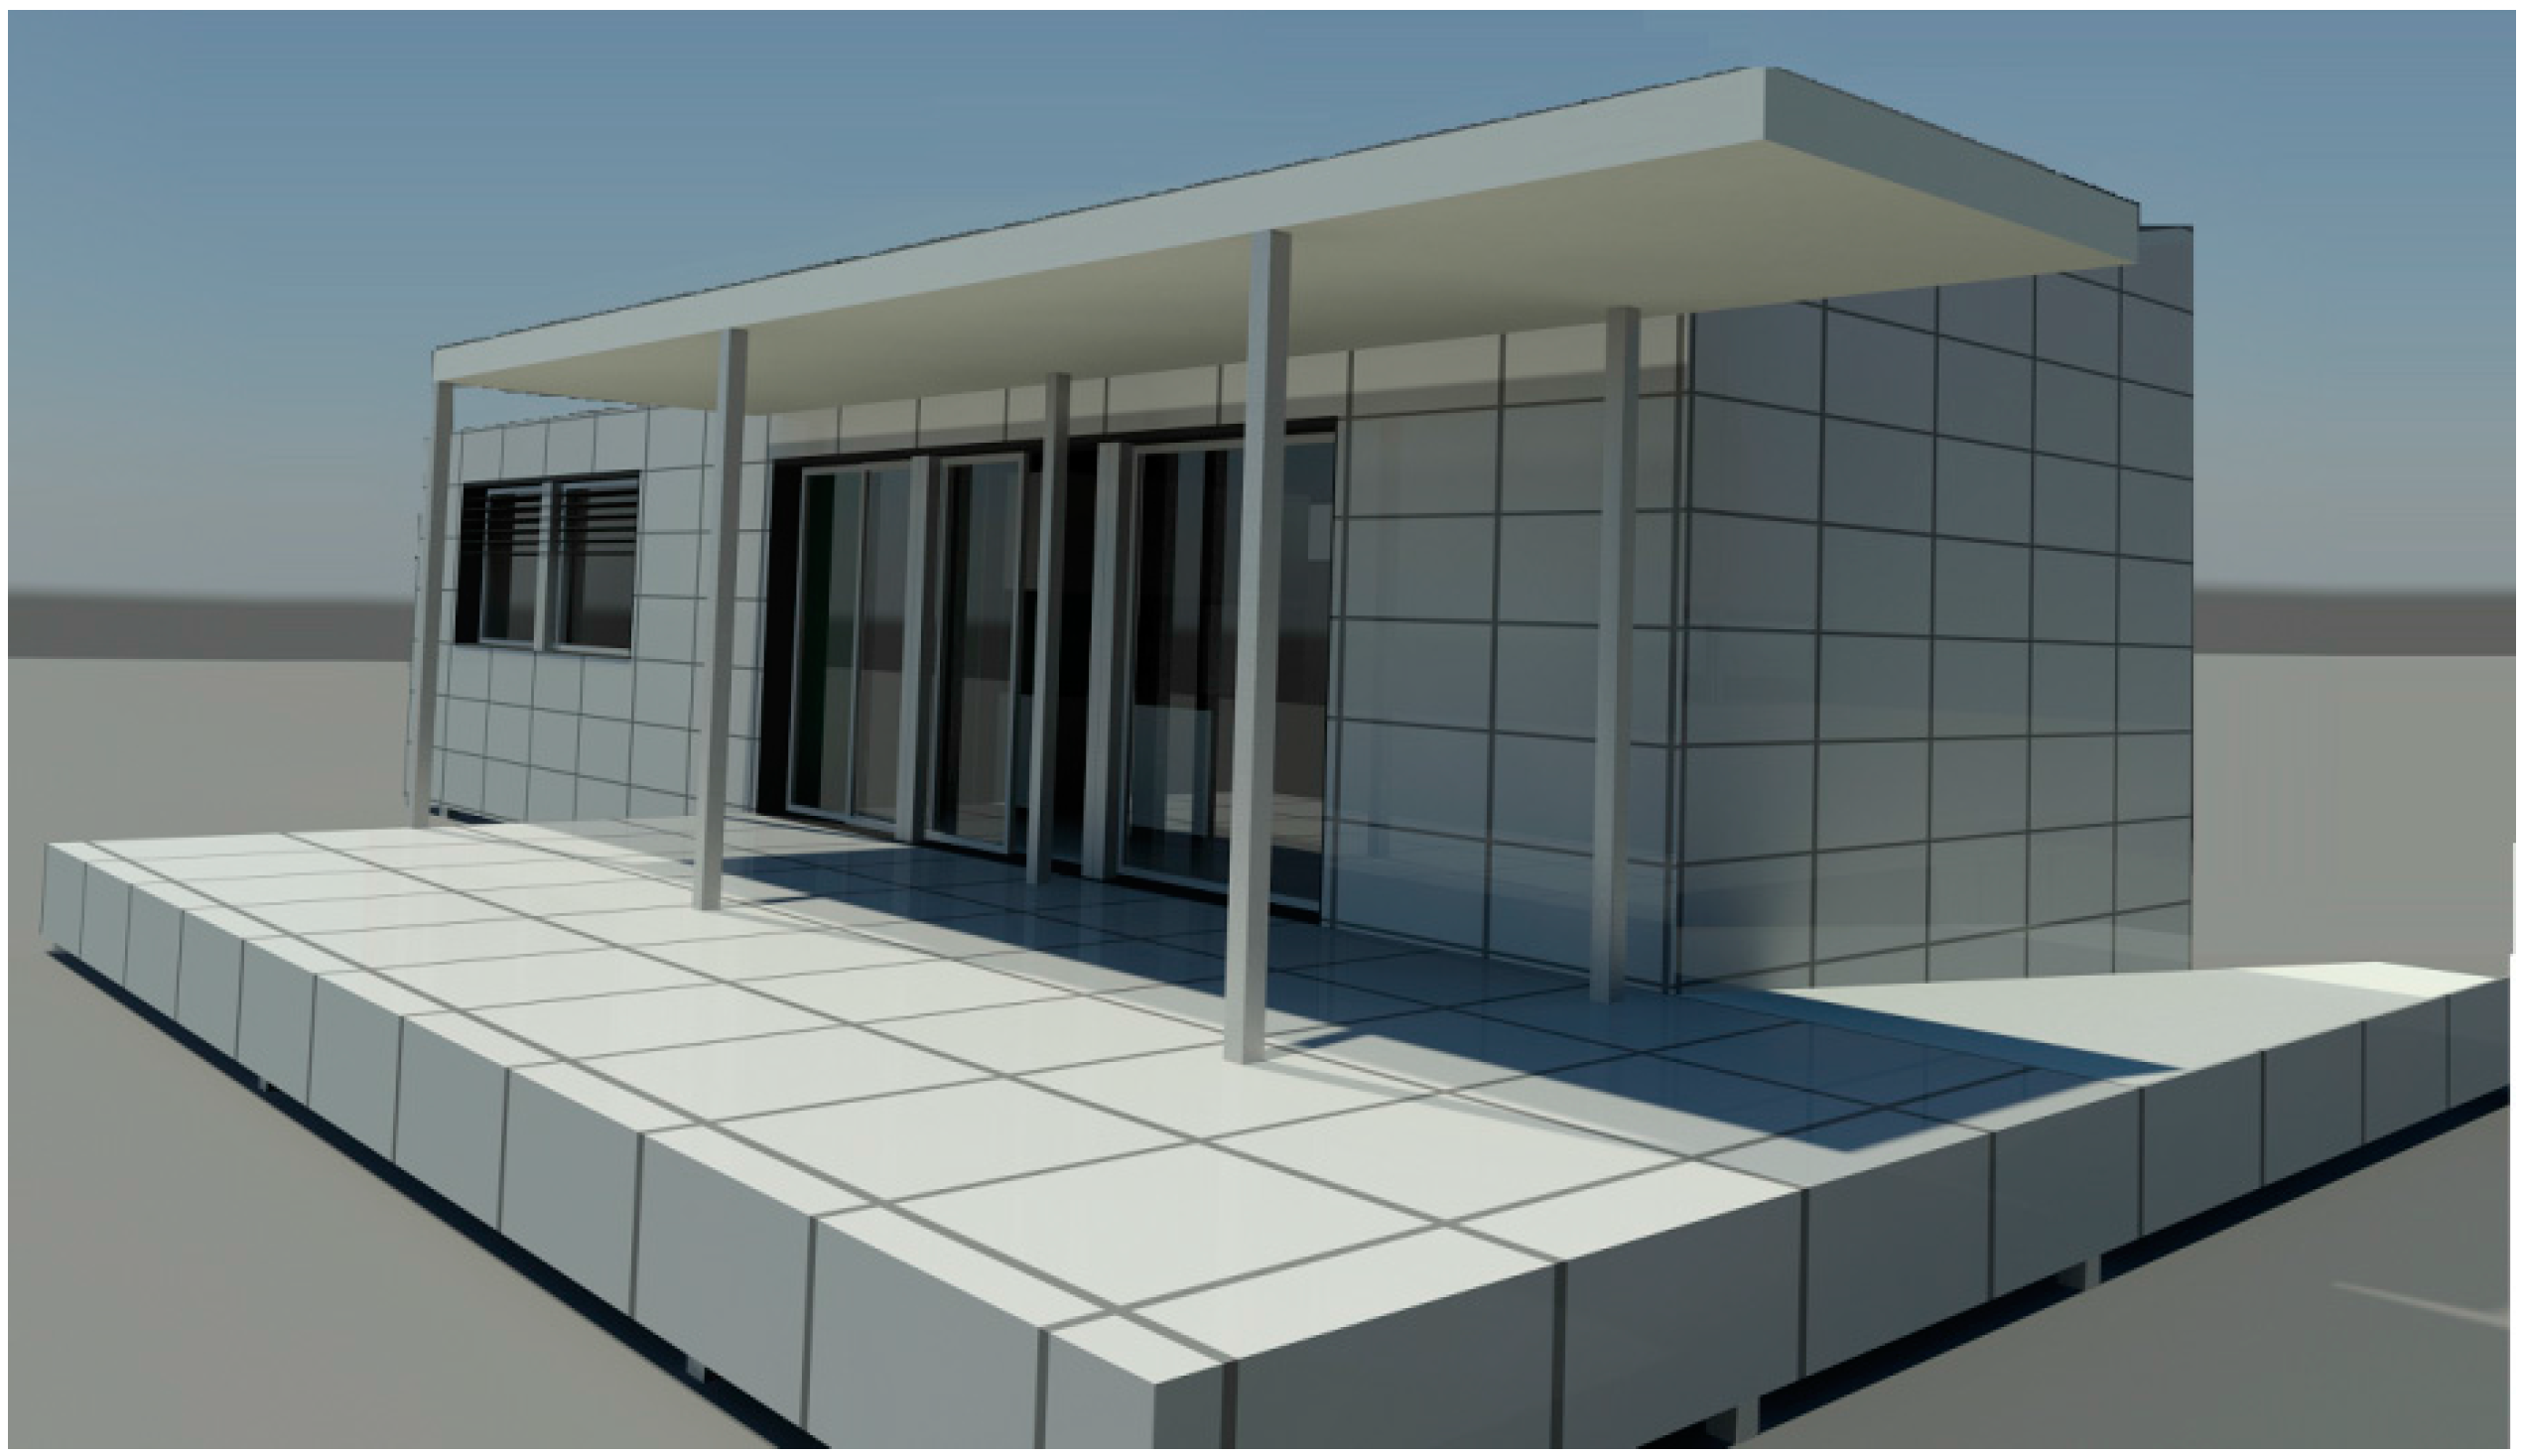
The proposed design approach is conducted through a case study building. The case study building is carefully selected, considering the most common residential houses in the Valencian Community region (see
Figure 5). The case study building represents a typical 70 m
2 modular familiar dwelling. The dwelling is a one-floor house (14 m × 5 m), 4 m high located in the Polytechnic University of Valencia, east of Spain. The house is at 39°28′50″ N 0°20′43″ W, close to the Mediterranean Sea. The internal building layout is divided into three rooms connected by a short corridor. The building has some passive components to avoid solar gains like a pergola at the entry and shadows in the windows.
Figure 6 shows a render of the prototype building design.
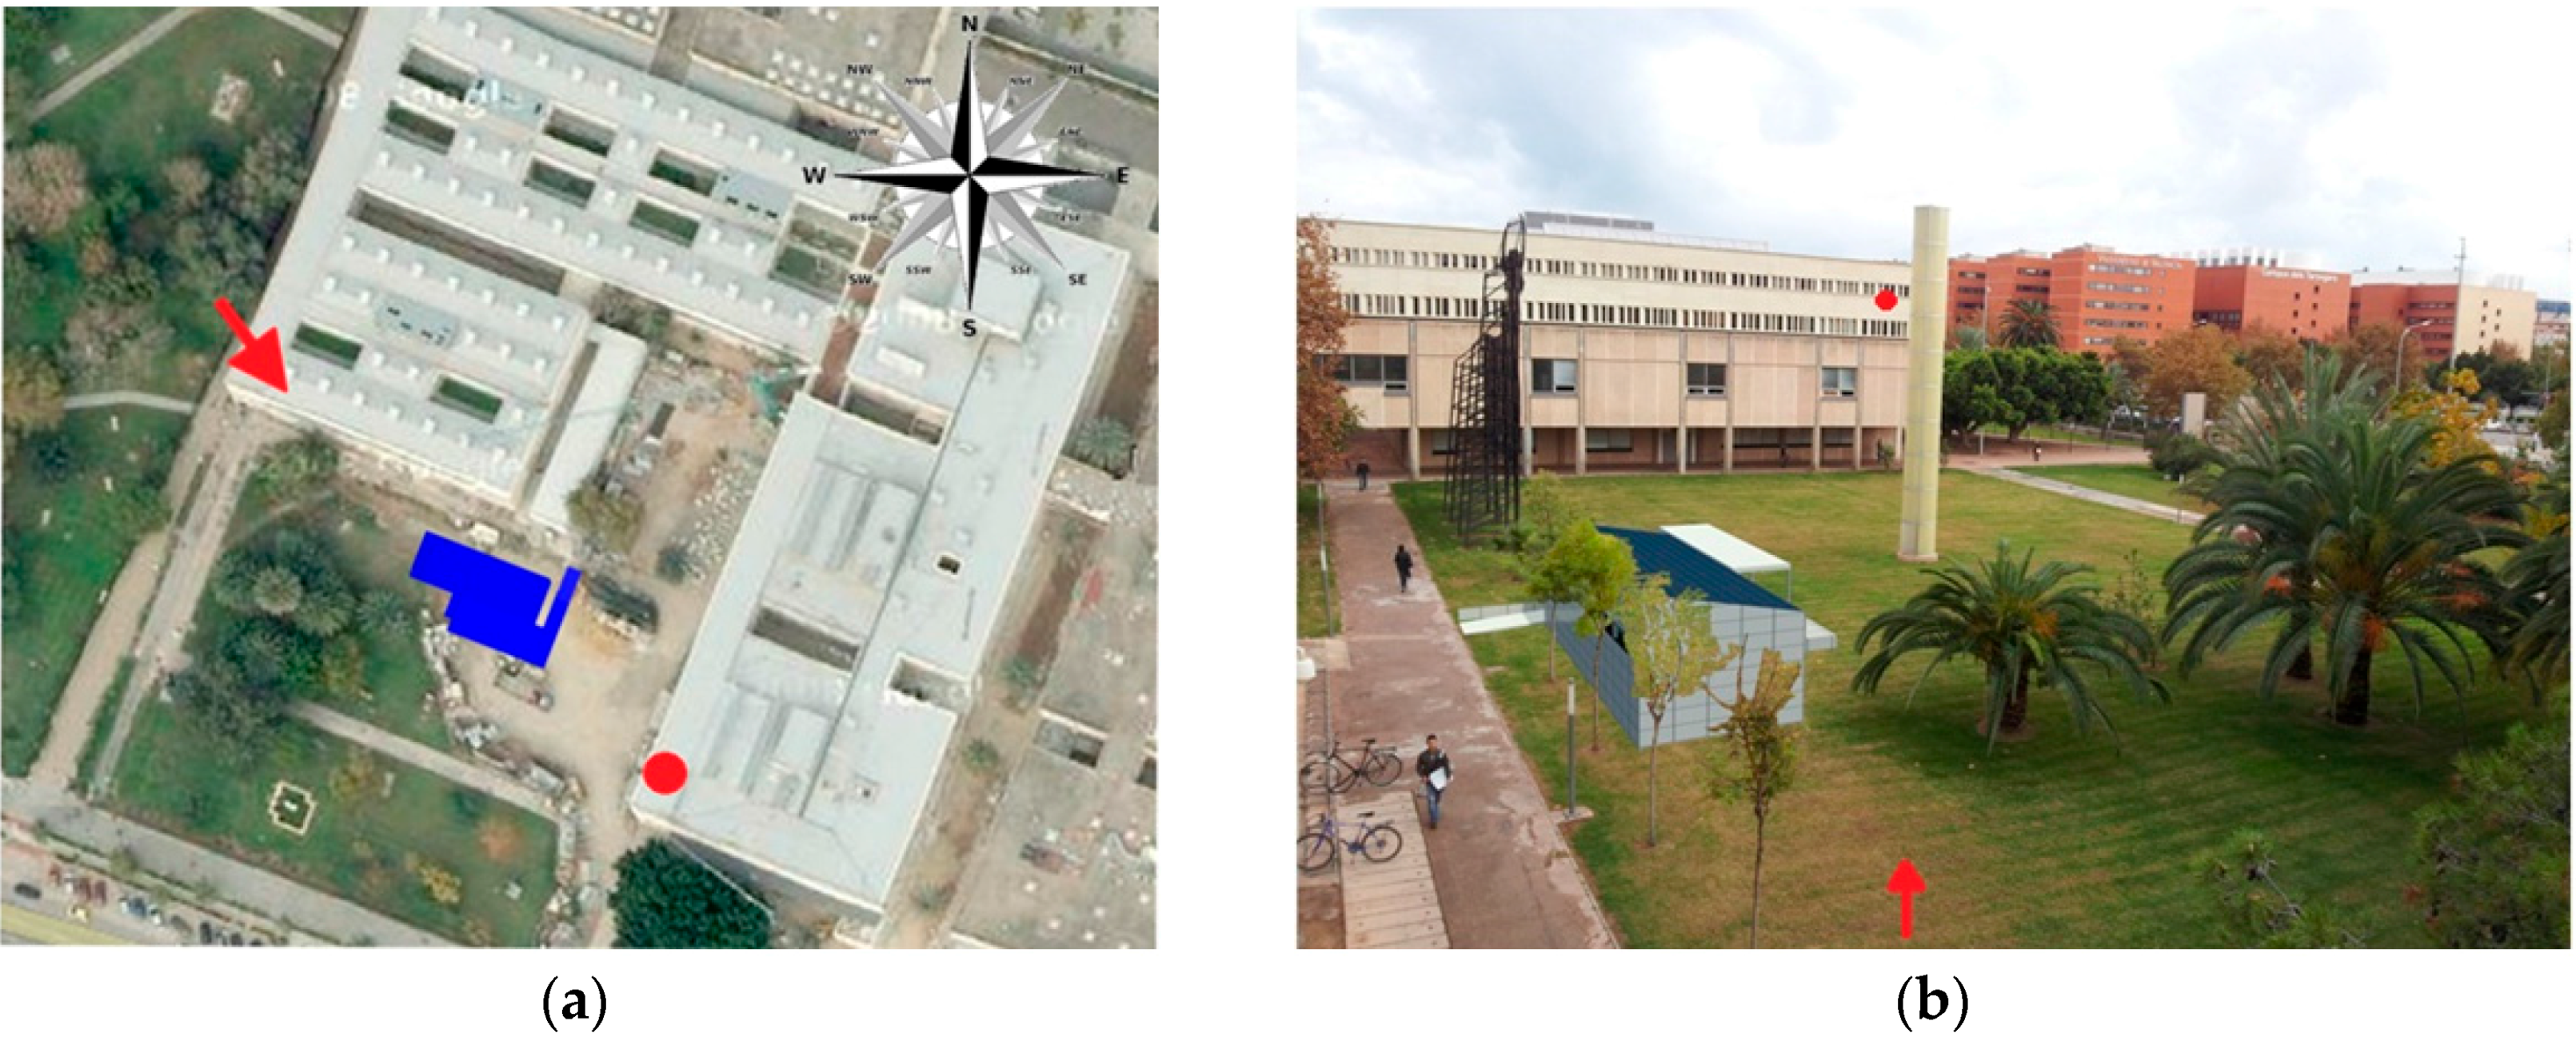
The urban place where the house is going to be built is flat with height difference lower than 5 m. 15 m high constructions are build in the adjacent environment.
Figure 7a provides a plan view of the location where the building will be placed, and
Figure 7b shows a view from the third floor level with a render of the building in the design location (west-east view). In
Figure 7, an arrow and a point indicate the position from which the view is shown.
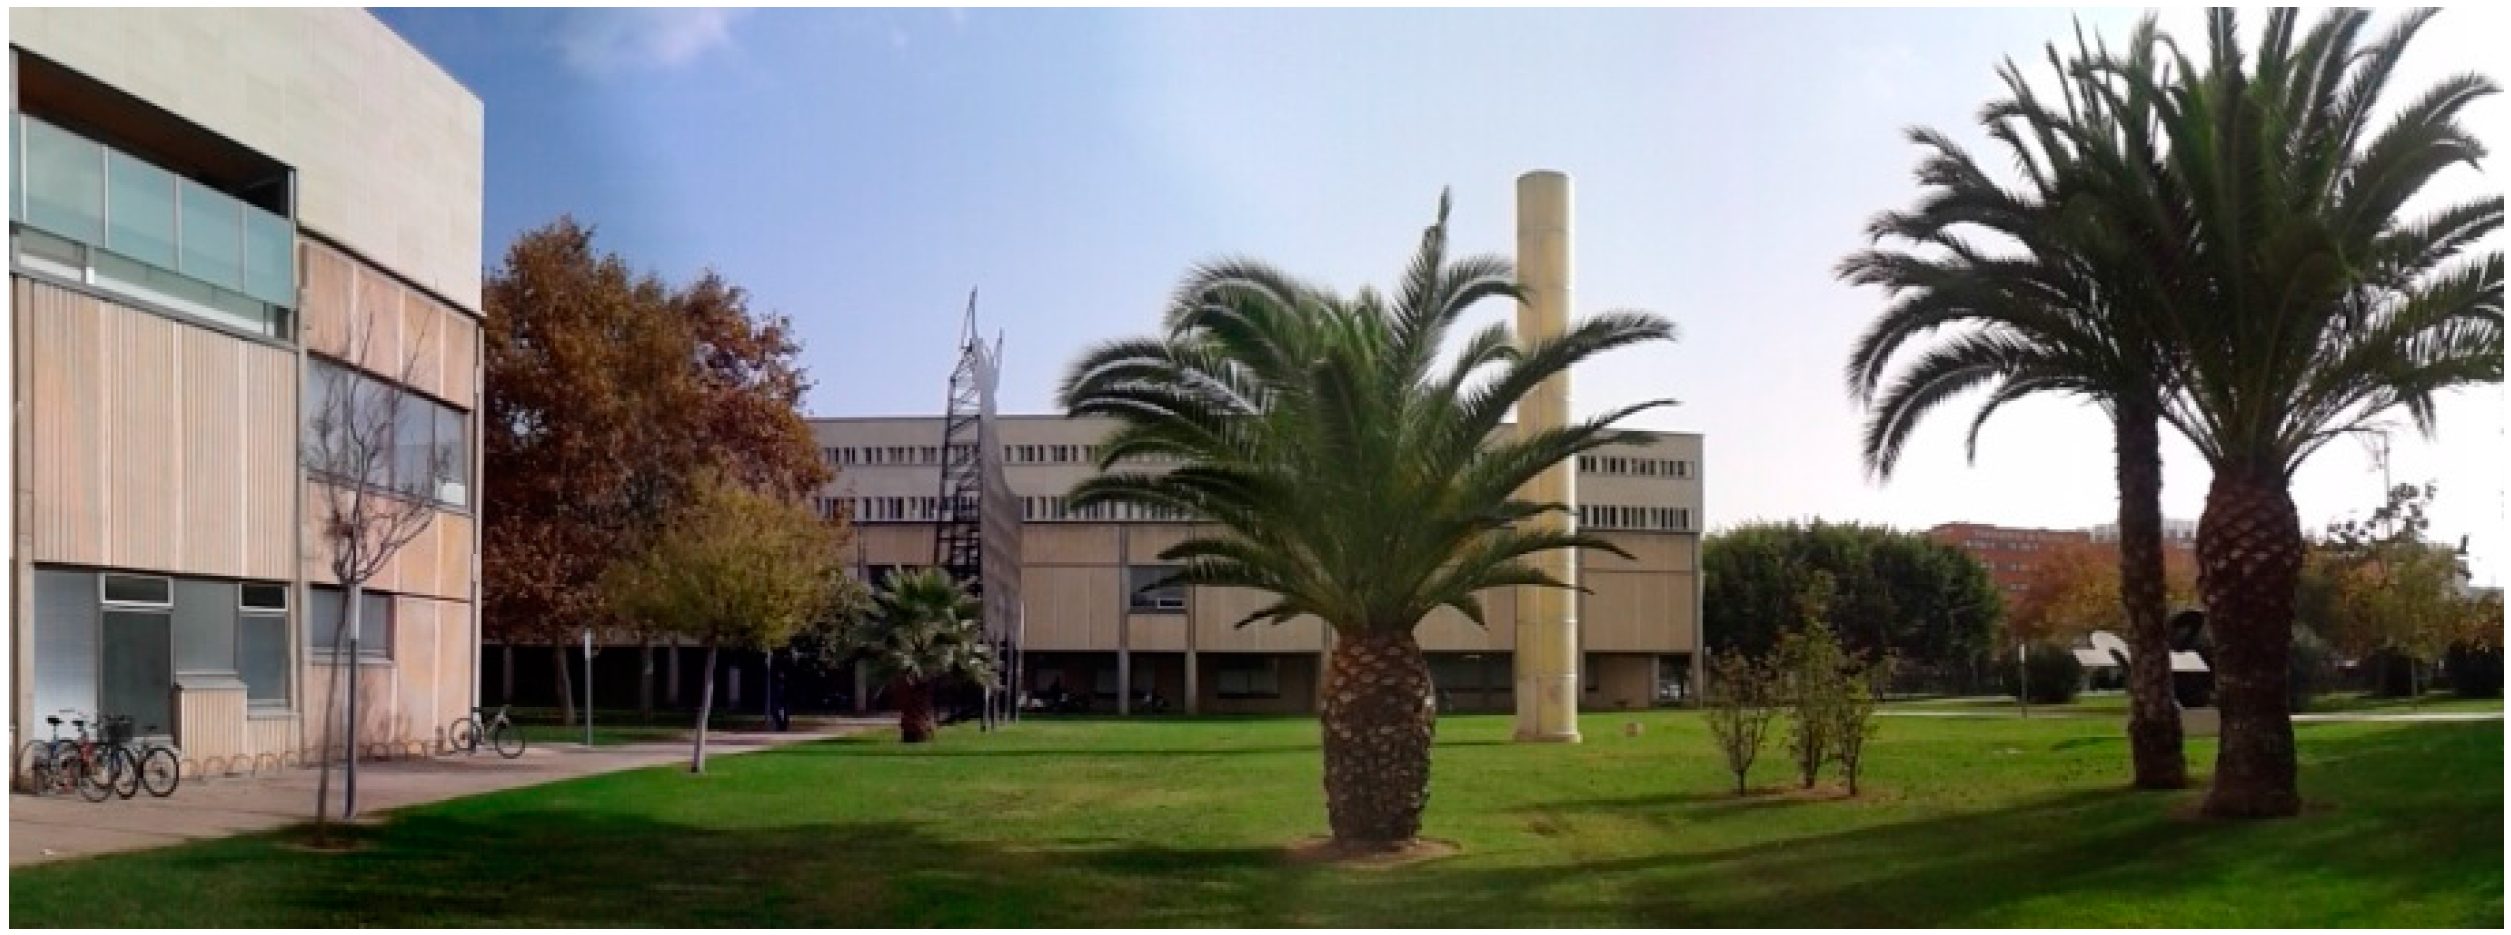
Considering the surroundings where the building is going to be placed, 14 m tall buildings may block winds coming from the south, east, north and west directions (see
Figure 7 and
Figure 8). According to the relative building position respect to the surroundings and the prevailing wind direction in Valencia, east-south-east (ESE) wind should reach the building already relatively disturbed by the presence of surrounding buildings.
The main wind direction strongly affects window orientation for NV design. Therefore the position and size of the openings has to be analysed to provide strong and well-distributed airflow throughout the building. Other aspects are assumed to be constant and already defined (building shape, location, orientation and internal distribution).
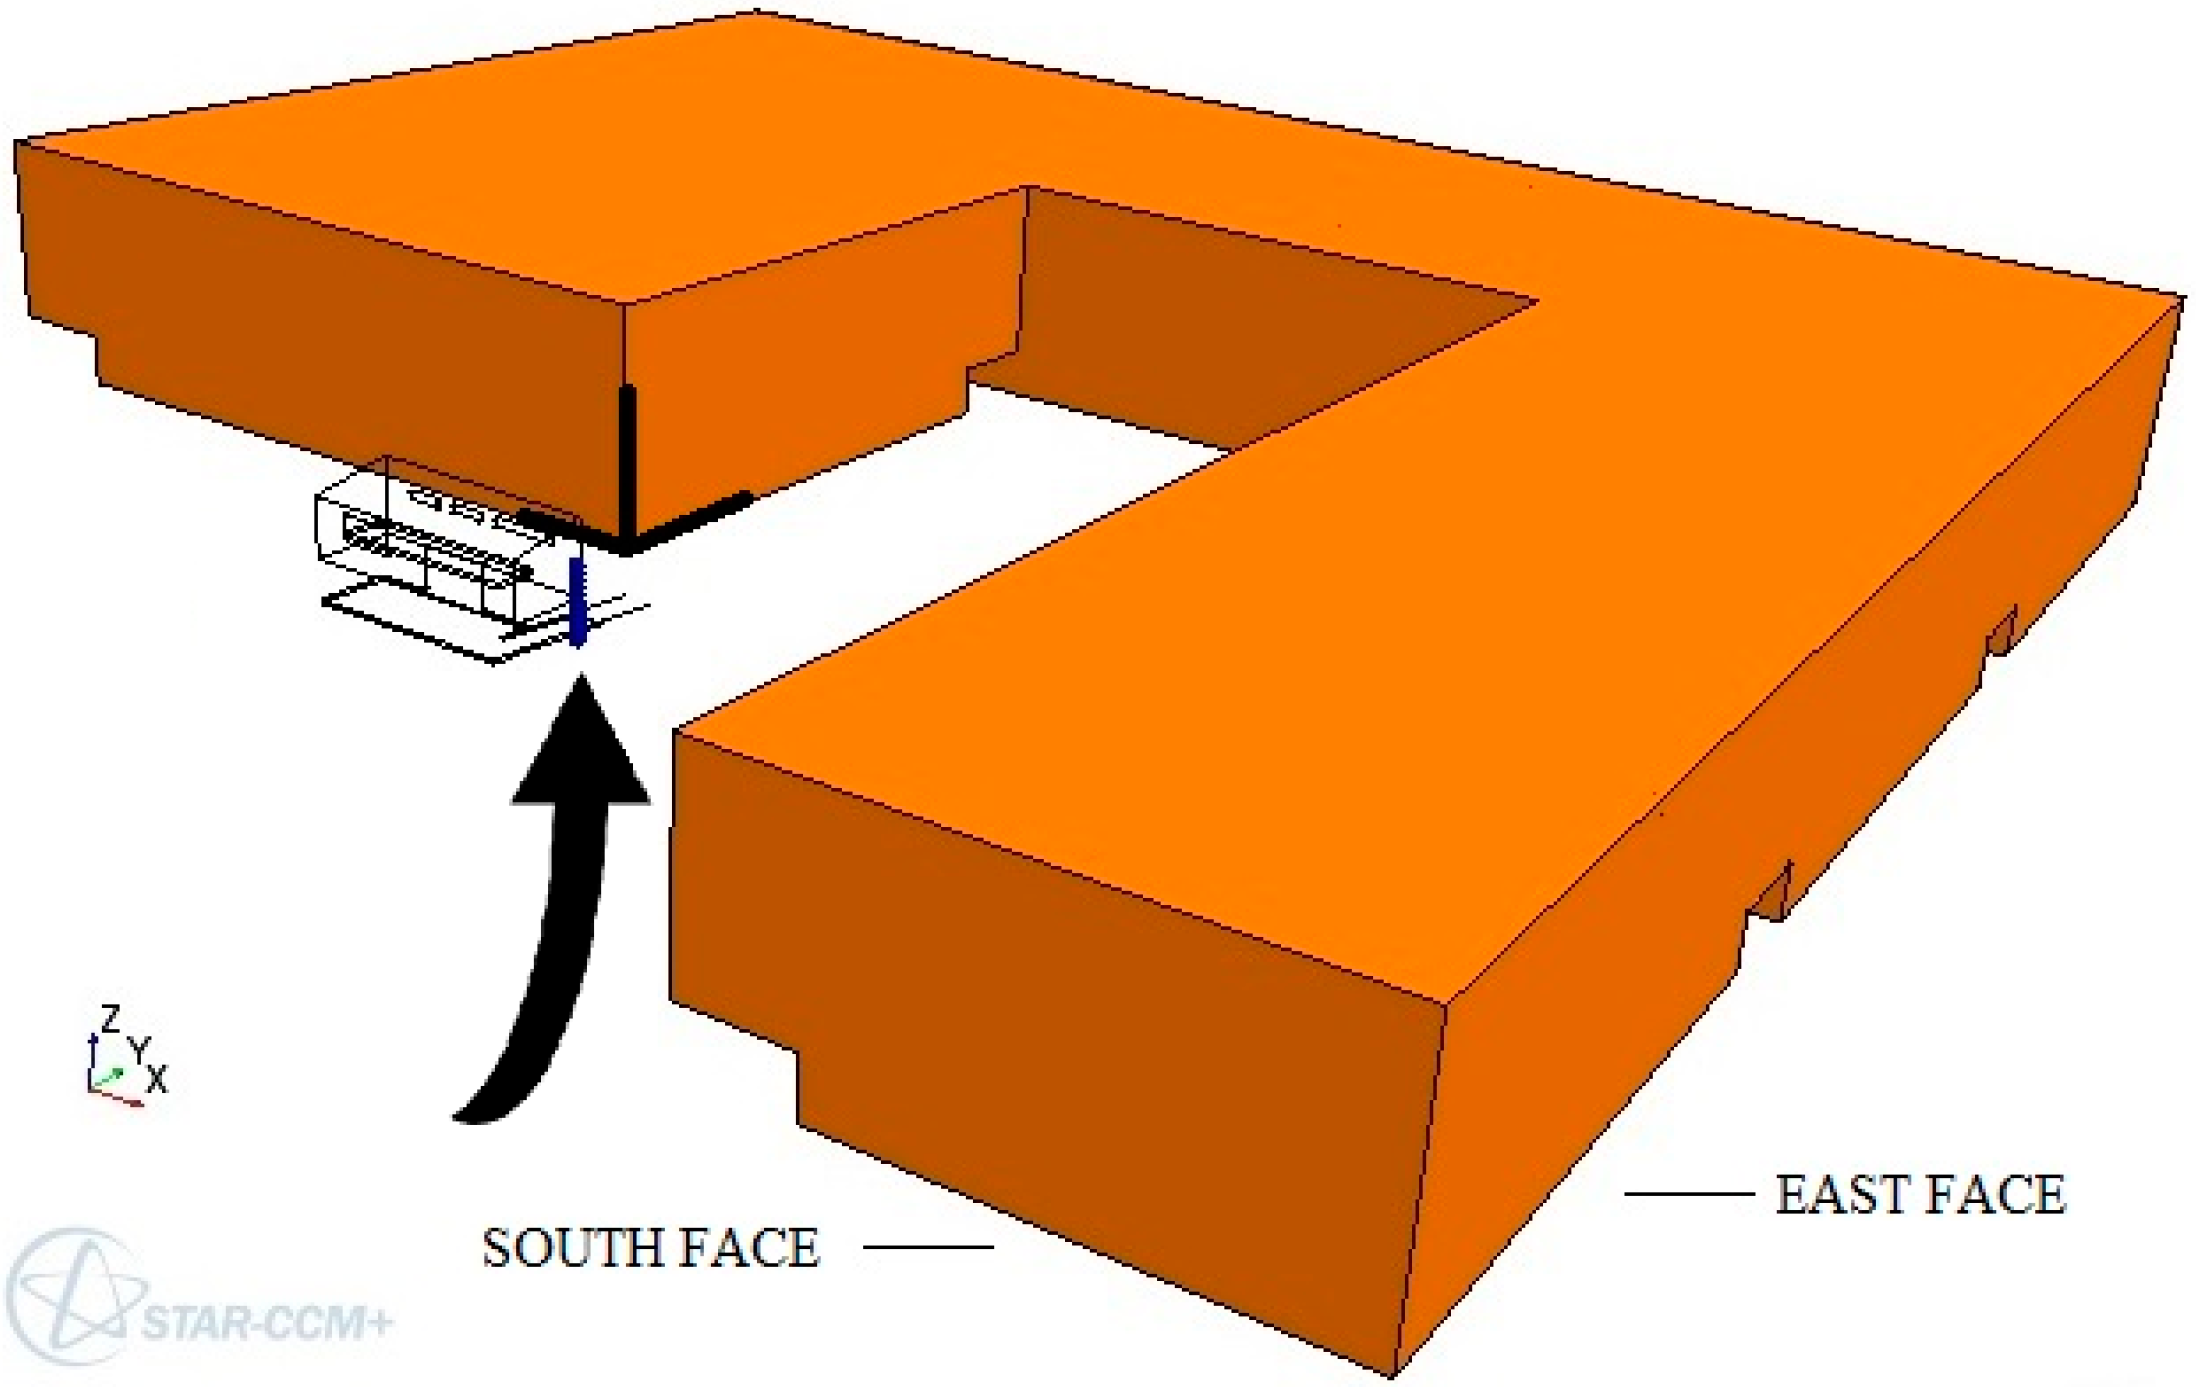
The building has six initial outdoor ventilation openings. Four of these openings are windows placed in the upper part of the north façade (0.5 m × 2 m). The south façade has a window (1.5 m × 3.7 m) and a door (2.5 m × 6 m). To improve NV performance, the ESE prevailing wind suggests including an opening in the east building face. This opening allows the prevailing wind flow to go through the east building face, improving the total air change rate (ACR) of the building. Furthermore, a vertical and narrow window may provide a well-distributed airflow throughout the whole building.
The optimal position of a vertical window in the east-lateral face is analysed.
Figure 9 graphs the window position alternatives. Three models are compared: Case A has no lateral window, as shown in
Figure 6, and Case B and Case C have a vertical lateral window, 0.5 × 1.5 m, in opposite sides of the east façade, as shown in
Figure 9.
Although three building opening alternatives are analyzed in the current research, the design approach could be extended to other opening position alternatives.
4. Results and Discussion
The prevailing wind influence, the façade opening location and the neighbouring buildings influence on the building NV behaviour are assessed. The simulations (see
Figure 9) are conducted at three wind speeds to cover the complete wind range. Cases A (no window in the east face), B (right window in the east face) and C (left window in the east face) are compared to determine the architectural solution that best improves the NV behaviour in the building.
The discussion is focused on three issues: the quantitative analysis of the wind flows through the building, the NV behaviour, and the energy saving potential. The velocity inlet boundary condition influence on the CFD results is also discussed.
4.1. Quantitative Analysis of Results
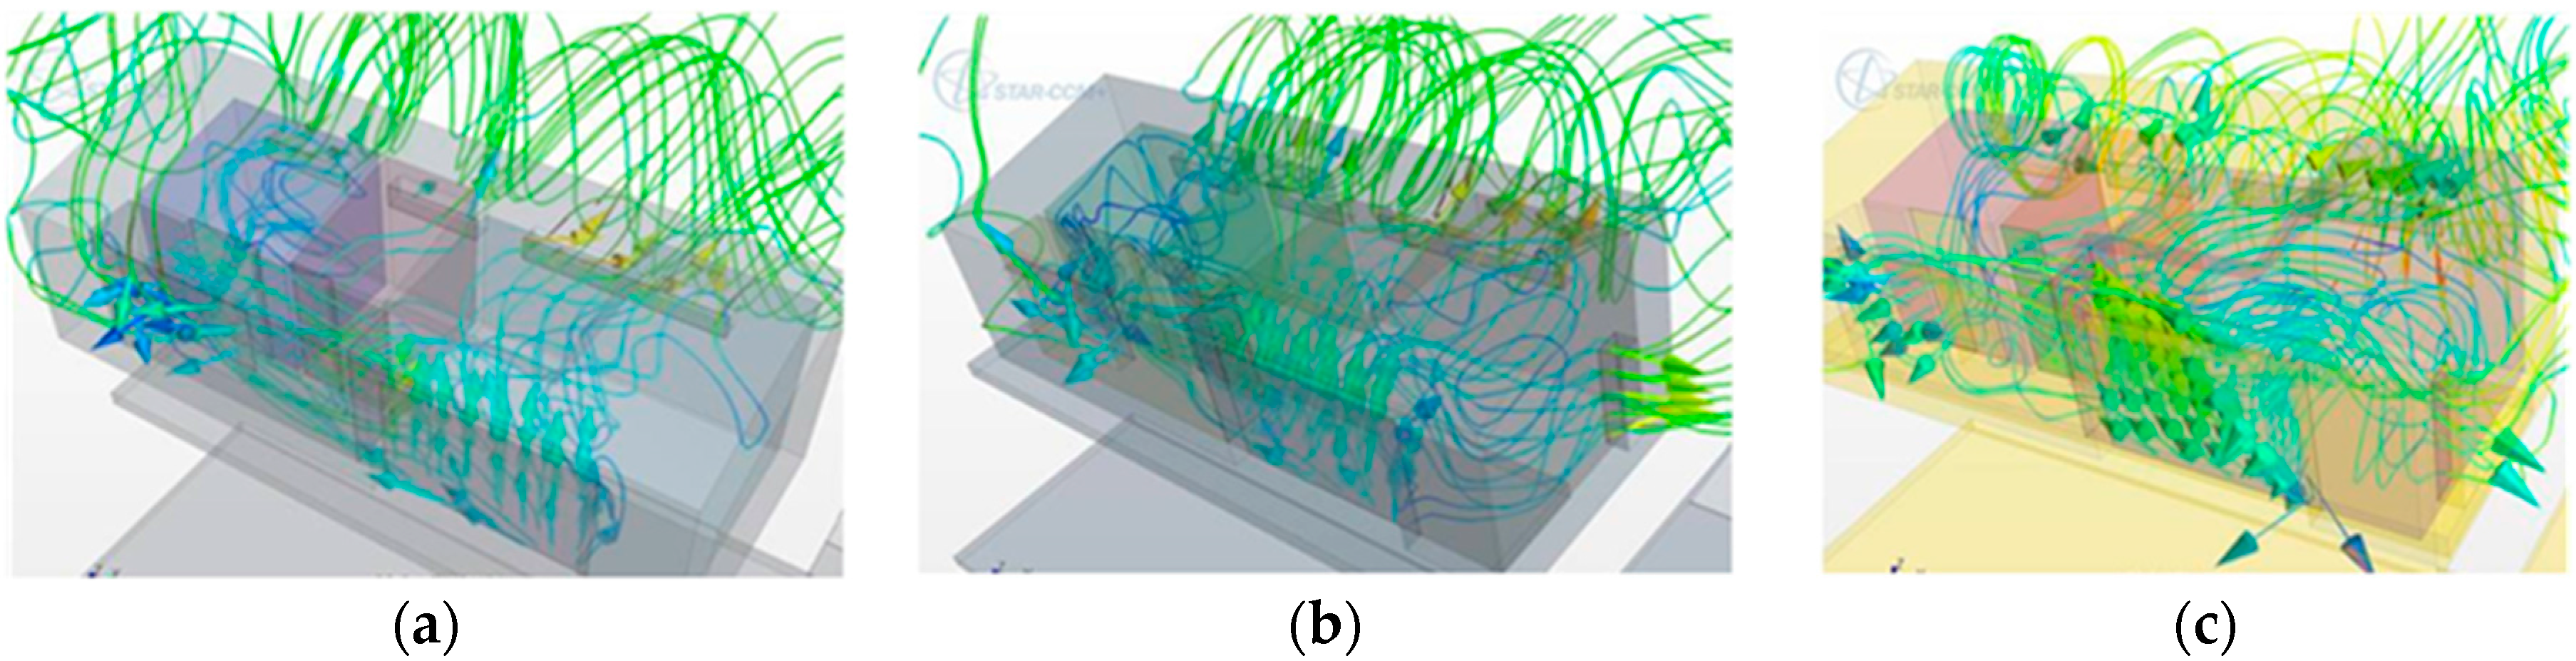
Velocity streamlines are studied to determine the flow distribution through the building. The surrounding buildings change the wind flow incidence angle and turbulences, so the computed streamlines could be quite different than expected. The turbulent nature of the flow is important for NV as a more turbulent flow ensures better replacement. In this case study, the main wind flow direction is modified by the surrounding buildings reaching the building with a south-southeast (SSE) to north-northwest (NNW) direction instead of the typical ESE direction. Focusing on the main room, case A has some dead zones in the north corners of the rooms. In contrast, cases B and C obtain fully mixed air.
Figure 13 shows the velocity streamlines passing through the building. The east-facing window originates a low pressure at this opening that helps to mix and drive the air through the dwelling. Consequently, the east face opening improves the indoor air distribution.
Natural ventilation will be more effective with less time needed for the indoor air to be refreshed. The inlet and outlet air flow rates are used to calculate the effectiveness of wind-driven flows for NV. The objective is to determine how much time it takes for the total indoor air to be replaced using wind-driven flows.
A relative coordinate system is set in each building opening. Air that enters the building (positive velocity value) is taken as an inlet flow and air that leaves the building (negative value) is taken as an outlet flow. The time needed (t) to replace all of the internal building air is calculated by dividing the total control volume and the density by the whole mass flow rate, as shown in Expression (3).
where ρ is the fluid density (kg/m
3),
f is the mass flow rate (kg/s) and
V is the total volume of the building (m
3).
Table 2 shows the time needed to replace the indoor air comparison of the three cases (the wind speed considered is the wind mean velocity 3.05 m/s). Case B (east face right opening) and case C (east face left opening) are 7.60% and 9.77% better than case A (no east face opening) respectively. Case C performs almost 2% better than case B regarding natural ventilation. Therefore, the east face left opening achieves better results than the east face right opening for the prevailing wind condition.
4.2. Parametric Analysis of Results
The CFD results accuracy depends on the influence of the input boundary conditions. Therefore, a parametric analysis must be performed, especially when the most important input boundary condition is a probabilistic data that has a standard deviation of approximately 50% of its mean value (see
Section 3.2). Because wind is defined in terms of probabilistic data, NV should also be studied under a probabilistically approach and not only examining the mean values of wind velocity modulus and direction but also all of the other probable wind values. Consequently, the complete feasible wind range is selected taking into account the standard deviation of the prevailing nominal wind measurement.
Compared to the nominal wind velocity (
v = 3 m/s), when the mean inlet velocity is increased to 4.5 m/s, case B and C still achieves better performance than cases A (+5.07% and +7.63% respectively). However, the relative improvement respect the nominal wind velocity is lower (+5.07% vs. +7.60% and +7.63% vs. +9.77% respectively). When the average wind velocity is decreased to 1.6 m/s, the relative improvement is lower than the nominal wind velocity (+2.38% vs. +7.60% and +2.04% vs. +9.77%). Case B and C behave very similarly with only a 0.33% difference. In conclusion, case C has a relative better performance vs. case B and A. Consequently the design recommendation is to include the proposed window in the left side of the east face of the house.
Table 3 shows the NV behaviour comparison of the different cases when the wind modulus is modified.
4.3. Energy Saving Potential
The energy saving potential is calculated according to standard 13790, calculation of energy use for space heating and cooling for residential buildings [
38]. The Spanish regulations CTE [
20] and RITE [
21] take the standard 13790 [
38] as reference. The monthly quasi-steady-state calculation method is used. Expression (4) shows the general ventilation heat transfer equation used in the Standard 13790, Section 9 [
38].
where
Hve,adj is the ventilation global heat transfer coefficient,
θint,set,C is the indoor temperature,
θe is the outdoor temperature and
t is the time period used for the calculation. The method provided by the standard is particularly suitable for comparison between proposed building designs, especially when the objective is to calculate the various design options influence on the energy use. Insofar as the design options are compared, the calculation error is minimized. The method accuracy depends on the quality of the input data. Particular attention should be paid in the air change rate determination. The present NV approach is focused on the air change rate estimation by CFD. Accordingly, the method set in the standard 13790 is strongly recommended to be used in the NV design approach.
The supply temperature is the value of the external environment temperature. The cooling demand is calculated during the months in which the average outside temperature is below the maximum comfortable indoor allowed temperature in the warm season and above the minimum required temperature in the cold season according to the UNE-CR 1752 [
39] (see
Figure 3). Additionally, the wind direction data is taken into account so that is considered only the time in which the prevailing direction (ESE) is flowing. Case A and case C are compared to calculate the relative improvement achieved. The results show that the proposed opening addition (case C) could reduce up to 1.13 kWh/m
2 the energy consumption of the building per annum. It is equivalent approximately to a reduction of 434 grams of CO
2 equivalent per kWh/m
2 of electricity [
40] respect the initial building design per annum. The energy behaviour of the complete building has been approximately improved in 4.12%. The here described research is only focused on the prevailing wind conditions. In any case the calculation could be extended to the other wind directions to calculate the complete NV impact on reducing the CO
2 emissions.
The characteristics of the Valencian residential sector have been analyzed to calculate approximately the NV design approach impact on the new building construction. The CO
2 emissions potential reduction could be up to 56.5 tons of CO
2 per year, taking into consideration the 2015 new detached houses data (see
Section 2). However, the CO
2 potential reduction is very rough since the calculation is only based on the case study presented in this research. The NV design approach potential CO
2 savings is higher because it can be extended to the complete wind directions. Moreover, although the case study is focused on a one-floor modular detached dwelling, the design approach can be extrapolated to other kind of residential buildings. This research is challenging in terms of modelling time and resources. Consequently, the results are just illustrative to quantify the possible NV design approach CO
2 reduction potential applied onto a large-scale scenario.
5. Conclusions and Future Work
The paper shows a design approach for selecting building architectural alternatives to improve NV behaviour using CFD. It has been demonstrated that it is feasible to make comparative results of different façade opening alternatives in an initial design stage to make better NV design decisions to improve the building energy efficiency and reduce the CO2 emissions.
The residential sector is being shown as one of the major potential sectors to improve energy efficiency and reduce CO2 emissions. Therefore, the building should be adapted to the region’s particular conditions to make as much profit as possible of sustainable energy resources. In this case, the research is focused on the Valencian Community region that is located in the Mediterranean coast of Spain. The local climate and the wind conditions are particular due to the Mediterranean Sea regulatory thermal effect and the topography, respectively.
With the NV design approach since the first building design stage there is a potential saving of 56.5 tons of CO2 per annum taking into account the new building construction in the Valencian Community. Unfortunately, the main barriers for implementing natural ventilation in external comfortable days come from regional legislation, as only mechanical and hybrid ventilation are generally accepted.
Nevertheless, NV should be considered as a reasonable tool for decreasing CO
2 emissions in Mediterranean regional scale. The impact of the predominant winds and the façades opening position on the buildings in NV performance should be analyzed using CFD techniques. The design approach allows selecting the most efficient building alternatives using simulation instead of trial-and-error experimental techniques in the building design stage. Well-designed outdoor openings shape and location can provide naturally ventilated and healthy indoor conditions while significantly reducing the energy consumed by buildings. The study approves the inclusion of a new opening in the east side of the building. This new opening improves the building NV behaviour up to 9.7% (see
Table 3).
In future works, the design approach should be extended to the complete wind rose conditions range for the case study building during the whole year. The NV performance assumptions will be validated in the constructed case study building in the future. Moreover, the modular case study results should be adapted to the other building typologies in order to improve the design approach scope.


 ,
, 


