Abstract
Somatotype and habitus parameters may affect physiological control system, so the changes of physiological parameters are not the same when various people work in hot-dry and warm-wet climates. In this paper, a chamber built in Tianjin University was used to simulate comfortable, hot-dry and warm-wet climates. Sixty healthy university students were selected as subjects who were divided into four groups based on somatotype and habitus differences. The subjects were asked to exercise on a treadmill at moderate and heavy work intensities. Physiological parameters (rectal temperature and heart rate) were measured after every 10-min work in the climate chamber. For different groups, the change trends of physiological parameters were different. With the enhancement of experimental conditions, the differences among four groups were weakened. Body surface area per unit of body mass (BSA/mass), percentage of body fat (%fat), and maximum oxygen consumption per unit of body mass (VO2max/mass) were adopt to establish a revised body characteristic index (RBCI). RBCI was proved having significant correlation with physiological parameters, which means RBCI as the combined factors of somatotype and habitus parameters can be applied to evaluate the effect of individual characteristics on physiological systems.
1. Introduction
Climate with temperature above 35 °C can be considered as a hot climate, and climate with relative humidity above 60% is called a humid climate. With the rapid development of technology, the hot-dry and warm-wet climates are prevalent in many fields, such as iron and steel factories, the paper industry, building construction, medicine, deep mines, and technical spaces in ships [1,2,3,4,5,6]. The hot-dry and warm-wet climates have a great influence on physiological systems, such as the nervous system, urinary system, digestive system, and immune system [7,8,9,10,11]. When working in the extreme climates, people would have a risk of experiencing the change of physiological parameters, such as increases of body temperature, heart rate, and sweat production [12,13,14,15,16,17]. The high temperature may reduce work efficiency and cause emotional instability, which will lead to the increase of industrial accident rates [18,19], so it is necessary to study the influencing factors on physiological parameters.
A lot of researchers have studied the effect of temperature, relative humidity and work intensity on human physiological system. In order to illustrate the effect of heat stress on the sympathetic nervous system, Niimi [20] raised the environmental temperature from 29 °C to 40 °C and found that the muscle sympathetic nerve activity, eardrum temperature, skin blood flow, and heart rate increased significantly during heat exposure experiments. Tikusis et al. [21] selected 11 subjects who were asked for shooting training in comfortable, hot-dry, and warm-wet environments to study the influence of heat strain on shooting accuracy. The results showed that the physiological parameters had significant changes under hot-dry and warm-wet environments, while the shooting accuracy was not affected by heat strain. Hancock [22] studied the effect of heat stress on cognitive performance and obtained two trends. First, heat stress affected cognitive performance differentially, depending on the type of cognitive task. Secondly, the effects of heat stress could establish a relationship with deep body temperature.
As stressed by Malchaire’s group [23], the research of an index for the assessment of the heat stress in workplaces is still a much-debated topic as confirmed by the impressive number of studies and indices that appeared in the literature of the last 50 years. Nowadays, however, only two methods are approved internationally: the WBGT index [24,25,26,27] and the Predicted Heat Strain (PHS) model [28,29,30]. The WBGT index, due the empirical nature of its formulation and several problems related to its measurement with non-standard instrumentation, can be only used at a screening level. To the contrary, the PHS model, validated with measurement in situ, offers a reliable assessment [28] of core temperature and water loss related to the exposition to hot environments and is also suggested by ISO Standard 15265:2004 for the assessment of the duration of the exposures consistent with physiologically-acceptable core temperature and hydration levels of the body.
Authors above always focused on studying the effect of climate and work intensity on physiological responses, ignoring the influence of somatotype and habitus differences. Once the climate and work intensity parameters are input, the index above will produce the same results no matter whether the subjects are thin or fat, strong or weak. Somatotype and habitus also play a significant role in determining physiological responses and the effect is dependent on climate and work intensity [31,32]. Havenith [33] individualized an existing model that took climatic parameters, clothing parameters and the person’s activity level as inputs through incorporating somatotype and habitus parameters into the model and got a conclusion that the new model allowed improved prediction of physiological response. However, Havenith did not study purely the effect of individual characteristics on physiological parameters. Lu [34] selected 20 subjects to do heat exposure experiment and developed a body characteristic index (BCI) based on BSA/mass, %fat, and VO2max/mass to evaluate the relative effect of individual characteristics on heat strain. In order to improve the BCI, this paper increases the number of subjects from 20 to 60 and replaced oral temperature with rectal temperature that is closer to human’s core temperature to establish a revised body characteristic index (RBCI). Moreover, there are also some improvements in experiment and analysis processes, such as classifying the subjects into four groups, analyzing the differences of physiological parameters among groups and presenting the change trends of physiological parameters in climate chamber. The entire research process of this paper is more reasonable, comprehensive, and reliable than the previous article [34].
The main contents of this paper include three parts. First, the physiological parameters between different groups of subjects were compared. Second, the correlation analyses between individual characteristics (somatotype and habitus) and physiological parameters were conducted. Third, RBCI was established through multiple regression analysis.
2. Materials and Methods
2.1. Chamber
A stainless steel chamber (Figure 1) with dimensions of 5 m × 4 m × 3 m (length × width × height) [35,36] was built in Tianjin, China. This chamber is a standard modular design. A large LCD microcomputer temperature and humidity controller are applied to set ambient temperature and relative humidity in advance. The independent conditioning system and humidifier could make the climate temperature and relative humidity reach the pre-set value within 15 min. With the microcomputer controller, the temperature and humidity in the chamber is precise, stable, and reliable. Table 1 shows the range of temperature and relative humidity in chamber. The value of wet bulb globe temperature (WBGT) was measured by WBGT sensor. Measurement was conducted on one measuring location that was chosen at 1.5 m height at the room center. The air velocity was measured by an anemometer (ZRQF-D30φ) at 1 m height at the room center.
Figure 1.
The chamber.
Table 1.
The range of temperature and humidity in chamber.
2.2. Subjects
The subjects should be healthy and have no medical history of hypertension, heart disease, and other diseases considering that the experiment was conducted in typical extreme climate. Sixty university students (30 males and 30 females) were selected as subjects. Their average age, height, and body mass were 24 years, 166.78 cm, and 59.96 kg.
2.3. Experimental Condition
Three climate types are shown in Table 2. Comfortable climate is adopted as a basic condition. Hot-dry and warm-wet climates are adopted as the comparison conditions. In the experiment, subjects were asked to exercise on a treadmill at two types of work intensities i.e., moderate and heavy work intensities [37,38,39]. Walking at a speed of 3.5 km/h was regarded as moderate work intensity. Walking at a speed of 5 km/h was considered as heavy work intensity [25]. Therefore, there were six combinations of climate condition and work intensity, i.e., comfortable climate and moderate work intensity (CFM), comfortable climate and heavy work intensity (CFH), hot-dry climate and moderate work intensity (HDM), hot-dry climate and heavy work intensity (HDH), warm-wet climate and moderate work intensity (WWM), and warm-wet climate and heavy work intensity (WWH), where all subjects were tested separately.
Table 2.
The climate conditions in the experiment.
2.4. Experimental Parameters and Instruments
The parameters measured in the experiment included body basic parameters and physiological parameters. Body basic parameters contain height, body mass, maximum oxygen consumption (VO2max) and skinfold thickness. Table 3 shows these parameters and their corresponding instruments.
Table 3.
Experimental parameters and corresponding instruments.
The total body surface area (BSA) [40] was calculated as follows:
where Bb is the naked body mass in kg; Hb is body height in m.
%fat could be obtained by the following formula [41]:
where Db is body density in kg/m3; c is a regression coefficient, taking 1.1631 for males aged from 20 to 29 years old, 1.1599 for females aged 20 to 29 years old; m is a regression coefficient, taking 0.0632 for males aged from 20 to 29 years old, 0.0717 for females aged 20 to 29 years old; Ts is skinfold thickness in mm.
VO2max was measured with a incremental load treadmill in comfortable climate. The initial speed of the treadmill was set to 5 km/h and increased by 1 km/h every 5 min. The tested subjects wore a respiratory mask that was used to continually collect expiratory gas in the process of exercise. Expiratory gas was sent to a Powerlab gas analyzer. With the increase of walking speed, heart rate and oxygen consumption increased gradually. When the treadmill load increased to a certain extent, the subjects might appear the following conditions: (a) oxygen consumption reached the highest level for several seconds and then declined; (b) the breath quotient exceeded 1.1; (c) heart rate reached 180 beats/min; and (d) inhaled oxygen was under 150 mL/min. When the tested subjects meet three of the four conditions, the oxygen consumption is defined as VO2max.
2.5. Experimental Process
2.5.1. Subject Classification Stage
The parameters used to classify subjects into different groups were BSA/mass, %fat, and VO2max/mass. Data analyses were performed in the statistical package and social sciences software (SPSS) which provides tools that allow users to quickly view data, formulate hypotheses for additional testing, and carry out procedures to clarify relationships between variables, create clusters, identify trends, and make predictions [42,43]. Subjects were classified by the method of principal component cluster analysis [44,45]. The reliability and validity of data should be analyzed before applying the method. Table 4 shows the KMO and Bartlett test [46]. The statistics of Bartlett’s Sphericity Test is 19.559. Its probability sig. is 0.000 (p < 0.05) and the value of KMO is 0.694 (KMO > 0.5), which indicates that the data are suitable for factor analysis. Then, the main component analysis was conducted. As shown in Table 5, the cumulative contribution rate of the first two main components is 84.304%, which indicates that most information about the BSA/mass, %fat, and VO2max/mass can be expressed by the first two common factors and the common factor analysis results are satisfactory.
Table 4.
KMO and Bartlett test.
Table 5.
KMO principal component information.
Table 6 shows the component matrix. The first main component contains %fat and VO2max/mass. The contribution rate of the two factors are opposite, which indicates that the differences between somatotype and habitus parameters are significant. If the value is positive, the subject will be strong and thin. The second component is BSA/mass and its value is positive. If the value of the second component is positive, the subject will be thin, tall and weak. Through the calculation of the two components, subjects were divided into four groups: (A) thin and strong (16 subjects); (B) thin and weak (12 subjects); (C) fat and strong (14 subjects); (D) fat and weak (18 subjects). The basic body parameters of each group are shown in Table 7.
Table 6.
Component matrix.
Table 7.
The basic parameters of subjects.
2.5.2. Testing Stage
Each group was measured on the same day for one experiment condition. In order to guarantee the stability of the physiological parameters, subjects were asked to have a rest of 20 to 30 min before doing the experiment. Once subjects enter the chamber, rectal temperature and heart rate were measured immediately, i.e., the 0-min value, and then they started to exercise. Rectal temperature and heart rate were measured every 10-min during exercise. Subjects were required to exercise for 60 min in the comfortable climate and more than 60 min in the hot-dry and warm-wet climates. The clothing thermal resistance of subjects was about 0.20 clo (1 clo = 0.155 K·m²/W).
The experiment scheme were approved by the ethics committee of Tianjin University of Traditional Chinese Medicine and the grant number was TJUTCM-EC20110004.
2.6. Statistical Analysis
The correlation and multiple regression analyses were introduced to process the tested data. Correlation coefficients between individual characteristic and physiological parameters were calculated and the significance level was p < 0.05. The independent variables in multiple regression analysis can be confirmed after understanding the relative effect of somatotype and habitus parameters on physiological responses. The standardized regression coefficients were applied to calculate the weight coefficients of somatotype and habitus parameters in RBCI equation. All statistical analysis was performed with SPSS 19 (IBM: Armonk, NY, USA, 2010).
3. Results
3.1. Analysis of Physiological Parameter Differences
There were four groups of subjects (A, B, C, D) involved in the experiment. Physiological parameters took the average value of all members in the same group. This section focuses on analyzing the differences of rectal temperature and heart rate among groups.
- (a)
- Rectal temperature
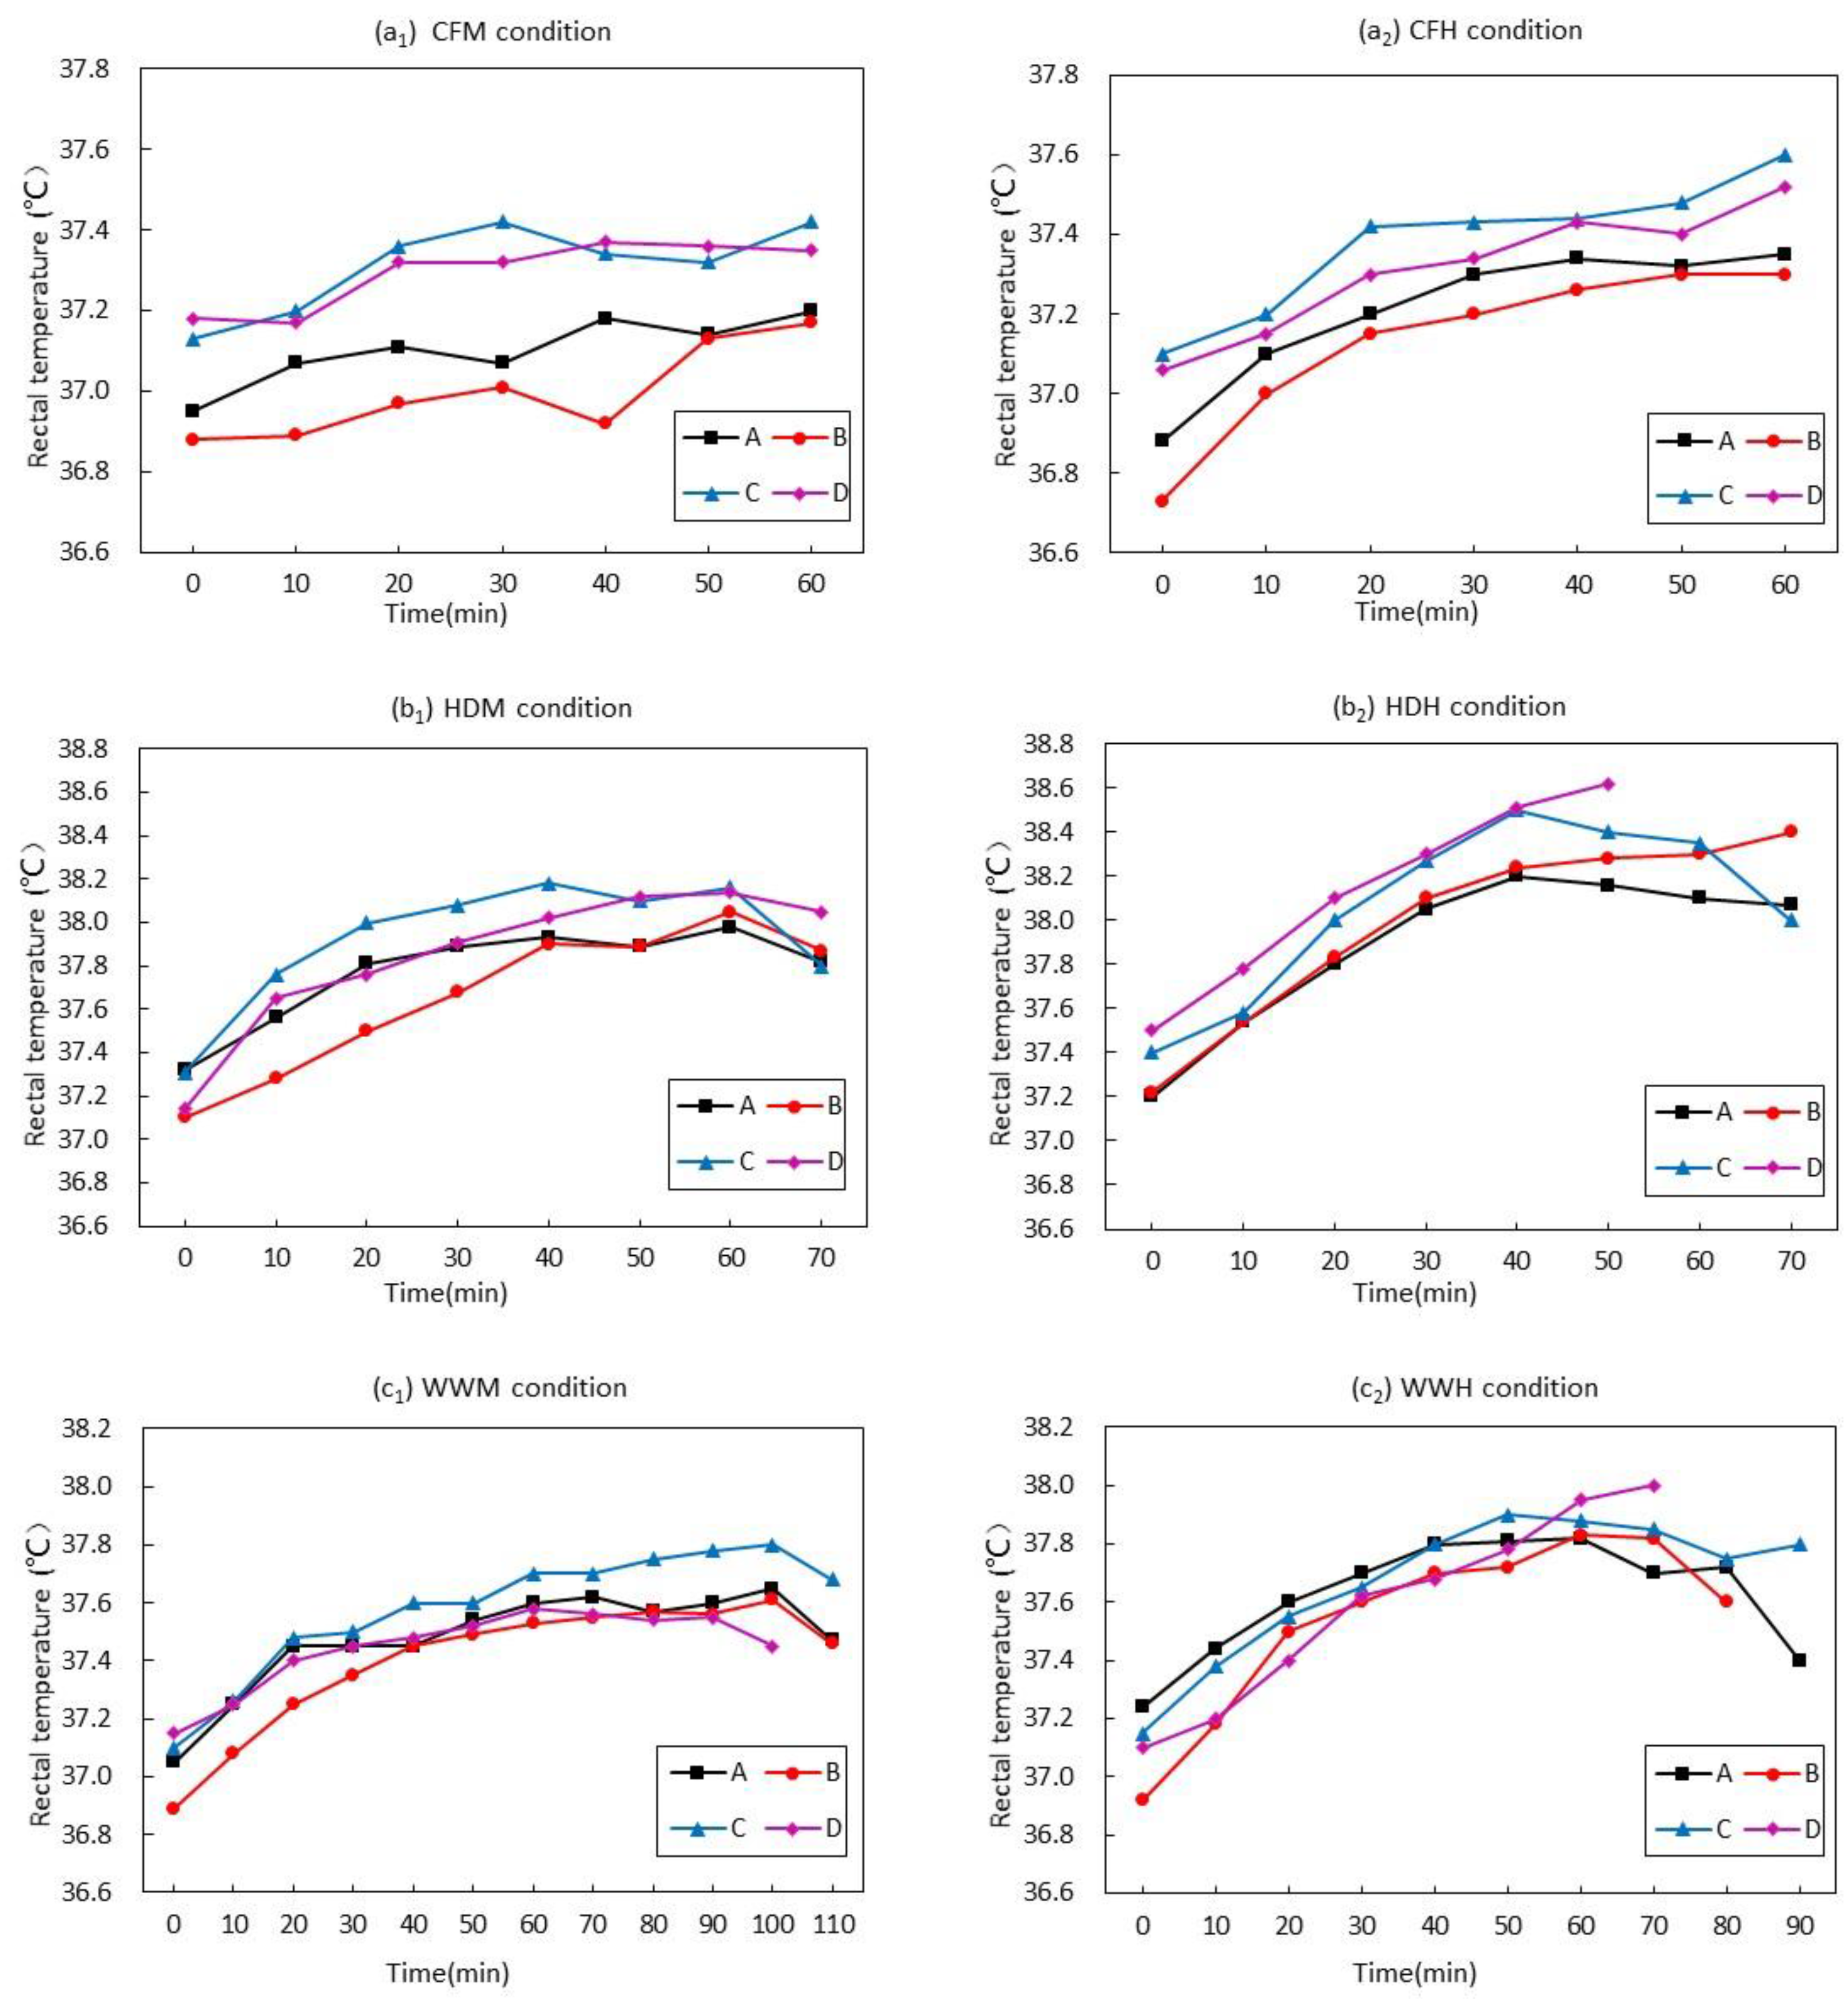
Figure 2 shows the change trends of rectal temperature of group A, B, C, and D in comfortable, hot-dry, and warm-wet climates. In the comfortable climate, the rectal temperature of group B is the lowest, while the value of group C is the highest one. When the subjects exercise in CFM condition, the difference between group C and D is not obvious while the difference between groups A and B is evident. The rectal temperature of groups C, D, A, and B in the CFH condition presents the descending order. When the subjects exercise in the HDM condition, it can be seen that the average rectal temperature of group A is higher than group B and the value of group C is higher than group D. However, the average rectal temperature of group B is higher than group A and the value of group D is higher than group C in HDH condition, which is contrary to the condition of HDM. When the subjects exercise in WWM and WWH conditions, it can be seen that the average rectal temperature of group B is the lowest one while the value of group C is the highest one. Each type of group will present its own characteristics. For example, group B always started with lower core temperatures, which is due to the effect of somatotype and habitus. The rectal temperatures of four groups in the comfortable climate have obvious differences, while the differences among groups in the hot-dry and the warm-wet climates is not evident, which may be that the effect of environment weakens the influence of somatotype and habitus differences. It can be seen that rectal temperatures of all groups rise rapidly in the early stage and fluctuate in the late stage under the hot-dry and warm-wet climates, the reason for which is that the activation of the body temperature regulation system is delayed 20–30 min and the rectal temperature is controlled at a relatively stable condition when the regulation system is activated. The rectal temperatures of some groups at the end tend to drop off and the drop degree of rectal temperature is small, which reflects the effect of temperature regulation and control systems. 
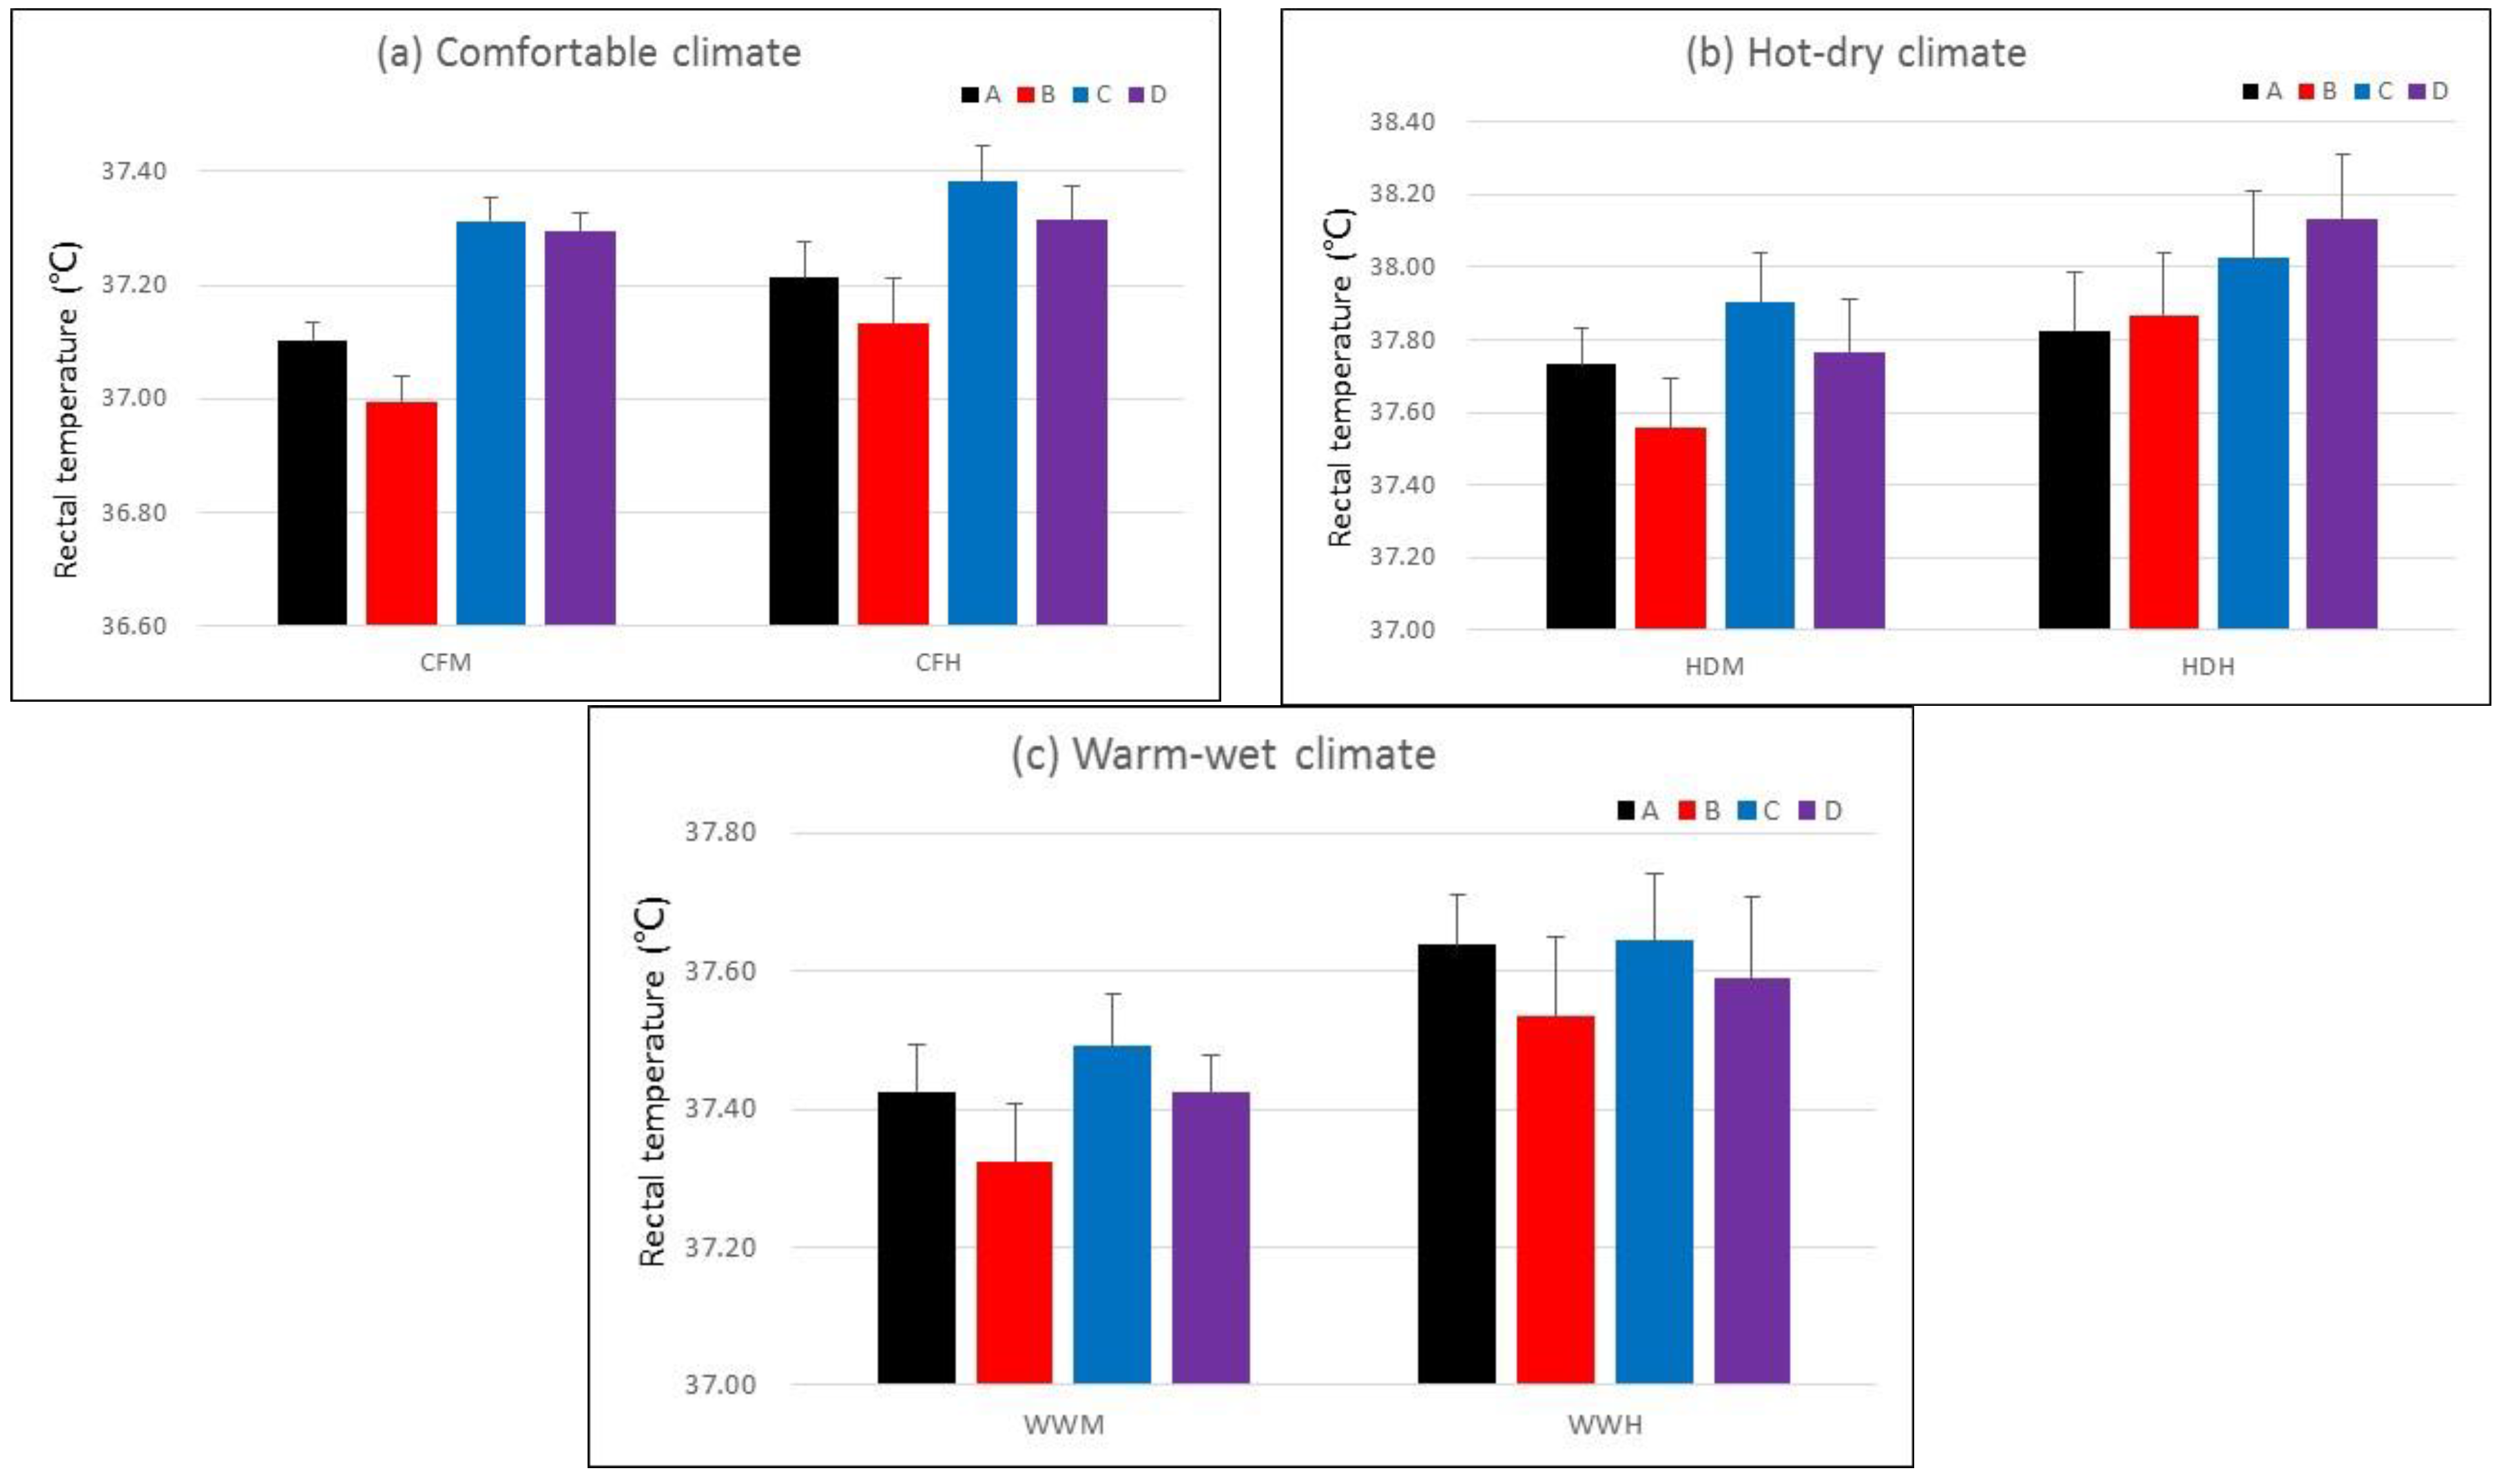
Figure 3 show the error bars with mean standard deviation of rectal temperature which clearly express the differences among the investigated groups.
Figure 2.
The rectal temperature of groups A, B, C, and D. (a1) CFM condition; (a2) CFH condition; (b1) HDM condition; (b2) HDH condition (c1) WWM condition (c2) WWH condition.
Figure 3.
The error bars of rectal temperatures in different conditions. (a) Comfortable climate; (b) Hot-dry climate; (c) Warm-wet climate.
- (b)
- Heart Rate
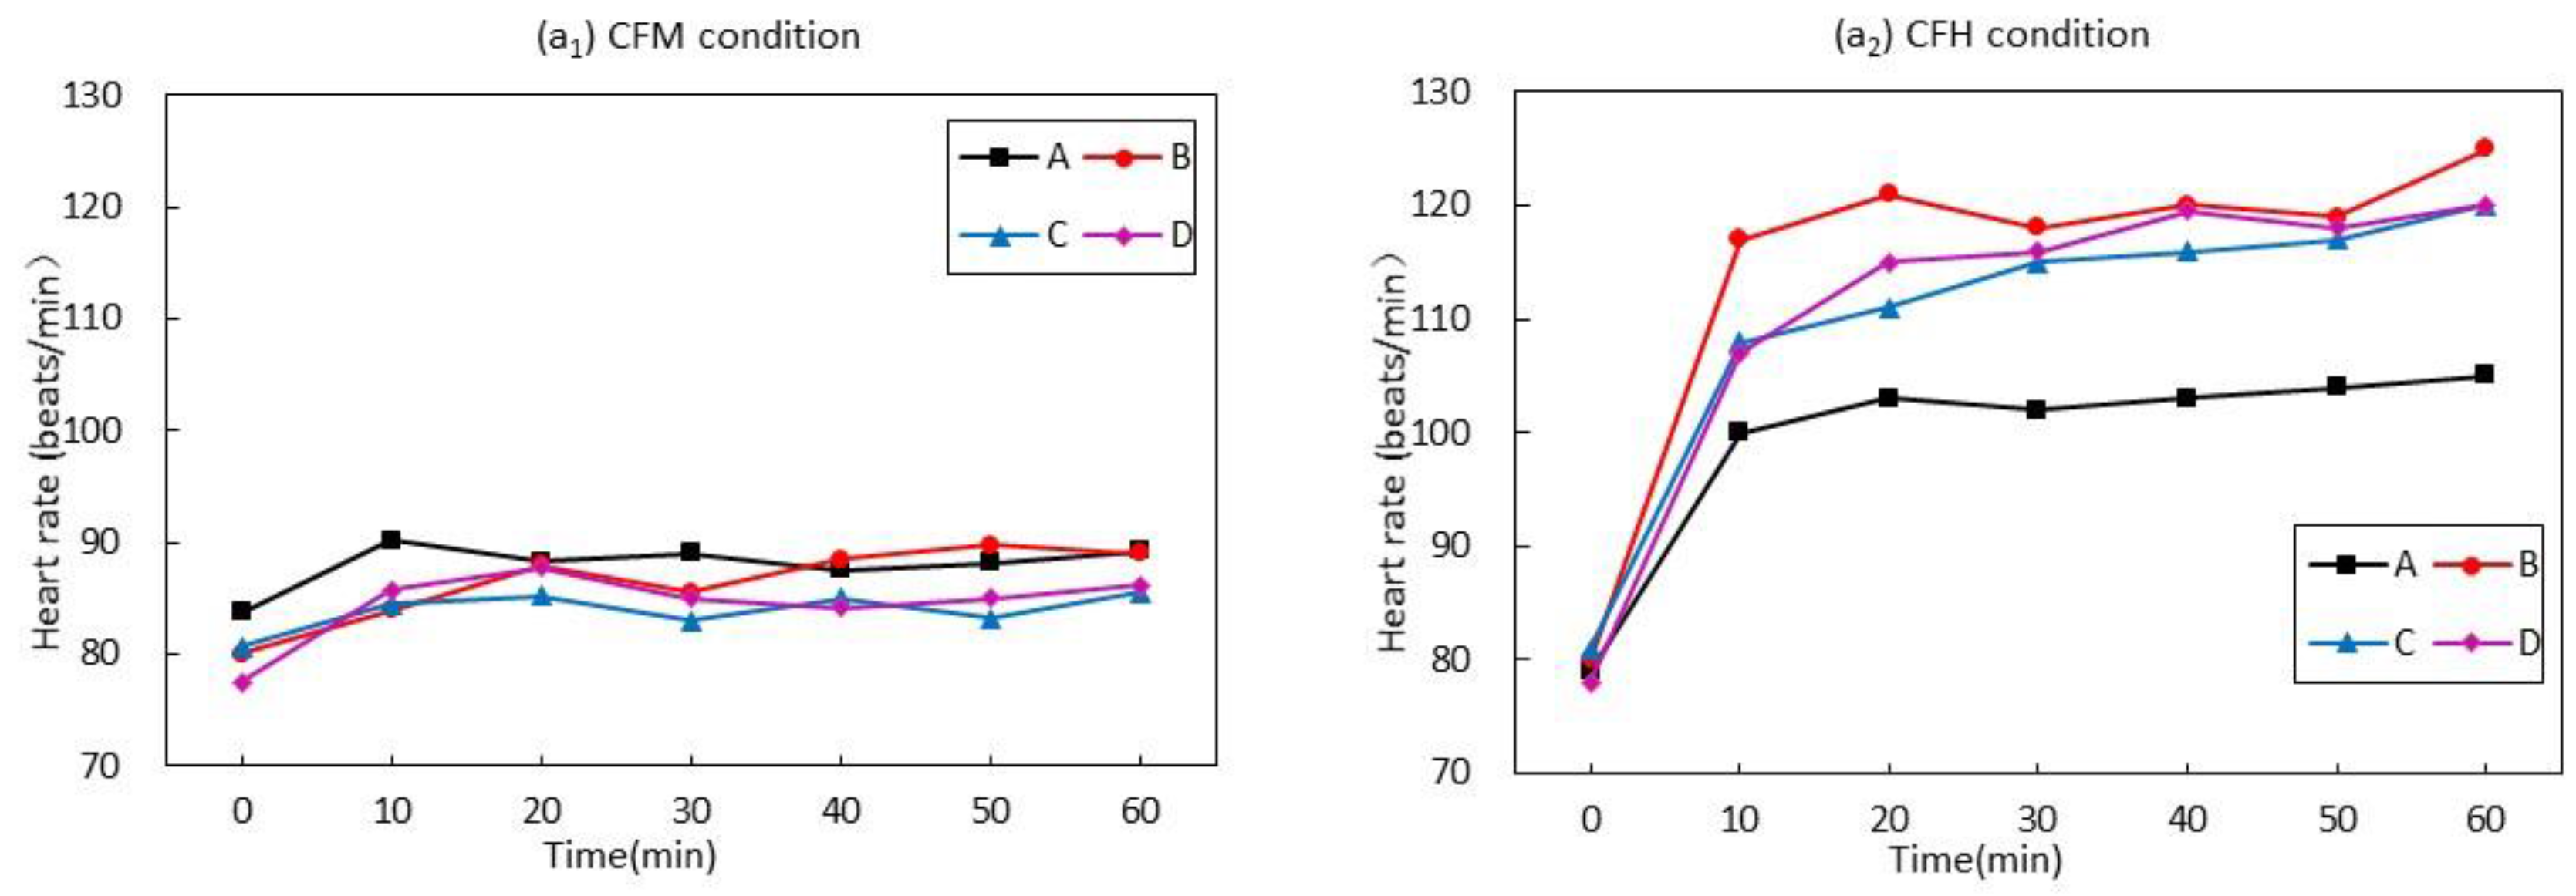
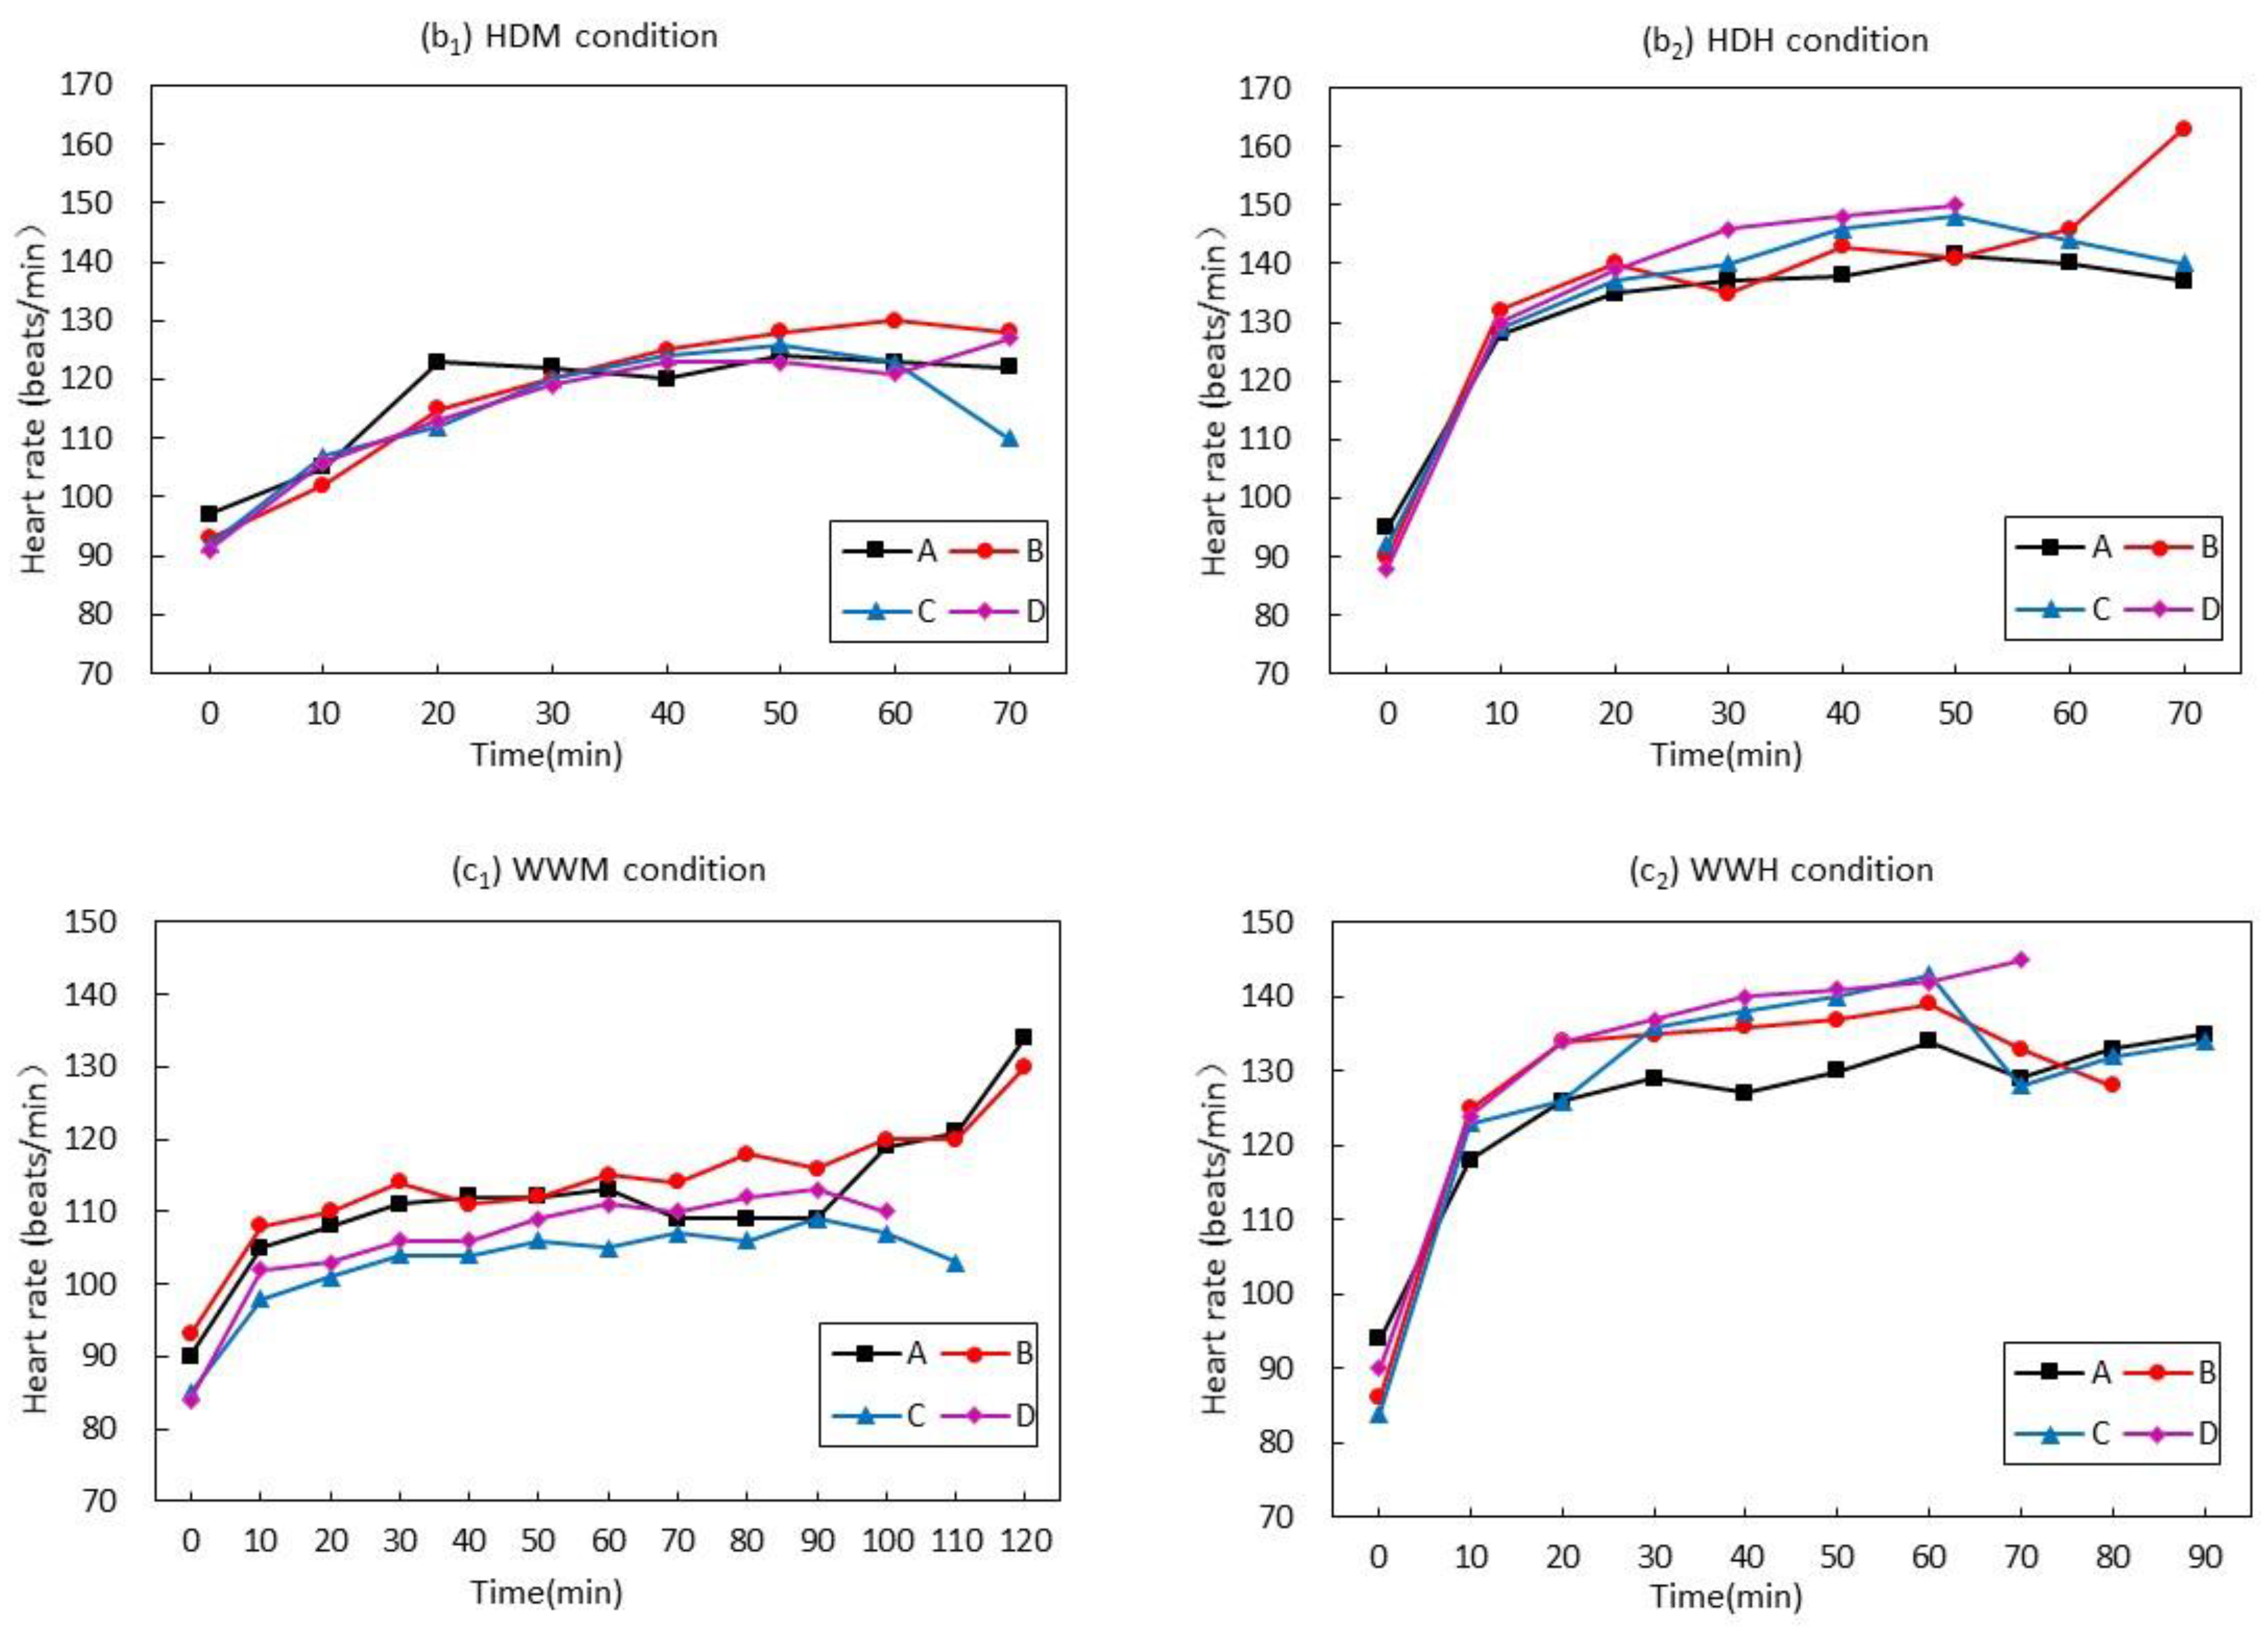
Figure 4 shows the change trends of heart rate of groups A, B, C, and D in comfortable, hot-dry, and warm-wet climates. The average heart rates of groups C and D are lower than groups A and B in the CFM condition. When the subjects exercise in CFH, the average heart rate of group A is obviously lower than other three groups and the heart rates of groups C and D rise faster than groups A and B. When the subjects exercise in HDM condition, it can be seen that the heart rates of groups A, B, and D increase rapidly in the initial stage and fluctuate in the late stage, while the heart rate of group C rises gradually at the first stage and dropped in the late stage. When the subjects exercise in HDH condition, the heart rates of all groups rise rapidly in the initial stage, among which the heart rate of group B rises faster than the other three groups, and the heart rates of groups A and C in the late stage decline while group B keeps rising. When the subjects exercise in the WWM condition the average heart rate of group B is the highest, while the average heart rate of group C is the lowest, and groups A and B present rising trends in the late stage, while groups C and D show declining trends. When the subjects exercise in the WWH condition, the average heart rate of group A is the lowest while the average heart rate of group D is the highest. The reason for the heart rate of group C dropping in 60–70 min is that some subjects rest for a while in the process of exercise. 
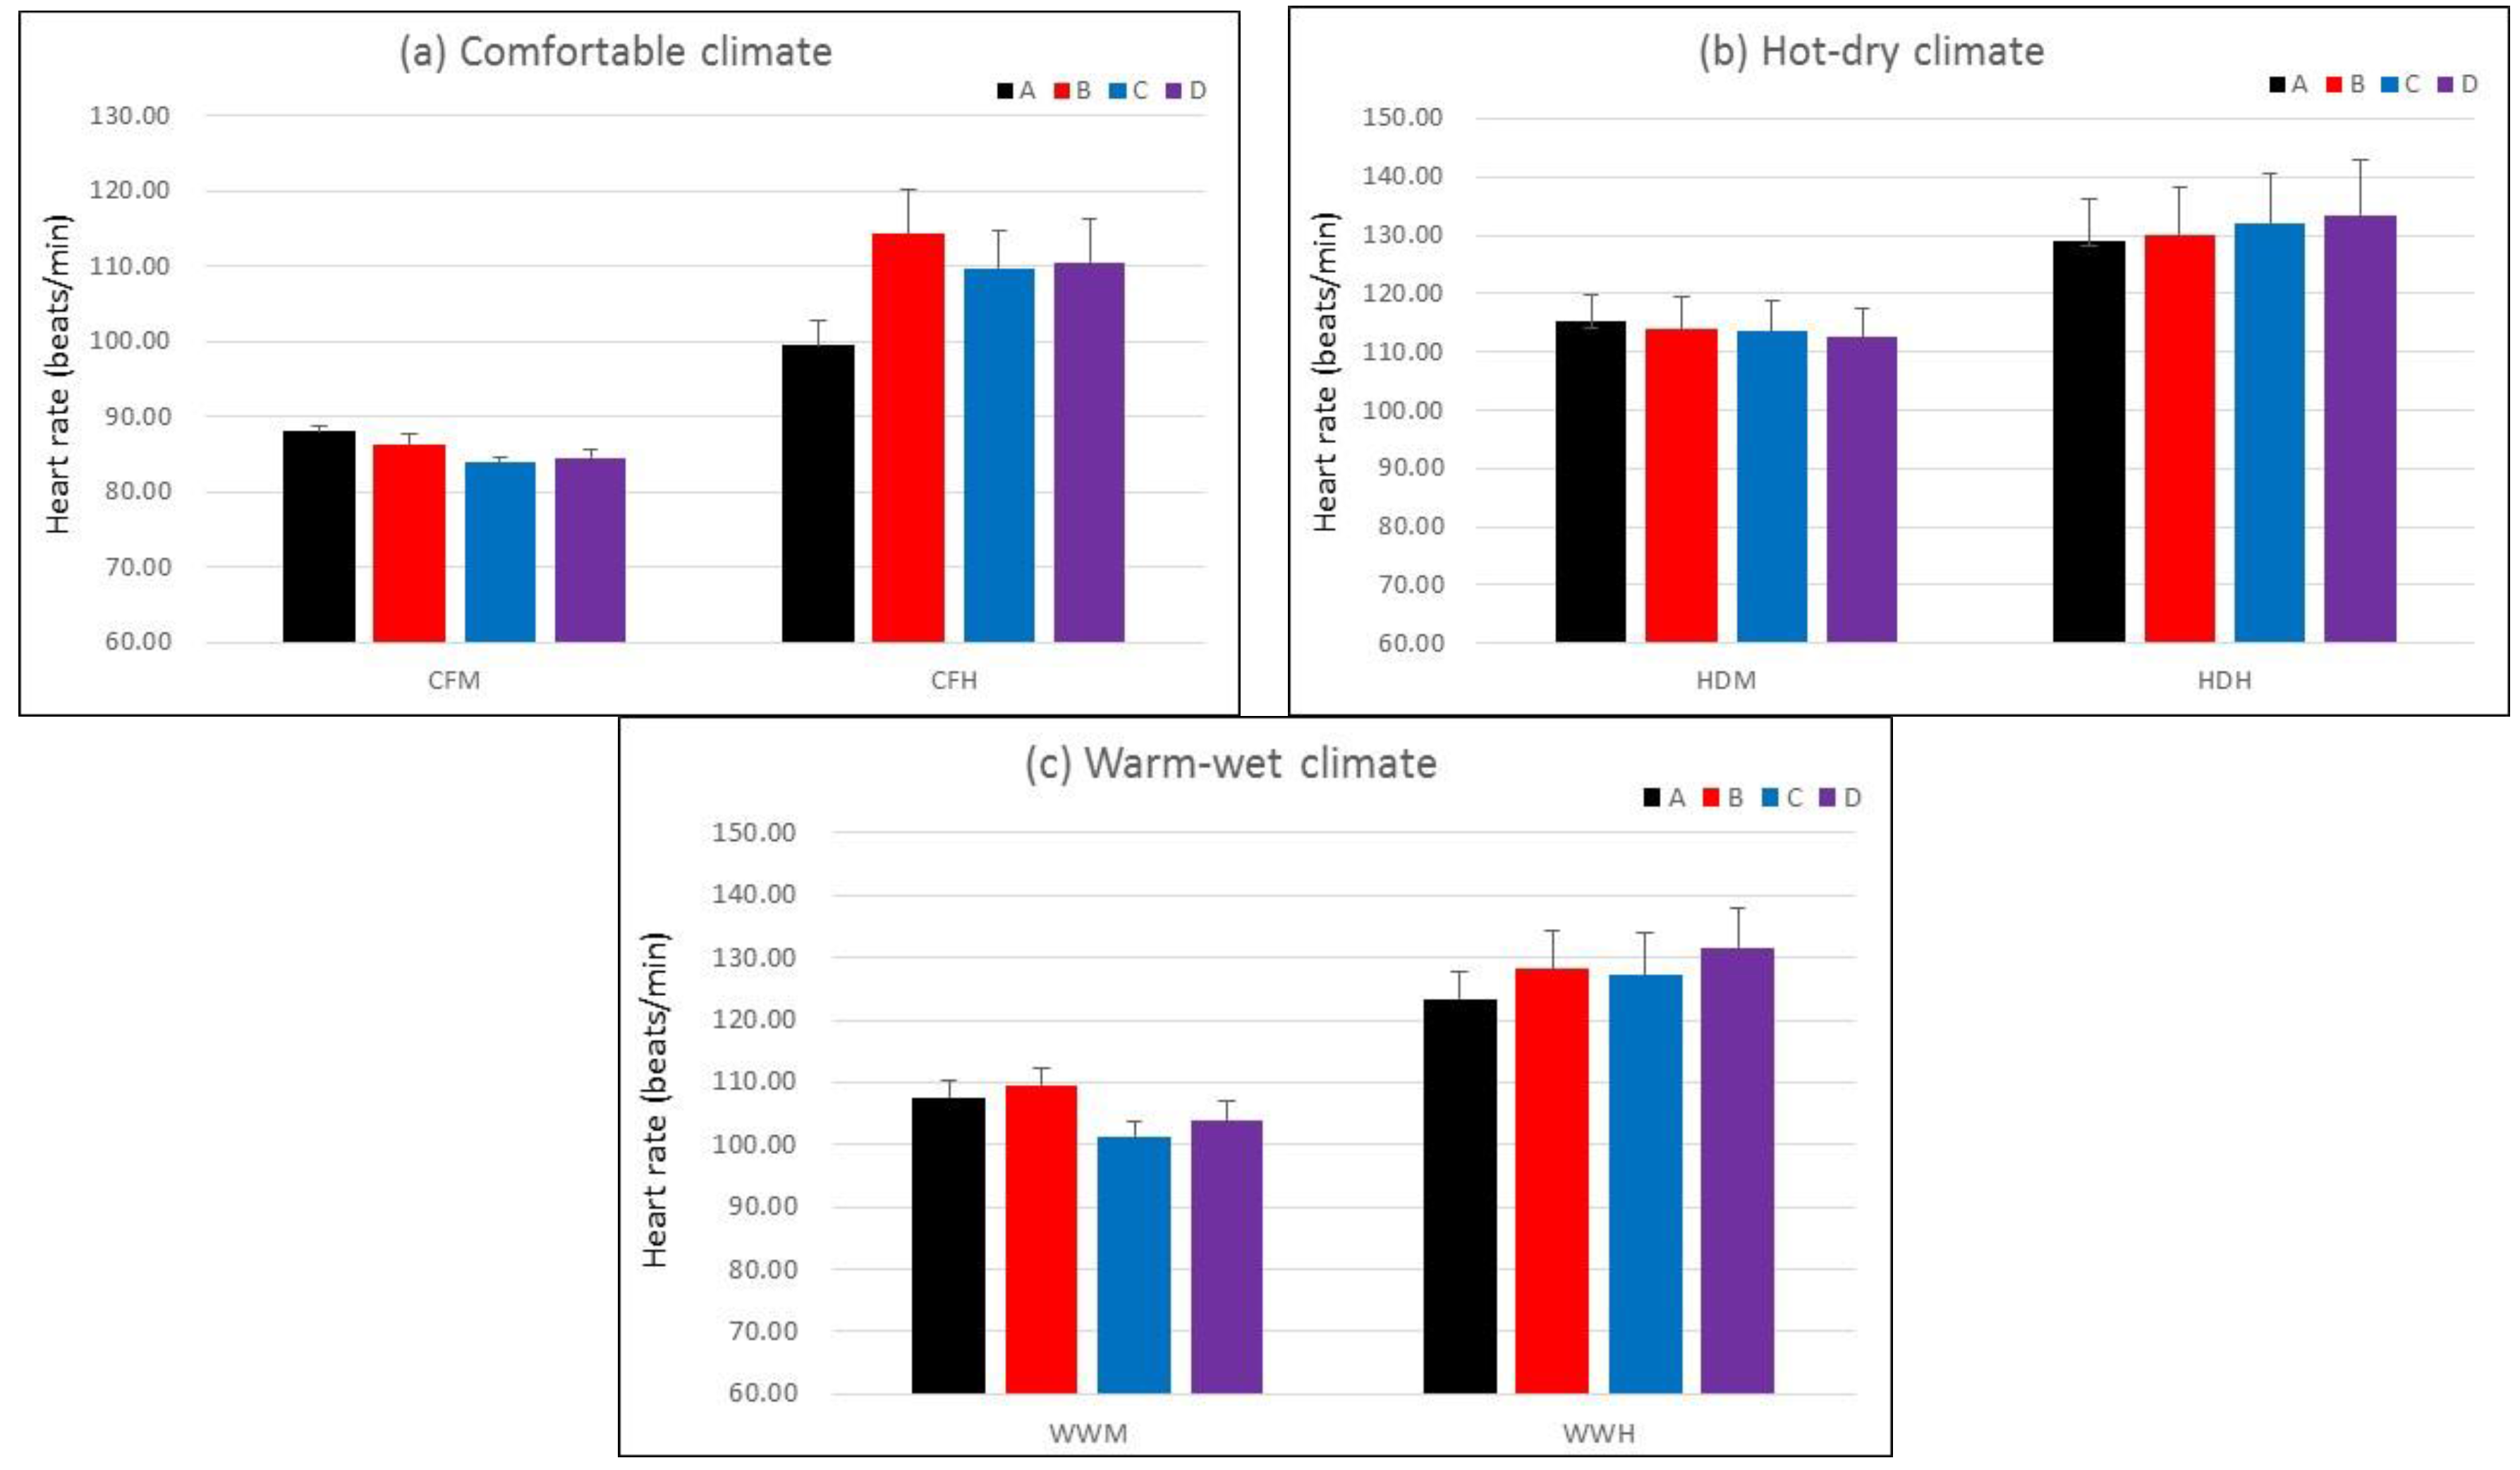
Figure 5 shows the error bars with mean standard deviation of heart rate which clearly express the differences among the investigated groups.

Figure 4.
The heart rate of groups A, B, C, and D. (a1) CFM condition; (a2) CFH condition; (b1) HDM condition; (b2) HDH condition (c1) WWM condition (c2) WWH condition.
Figure 5.
The error bar of heart rate in different conditions. (a) Comfortable climate; (b) Hot-dry climate; (c) Warm-wet climate.
3.2. Correlation Analysis
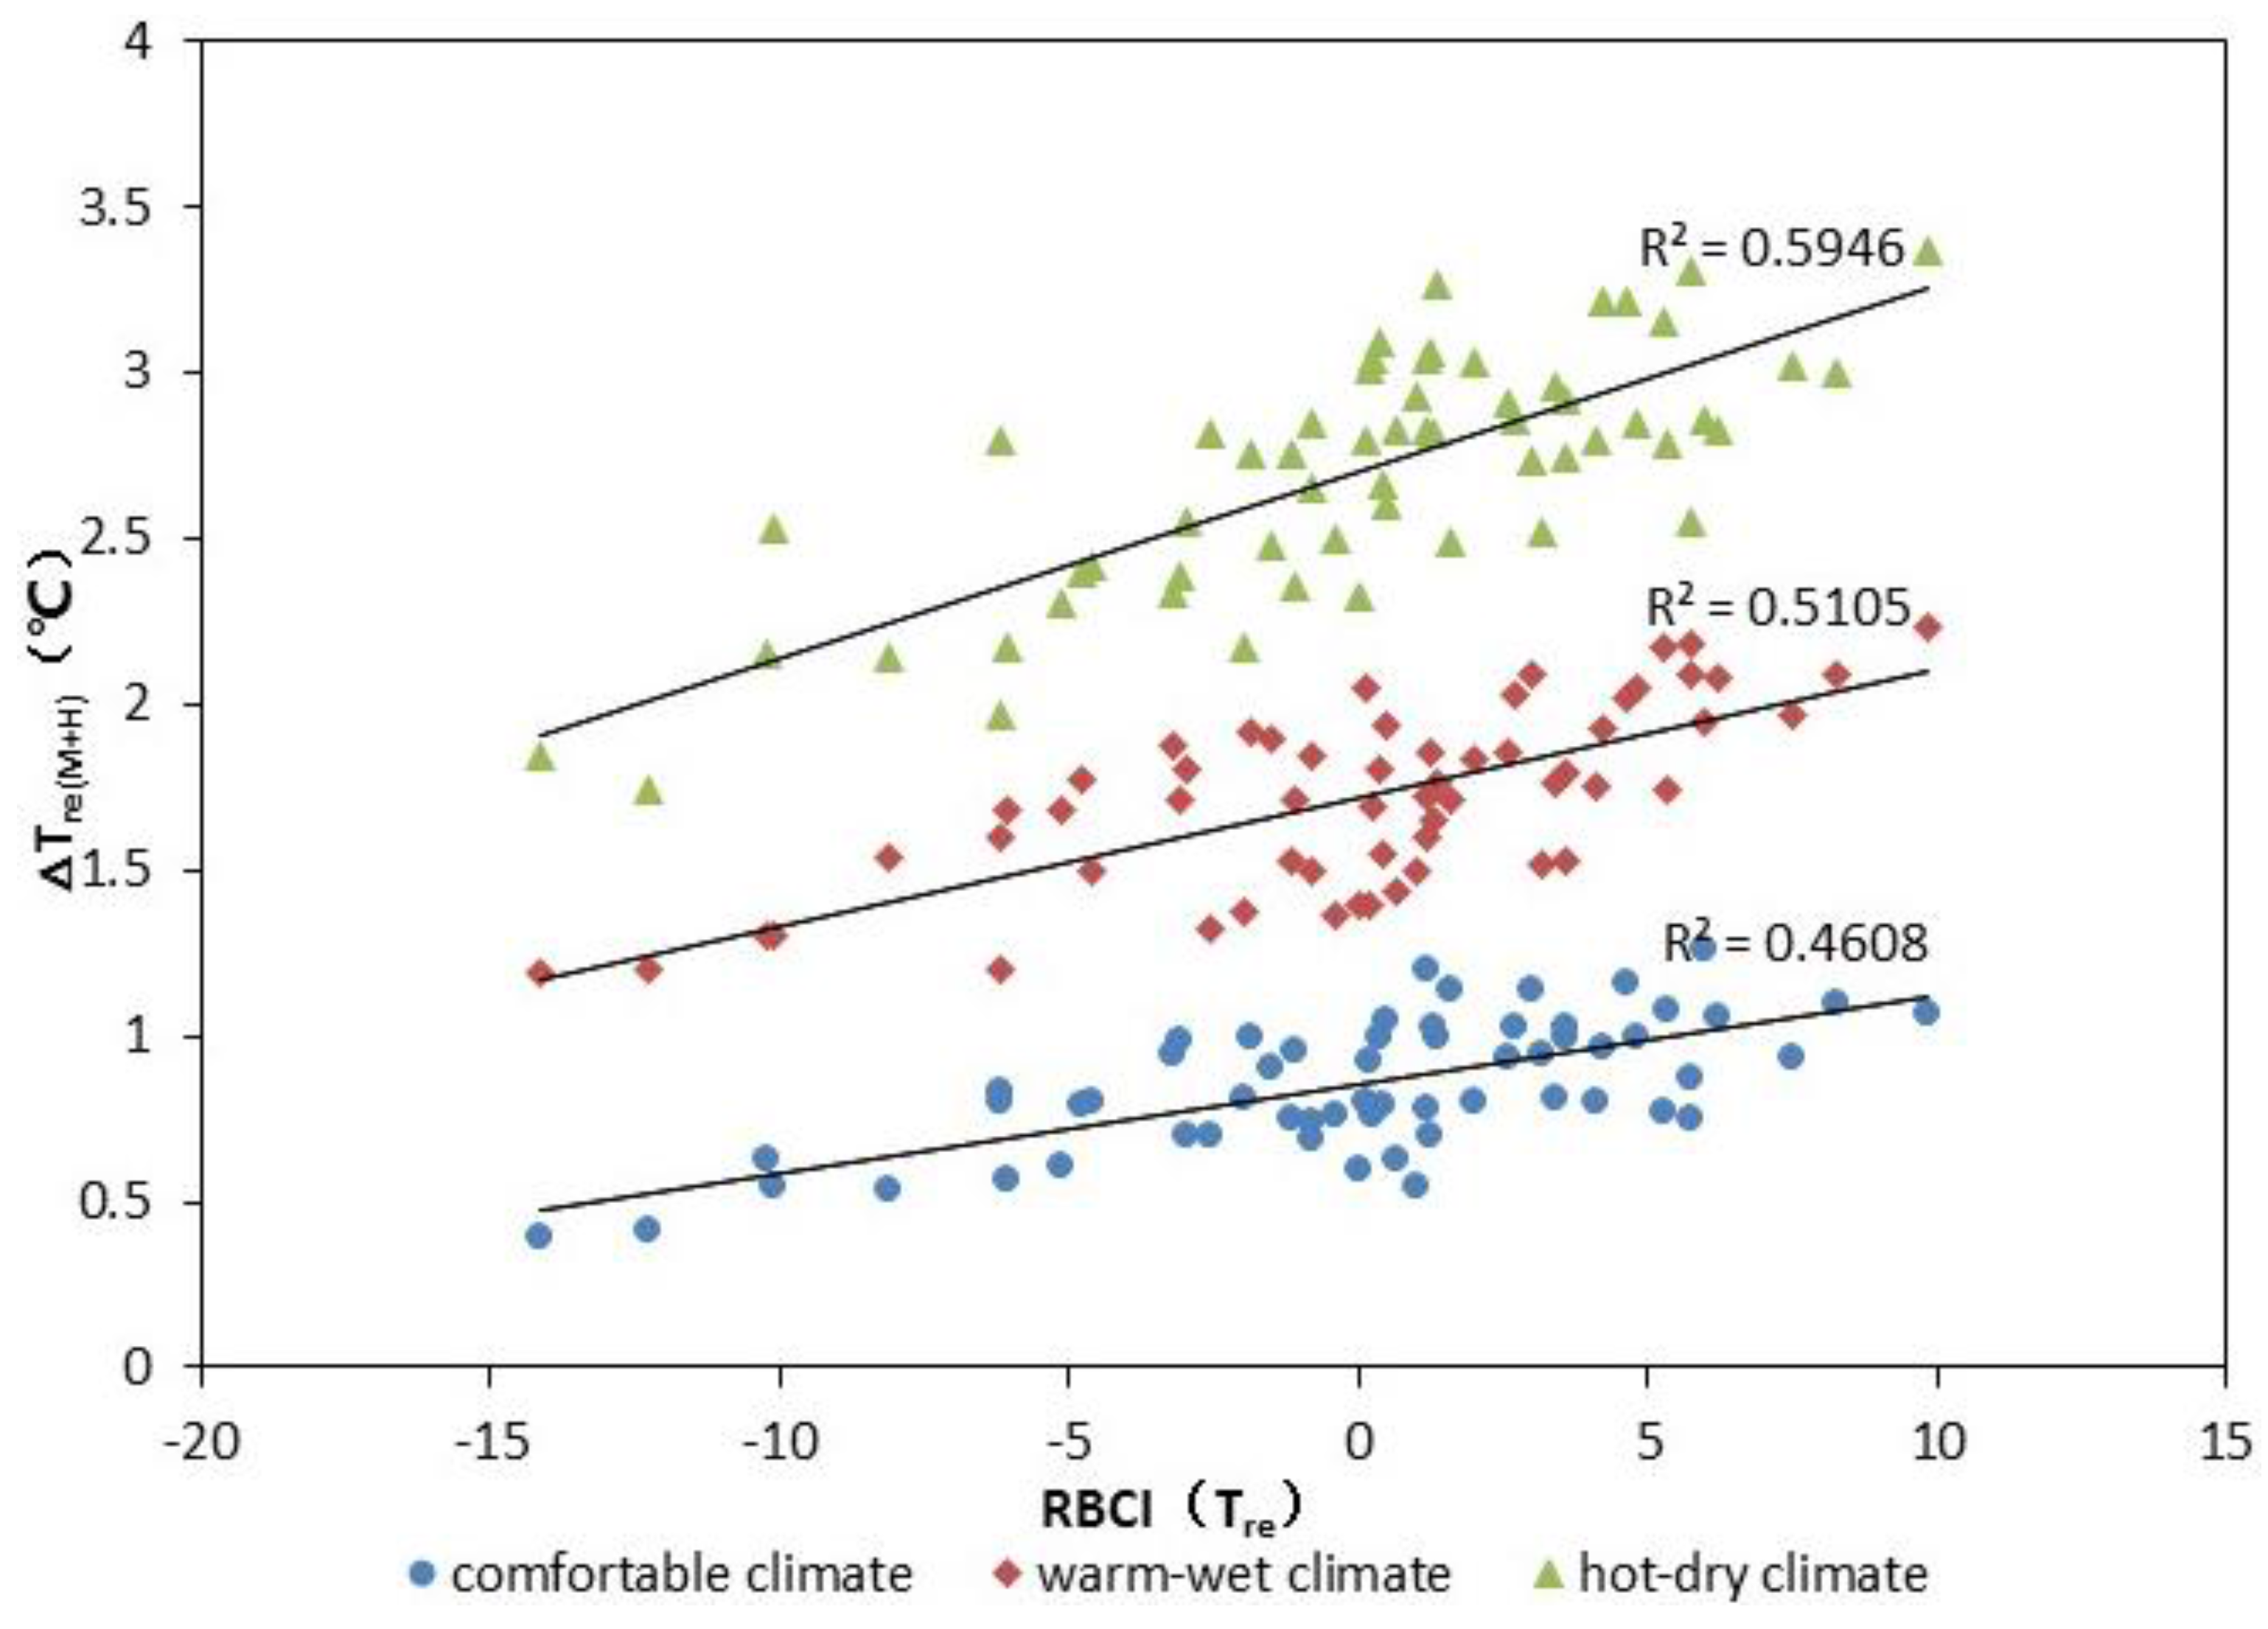
To obtain the relative effect of individual characteristic (somatotype and habitus) on physiological parameters, as well as the inner correlation among individual parameters, correlation analysis was carried out. The change value of physiological parameter in the first 60 min could be expressed by ΔTre and ΔHR that were calculated by the Equations (4) and (5). To eliminate the influence of work intensities on physiological parameter, ΔTre(M+H) and HR(M+H) were calculated by Equations (6) and (7) for correlation analysis.
where Tre60 is the rectal temperature at 60 min; Tre0 is the rectal temperature at 0 min.
where HR60 is the heart rate at 60 min; HR0 is the heart rate at 0 min.
where ΔTreM is the change value of rectal temperature at moderate work intensity; ΔTreH is the change value of rectal temperature at heavy work intensity.
where ΔHRM is the change value of heart rate at moderate work intensity; ΔHRH is the change value of rectal temperature at heavy work intensity.
Height, body mass, and skinfold thickness cannot reflect a person’s somatotype directly. BSA, BSA/mass, and %fat were used to depict a person’s somatotype based on the previous research. Table 8 shows the Pearson correlation coefficients between these factors and physiological parameters. For comfortable climate, significant positive correlation between ΔTre(M+H) and BSA/mass, and negative correlation between ΔTre(M+H) and %fat are presented; ΔHR(M+H) presents negative correlation with BSA, while it presents significant positive correlations with BSA/mass and %fat. For hot-dry climate, significant positive correlation between ΔTre(M+H) and BSA/mass is presented; ΔHR(M+H) does not present significant correlation with somatotype parameters except %fat. For warm-wet climate, ΔTre(M+H) presents significant positive correlation with BSA/mass; ΔHR(M+H) presents significant positive correlations with BSA/mass and %fat. It can be seen that ΔTre(M+H) and ΔHR(M+H) have significant correlations with BSA, BSA/mass, and %fat, and the effect of BSA/mass and %fat are more significant.
Table 8.
Correlation coefficients between somatotype parameters and physiological parameters.
VO2max and VO2max/mass are used to represent the habitus conditions of subjects. Table 9 shows Pearson correlation coefficients between habitus parameters and physiological parameters. Significant negative correlation between ΔTre(M+H) and VO2max/mass are presented in all conditions. ΔHR(M+H) shows significant positive correlation with VO2max/mass in comfortable and hot-dry climates. ΔTre(M+H) and ΔHR(M+H) do not have significant correlation with VO2max in all conditions. In conclusion, ΔTre(M+H) and ΔHR(M+H) have significant correlation with VO2max/mass, while no significant correlation is seen with VO2max.
Table 9.
Correlation coefficients between habitus parameters and physiological parameters.
Table 10 shows the correlations among BSA/mass, %fat, VO2max, and VO2max/mass, which helps to understand the inner relationship among individual parameters. BSA presents significant correlation with BSA/mass and VO2max. BSA/mass has significant correlation with BSA and VO2max. %fat does not show significant correlation with other parameters except VO2max/mass. VO2max presents significant correlation with other parameters except %fat.
Table 10.
Correlation coefficients among individual parameters.
BSA, BSA/mass, %fat, and VO2max/mass have significant correlations with ΔTre(M+H) and ΔHR(M+H) based on the correlation analyses above. However, BSA only has significant correlation with ΔHR(M+H) in comfortable climate. Moreover, it has significant correlation with BSA/mass and VO2max, which means its effect can be represented by other individual parameters. Thus, BSA/mass, %fat, and VO2max/mass are seen as three independent variables that influence physiological parameters.
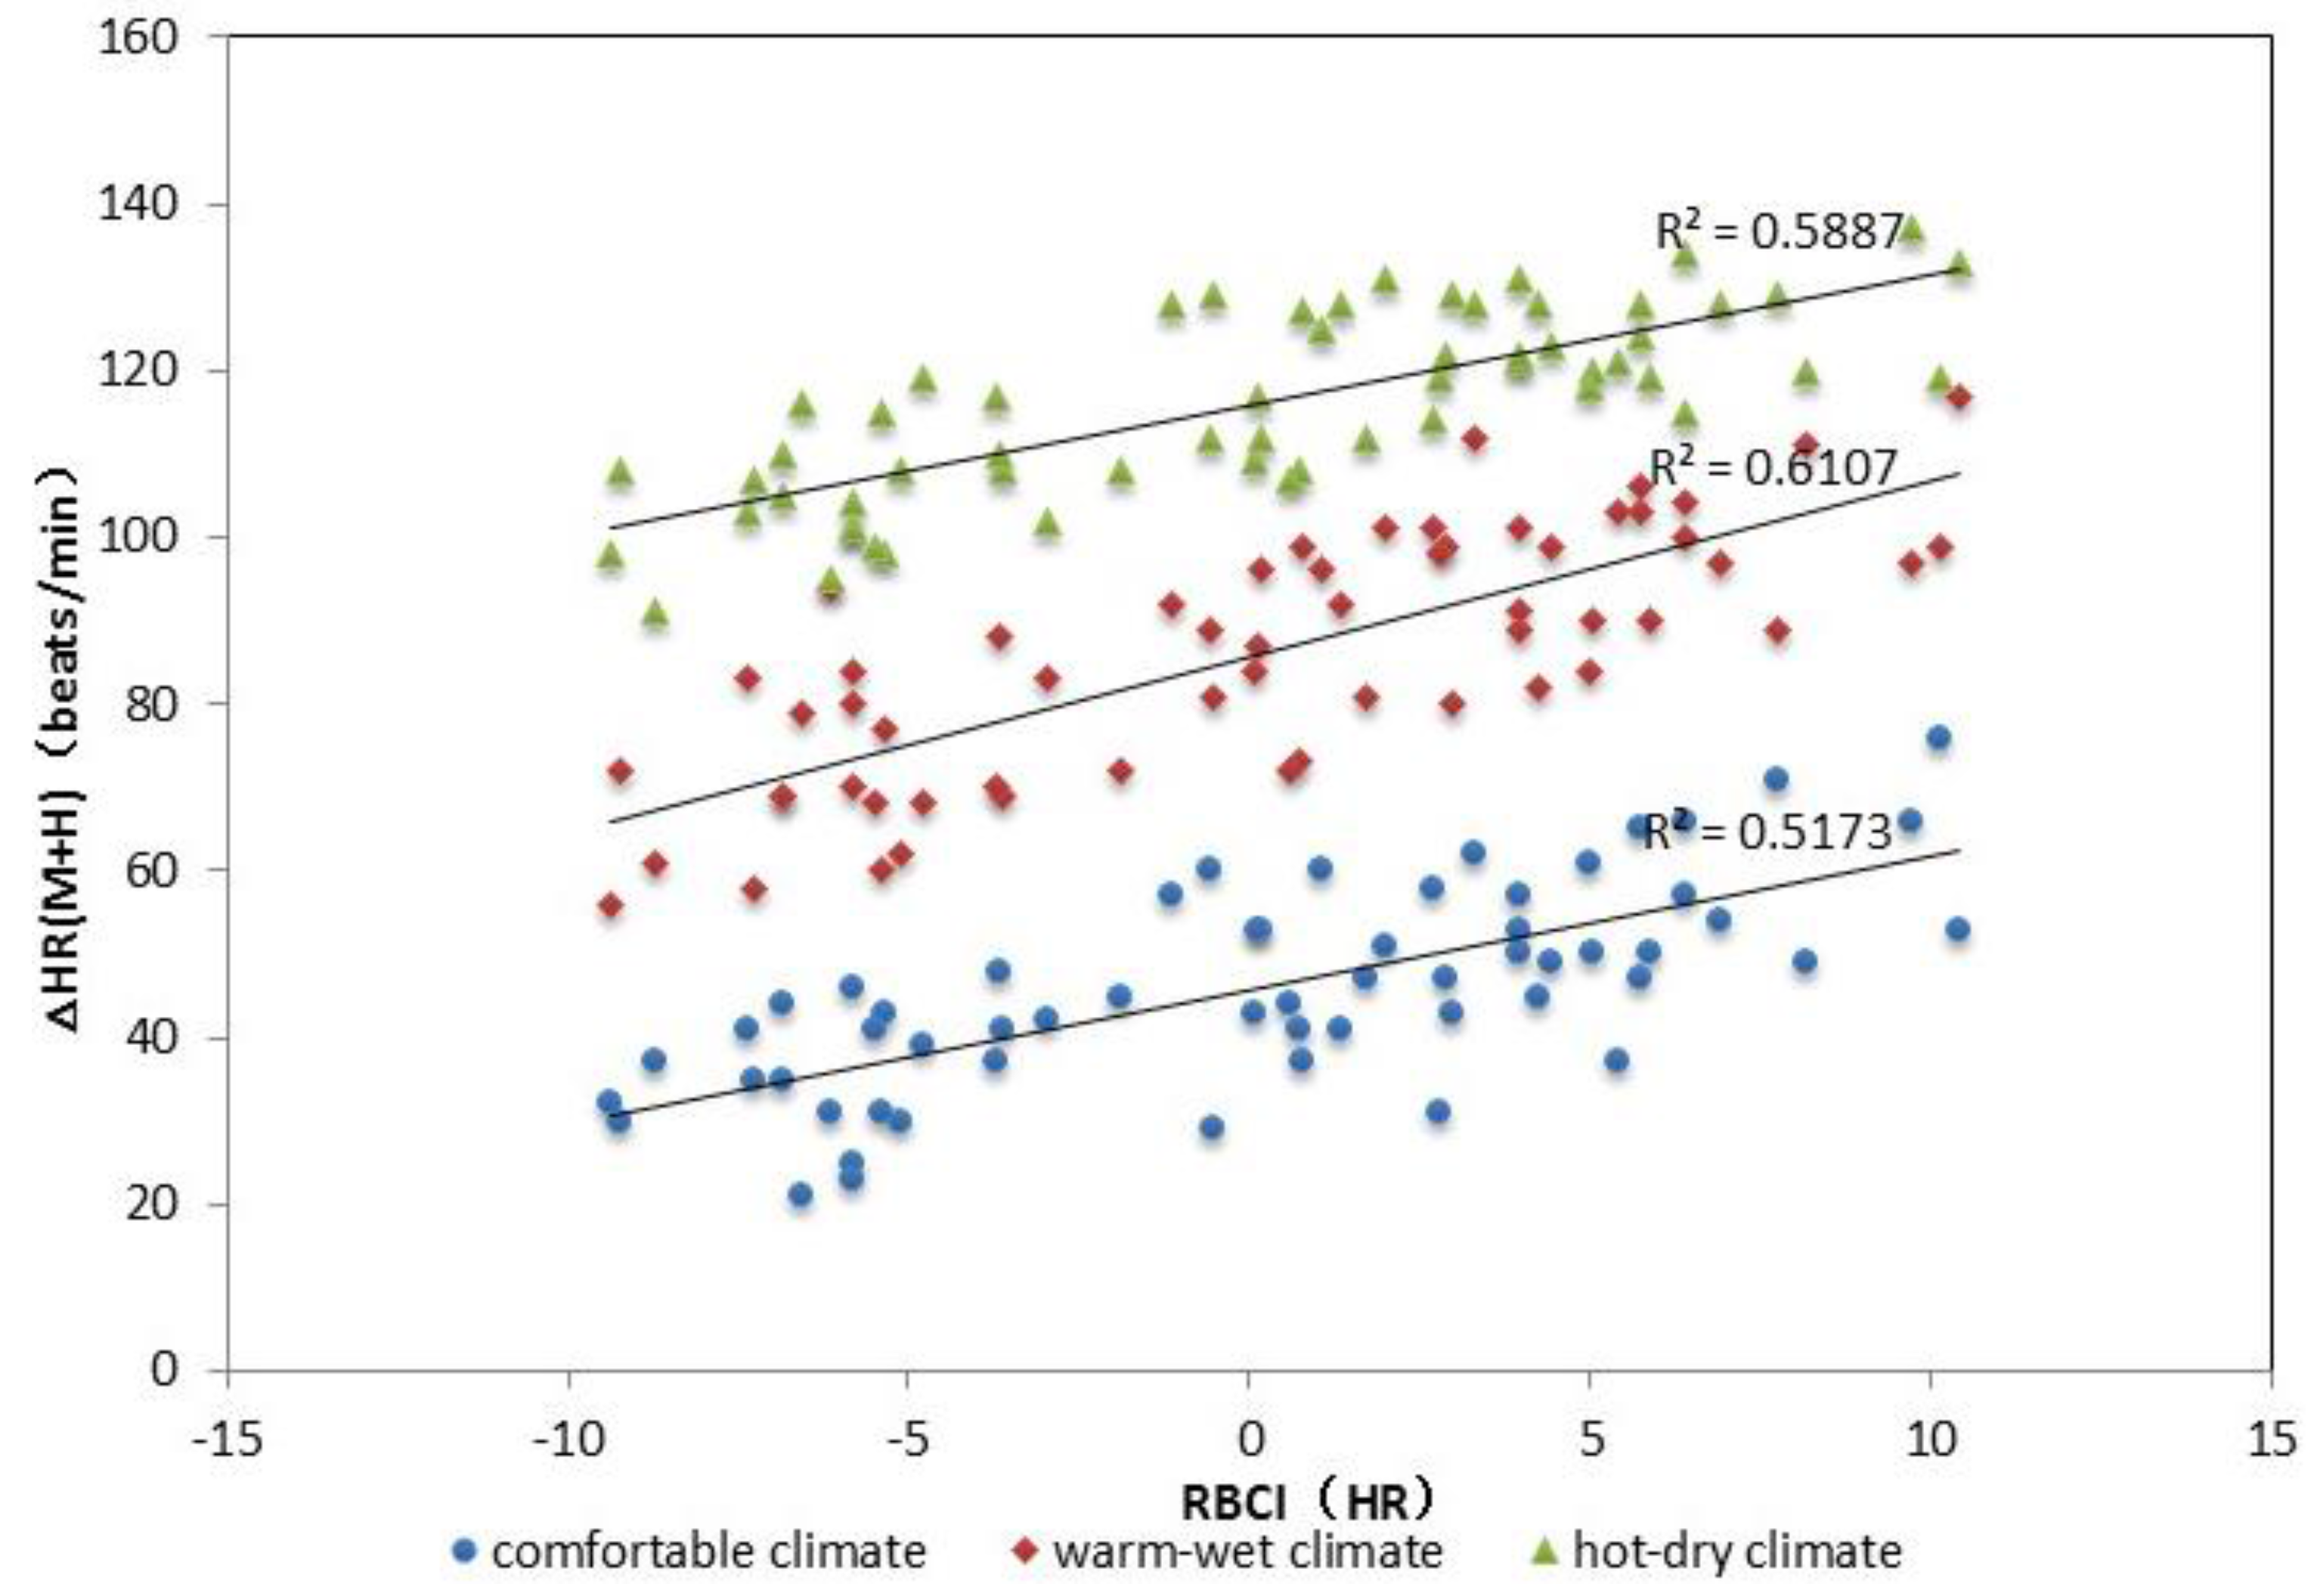
3.3. The Establishment of RBCI Equation
VO2max/mass, BSA/mass, and %fat are chosen as the variable factors for RBCI after correlations analysis above. ΔTre(M+H) and ΔHR(M+H) are considered as dependent variables. Climate, VO2max/mass, BSA/mass, and %fat are considered as independent variables. Table 11 shows the results of multiple regression analysis in SPSS. The fitting degrees of all independent variables to ΔTre(M+H) and ΔHR(M+H) are above 80%, which means the fitting effect is ideal.
Table 11.
Multiple regression coefficients of climate and individual parameters.
The unstandardized regression coefficients of VO2max/mass, BSA/mass, and %fat in Table 11 can be converted into standardized regression coefficients in Table 12. Weight coefficients of VO2max/mass, BSA/mass, and %fat can be calculated based on standardized regression coefficients. Assuming that the total contribution of VO2max/mass, BSA/mass, and %fat is 10, the weight coefficients of VO2max/mass, BSA/mass, and %fat in RBCI are given in Table 12.
Table 12.
Weight coefficients of VO2max/mass, BSA/mass and %fat in RBCI.
Weight coefficients of VO2max/mass, BSA/mass, and %fat are 4.4, 3.0, and 2.6 m, respectively, in the ΔTre(M+H) model and 1.4, 2.9, and 5.7, respectively, in the ΔHR(M+H) model. Thus, the RBCI equations [47] are shown as follows:
For ΔTre(M+H) model
For ΔHR(M+H) model
4. Discussion
4.1. Physiological Parameters
Based on somatotype and habitus characteristic, subjects were classified into four groups: (A) thin and strong; (B) thin and weak; (C) fat and strong; (D) fat and weak. Rectal temperature and heart rate were used to represent physiological responses. It could be found that the body temperature and heart rate would increase when people work in extreme climates and the increasing degrees for different groups are not the same. Table 13 shows the result of pairwise comparisons that is an efficient way to study the difference of physiological parameter between groups. It is easy to distinguish whether there are significant differences between two groups through the variance analysis in SPSS. As shown in Table 13, it can be seen:
- (a)
- Rectal temperature
Table 13.
Individual physiological parameters difference.
Each group in CFM condition shows a significant difference with other group except the pair of groups C and D. The difference between groups B and C in CFH condition is significant while other pairs do not present significant difference. Group B shows a significant difference with group C in the WWM condition. There is no obvious difference in other conditions.
- (b)
- Heart rate
The differences between groups A and C, groups A and D in the CFM condition are significant; when exercising in the CFH condition, the difference between groups A and B is significant. When subjects exercise in the WWM condition, the differences between groups A and C, and groups B and C are significant. No obvious differences exist in other conditions.
Based on the analysis above, it can be concluded that physiological parameters among four groups are significantly different in the comfortable climate, but the differences between each other decrease when the intensity of experimental condition enhances. Thus, the effect of somatotype and habitus differences on physiological responses exists and the effect decreases with the increase of experimental intensity.
4.2. RBCI
BSA/mass, %fat, and VO2max/mass were extracted to compose RBCI equation through analyzing the correlations between individual characteristic and physiological parameters in comfortable, hot-dry, and warm-wet climates. To verify whether RBCI has significant influence on ΔTre(M+H) and ΔHR(M+H), it is also necessary to make correlation analysis. As shown in Table 14, ΔTre(M+H) and ΔHR(M+H) have significant correlation with RBCI and the correlation coefficients in hot-dry and warm-wet climates are larger than the values in comfortable climate. Figure 6 and Figure 7 show the unary linear regression modules of RBCI and physiological response in comfortable, hot-dry and warm-wet climates. It can be seen that the fitting degrees of RBCI (Tre) to ΔTre(M+H) and RBCI (HR)to ΔHR(M+H) are above 50% except the condition of RBCI (Tre) to ΔTre(M+H) in comfortable climate. Therefore, the RBCI can be applied to evaluate the effect of somatotype and habitus parameters on rectal temperature and heart rate.
Table 14.
Correlation coefficient between RBCI and physiological parameters.
Figure 6.
Regression fitting curve of RBCI (Tre) and ΔTre(M+H).
Figure 7.
Regression fitting curve of RBCI (HR) and ΔHR(M+H).
For known climate factors, the RBCI can be used to predict physiological parameters, which does not need to measure physiological parameters in the heat exposure experiment. However, as RBCI is established on the basis of a known subject category, the value calculated by the method is suited to people who belong to the same category, which is not applicable to all kinds of people. The further revision of RBCI should be conducted in a future study.
5. Conclusions
Based on individual somatotype and habitus characteristic, subjects were classified into four types: (A) thin and strong; (B) thin and weak; (C) fat and strong; (D) fat and weak. Physiological parameters (rectal temperature, heart rate) were used to reflect individual physiological responses. It could be found that the physiological responses among four types of subjects are different. All subjects showed a high level of thermal stress and the differences between each other decrease when the intensity of experimental condition increases. Thus, the effect of individual somatotype and habitus differences on physiological responses exists and the effect decreases with the increase of climate intensity.
Through analyzing the correlations between individual basic parameters and physiological parameters variation in comfortable climate, hot-dry climate and warm-wet climate, BSA/mass, %fat, and VO2max/mass were extracted to compose the RBCI equation. The correlation coefficient between the BCI and physiological parameter variations in hot-dry and warm-wet climates are larger than the values in comfortable climate, which indicates that the evaluation ability of RBCI increases with the increase of environmental intensity. Therefore, the RBCI can be used to predict the effect of somatotype and habitus parameters on physiological parameter variations during heat exposure experiment.
Acknowledgments
This research has been supported by National Natural Science Foundation of China (Grant No. 50908157). The authors would like to acknowledge the subjects who volunteered for this study.
Author Contributions
Shilei Lu conceived the research and designed the experiments; Linwei Sun wrote and improved the paper; Huaiyu Peng and Liran Ji performed the experiments; Huaiyu Peng and Linwei Sun analyzed the data.
Conflicts of Interest
The authors declare no conflict of interest.
Abbreviations
The following abbreviations are used in this manuscript:
| RBCI | A revised body characteristic index |
| CFM | Comfortable climate and moderate work intensity |
| CFH | Comfortable climate and heavy work intensity |
| HDM | Hot-dry climate and moderate work intensity |
| HDH | Hot-dry climate and heavy work intensity |
| WWM | Warm-wet climate and moderate work intensity |
| WWH | Warm-wet climate and heavy work intensity |
| BSA | Body surface area |
| BSA/mass | Body surface area per unit of body mass |
| VO2max | Maximum oxygen consumption |
| VO2max/mass | Maximum oxygen consumption per unit of body mass |
| %fat | Percentage of body fat |
| SPSS | Statistical package and social sciences software |
| ΔTre | The change value of rectal temperature |
| ΔHR | The change value of heart rate |
| ΔTre(M+H) | The sum of ΔTre in moderate and heavy intensity work |
| ΔHR(M+H) | The sum of ΔHR in moderate and heavy intensity work |
| RBCI (Tre) | The RBCI in ΔTre(M+H) model |
| RBCI (HR) | The RBCI in ΔHR(M+H) model |
References
- Brake, D.J.; Bates, G.P. Deep body core temperatures in industrial workers under thermal stress. J. Occup. Environ. Med. 2002, 44, 125–135. [Google Scholar] [CrossRef] [PubMed]
- Tang, Y.M.; Li, Y.X.; Li, J.; Sun, W.F.; Tian, Z.Z.; Liu, W.T.; Wang, D.G. Analysis on nutrition and health related knowledge awareness and behavior formation among workers exposed to high temperature in an iron and steel factory. J. Environ. Occup. Med. 2015, 32, 758–762. [Google Scholar]
- Zhang, J.S.; Zhang, J.J.; Zang, L.H. Thermophilic bio-hydrogen production from corn-bran residuepretreated by calcined-lime mud from papermaking process. Bioresour. Technol. 2015, 198, 564–570. [Google Scholar] [CrossRef] [PubMed]
- Kalmár, F. Summer operative temperatures in free running existing buildings with high glazed ratio of the facades. J. Build. Eng. 2016, 6, 236–242. [Google Scholar] [CrossRef]
- Kalkowsky, B.; Kampmann, B. Physiological strain of miners at hot working places in German coal mines. Ind. Health 2006, 44, 465–473. [Google Scholar] [CrossRef] [PubMed]
- Palella, B.I.; Quaranta, F.; Riccio, G. On the management and prevention of heat stress for crews onboard ships. Ocean Eng. 2016, 112, 277–286. [Google Scholar] [CrossRef]
- Epstein, Y.; Keren, G.; Moisseiev, J. Psychomotor deterioration during exposure to heat. Aviat. Space Environ. Med. 1980, 51, 607–610. [Google Scholar] [PubMed]
- Diaz, F.J.; Bransford, D.R.; Kobayashi, K.; Horvath, S.M.; MaMurray, R.G. Plasma volume changes during rest and exercise in different postures in a hot humid environment. J. Appl. Physiol. 1979, 47, 798–803. [Google Scholar] [PubMed]
- Kobayashi, K.; Horvath, S.M.; Diaz, F.J.; Drinkwater, B.L.; Levine, L.; Pandolf, K.B. Thermoregulation during rest and exercise in different postures in a hot humid environment. J. Appl. Physiol. 1980, 48, 999–1007. [Google Scholar]
- Sawka, M.N.; Young, A.J.; Cadarette, B.S. Influence of heat stress and acclimation on maximal aerobic power. Eur. J. Appl. Physiol. Occup. Physiol. 1985, 53, 294–298. [Google Scholar] [CrossRef] [PubMed]
- Kenney, W.L. A review of comparative responses of men and women to heat stress. Environ. Res. 1985, 37, 1–11. [Google Scholar] [CrossRef]
- Stewart, I.B.; Rojek, A.M.; Hunt, A.P. Heat strain during explosive ordnance disposal. Mil. Med. 2011, 176, 959–963. [Google Scholar] [CrossRef] [PubMed]
- Godek, S.F.; Bartolozzi, A.R.; Godek, J.J. Sweat rate and fluid turnover in American football players compared with runners in a hot and humid environment. Br. J. Sports Med. 2005, 39, 205–211. [Google Scholar] [CrossRef] [PubMed]
- Nielsen, B.; Hales, J.R.; Strange, S. Human circulatory and thermoregulatory adaptations with heat acclimation and exercise in a hot, dry environment. J. Physiol. 1993, 460, 467–485. [Google Scholar] [CrossRef] [PubMed]
- Kjellstrom, T.; Holmér, I.; Lemke, B. Workplace heat stress, health and productivity—An increasing challenge for low and middle-income countries during climate change. Glob. Health Action 2009. [Google Scholar] [CrossRef] [PubMed]
- Kjellstrom, T.; Crowe, J. Climate change, workplace heat exposure, and occupational health and productivity in Central America. Int. J. Occup. Environ. Health 2011, 17, 270–281. [Google Scholar] [CrossRef] [PubMed]
- Brake, D.J.; Bates, G.P. Fluid losses and hydration status of industrial workers under thermal stress working extended shifts. Occup. Environ. Med. 2003, 60, 90–96. [Google Scholar] [CrossRef] [PubMed]
- Xing, J.J. Study in the relation between fatigue of coalminers and coalmine accidents in China. J. Saf. Sci. Technol. 2005, 1, 19–21. [Google Scholar]
- Donoghue, A.M.; Sinclair, M.J.; Bates, G.P. Heat exhaustion in a deep underground metalliferous mine. Occup. Environ. Med. 2000, 57, 165–174. [Google Scholar] [CrossRef] [PubMed]
- Niimi, Y.; Matsukawa, T.; Sugiyama, Y. Effect of heat stress on muscle sympathetic nerve activity in humans. J. Auton. Nerv. Syst. 1997, 63, 61–67. [Google Scholar] [CrossRef]
- Tikuisis, P.; Keefe, A. Heat strain at high levels does not degrade target detection and rifle marksmanship. Aviat. Space Environ. Med. 2005, 76, 963–969. [Google Scholar] [PubMed]
- Hancock, P.A.; Vasmatzidis, I. Effects of heat stress on cognitive performance: The current state of knowledge. Int. J. Hyperth. 2003, 19, 355–372. [Google Scholar] [CrossRef] [PubMed]
- D’Ambrosio Alfano, F.R.; Malchaire, J.; Palella, B.I.; Riccio, G. The WBGT index revisited after 60 years of use. Ann. Occup. Hyg. 2014, 58, 955–970. [Google Scholar] [CrossRef] [PubMed]
- Yaglou, C.P.; Minard, D. Control of heat casualties at military training centers. AMA Arch. Ind. Health 1957, 16, 302–316. [Google Scholar] [PubMed]
- International Organization for Standardization. ISO 7243 Hot Environments: Estimation of the Heat Stress on Working Man, Based on the WBGT-Index (Wet Bulb Globe Temperature); International Organization for Standardization: Geneva, Switzerland, 1989. [Google Scholar]
- Japan Society of Occupational Health. Recommendation of occupational exposure limits 2005–2006. J. Occup. Health 2005, 47, 354–370. [Google Scholar]
- American Conference of Governmental Industrial Hygienists (ACGIH). Threshold Limit Values for Chemical Substances and Physical Agents and Biological Exposures Indices, 2011; ACGIH: Cincinnati, OH, USA, 2011. [Google Scholar]
- Malchaire, J.B.; Piette, A.; Kampmann, B.; Menhert, P.; Gebhardt, H.J.; Havenith, G.; Den Hartog, E.; Holmér, I.; Parsons, K.; Alfano, G.; et al. Development and validation of the predicted heat strain model. Ann. Occup. Hyg. 2001, 45, 123–135. [Google Scholar] [CrossRef] [PubMed]
- International Organization for Standardization (ISO). Ergonomics of the Thermal Environment—Analytical Determination and Interpretation of Heat Stress Using Calculation of the Predicted Heat Strain; ISO Standard 7933; ISAO: Geneva, Switzerland, 2004. [Google Scholar]
- International Organization for Standardization (ISO). Ergonomics of Thermal Environments—Strategy of Evaluation of the Risk for the Prevention of Constraints or Discomfort under Thermal Working Conditions; ISO Standard 15265; ISAO: Geneva, Switzerland, 2004. [Google Scholar]
- Havenith, G.; Middendorp, H.V. The relative influence of physical fitness, acclimatization state, anthropometric measures and gender on individual reactions to heat stress. Eur. J. Appl. Physiol. Occup. Physiol. 1990, 61, 419–427. [Google Scholar] [CrossRef] [PubMed]
- Havenith, G.; Coenen, J.M.L.; Kistemaker, L. Relevance of individual characteristics for human heat stress response is dependent on exercise intensity and climate type. Eur. J. Appl. Physiol. Occup. Physiol. 1998, 77, 231–241. [Google Scholar] [CrossRef] [PubMed]
- Havenith, G. Individualized model of human thermoregulation for the simulation of heat stress response. J. Appl. Physiol. 2001, 90, 1943–1954. [Google Scholar] [PubMed]
- Lu, S.L.; Peng, H.Y.; Gao, P. A body characteristic index to evaluate the level of risk of heat strain for a group of workers with a test. Int. J. Occup. Saf. Ergon. 2015. [Google Scholar] [CrossRef] [PubMed]
- Zhao, J.; Zhu, N.; Lu, S.L. Productivity model in hot and humid environment based on heat tolerance time analysis. Build. Environ. 2009, 44, 2202–2207. [Google Scholar] [CrossRef]
- Yu, Z.; Yang, B.; Zhu, N. Effect of thermal transient on human thermal comfort in temporarily occupied space in winter—A case study in Tianjin. Build. Environ. 2015, 93, 27–33. [Google Scholar] [CrossRef]
- Shen, D.D.; Zhu, N. Influence of the temperature and relative humidity on human heat acclimatization during training in extremely hot environments. Build. Environ. 2015, 94, 1–11. [Google Scholar] [CrossRef]
- Shi, X.L.; Zhu, N.; Zheng, G.Z. The combined effect of temperature, relative humidity and work intensity on human strain in hot and humid environments. Build. Environ. 2013, 69, 72–80. [Google Scholar] [CrossRef]
- Tian, Z.; Zhu, N. Experimental study on physiological and psychological effects of heat acclimatization in extreme hot environment s. Build. Environ. 2011, 46, 2033–2041. [Google Scholar] [CrossRef]
- DuBois, D.; DuBois, E.F. A formula to estimate the approximate surface area if height and weight be known. Arch. Intern. Med. 1916, 17, 863–871. [Google Scholar] [CrossRef]
- Durnin, J.V.G.A.; Womersly, J. Body fat assessed from total body density and its estimation from skinfold thickness: Measurements on 481 men and women aged 16 to 72 years. Br. J. Nutr. 1974, 32, 77–97. [Google Scholar] [CrossRef] [PubMed]
- Landau, S.; Everitt, B.S. A Handbook of Statistical Analysis Using SPSS; Chapman and Hall/CRC: Boca Raton, FL, USA, 2003. [Google Scholar]
- Lu, Z.B.; Wang, Y.; Wang, J. SPSS 10.0 applied in experimental data analysis. Environ. Technol. 2003, 3, 36–41. [Google Scholar]
- Li, X.S.; Chen, Z.Z. Correctly using SPSS software for principal components analysis. Stat. Res. 2010, 27, 105–108. [Google Scholar]
- He, T.; Zhang, L.G.; Zeng, Y.; Zuo, C.Y.; Li, J. Water quality comprehensive index method of Eltrix River in Xinjiang province using SPSS. Procedia Earth Planet. Sci. 2012, 5, 314–321. [Google Scholar]
- Tobias, S.; Carlson, J.E. Bartlett’s Test of Sphericity and chance findings in factor analysis. Multivar. Behav. Res. 1969, 4, 375–377. [Google Scholar] [CrossRef] [PubMed]
- Lu, S.L.; Ji, L.R.; Peng, H.Y. Research of individual physiological parameters difference and revised body characteristics index in hot-dry and warm-wet climates. Procedia Eng. 2015, 121, 175–181. [Google Scholar] [CrossRef]
© 2016 by the authors; licensee MDPI, Basel, Switzerland. This article is an open access article distributed under the terms and conditions of the Creative Commons Attribution (CC-BY) license (http://creativecommons.org/licenses/by/4.0/).