
Contribution of Forest Restoration to Rural Livelihoods and Household Income in Indonesia


Abstract
:1. Introduction
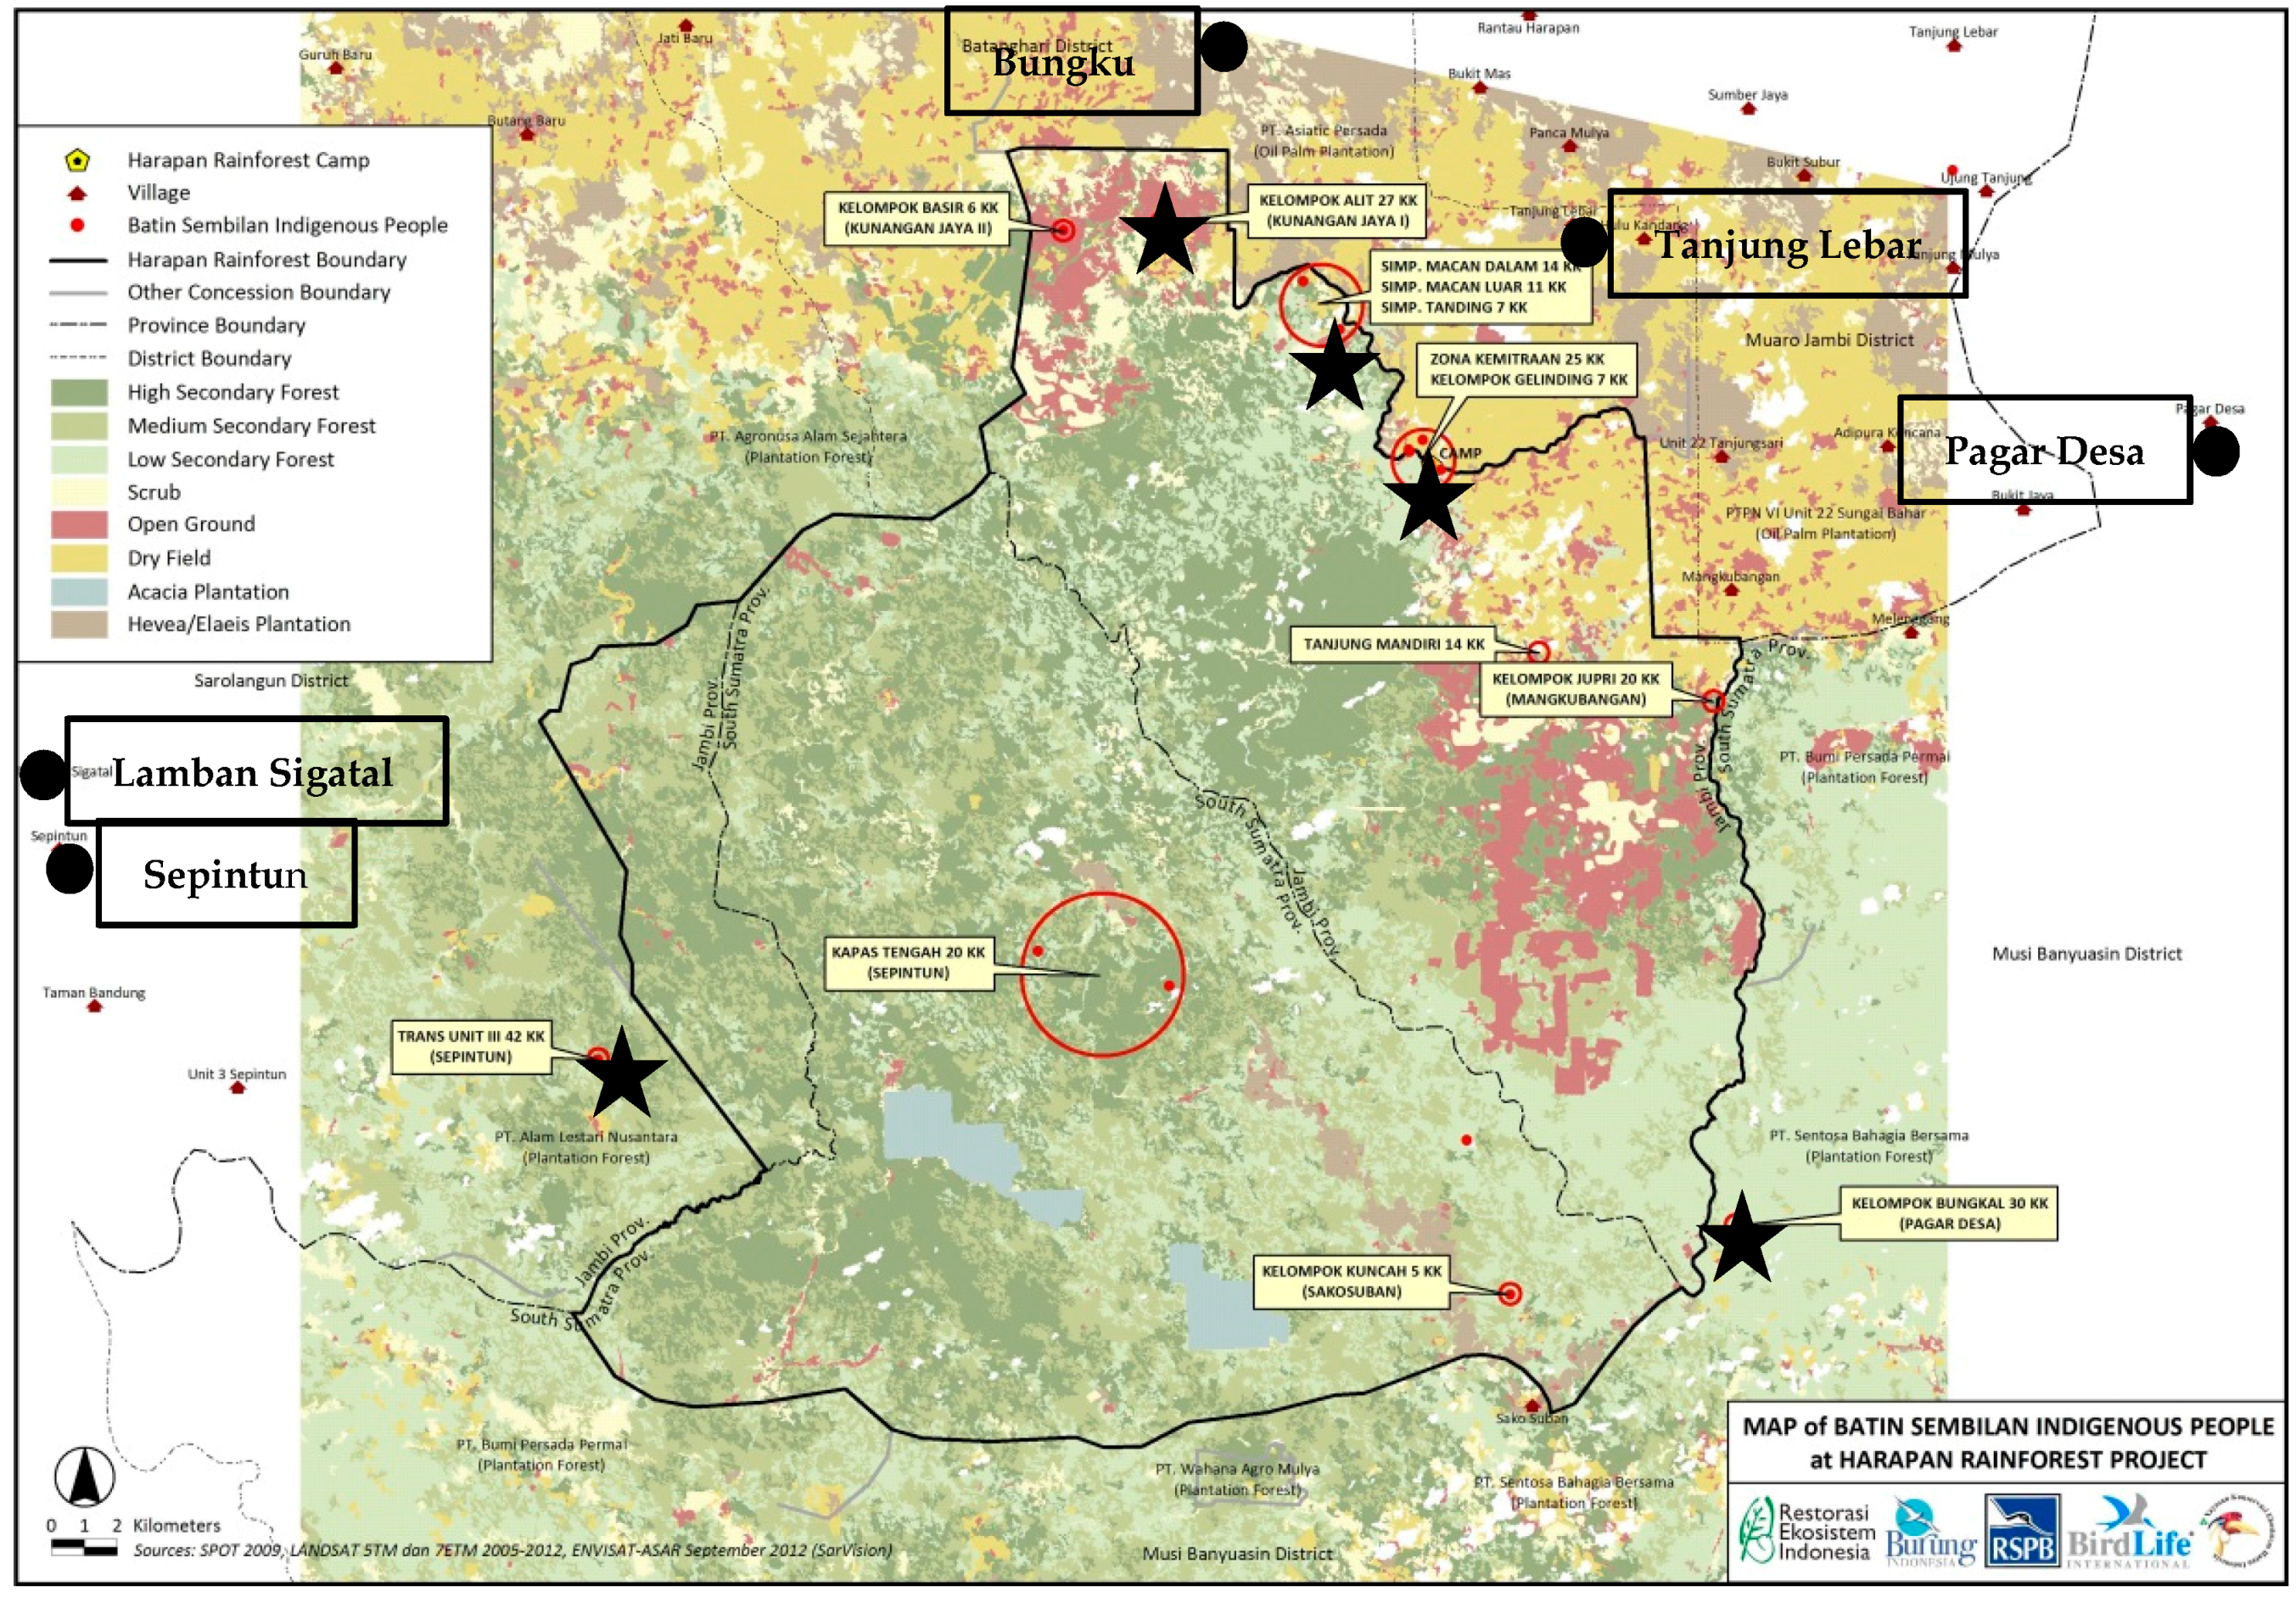
2. Study Area
3. Method
3.1. Data Collection
3.2. Definitions of Variables and Income Calculation
3.3. Statistical and Econometric Analyses
- (a)
- Natural forest income = Natural forest + Forest-derived product + Forest wage + Forest business
- (b)
- Non-natural forest income = Rubber plantation + Agriculture + Non-forest wage + Non-forest business + Non-forest environmental + Livestock + Others
4. Results
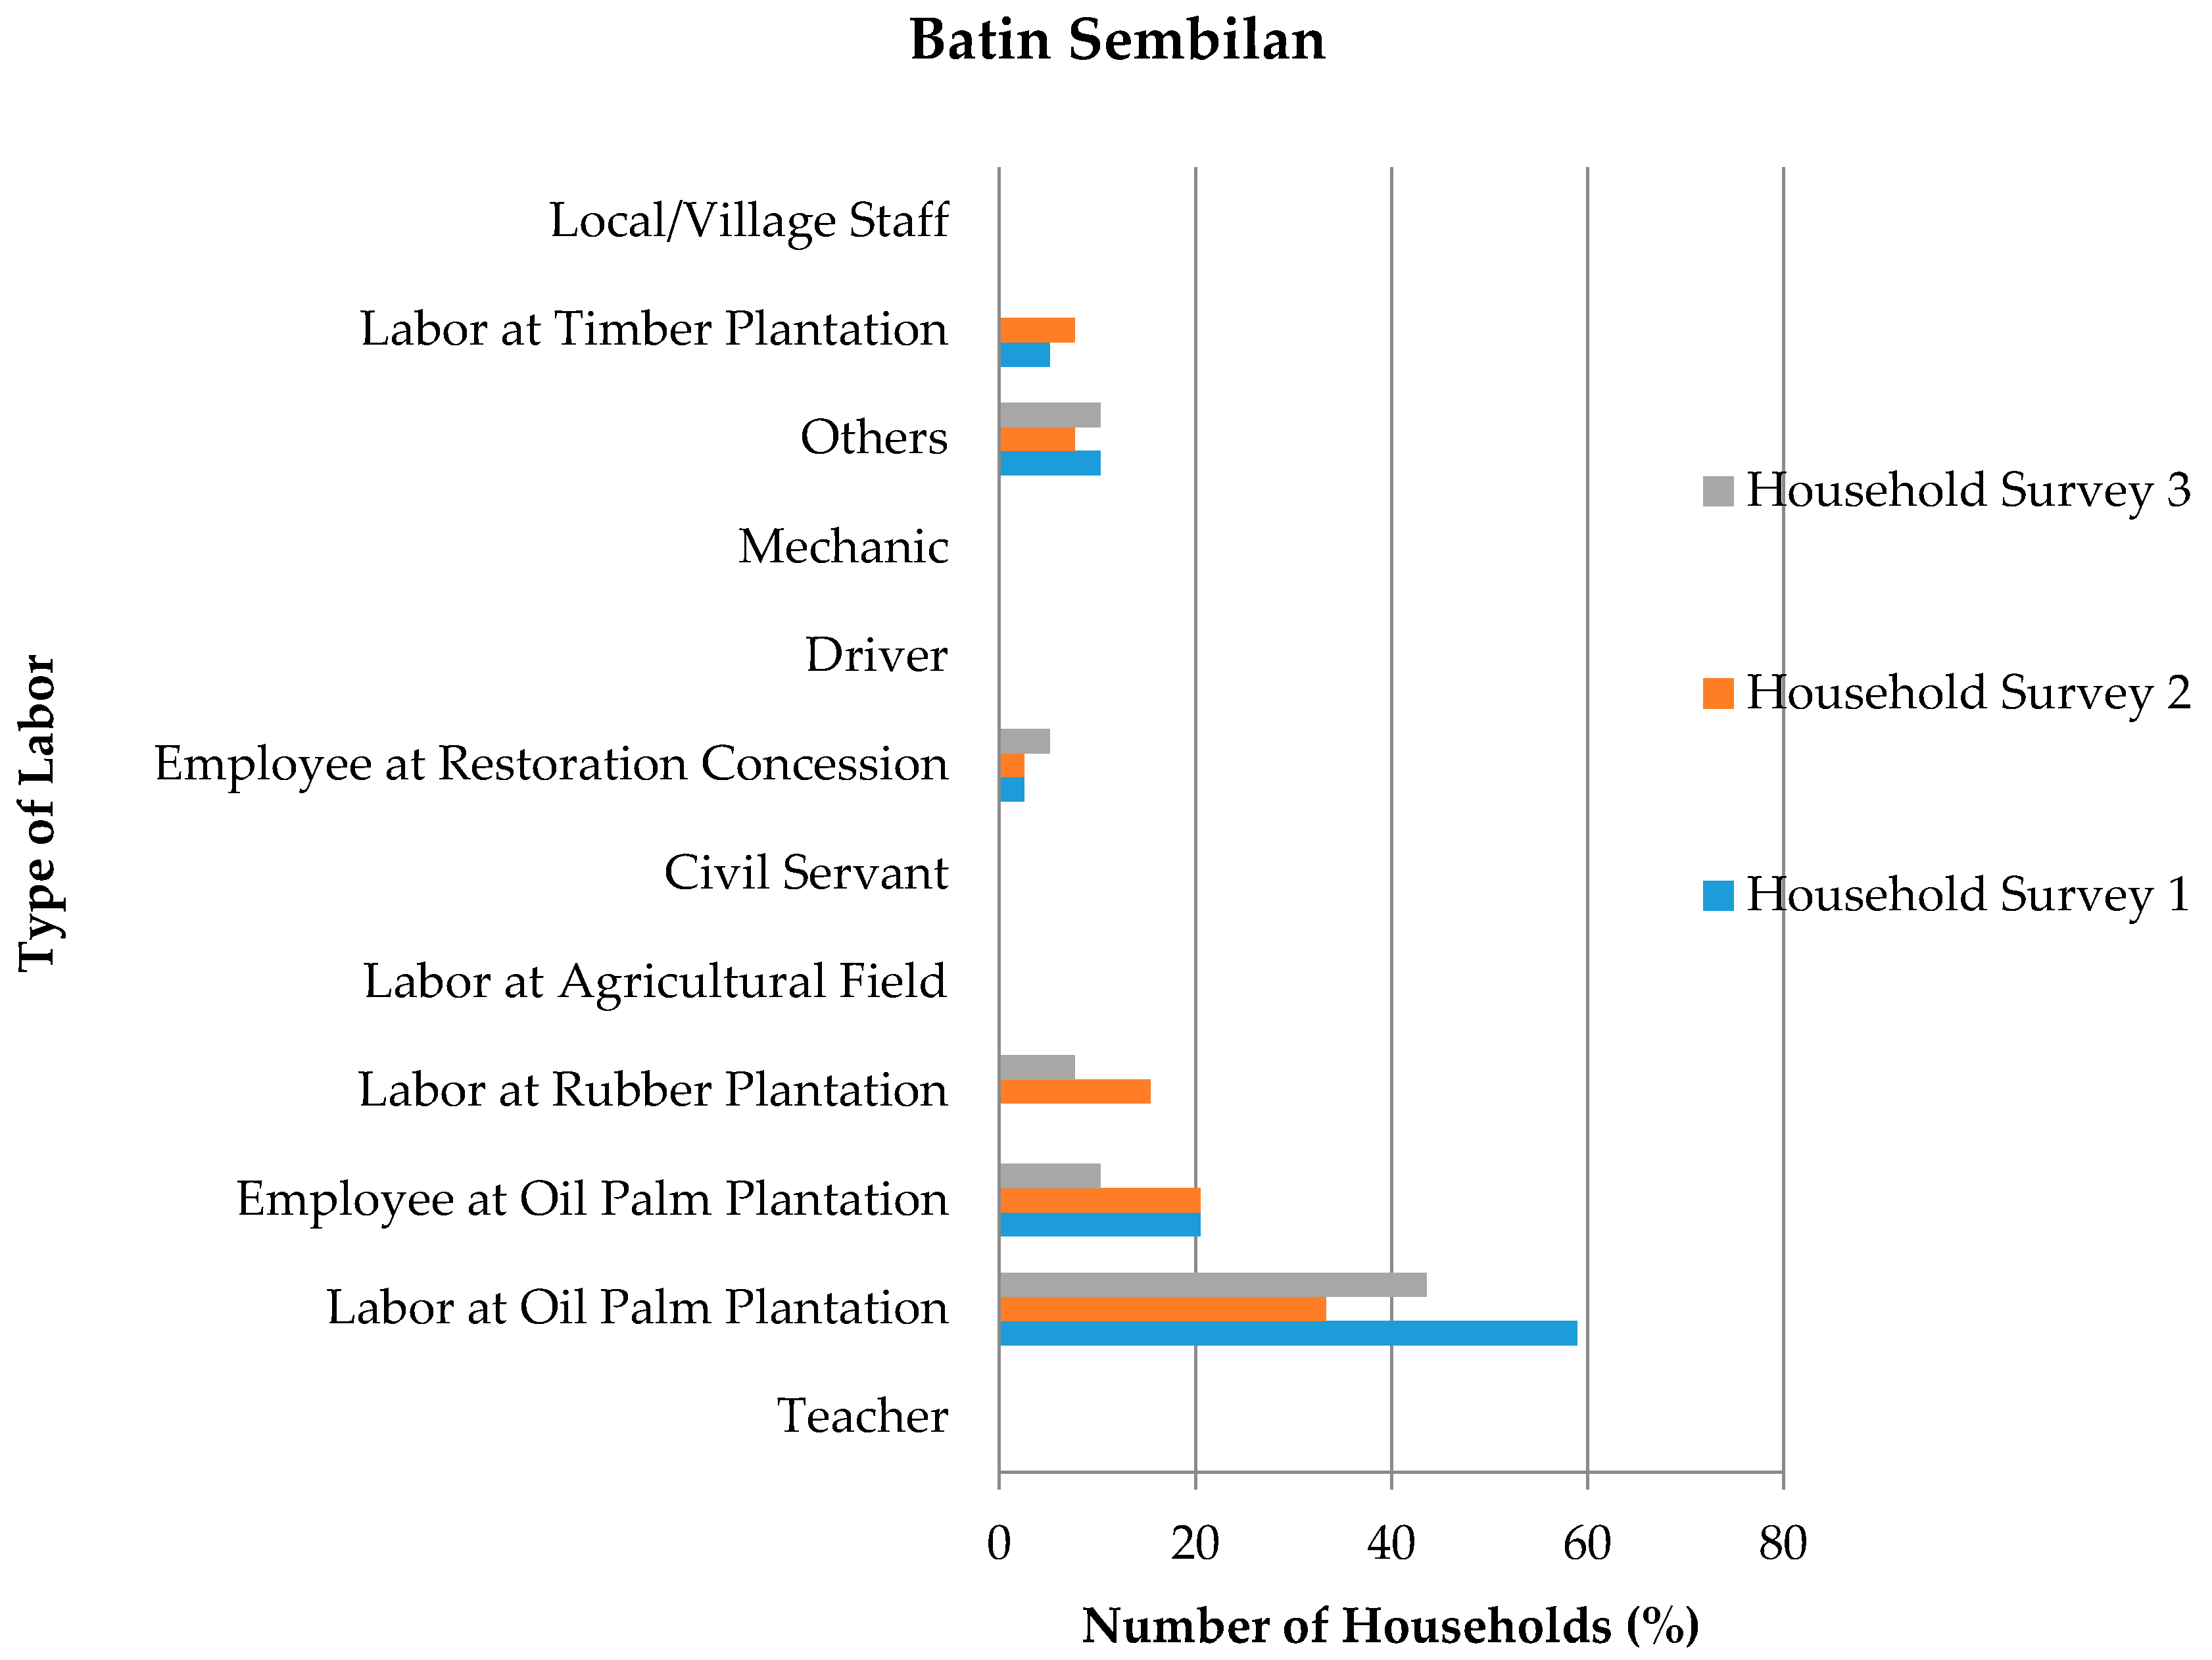
4.1. Description of Socio-Economics Characteristics
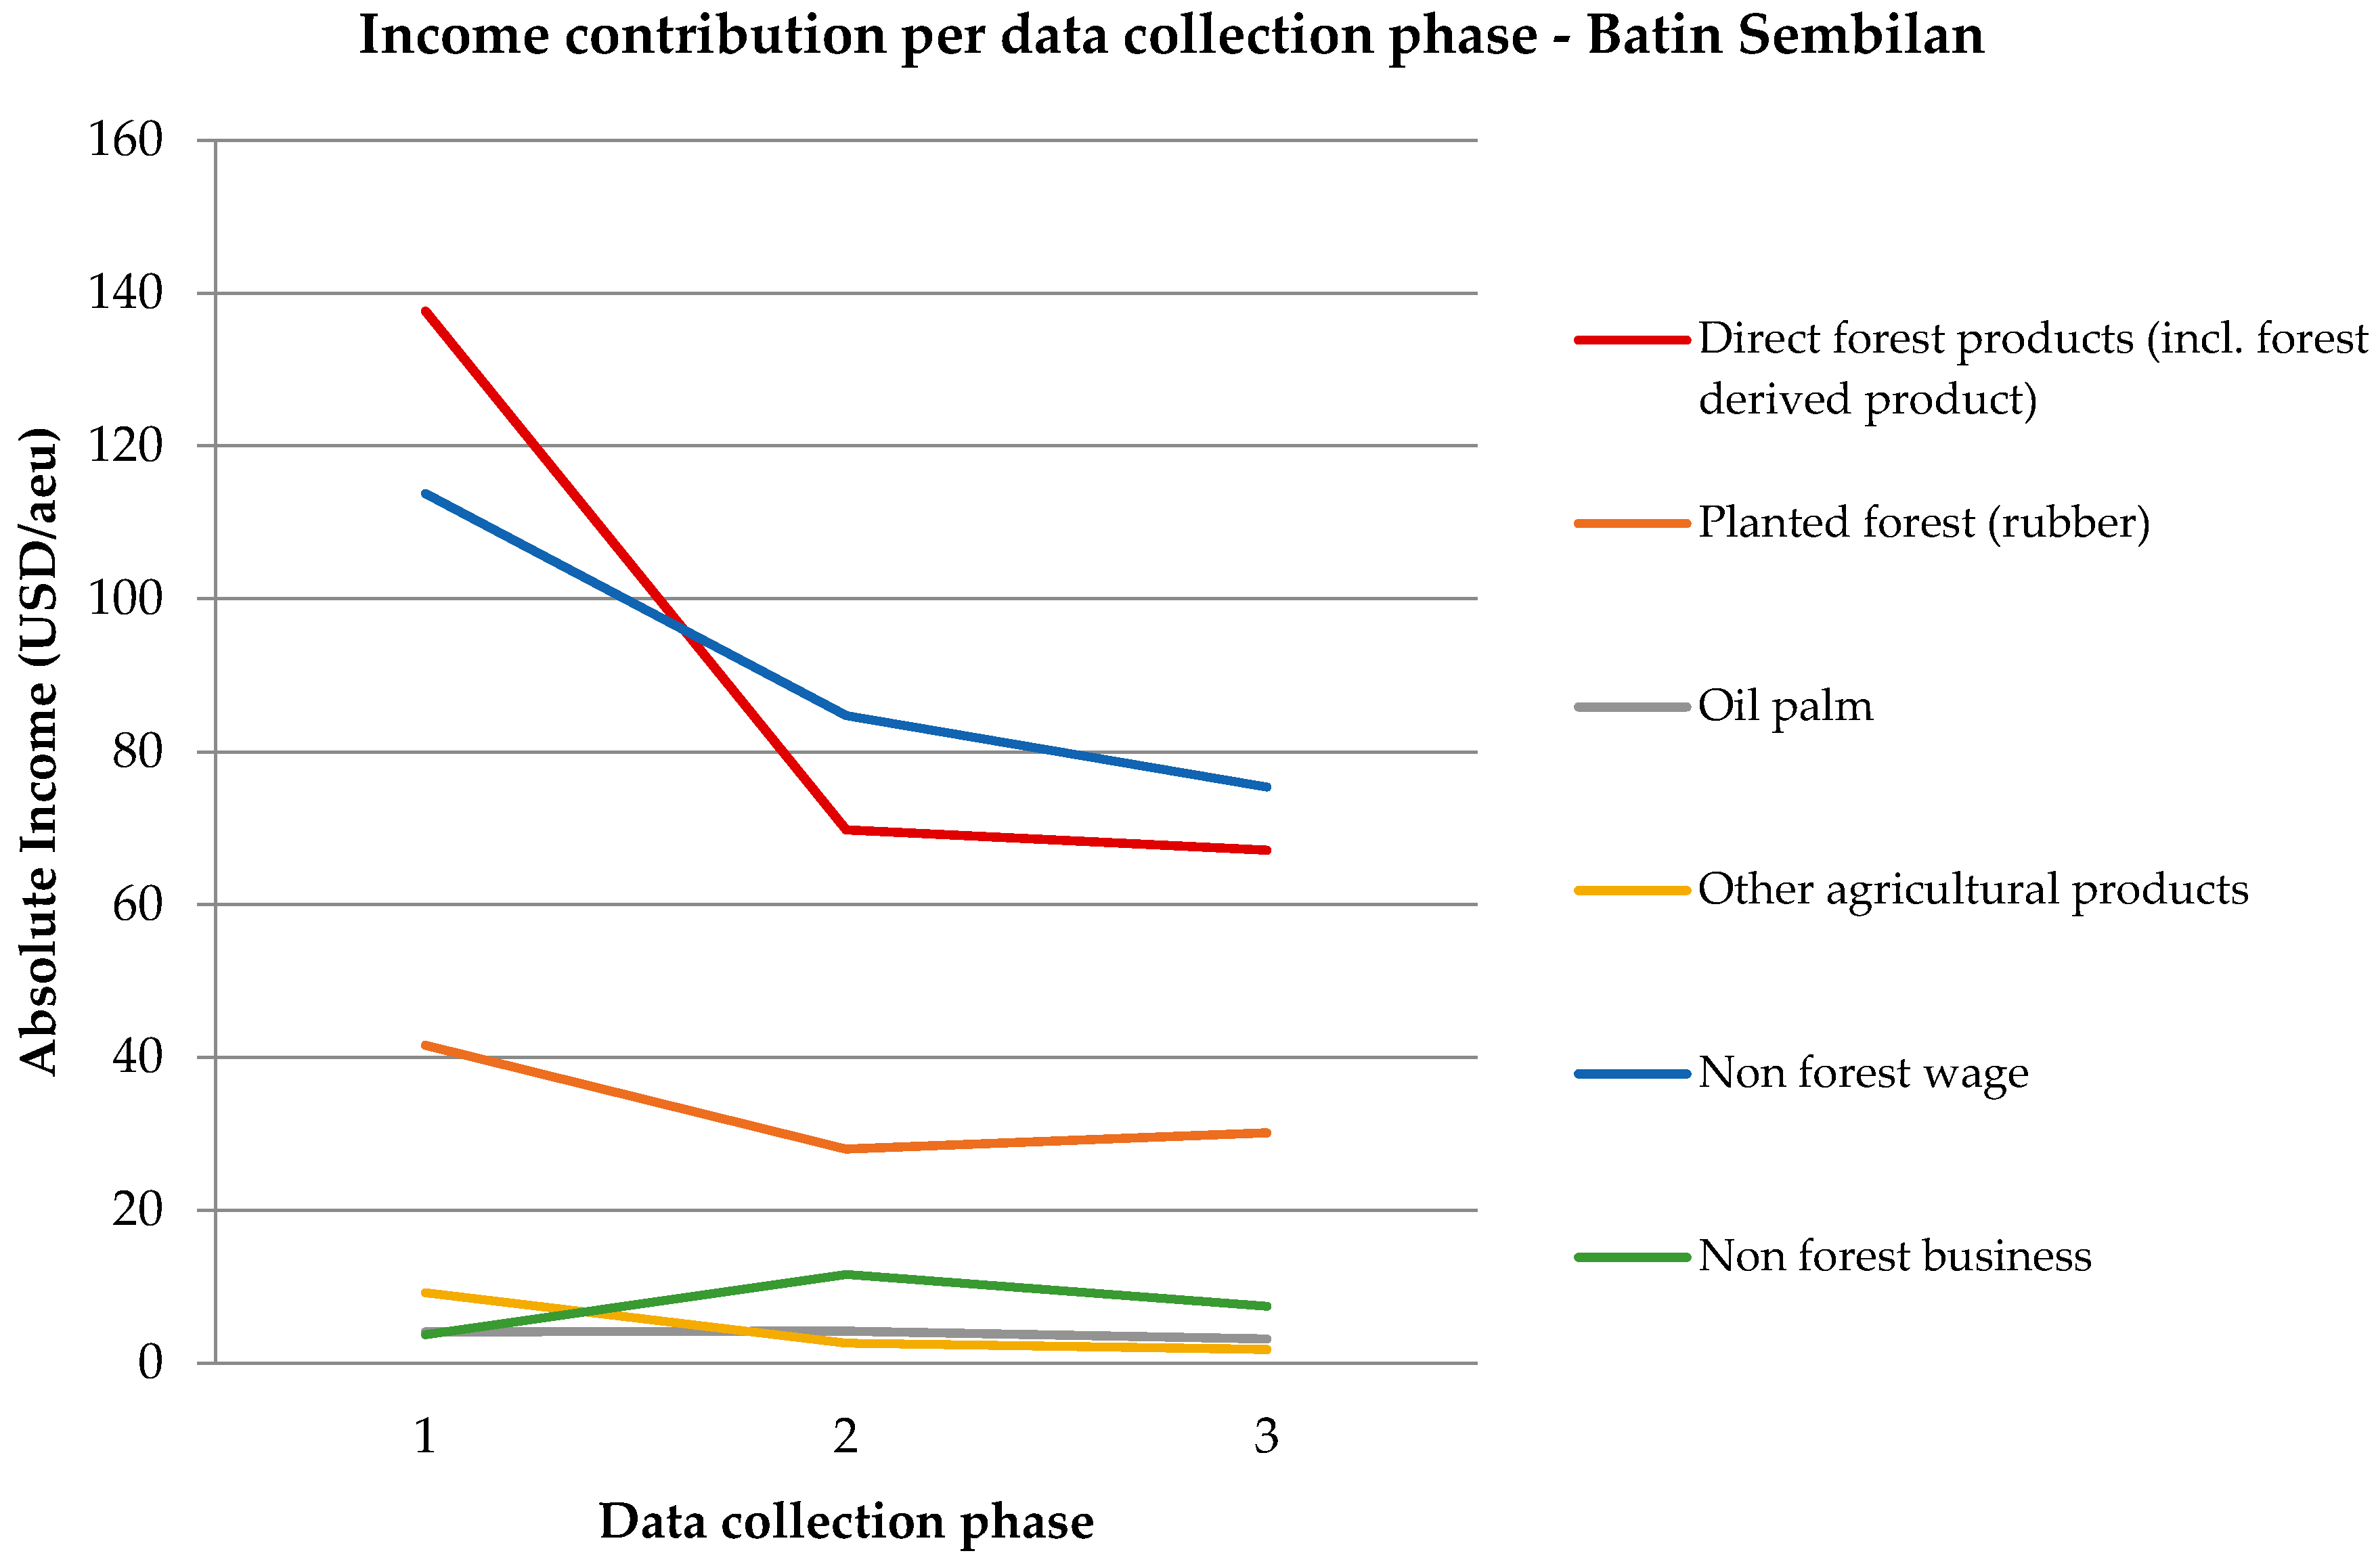
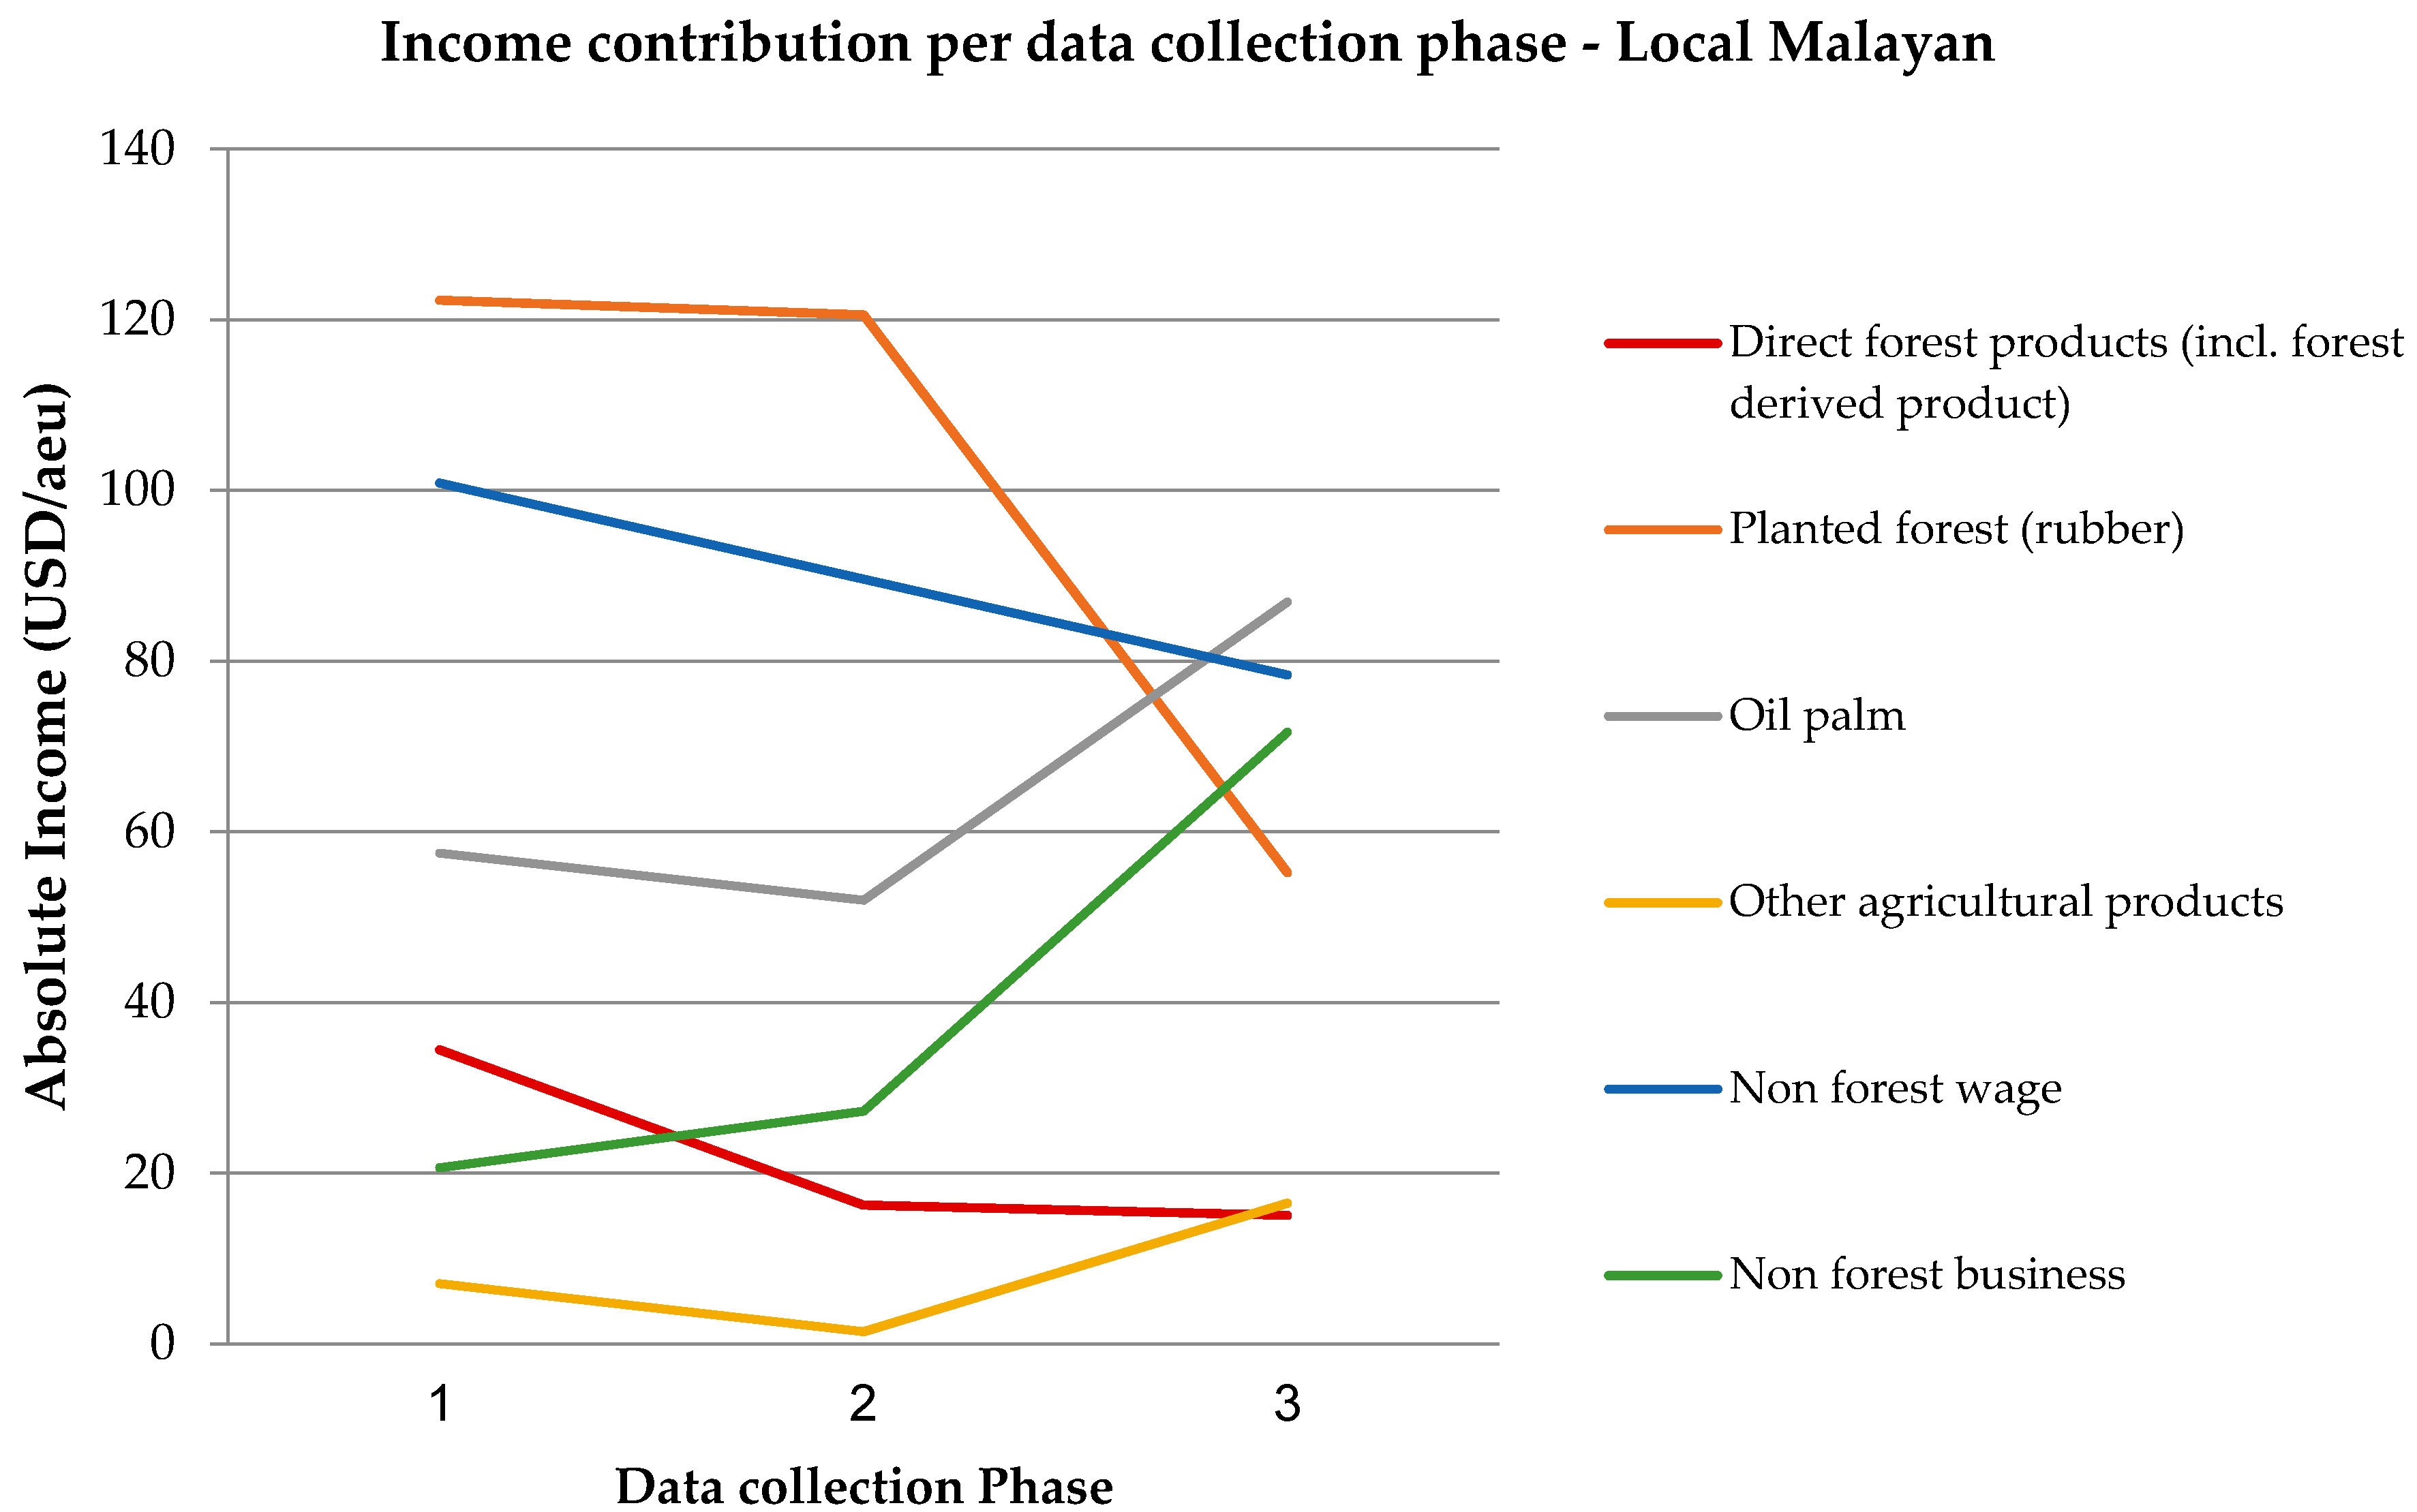
4.2. Income Characteristics of Three Ethnic Groups
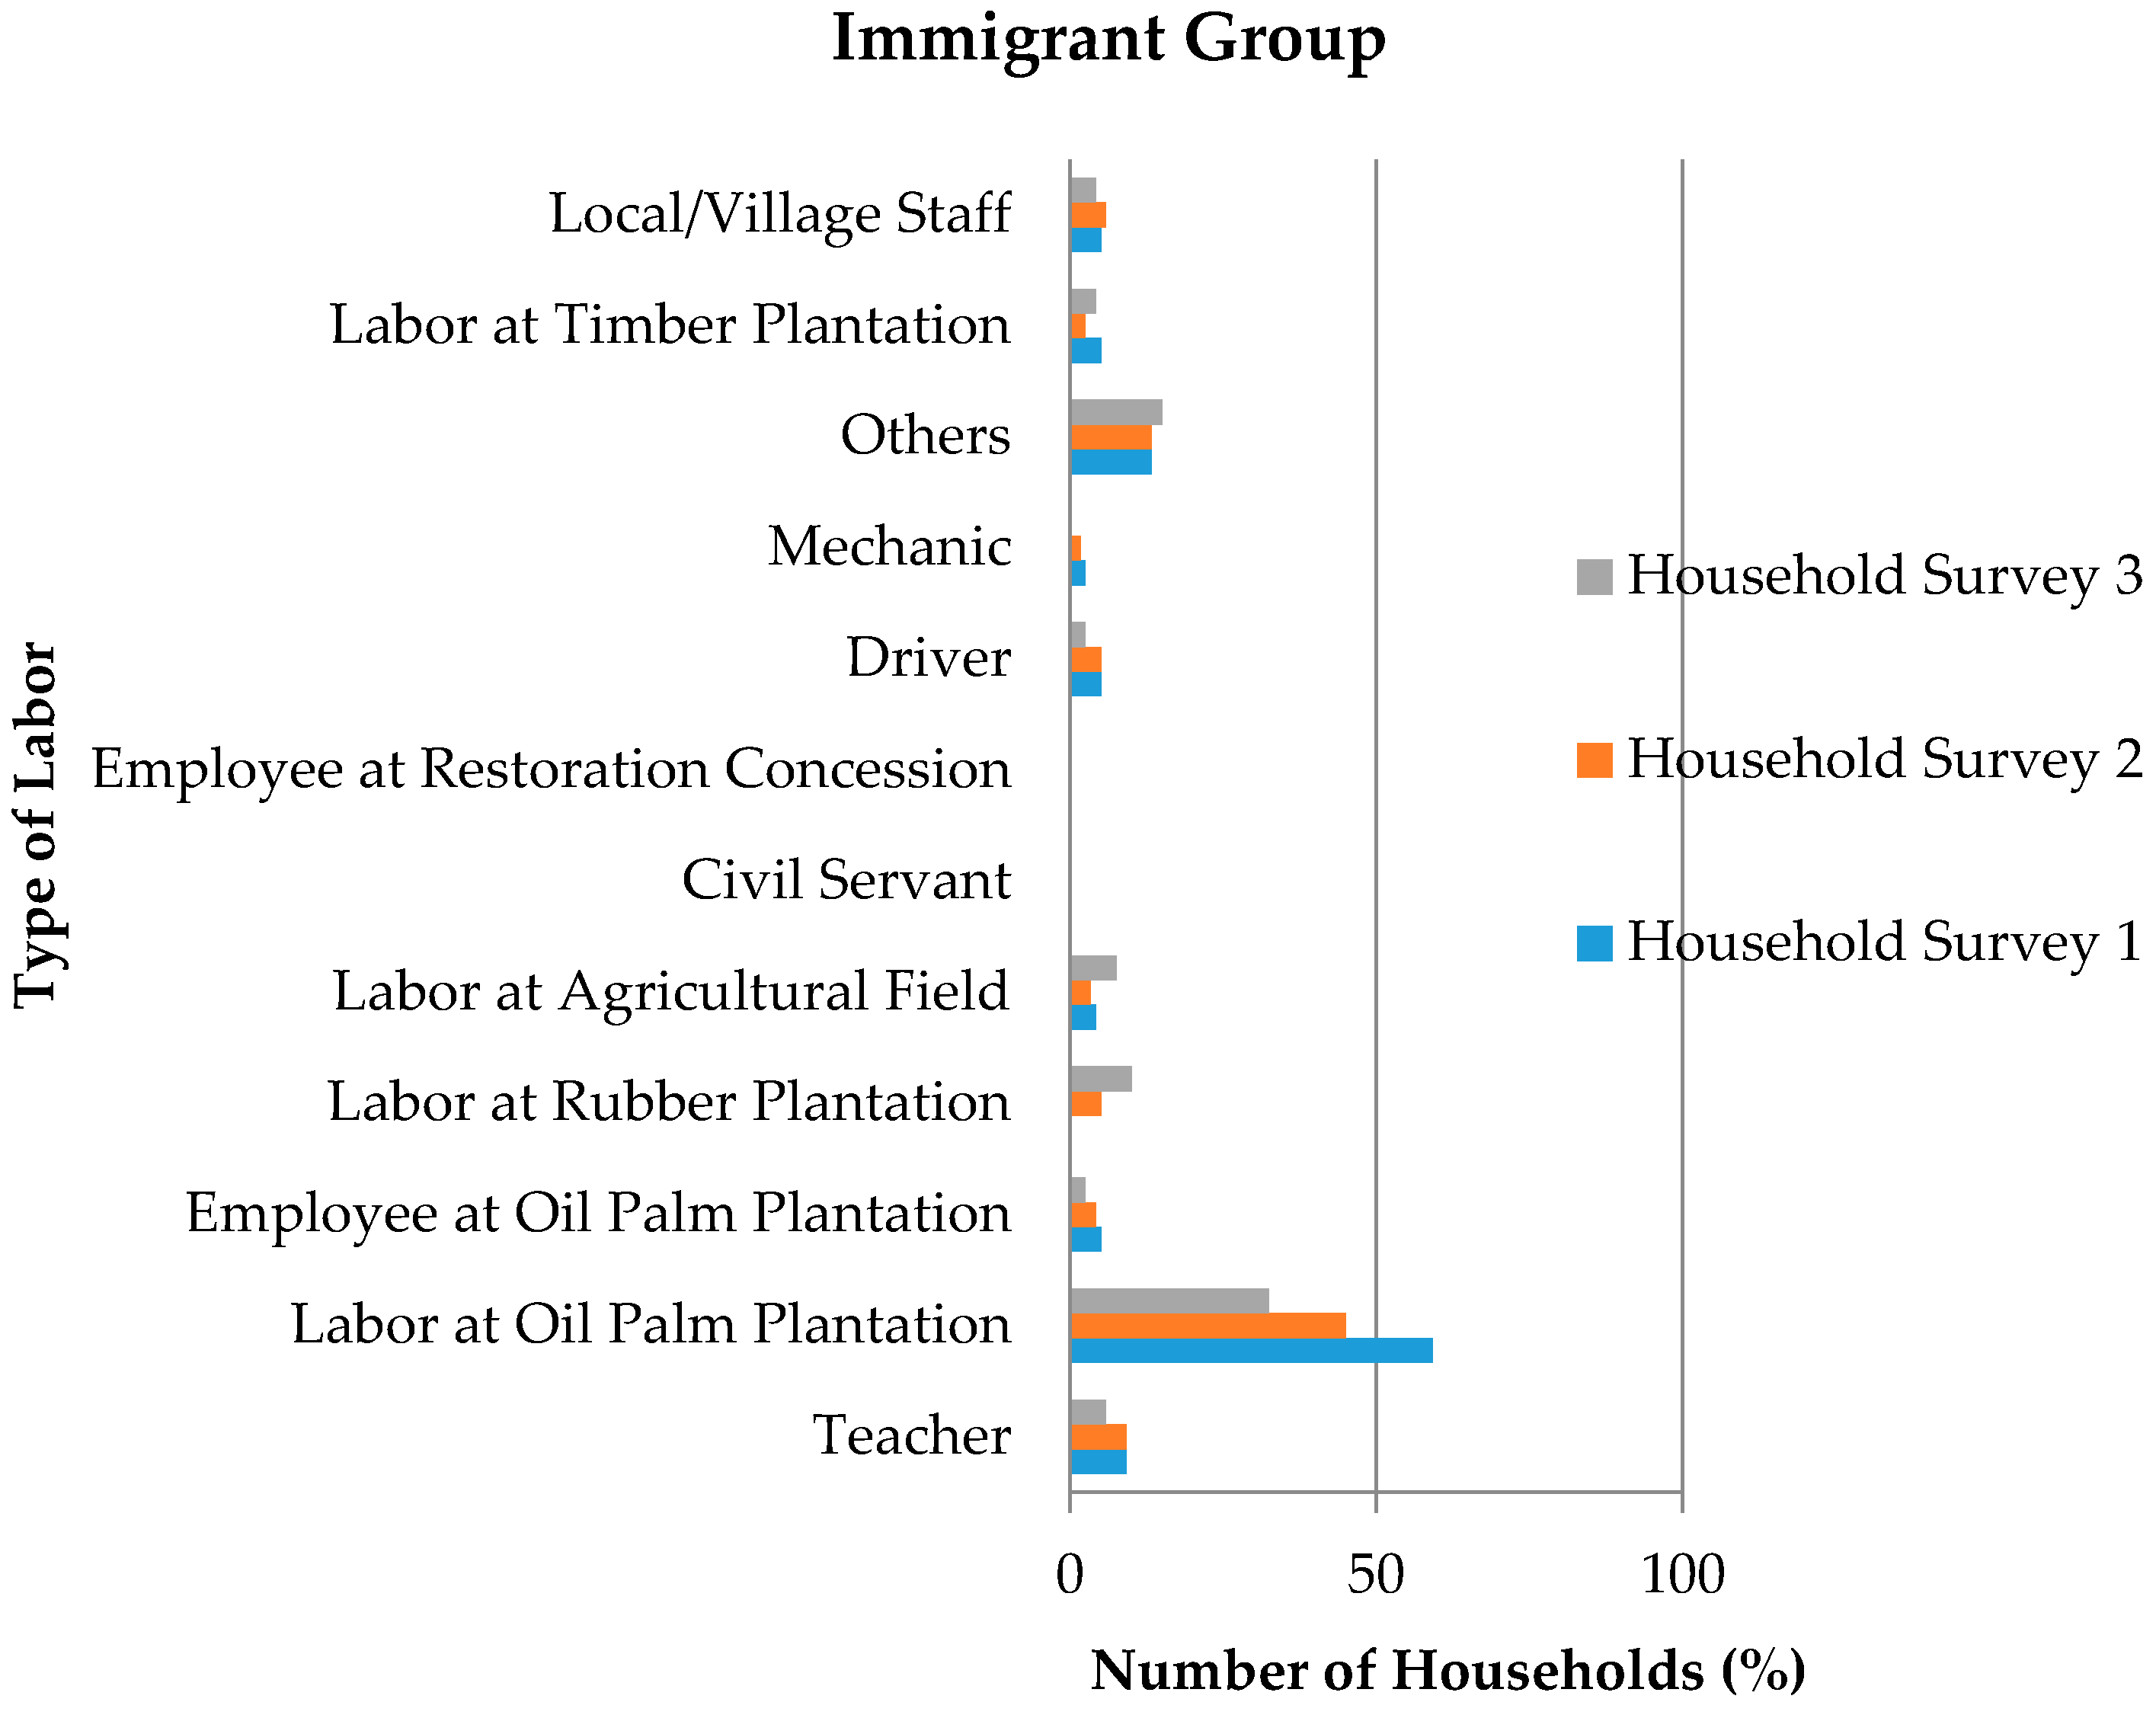
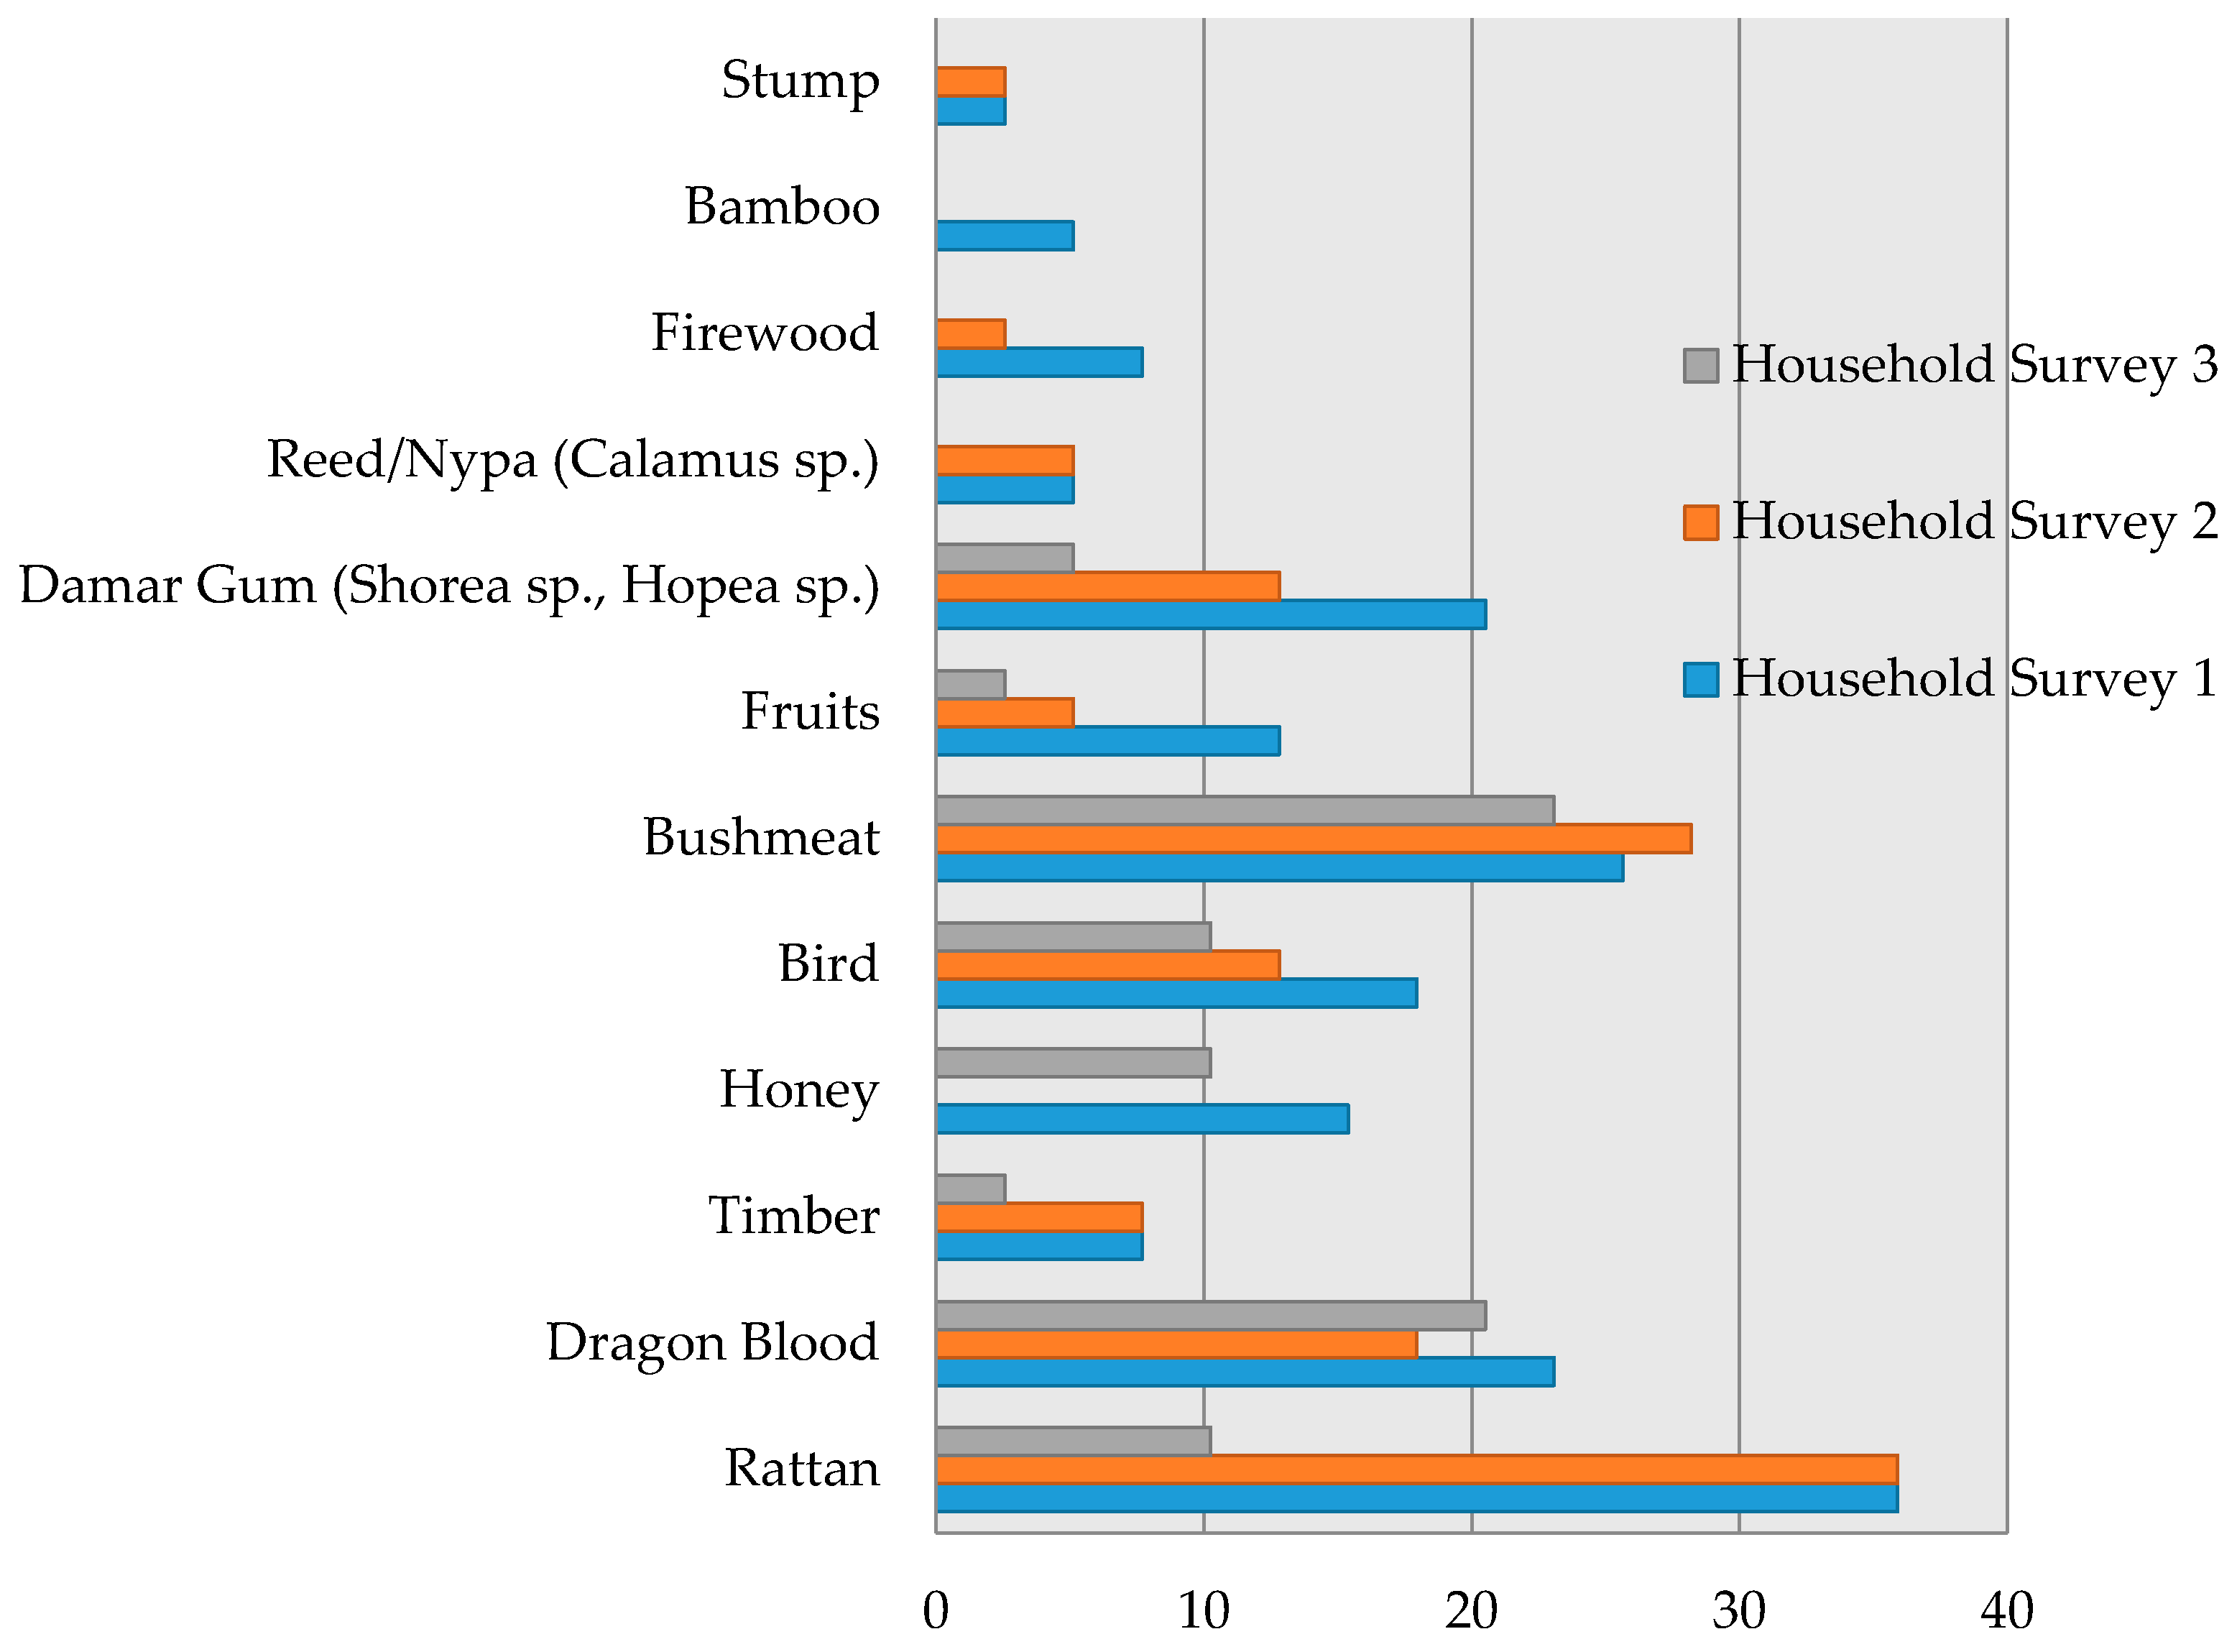
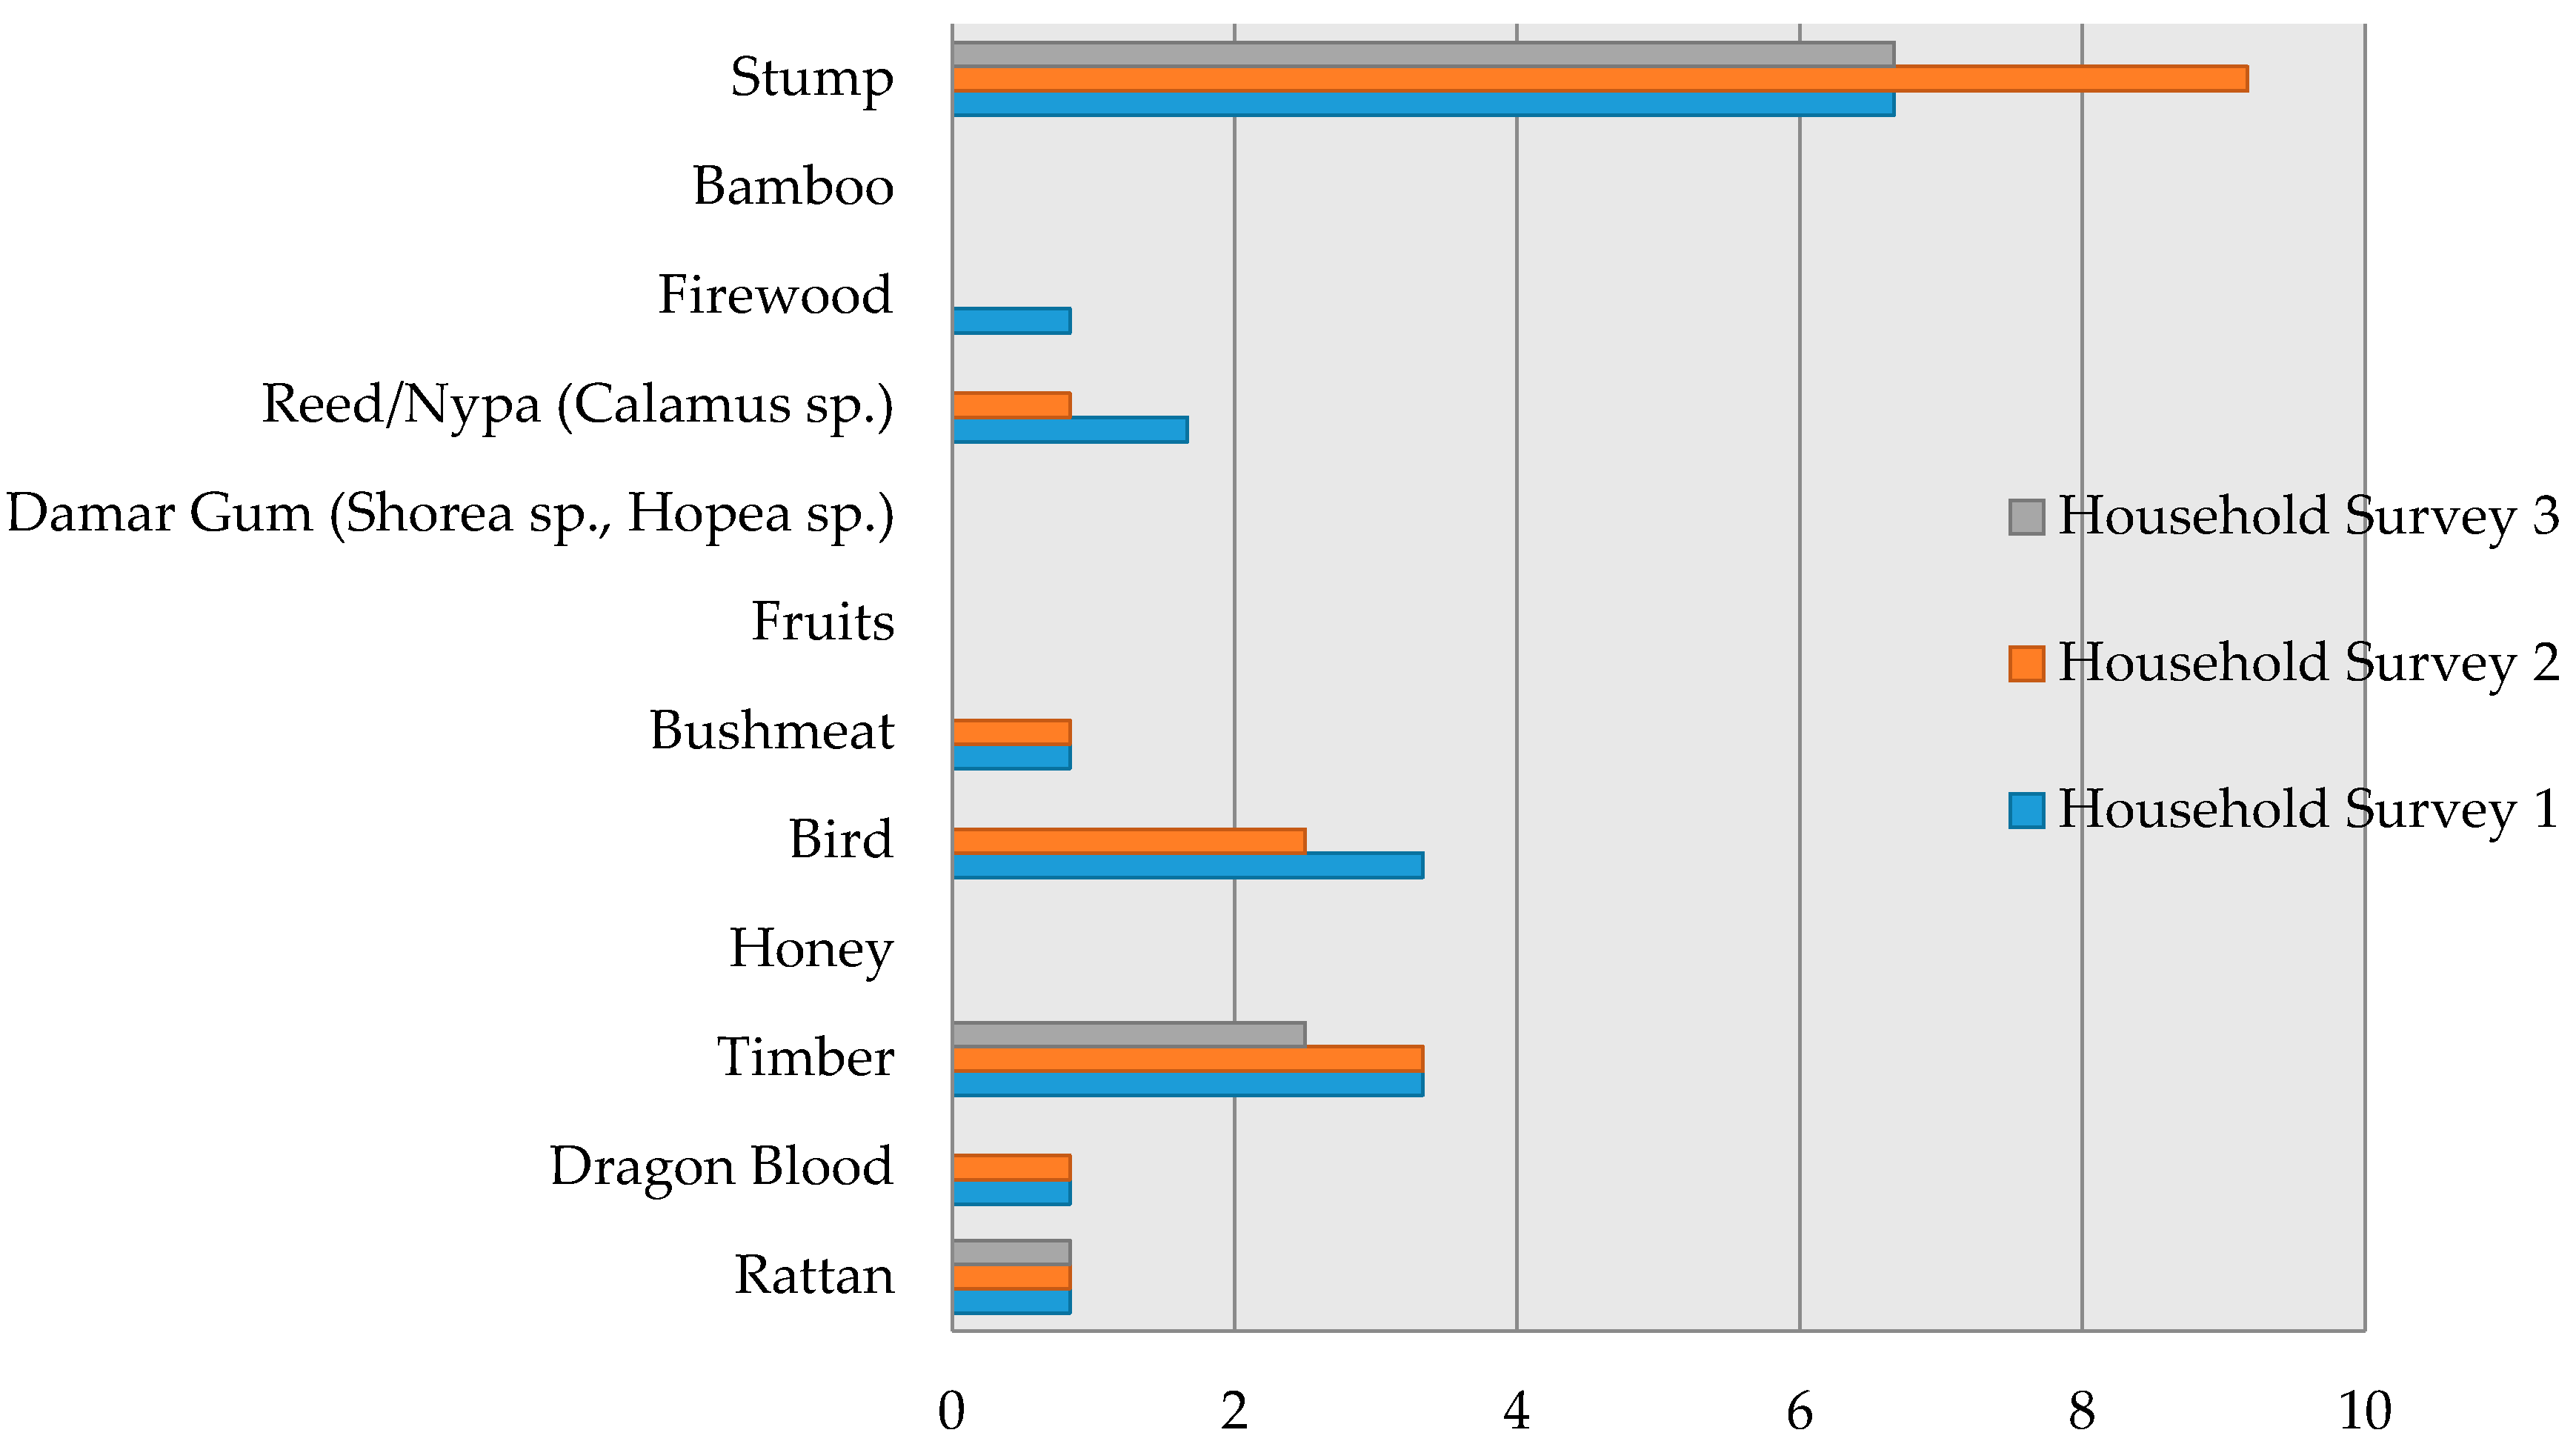
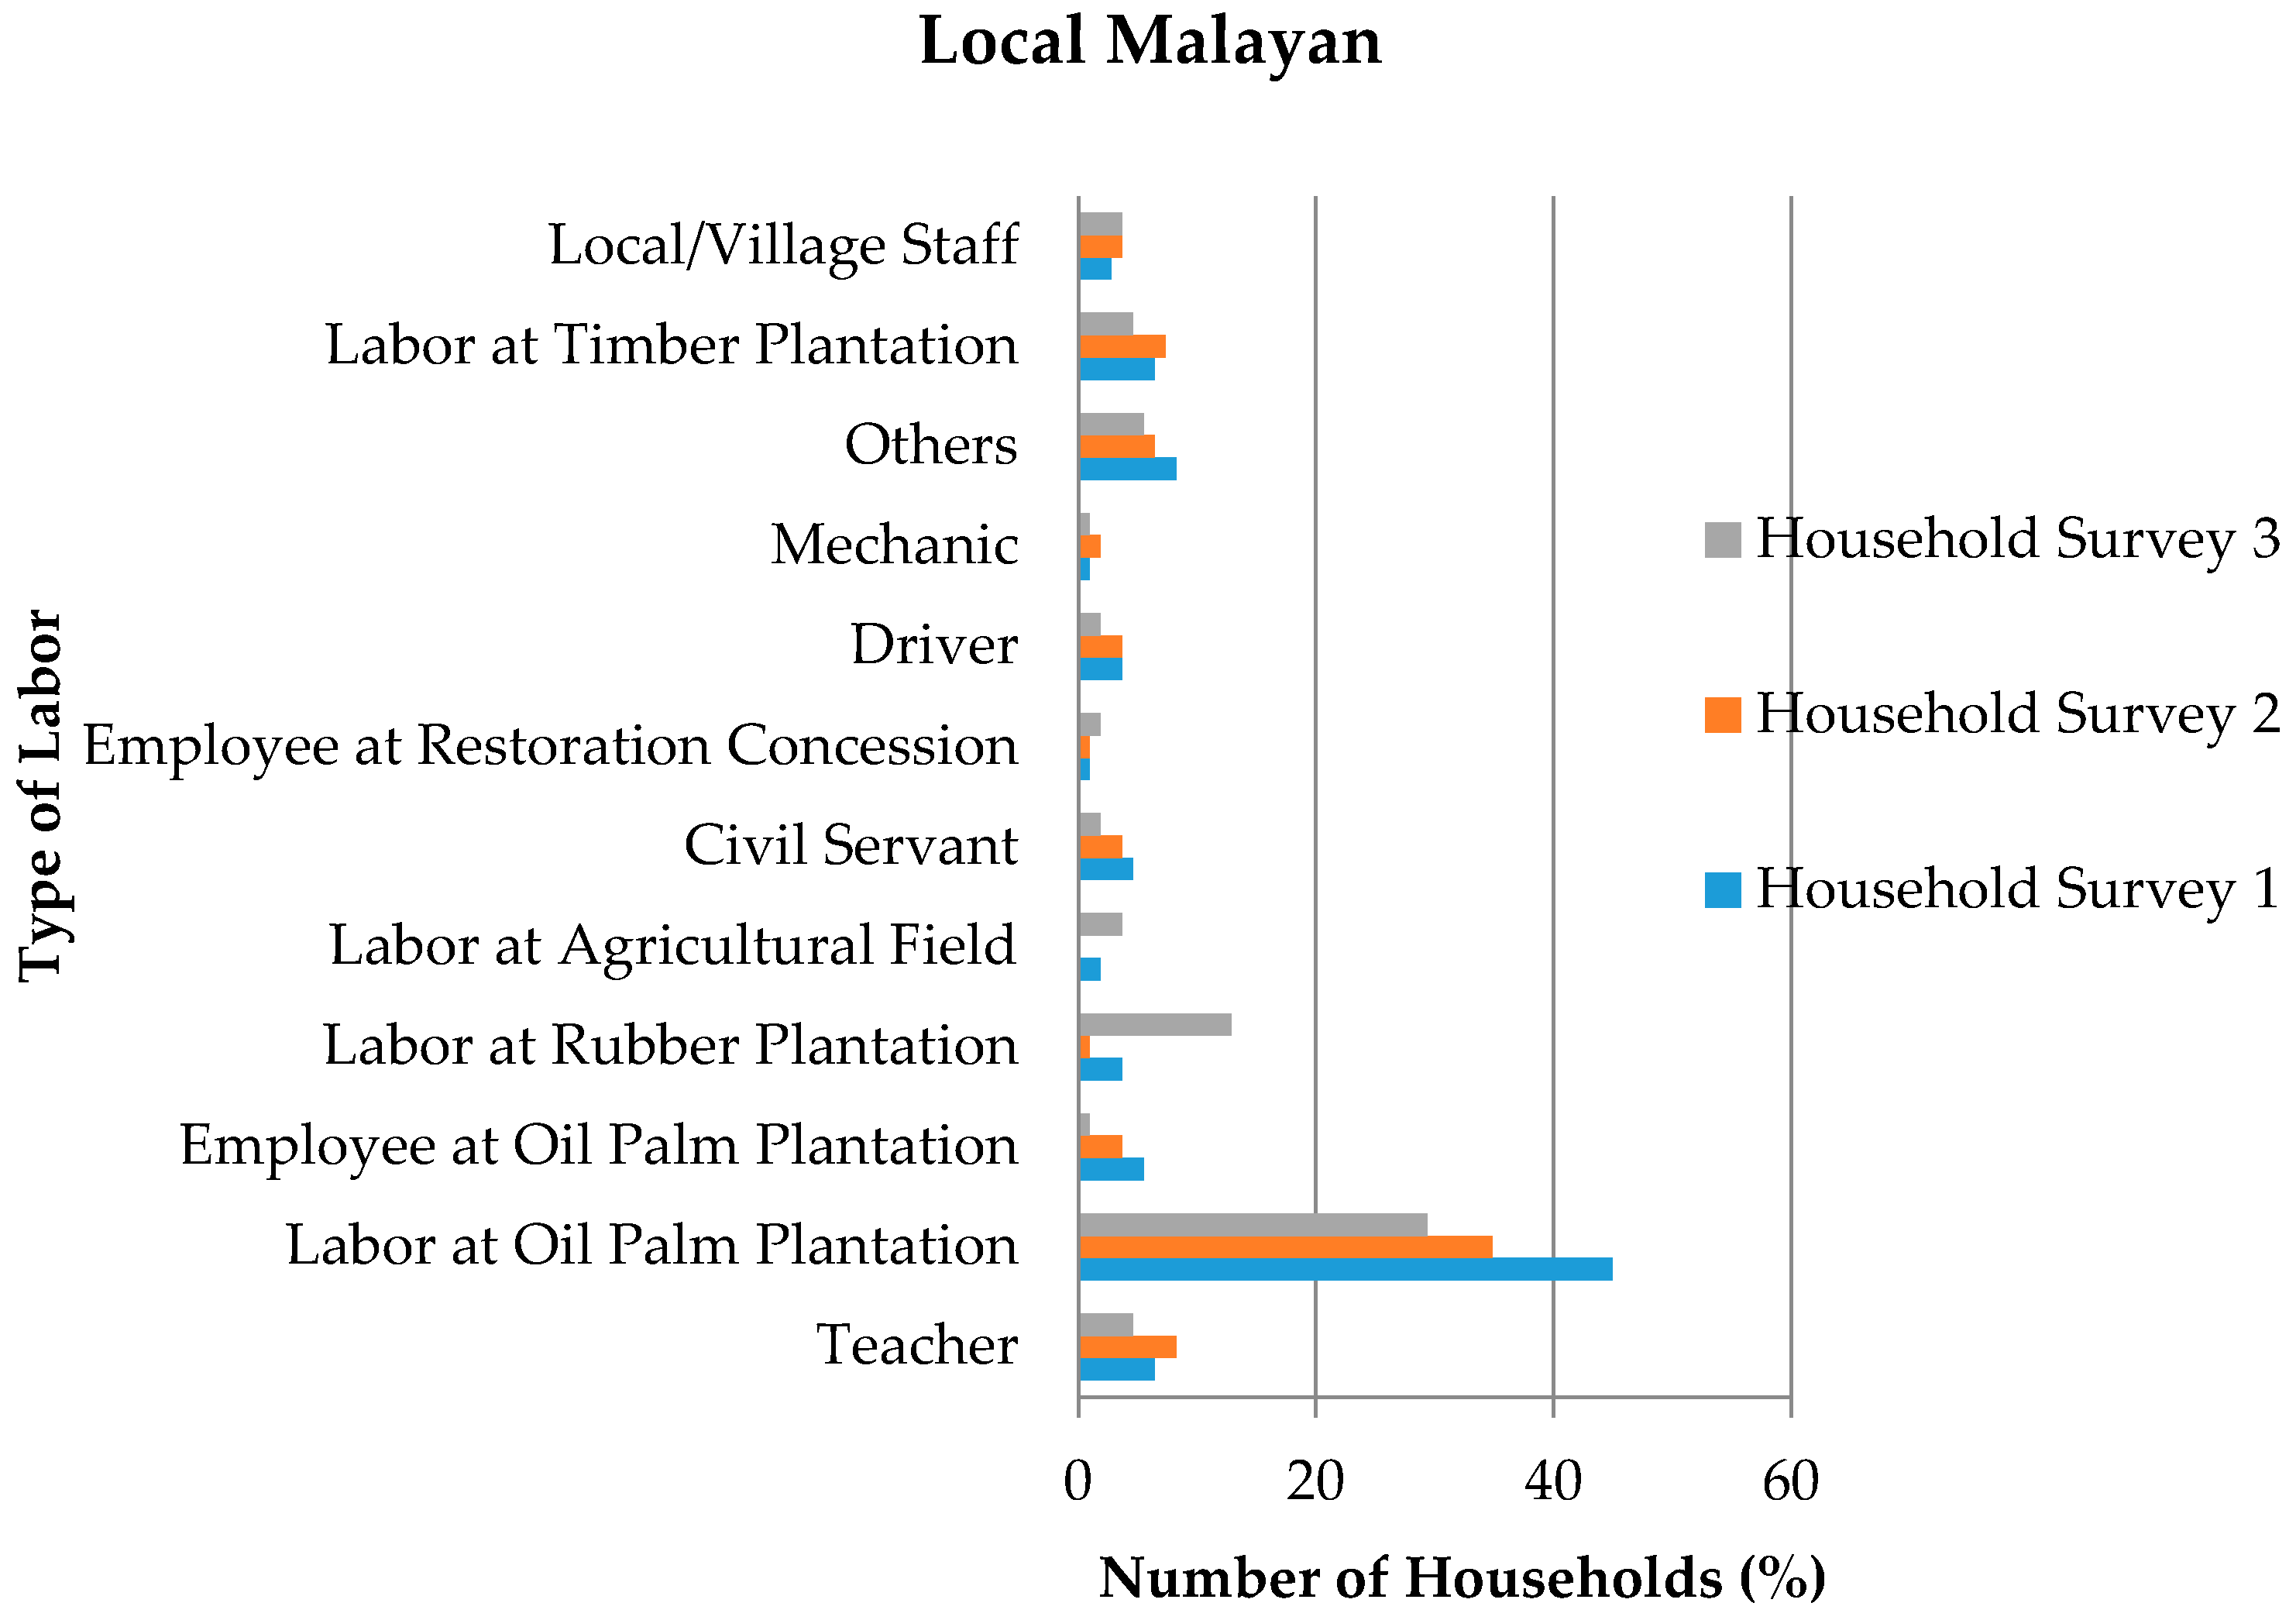
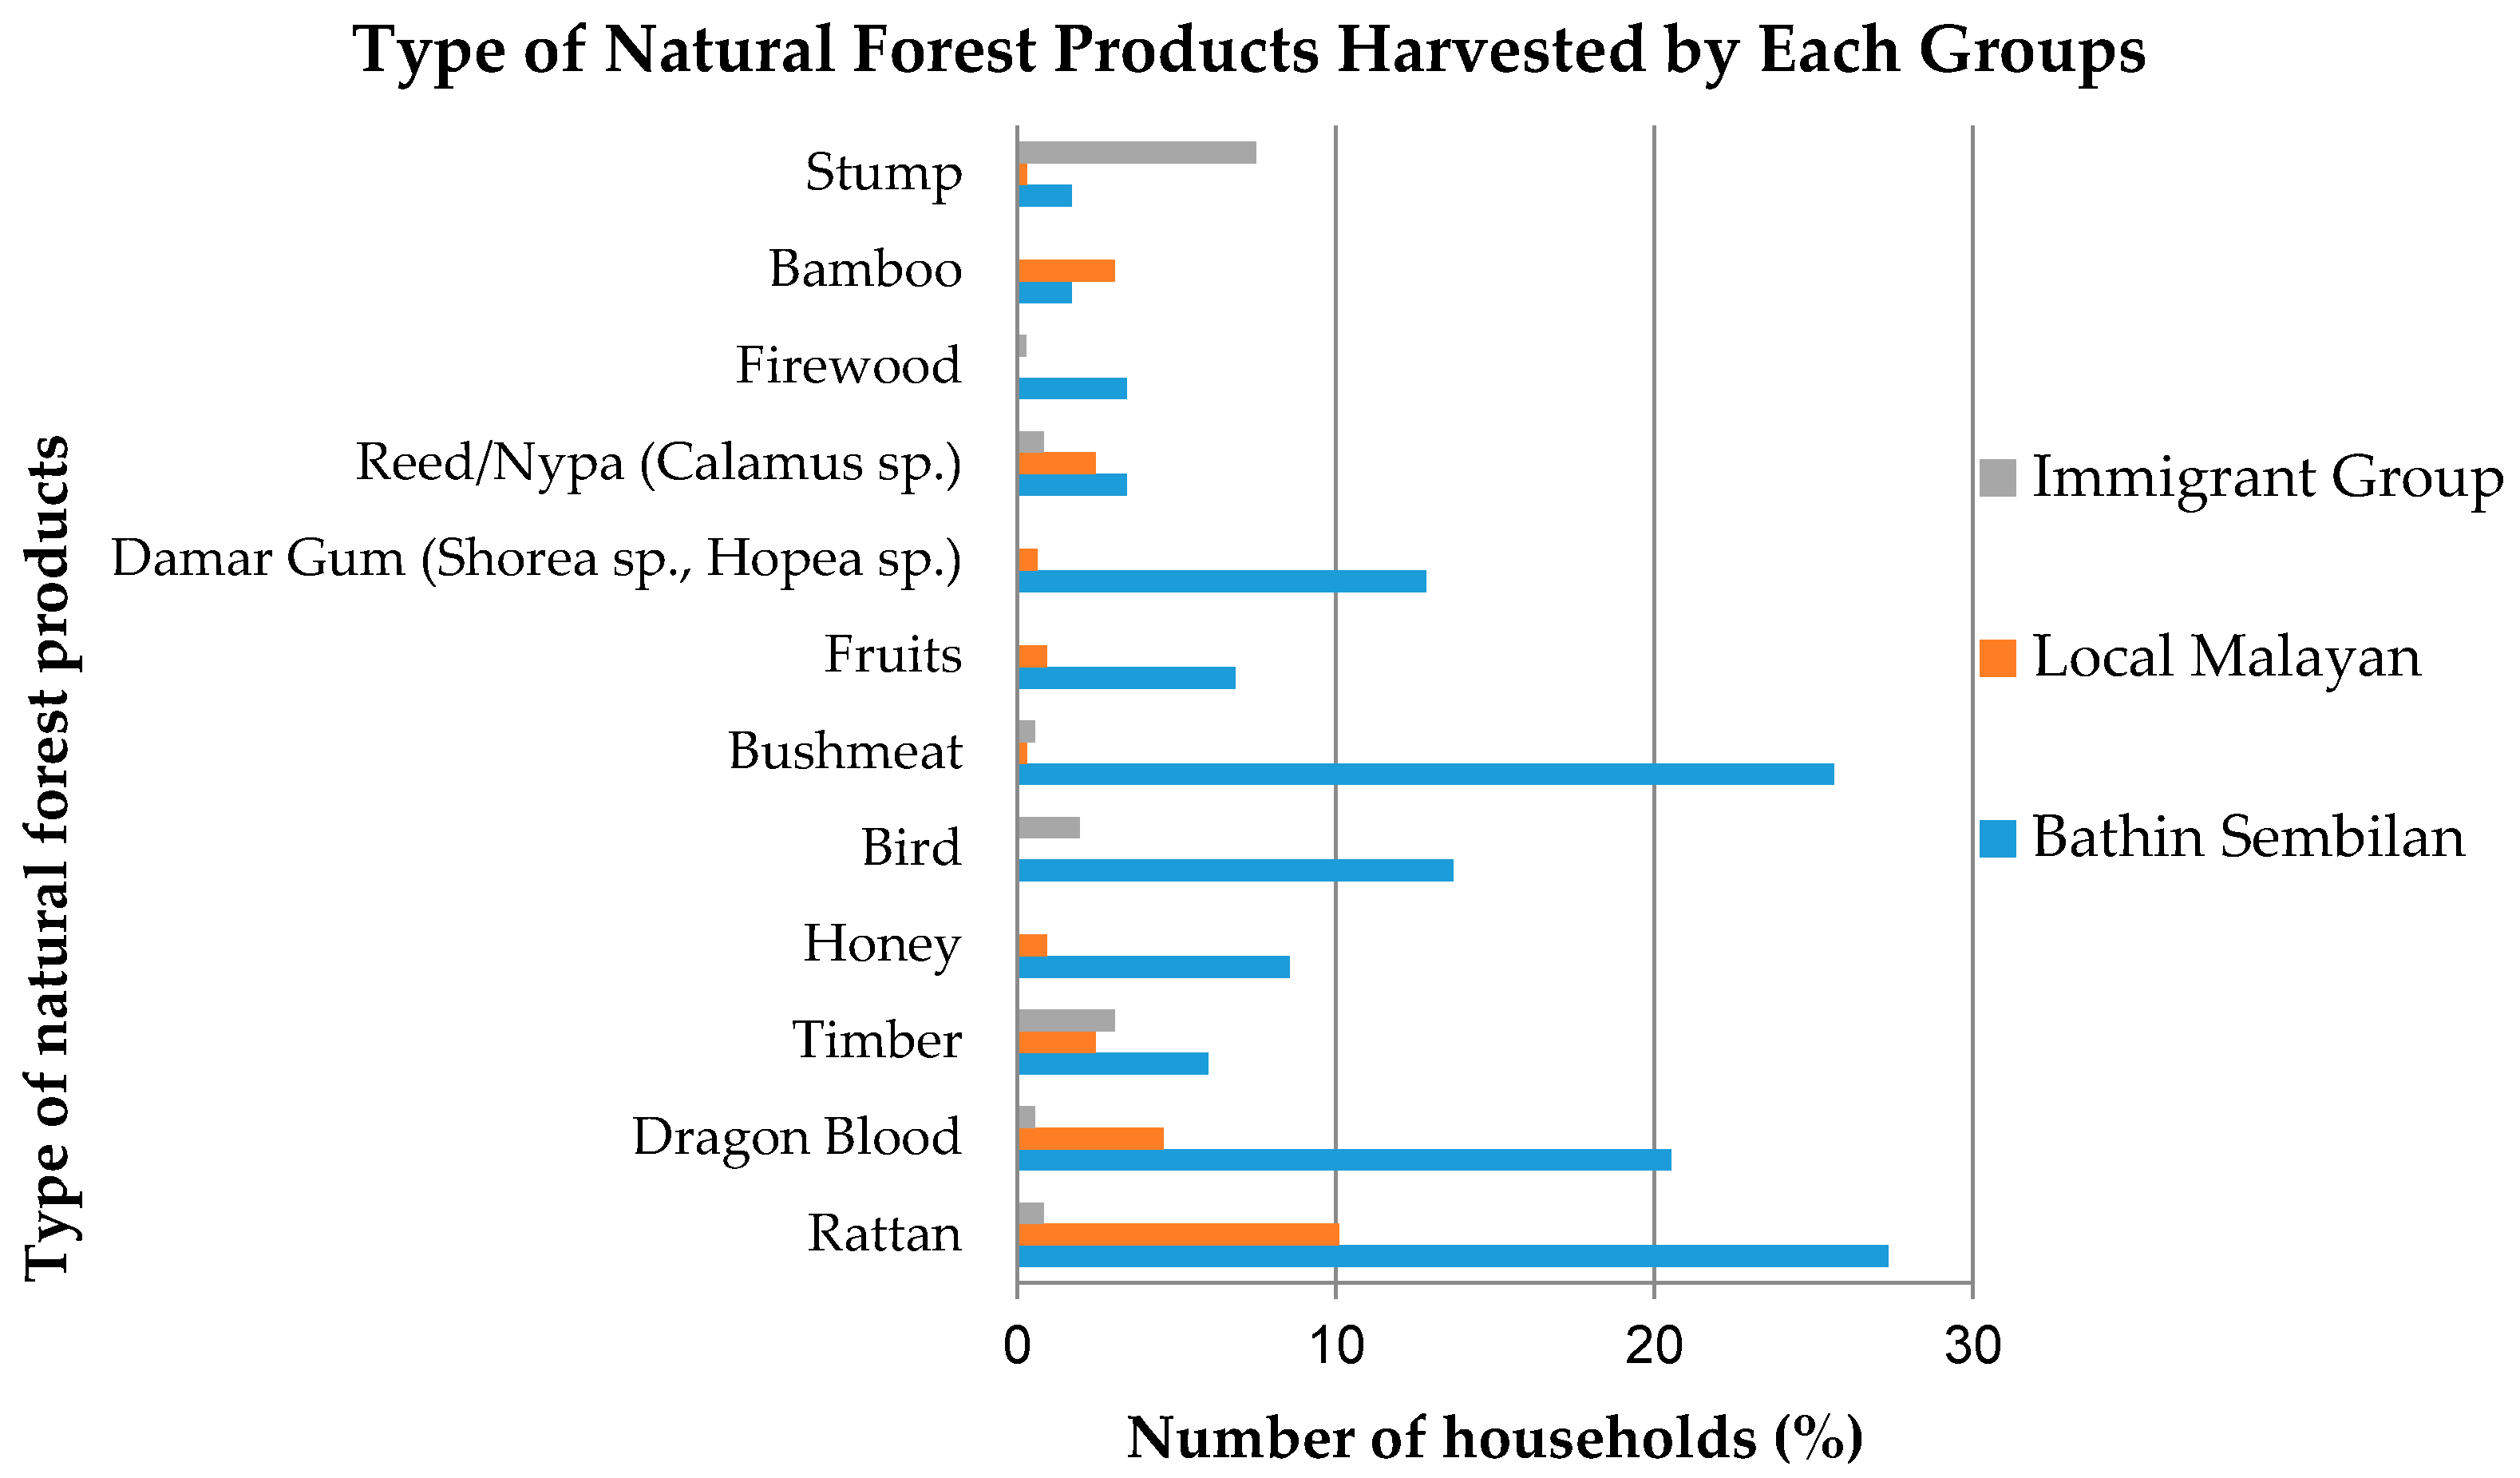
4.3. Types of Natural Forest Products Harvested by the Groups
4.4. Gap-Filling Function between Different Income Sources
5. Discussion
5.1. Dependence on Forest Income
5.2. Gap-Filling Function
5.3. Influence of Ethnicity on Natural Forest Income
6. Conclusions
Acknowledgments
Author Contributions
Conflicts of Interest
Appendix A

| No. | Type of Income Sources | Batin Sembilan | Local Malayan | Immigrant Group | |||||||||
|---|---|---|---|---|---|---|---|---|---|---|---|---|---|
| Mean | SD | Min | Max | Mean | SD | Min | Max | Mean | SD | Min | Max | ||
| A | Natural Forest Source | 293.1 | 286.9 | 0 | 955.3 | 91.3 | 217.1 | 0 | 1752.1 | 78.4 | 202.2 | 0 | 1066.0 |
| 1 | Direct Forest Product | 238.3 | 270.6 | 0 | 955.3 | 42.3 | 106.5 | 0 | 541.0 | 28.2 | 123.8 | 0 | 968.5 |
| 2 | Forest-derived Product | 36.2 | 95.6 | 0 | 393.7 | 23.6 | 81.2 | 0 | 439.4 | 38.5 | 134.4 | 0 | 812.4 |
| 3 | Forest Wage | 18.6 | 81.2 | 0 | 388.0 | 6.3 | 37.2 | 0 | 320.3 | 0 | 0 | 0 | 0 |
| 4 | Forest Business | 0 | 0 | 0 | 0 | 19.3 | 170.8 | 0 | 1752.1 | 11.6 | 64.8 | 0 | 523.4 |
| B | Non-Natural Forest Source | 532.9 | 381.4 | 11.7 | 1535.8 | 1006.3 | 825.7 | 0 | 6875.0 | 1278.8 | 1187.0 | 0 | 8390.8 |
| 1 | Planted Forest (Rubber) | 99.7 | 169.5 | 0 | 565.9 | 298.1 | 385.6 | 0 | 2135.2 | 88.5 | 239.5 | 0 | 1336.1 |
| 2 | Plantation Wage | 37.2 | 90.6 | 0 | 404.5 | 52.4 | 157.0 | 0 | 1259.3 | 43.8 | 131.4 | 0 | 980.6 |
| 3 | Agriculture | 24.9 | 81.2 | 0 | 366.1 | 221.4 | 221.4 | −65.8 | 3114.9 | 366.3 | 520.8 | −7.8 | 2920.2 |
| 4 | Non-Forest Wage | 273.9 | 330.7 | 0 | 1191.5 | 268.8 | 339.5 | 0 | 1894.5 | 386.5 | 363.9 | 0 | 1752.1 |
| 5 | Non-Forest Business | 22.7 | 83.5 | 0 | 486.7 | 119.6 | 703.4 | 0 | 6875.0 | 322.7 | 860.5 | 0 | 5470.6 |
| 6 | Non-Forest Environmental | 29.9 | 34.3 | 0 | 151.9 | 11.5 | 30.1 | 0 | 244.6 | 5.7 | 41.7 | 0 | 449.6 |
| 7 | Livestock | 0 | 0 | 0 | 0 | 26.7 | 100.3 | 0 | 769.7 | 35.1 | 143.5 | 0 | 1341.0 |
| 8 | Others | 44.6 | 167.7 | 0 | 1039.6 | 7.8 | 24.7 | 0 | 192.8 | 30.4 | 155.1 | 0 | 1485.1 |
| Socio-Economic Variables | Batin Sembilan | Local Malayan | Immigrant Group | |||||||||
|---|---|---|---|---|---|---|---|---|---|---|---|---|
| Mean | SD | Min | Max | Mean | SD | Min | Max | Mean | SD | Min | Max | |
| Age of household head | 43.9 | 13.1 | 20 | 76 | 45.1 | 13.2 | 22 | 92 | 43.9 | 11.3 | 22 | 85 |
| Family size | 5.2 | 2.3 | 2 | 11 | 4.7 | 1.8 | 1 | 10 | 3.8 | 1.1 | 1 | 6 |
| Education (year of schooling) of household head | 1.2 | 2.7 | 0 | 12 | 7.3 | 3.3 | 0 | 16 | 7.8 | 3.2 | 0 | 16 |
| Land area owned (ha/aeu) | 0.8 | 1.3 | 5 × 10⁻⁴ | 6.3 | 1.4 | 2.6 | 5 × 10⁻⁴ | 20.9 | 0.9 | 1.0 | 9 × 10⁻⁴ | 5 |
| Total household asset (USD/aeu) | 287.6 | 164.3 | 55.6 | 641.2 | 795.9 | 835.3 | 1 | 3966.2 | 938.4 | 1235.7 | 7.3 | 8753.4 |
| Total value of household implement (USD/aeu) | 283.8 | 162.1 | 55.6 | 641.2 | 757.2 | 805.0 | 0 | 3960.9 | 887.1 | 1189.6 | 6.9 | 8738.8 |
| Total value of livestock (USD/aeu) | 3.7 | 6.6 | 0 | 34.8 | 38.8 | 178.0 | 0 | 1751.7 | 51.3 | 182.6 | 0 | 1746.1 |
| Total annual income (USD/aeu) | 826.0 | 364.9 | 238.3 | 1535.8 | 1097.6 | 855.8 | 74.4 | 6875.0 | 1357.2 | 1168.7 | 126.2 | 8390.8 |
| Total forest income (USD/aeu) | 293.1 | 286.9 | 0 | 955.3 | 91.3 | 217.1 | 0 | 1752.1 | 78.4 | 202.2 | 0 | 1066.0 |
| Total non-forest income (USD/aeu) | 532.9 | 381.4 | 11.7 | 1532.8 | 1006.3 | 825.7 | 0 | 6875.0 | 1278.8 | 1187.0 | 0 | 8390.8 |
Appendix B


References
- Vedeld, P.; Angelsen, A.; Sjaastad, E.; Berg, G.B. Counting on the Environment: Forest Income and the Rural Poor, in Environmental Economics; The World Bank Environment Department: Washington, DC, USA, 2004; p. 114. [Google Scholar]
- Angelsen, A.; Jagger, P.; Babigumira, R.; Belcher, B.; Hogarth, N.J.; Bauch, S.; Börner, J.; Smith-Hall, C.; Wunder, S. Environmental Income and Rural Livelihoods: A Global-Comparative Analysis. World Dev. 2014, 64, S12–S28. [Google Scholar] [CrossRef]
- Angelsen, A.; Wunder, S. Exploring the Forest--Poverty Link: Key Concepts, Issues and Research Implications; CIFOR: Bogor, Indonesia, 2003. [Google Scholar]
- Fisher, M. Household welfare and forest dependence in Southern Malawi. Environ. Dev. Econ. 2004, 9, 135–154. [Google Scholar] [CrossRef]
- Cavendish, W. Quantitative methods for estimating the economic value of resource use to rural households. In Uncovering the Hidden Harvest: Valuation Methods for Woodland and Forest Resources; Campbell, B., Luckert, K.M., Eds.; Earthscan: London, UK, 2002; pp. 17–65. [Google Scholar]
- Shackleton, C.; Shackleton, S. The importance of non-timber forest products in rural livelihood security and as safety nets: A review of evidence from South Africa. S. Afr. J. Sci. 2004, 100, 658–664. [Google Scholar]
- Belcher, B. Forest product markets, forests and poverty reduction. Int. For. Rev. 2005, 7, 82–89. [Google Scholar] [CrossRef]
- Fisher, M.; Shively, G. Can Income Programs Reduce Tropical Forest Pressure? Income Shocks and Forest Use in Malawi. World Dev. 2005, 33, 1115–1128. [Google Scholar]
- McSweeney, K. Natural insurance, forest access, and compounded misfortune: Forest resources in smallholder coping strategies before and after Hurricane Mitch, northeastern Honduras. World Dev. 2005, 33, 1453–1471. [Google Scholar] [CrossRef]
- Paumgarten, F. The Role of non-timber forest products as safety-nets: A review of evidence with a focus on South Africa. GeoJournal 2005, 64, 189–197. [Google Scholar] [CrossRef]
- Vedeld, P.; Angelsen, A.; Bojo, J.; Sjaastad, E.; Berg, G.K. Forest environmental incomes and the rural poor. For. Policy Econ. 2007, 9, 869–879. [Google Scholar] [CrossRef]
- Sunderlin, W.D.; Dewi, S.; Puntodewo, A.; Mueller, D.; Angelsen, A.; Epprecht, M. Why Forests Are Important for Global Poverty Alleviation: A Spatial Explanation. Ecol. Soc. 2008, 13, 1–21. [Google Scholar]
- Aronson, J.; Blignaut, J.N.; Milton, S.J.; Maitre, D.L.; Esler, K.J.; Limouzin, A.; Fontaine, C.; de Wit, M.P.; Mugido, W.; Prinsloo, P.; et al. Are Socioeconomic Benefits of Restoration Adequately Quantified? A Meta-analysis of Recent Papers (2000–2008) in Restoration Ecology and 12 Other Scientific Journals. Restor. Ecol. 2010, 18, 143–154. [Google Scholar]
- Kaimowitz, D. The prospects for Reduced Emissions from Deforestation and Degradation (REDD) in Mesoamerica. Int. For. Rev. 2008, 10, 485–495. [Google Scholar] [CrossRef]
- Gueze, M.; Reviriego, I.D.; Duda, R.; Fernandez-Llamazares, A.; Gallois, S.; Napitupulu, L.; Perez, P.; Pyhala, A.; Reyes-Garcia, V. Abiocultural Approach to Conservation: What Can Conservationists Learn from Forest Use by Contemporary Indigenous Peoples? LEK Project: Boston, MA, USA, 2015. [Google Scholar]
- Mainusch, J. Attitudes to forestry and conservation in indonesia. In Forests and Society–Responding to Global Drivers of Change; IUFRO: Vienna, Austria, 2010. [Google Scholar]
- Belcher, B.; Imang, N.; Achdiawan, R. Rattan, rubber, or oil palm: Cultural and financial considerations for farmers in Kalimantan. Econ. Bot. 2004, 58, S77–S87. [Google Scholar] [CrossRef]
- Pfund, J.-L.; Watts, J.D.; Boissière, M.; Boucard, A.; Bullock, R.M.; Ekadinata, A.; Dewi, S.; Feintrenie, L.; Levang, P.; Rantala, S.; et al. Understanding and Integrating Local Perceptions of Trees and Forests into Incentives for Sustainable Landscape Management. Environ. Manag. 2011, 48, 334–349. [Google Scholar] [CrossRef] [PubMed]
- Manik, Y.; Leahy, J.; Halog, A. Social life cycle assessment of palm oil biodiesel: A case study in Jambi Province of Indonesia. Int. J. Life Cycle Assess. 2013, 18, 1386–1392. [Google Scholar] [CrossRef]
- Steinebach, S. Der Regenwald ist enser Haus: Die Orang Rimba auf Sumatra zwischen Autonomie und Fremdbestimmung; Universitätsverlag Göttingen: Göttingen, Germany, 2012; Volume 6. [Google Scholar]
- Buckley, M.C.; Crone, E.E. Negative off-Site Impacts of Ecological Restoration: Understanding and Addressing the Conflict. Conserv. Biol. 2008, 22, 1118–1124. [Google Scholar] [CrossRef] [PubMed]
- Mohammad Abdullah, A.N.; Stacey, N.; Garnett, S.T.; Myers, B. Economic dependence on mangrove forest resources for livelihoods in the Sundarbans, Bangladesh. For. Policy Econ. 2016, 64, 15–24. [Google Scholar] [CrossRef]
- CESS-ODI. Links between forest and poverty in Indonesia. What evidence? How can targeting of poverty in and near forests be improved? In Briefing Paper II; CESS-ODI: London, UK, 2005. [Google Scholar]
- Hansen, M.C.; Potapov, P.V.; Moore, R.; Hancher, M.; Turubanova, S.A.; Tyukavina, A.; Thau, D.; Stehman, S.V.; Goetz, S.J.; Loveland, T.R.; et al. High-Resolution Global Maps of 21st-Century Forest Cover Change. Science 2013, 342, 850–853. [Google Scholar] [CrossRef] [PubMed]
- Margono, B.A.; Turubanova, S.; Zhuravleva, I.; Potapov, P.; Tyukavina, A.; Baccini, A.; Goetz, C.; Hansen, M.C. Mapping and monitoring deforestation and forest degradation in Sumatra (Indonesia) using Landsat time series data sets from 1990 to 2010. Environ. Res. Lett. 2012, 7, 034010. [Google Scholar] [CrossRef]
- Holmes, D. Deforestation in Indonesia: A Review of the Situation in Sumatra, Kalimantan and Sulawesi; The World Bank: Jakarta, Indonesia, 2000. [Google Scholar]
- Holmes, D. Where Have All the Forests Gone? Environment and Social Development East Asia and Pacific Region Discussion Paper; The World Bank: Jakarta, Indonesia, 2000. [Google Scholar]
- Nawir, A.A.; Murniati; Rumboko, L. Forest Rehabilitation in Indonesia: Where to After More than Three Decades? CIFOR: Bogor, Indonesia, 2007. [Google Scholar]
- Uryu, Y.; Mott, C.; Foead, N.; Yulianto, K.; Budiman, A.; Takakai, F.; Purastuti, E.; Fadhli, N.; Hanato, R.; Siegert, F.; et al. Deforestation, Forest Degradation, Biodiversity Loss and CO2 Emissions in Riau, Sumatra, Indonesia; World Wildlife Fund: Washington, DC, USA, 2008. [Google Scholar]
- Hansen, M.C.; Stehman, S.V.; Potapov, P.V.; Loveland, T.R.; Townshend, J.R.G.; DeFries, R.S.; Pittman, K.W.; Arunarwati, B.; Stolle, F.; Steininger, M.K.; et al. Humid tropical forest clearing from 2000 to 2005 quantified by using multitemporal and multiresolution remotely sensed data. Proc. Natl. Acad. Sci. USA 2008. [Google Scholar] [CrossRef] [PubMed]
- Hauser-Schaeublin, B. Adat and Indigeneity in Indonesia: Culture and Entitlements between Heteronomy and Self-Ascription. Vol. 7.; Universitaetsverlag Goettingen, Goettingen Studies in Cultural Property: Göttingen, Germany, 2013. [Google Scholar]
- Forbes, H.O. On the Kubus of Sumatra. J. Anthropol. Inst. Great Br. Irel. 1885, 14, 121–127. [Google Scholar] [CrossRef]
- Faust, H.; Jonas, H. Conservation, REDD+ and the struggle for land in Jambi, Indonesia. Pac. Geogr. 2014, 41, 20–25. [Google Scholar]
- Gouyon, A.; de Foresta, H.; Levang, P. Does ‘jungle rubber’ deserve its name? An analysis of rubber agroforestry systems in southeast Sumatra. Agrofor. Syst. 1993, 22, 181–206. [Google Scholar] [CrossRef]
- Colchester, M.; Anderson, P.; Firdaus, A.Y.; Hasibuan, F.; Chao, S. Human Rights Abuses and Land Conflicts in the PT Asiatic Persada Concession in Jambi. Report of an Independent Investigation into Land Disputes and Forced Evictions in a Palm Oil Estate; Forest Peoples Programme, SawitWatch, HuMa: Bogor, Indonesia, 2011. [Google Scholar]
- Jiwan, N. The political ecology of the Indonesian palm oil industry. In The Palm Oil Controversy in Southeast Asia. A Transnational Perspective; Bhattacharya, O.P.J., Ed.; Institute of Southeast Asian Studies: Singapore, 2013; pp. 48–75. [Google Scholar]
- Klasen, S.; Meyer, K.M.; Dislich, C.; Euler, M.; Faust, H.; Gatto, M.; Hettig, E.; Melati, D.N.; Jaya, I.N.S.; Otten, F.; et al. Economic and ecological trade-offs of agricultural specialization at different spatial scales. Ecol. Econ. 2016, 122, 111–120. [Google Scholar] [CrossRef]
- CIFOR. Poverty Environmental Network (PEN) Technical Guidelines. 2007. Version 4. Available online: http://www1.cifor.org/pen/research-tools/the-pen-technical-guidelines.html (assecced on 3 January 2014).
- Angelsen, A.; Larsen, H.O.; Lund, J.F.; Smith-Hall, C.; Wunder, S. Measuring Livelihoods and Environmental Dependence: Methods for Research and Fieldwork; Center for International Forestry Research (CIFOR): Bogor, Indonesia, 2011. [Google Scholar]
- FAO. FRA 2015: Terms and Definitions; FAO: Rome, Italy, 2015. [Google Scholar]
- OECD. The OECD List of Social Indicators; OECD: Paris, France, 1982. [Google Scholar]
- Fahruk, E.; Kuncoro, I. Analisis Potensi dan Manfaat Kawasan Hutan Wisata Gunung Kelam Ditinjau dari Kontribusinya terhadap PEndapatan Masyarakat Desa Sekitarnya. Equator 2002, 1, 1–34. [Google Scholar]
- Porro, R.; Lopez-Feldman, A.; Vela-Alvarado, J.W. Forest use and agriculture in Ucayali, Peru: Livelihood strategies, poverty and wealth in an Amazon frontier. For. Policy Econ. 2015, 51, 47–56. [Google Scholar] [CrossRef]
- Mamo, G.; Sjaastad, E.; Vedeld, P. Economic dependence on forest resources: A case from Dendi District, Ethiopia. For. Policy Econ. 2007, 9, 916–927. [Google Scholar] [CrossRef]
- Kamanga, P.; Vedeld, P.; Sjaastad, E. Forest incomes and rural livelihoods in Chiradzulu District, Malawi. Ecol. Econ. 2009, 68, 613–624. [Google Scholar] [CrossRef]
- Illukpitiya, P.; Yanagida, J.F. Farming vs. forests: Trade-off between agriculture and the extraction of non-timber forest products. Ecol. Econ. 2010, 69, 1952–1963. [Google Scholar] [CrossRef]
- Langat, D.K.; Maranga, E.K.; Aboud, A.A.; Cheboiwo, J.K. Role of Forest Resources to Local Livelihoods: The Case of East Mau Forest Ecosystem, Kenya. Int. J. For. Res. 2016, 2016, 4537354. [Google Scholar] [CrossRef]
- Cavendish, W. Empirical Regularities in the Poverty-Environment Relationship of Rural Households: Evidence from Zimbabwe. World Dev. 2000, 28, 1979–2003. [Google Scholar] [CrossRef]
- Rata, E.; Openshaw, R. (Eds.) Public Policy and Ethnicity: The Politics of Ethnic Boundary Making; Palgrave Macmillan: Basingstoke, UK, 2006.
- Michaud, J.; Forsyth, T. (Eds.) Moving Mountains: Ethnicity and Livelihoods in Highland China, Vietnam and Laos; UBC Press: Vancouver, BC, Canada, 2011.
- Heubach, K.; Wittig, R.; Nuppenau, E.-A.; Hahn, K. The economic importance of non-timber forest products (NTFPs) for livelihood maintenance of rural west African communities: A case study from northern Benin. Ecol. Econ. 2011, 70, 1991–2001. [Google Scholar] [CrossRef]
- Illukpitiya, P.; Yanagida, J.F. Role of income diversification in protecting natural forests: Evidence from rural households in forest margins of Sri Lanka. Agrofor. Syst. 2008, 74, 51–62. [Google Scholar] [CrossRef]
- Yemiru, T.; Roos, A.; Campbell, B.M.; Bohlin, F. Forest incomes and poverty alleviation under participatory forest management in the Bale Highlands, Southern Ethiopia. Int. For. Rev. 2010, 12, 66–77. [Google Scholar] [CrossRef]
- Hogarth, N.J.; Belcher, B.; Campbell, B.; Stacey, N. The Role of Forest-Related Income in Household Economies and Rural Livelihoods in the Border-Region of Southern China. World Dev. 2013, 43, 111–123. [Google Scholar] [CrossRef]
- Melucci, A.; Keane, J.; Mier, P. (Eds.) Nomads of the Present: Social Movements and Individual Needs in Contemporary Society; Hutchinson Radius: London, UK, 1989.
- Jenkins, R. Rethinking Ethnicity: Arguments and Explorations; Sage: London, UK, 1997. [Google Scholar]
- Sahlins, M. What is anthropological enlightenment? Some lessons of the twentieth century. Ann. Rev. Anthropol. 1999, 28, i–xxiii. [Google Scholar] [CrossRef]
- Engel Merry, S. Transnational human rights and local activism: Mapping the middle. Am. Anthropol. 2006, 108, 38–51. [Google Scholar] [CrossRef]


| Time Frame | Month | Type of Questionnaire |
|---|---|---|
| t − 4 | November 2013 (limit of recall period for the 1st data collection) | |
| t | March 2014 (1st data collection was started—limit of recall period for the 2nd data collection) | A1 (1st Annual Household Survey), V1 (1st Village Survey), H1 (1st Household Survey) |
| t + 4 | July 2014 (2nd data collection was started—limit of recall period for the 3rd data collection) | H2 (2nd Household Survey) |
| t + 8 | November 2014 (3rd data collection was started) | A2 (2nd Annual Household Survey), V2 (2nd Village Survey), H3 (3rd Household Survey) |
| Group | Names of Groups | Total Number of Households in the Groups | Number of Sampled Households |
|---|---|---|---|
| 1 | Kel Basir (Kunangan Jaya II) | 6 | 0 |
| 2 | Kel Alit (Kunangan Jaya I) | 27 | 5 |
| 3 | Simp. Macan Dalam, Luar, Tanding | 32 | 7 |
| 4 | Zona Kemitraan + Kel Gelinding | 32 | 7 |
| 5 | Tanjung Mandiri | 14 | 0 |
| 6 | Kel Jupri (Mangkubangan) | 20 | 0 |
| 7 | Kapas Tengah (Sepintun) | 20 | 0 |
| 8 | Trans Unit III (Sepintun) | 42 | 9 |
| 9 | Kelompok Kuncah (Sako Suban) | 5 | 0 |
| 10 | Kelompok Bungkal (Pagar Desa) | 30 | 11 |
| Total | 228 | 39 |
| No. | Village | Province | Total Households | Sampled Households |
|---|---|---|---|---|
| 1 | Tanjung Lebar | Jambi | 545 | 57 |
| 2 | Bungku | Jambi | 979 | 59 |
| 3 | Pagar Desa | South Sumatra | 121 | 35 |
| 4 | Lamban Sigatal | Jambi | 124 | 38 |
| 5 | Sepintun | Jambi | 409 | 40 |
| Total | 2178 | 229 | ||
| No. | Type of Income Variables | Description | Utilization Type | |
|---|---|---|---|---|
| Cash Income | Subsistence | |||
| Natural Forest Income Sources | ||||
| 1 | Natural forest | Income from self-employment of household members in the harvesting of raw forest products, used or sold in unprocessed form. | Sale of rattan, fruits of Dragon Blood, timber, honey, birds, wildlife for meats (Pangolin, Deer, Wild Boar, Wild Chicken, Soft-shell turtle, Dumeril’s Monitor), forest fruits (Areca catechu, Durio zibethinus L., Parkia pod), Gadung, Damar resin, reed, firewood and bamboo. | Some households collected wild animals for protein intake and fruits for daily consumption. |
| 2 | Forest-derived income (FDI) | Income from self-employment of household members in processing (value added) forest products. | FDI covers resins of Dragon Blood, furniture from wood, coal from stumps or dead trees, crafts (plaited mats/bags, baskets, roof). | Only 1–2 units of mats and/or baskets were reported by each household for subsistence. |
| 3 | Forest wage | Income from wage labor or fixed salary generated from the related forest activities. | Cash income generated by households as employee or daily laborers at the restoration concession. | |
| 4 | Forest business | Income from businesses owned and managed by household members. | Businesses selling wooden and rattan furniture, rattan wholesaler, tree nursery, and Dragon Blood (in fruits and resins) wholesaler. | |
| Non-Natural Forest Income Sources | ||||
| 1 | Planted forest (rubber) | Income from self-employment of household members in the harvesting of resin. | Cash income generated from rubber plantation concession or small-scale rubber plantation owned by households. For partial income received in kind (i.e., staple food), the amount of food obtained was converted into monetary values (USD/aeu). | |
| 2 | Agricultural income | All income generated from cropping of agricultural land (including yards/gardens) and oil palm plantation (fruit bunches). | Cash income was mainly from fruit bunches and vegetables and spices harvested from agroforestry land. | Agricultural products used for subsistence were vegetables and spices harvested from gardens/yards as well as rice. |
| 3 | Non-forest wage income | Income from non-forest-related wage labor or fixed-salary employment. | Cash income generated by households as teachers, civil servants, local government staff/village administrators, daily laborers at oil palm plantations, employees at oil palm plantations, daily laborers in agricultural fields, drivers, and mechanics. | |
| 4 | Non-forest business income | Income from businesses owned and managed by the household. | ||
| 5 | Non-forest environmental income | The sum of values (of goods) resulting from the extraction of raw material from non-forest and non-cultivated areas for both subsistence and sale as source of income. | Cash income was only reported for 2 households. | Subsistence of 89 small-scale fish collectors. |
| 6 | Livestock income | Income from the products (including the sale of live animals) of farm animals. | Cash income was only generated from the sale of big animals (cattle, buffalo, and goats). Small animals like chicken, duck, and geese were not counted under income tabulation, as most of the households could not remember the exact number of small animals slaughtered or sold. | |
| 8 | Other income | Income from remittances (received from family members living and working overseas or in other provinces), gifts/support from friend and relatives, income from pensions or government support, and any other income not categorized under the above groups. | ||
| Socio-Economic Variables | ||||
| No. | Type of Socio-Economic Variables | Description | ||
| 1 | Age of household head | Years, numerical variable. | ||
| 2 | Ethnicity | Nominal variable: 0 = indigenous people (Batin Sembilan), 1 = Local, Malay-speaking people (Melayu tribe), 2 = migrants, Java (Java ethnic and only few households from Sundanese and Balinese) and North Sumatra (Batak ethnic). At the stage of data analysis, dummies were generated for ethnic variables. | ||
| 3 | Family size | The present number of household members who are living in the same household. It includes spouse, children, children-in-law, grandchildren, parents, parents-in-law, brothers/sisters, brothers/sisters-in-law, nephews/nieces. | ||
| 4 | Household head education | Number of years of formal education completed by the head of household. Interval variable. | ||
| 5 | Total land area owned | Total area of land owned by the household, measured in hectares (ha/aeu), including land rented out (and excluding land rented by the household). Includes agroforestry, monoculture, yard/garden, paddy field, residential area, oil palm plantation and bare land. The minimum land area to be counted as agroforestry and monoculture is an area which consists of 0.25 ha minimum -mapping unit as defined by Ministry of Forestry of Indonesia. Otherwise, it is designated the category yard/garden. | ||
| 6 | Total assets | The total value of all implements owned by the household: cars/trucks, motorcycles, canoes, televisions, mobile phones, generator sets, water pumps, and other tools valued at more than 10 USD, as well as livestock assets. | ||
| Socio-Economic Variables | Total Sample | Batin Sembilan | Local Malayan | Immigrant Group | ANOVA | |
|---|---|---|---|---|---|---|
| Mean | SD | |||||
| Age of household head | 44.4 | 12.3 | 43.9 a | 45.1 a | 43.9 a | NS |
| Family size | 4.4 | 1.7 | 5.2 a | 4.7 a | 3.8 b | *** |
| Education (year of schooling) of household head | 6.6 | 3.9 | 1.2 a | 7.3 b | 7.8 b | *** |
| Land area owned (ha/aeu) | 1.1 | 1.9 | 0.8 a | 1.4 b | 0.9 a | NS |
| Total household assets | 287.6 a | 795.9 b | 938.4 b | *** | ||
| Total value of household implements (USD/aeu) | 746.5 | 967.9 | 283.8 a | 757.2 b | 887.1 b | *** |
| Total value of livestock (USD/aeu) | 39.3 | 167.1 | 3.7 a | 38.8 b | 51.3 c | NS |
| Total annual income (USD/aeu) | 1174.3 | 979.4 | 826.0 a | 1097.6 b | 1357.2 c | *** |
| Total natural forest income (USD/aeu) | 114.9 | 233.4 | 293.1 a | 91.3 b | 78.4 b | *** |
| Total non-natural forest income (USD/aeu) | 1059.4 | 993.8 | 532.9 a | 1006.3 b | 1278.8 c | *** |
| No. | Income Sources | Indigenous Batin Sembilan | Local Malayan | Immigrant Groups | ||||||
|---|---|---|---|---|---|---|---|---|---|---|
| No of HH | Absolute (USD/aeu) | Income Share (%) | No of HH | Absolute (USD/aeu) | Income Share (%) | No of HH | Absolute (USD/aeu) | Income Share (%) | ||
| A | Natural Forest Source *** | 29 | 293.1 a | 35.9 a | 41 | 91.3 b | 9.8 b | 25 | 78.4 b | 7.7 b |
| 1 | Direct Forest Product | 28 | 238.3 | 29.3 | 29 | 42.3 | 5.5 | 11 | 28.2 | 1.8 |
| 2 | Forest-derived Product | 8 | 36.2 | 3.7 | 14 | 23.6 | 3.2 | 13 | 38.5 | 5.1 |
| 3 | Forest Wage | 2 | 18.6 | 2.9 | 4 | 6.3 | 0.6 | 0 | 0 | 0 |
| 4 | Forest Business | 0 | 0 | 0 | 2 | 19.3 | 0.6 | 5 | 11.6 | 0.9 |
| B | Non-Natural Forest Source *** | 39 | 532.9 a | 64.1 a | 108 | 1006.3 b | 90.2 b | 119 | 1278.8 c | 92.3 b |
| 1 | Planted Forest (Rubber) | 17 | 99.7 | 13.5 | 70 | 298.1 | 29.9 | 21 | 88.5 | 6.1 |
| 2 | Plantation Wage | 8 | 37.2 | 4.7 | 27 | 52.4 | 4.8 | 23 | 43.8 | 3.4 |
| 3 | Agriculture | 8 | 24.9 | 2.4 | 60 | 221.4 | 17.6 | 80 | 366.3 | 27.2 |
| 4 | Non-Forest Wage | 26 | 273.9 | 31.1 | 74 | 268.8 | 28.0 | 94 | 386.5 | 36.9 |
| 5 | Non-Forest Business | 5 | 22.7 | 2.8 | 14 | 119.6 | 4.4 | 39 | 322.7 | 13.3 |
| 6 | Non-Forest Environmental | 31 | 29.9 | 4.2 | 43 | 11.5 | 1.6 | 17 | 5.7 | 0.6 |
| 7 | Livestock | 0 | 0 | 0 | 14 | 26.7 | 2.7 | 13 | 35.1 | 2.4 |
| 8 | Others | 14 | 44.6 | 5.4 | 22 | 7.8 | 1.2 | 27 | 30.4 | 2.4 |
© 2016 by the authors; licensee MDPI, Basel, Switzerland. This article is an open access article distributed under the terms and conditions of the Creative Commons Attribution (CC-BY) license (http://creativecommons.org/licenses/by/4.0/).
Share and Cite
Widianingsih, N.N.; Theilade, I.; Pouliot, M. Contribution of Forest Restoration to Rural Livelihoods and Household Income in Indonesia. Sustainability 2016, 8, 835. https://doi.org/10.3390/su8090835
Widianingsih NN, Theilade I, Pouliot M. Contribution of Forest Restoration to Rural Livelihoods and Household Income in Indonesia. Sustainability. 2016; 8(9):835. https://doi.org/10.3390/su8090835
Chicago/Turabian StyleWidianingsih, Nayu Nuringdati, Ida Theilade, and Mariève Pouliot. 2016. "Contribution of Forest Restoration to Rural Livelihoods and Household Income in Indonesia" Sustainability 8, no. 9: 835. https://doi.org/10.3390/su8090835
APA StyleWidianingsih, N. N., Theilade, I., & Pouliot, M. (2016). Contribution of Forest Restoration to Rural Livelihoods and Household Income in Indonesia. Sustainability, 8(9), 835. https://doi.org/10.3390/su8090835