
Urban Expansion and Agricultural Land Loss in China: A Multiscale Perspective

 ,
,  ,
, 
 ,
,  ,
, 
Abstract
:1. Introduction
2. Study Areas and Data Sources
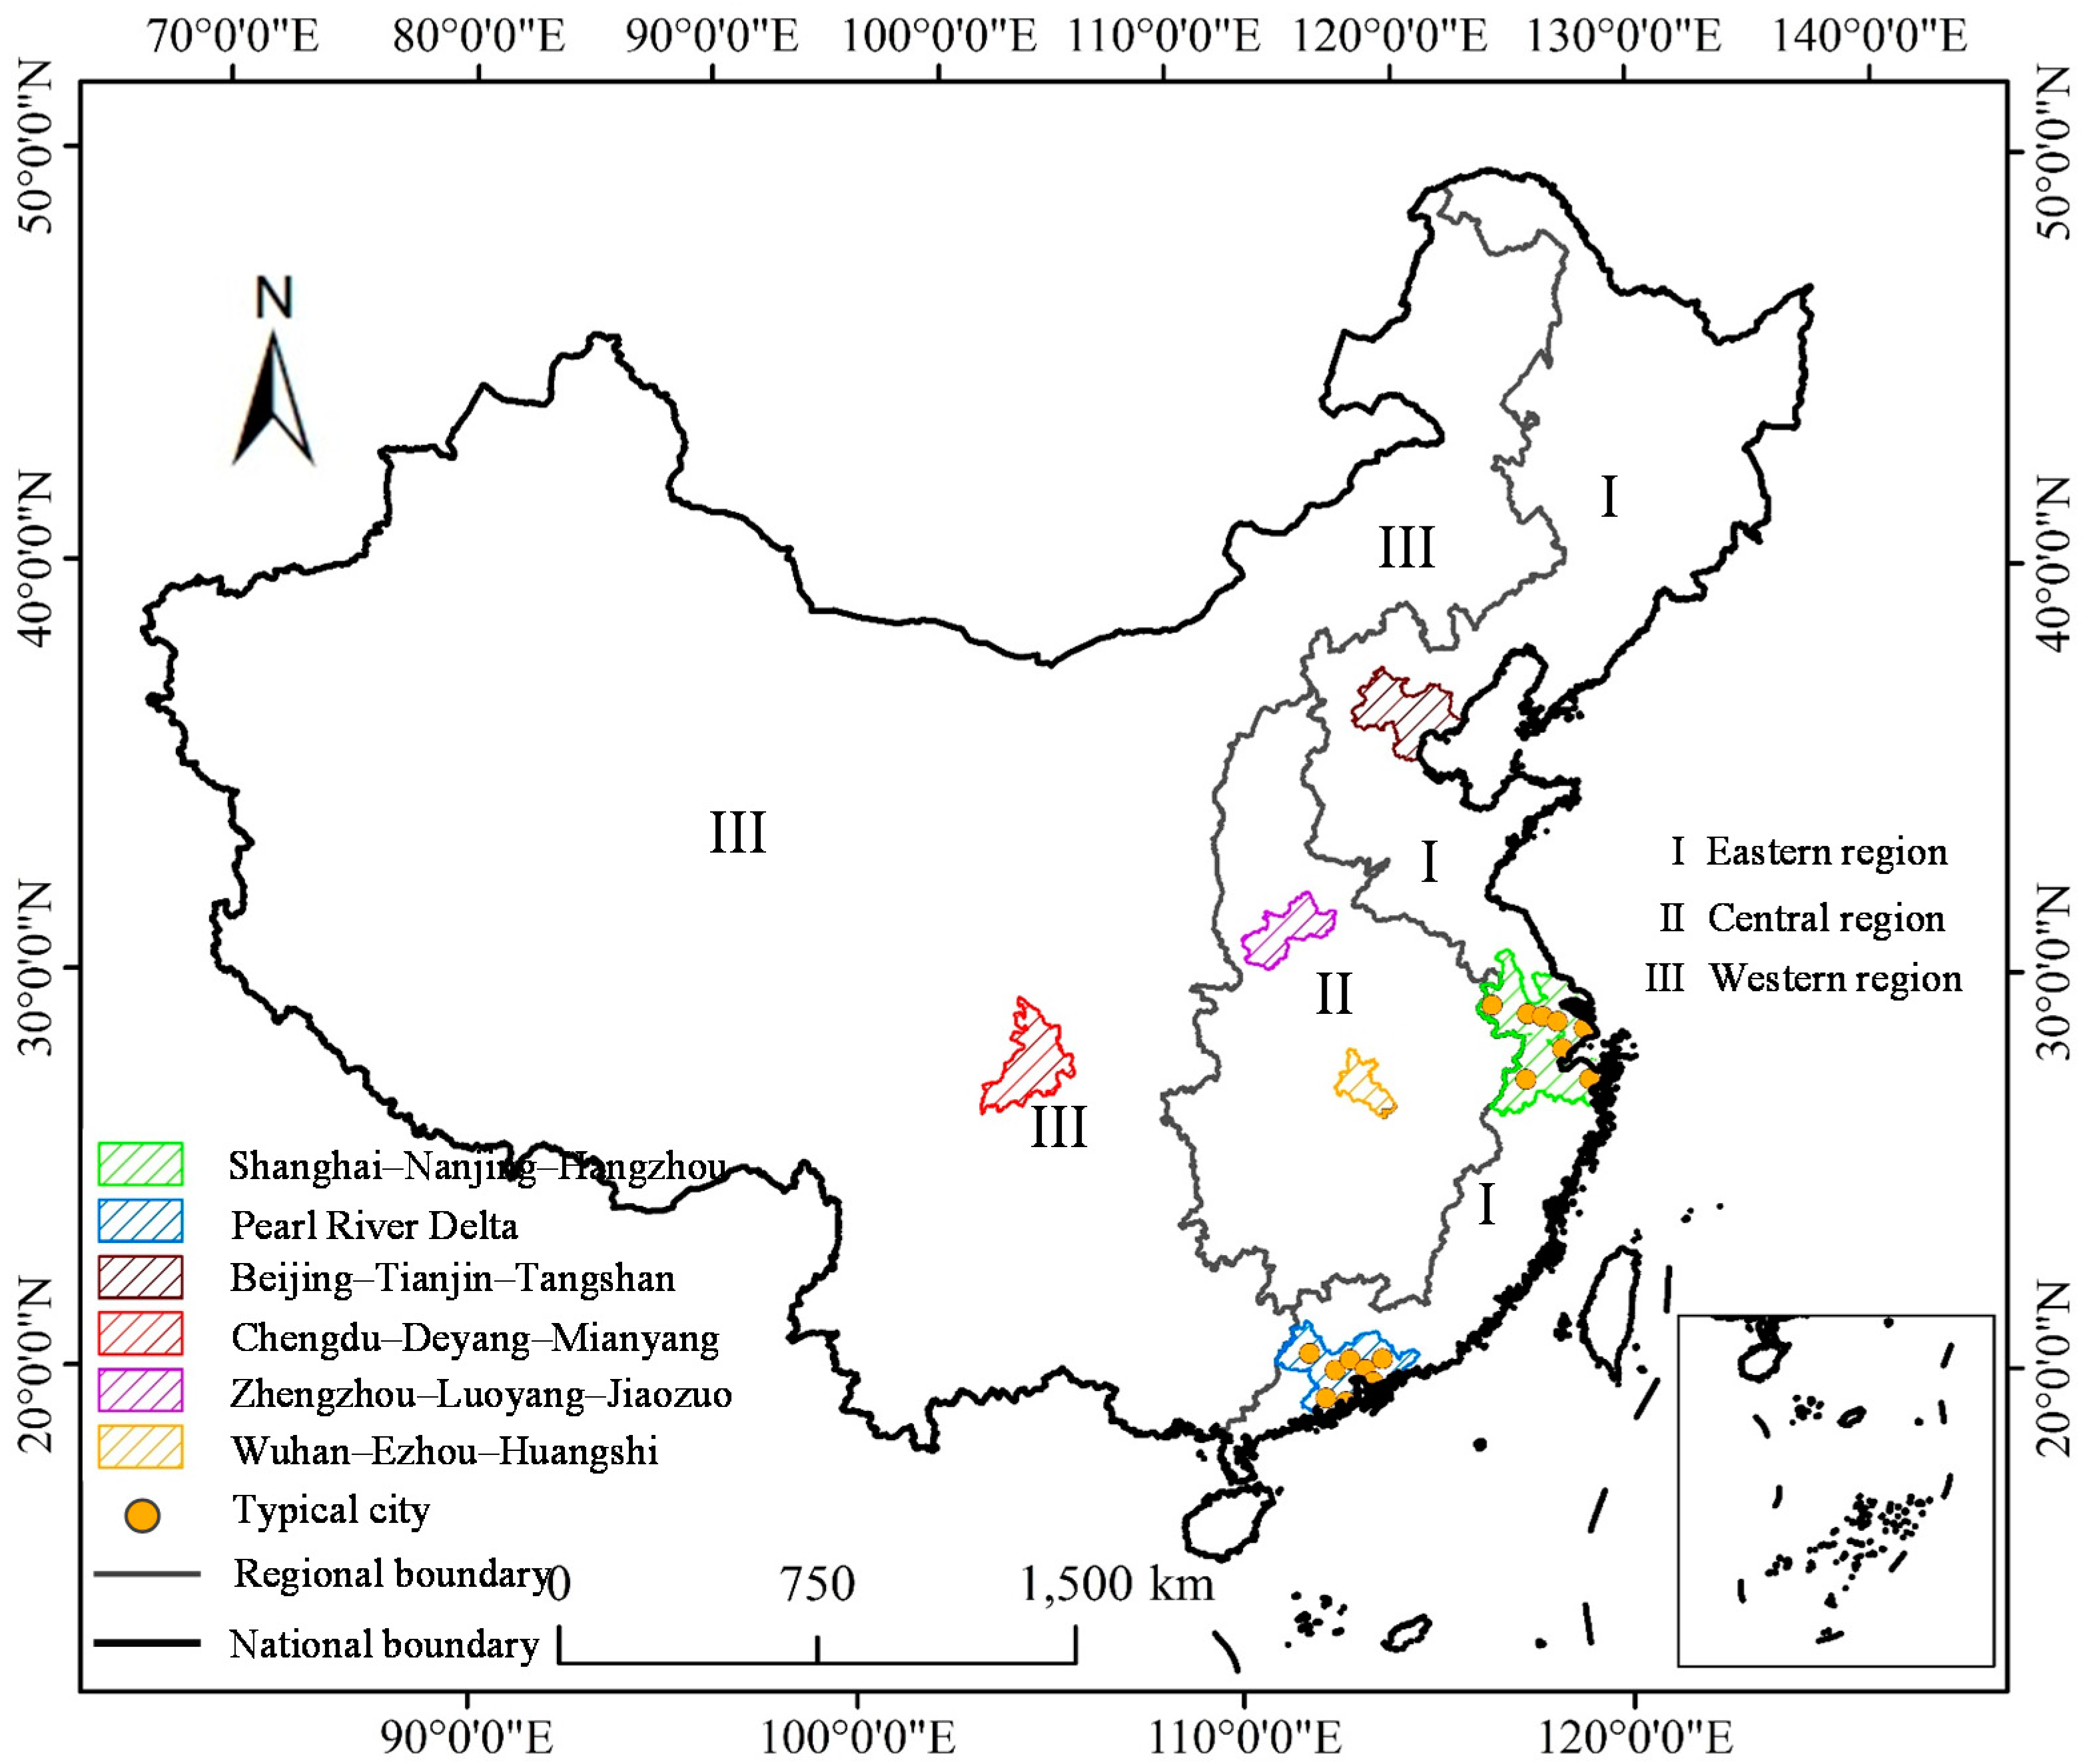
2.1. Study Areas
2.2. Data Source
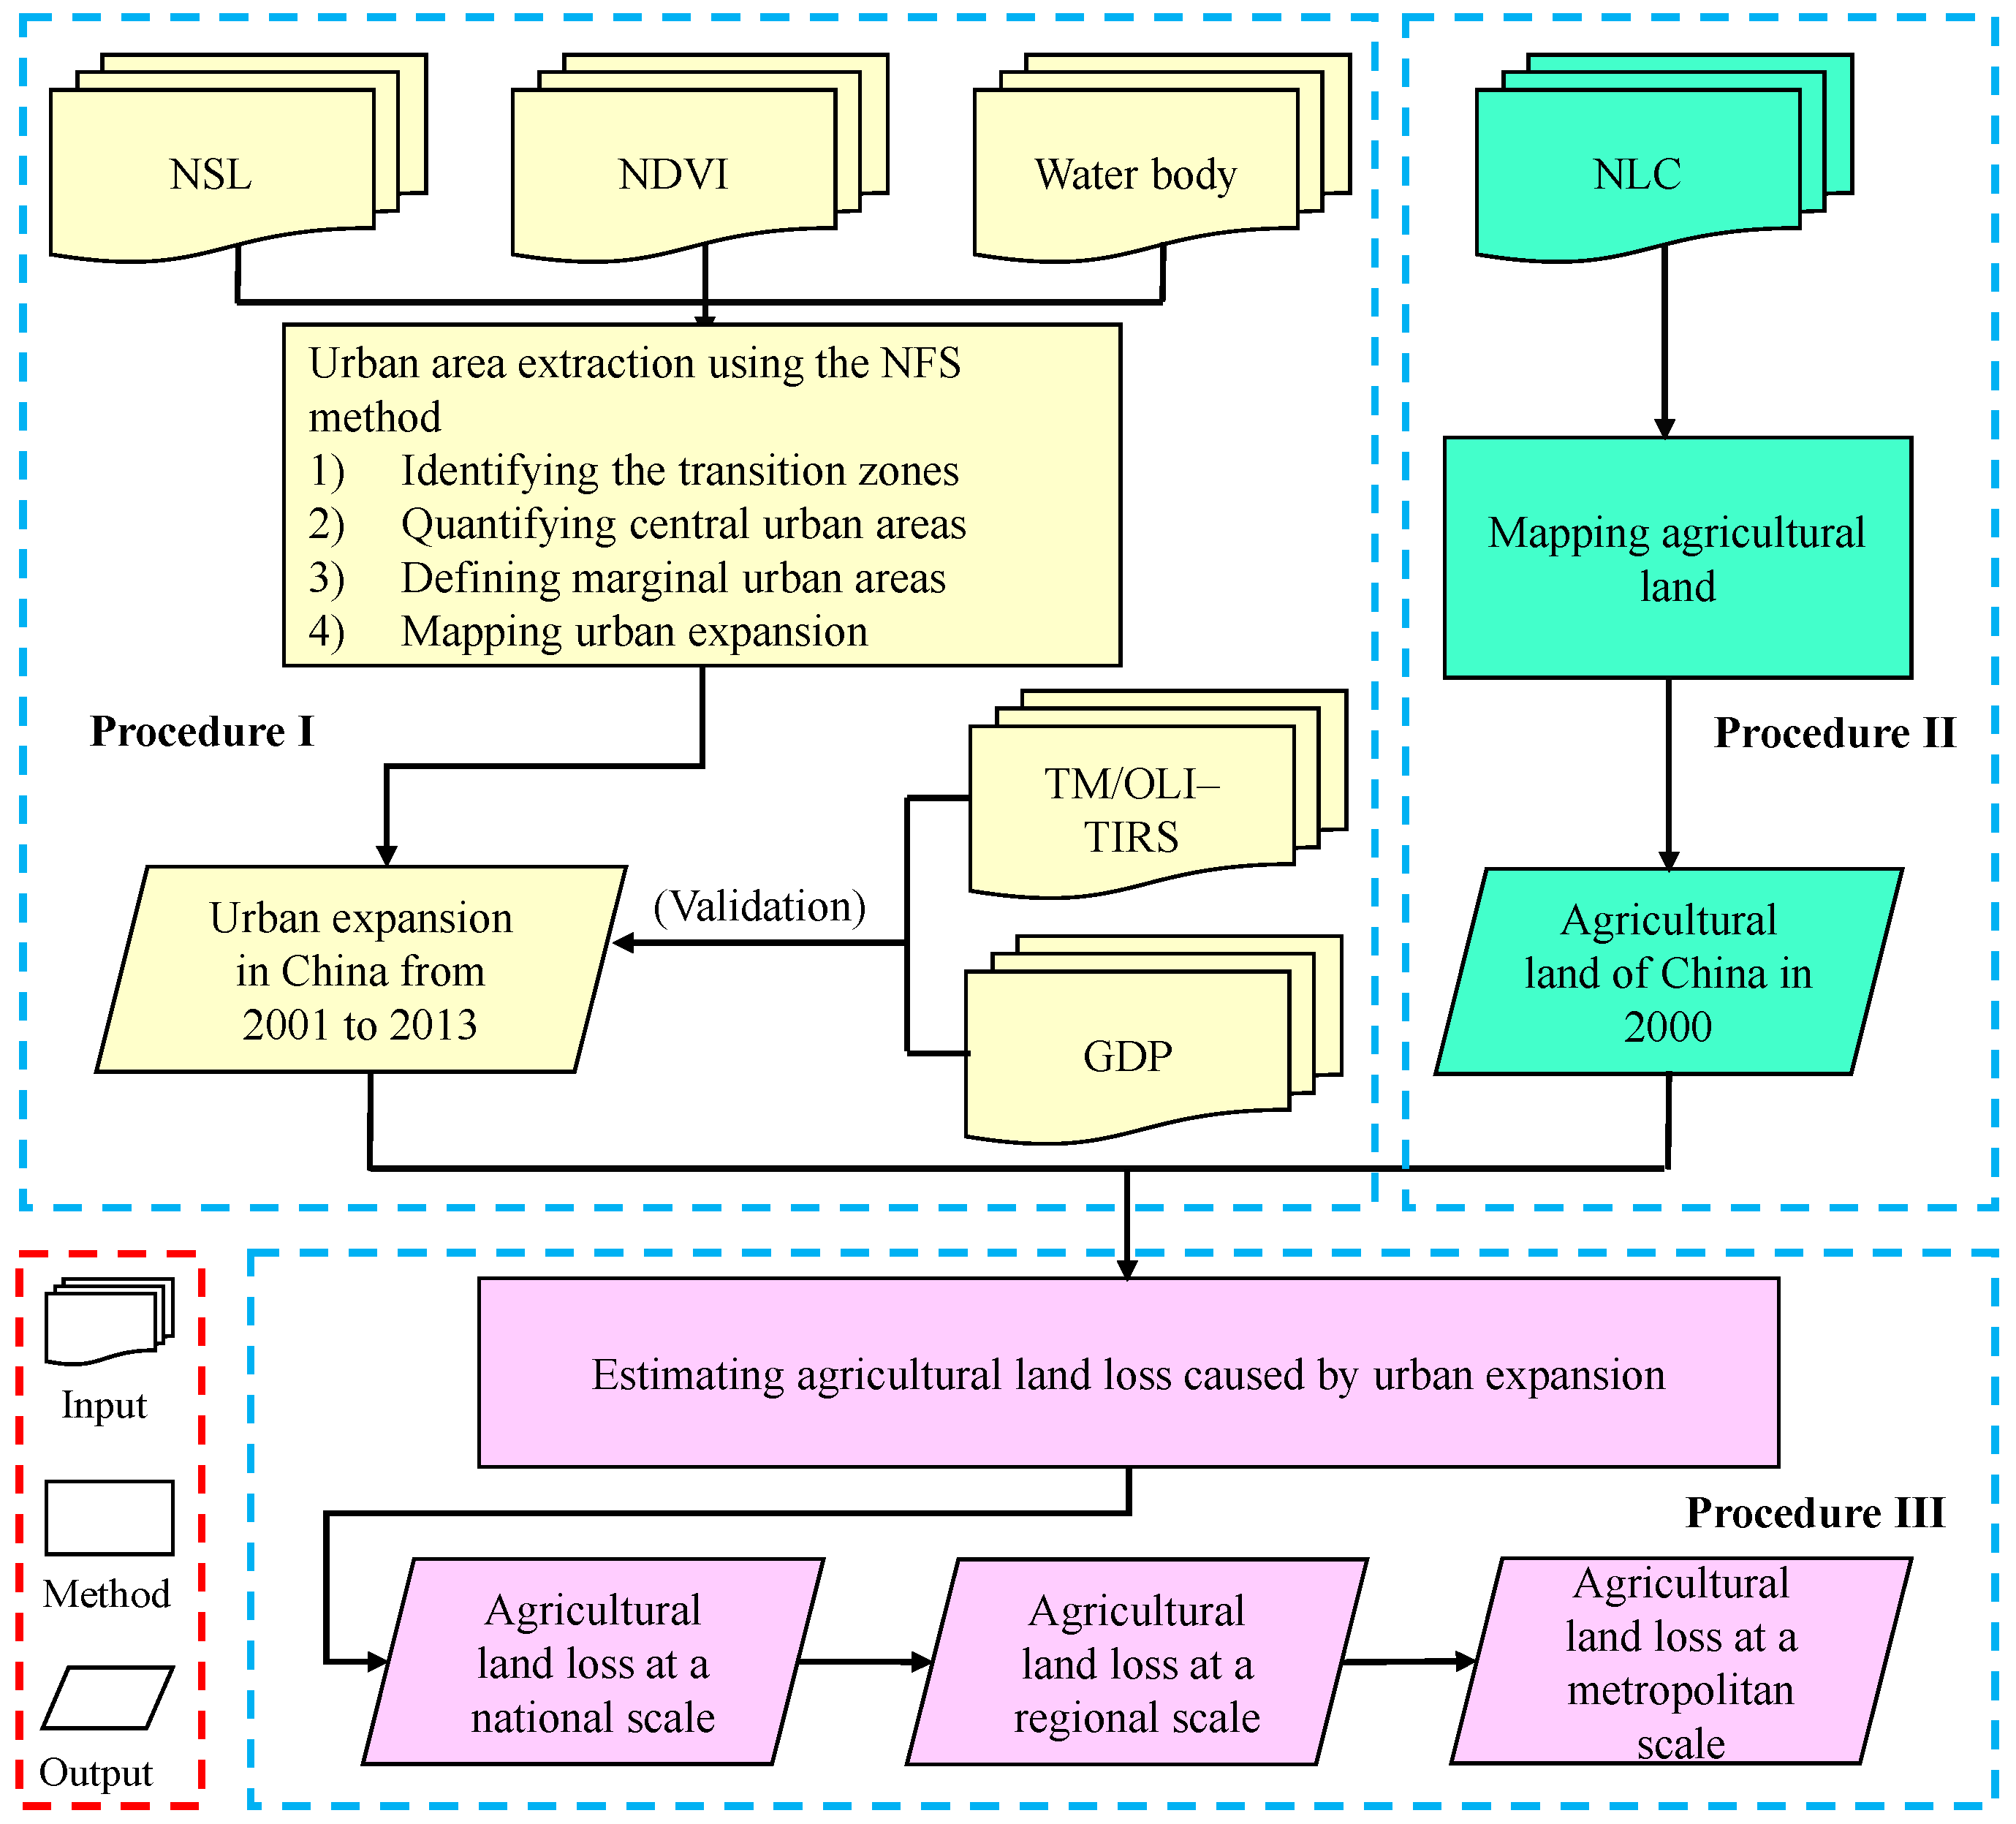
3. Methodology
3.1. Extracting Urban Expansion
- (1)
- Identifying the transition zones. Because the NSL data could be treated as Digital Elevation Model (DEM) images, identifying the dividing lines between ridges and valleys is equivalent to distinguishing urban and non-urban areas. However, due to the “blooming effect” of the NSL data, these lines are actually transition zones, including both urban and non-urban areas. In this study, the transition zones were identified by using maximum and minimum NFS calculations.
- (2)
- Quantifying central urban areas. According to the differences of pixel values in the NSL data, the regions with relatively high values on the side of transition zones were classified as central urban areas.
- (3)
- Defining marginal urban areas. Since the transition zones are more heterogeneous landscapes, the marginal urban areas hidden in the transition zones were extracted using the minimum NFS calculation.
- (4)
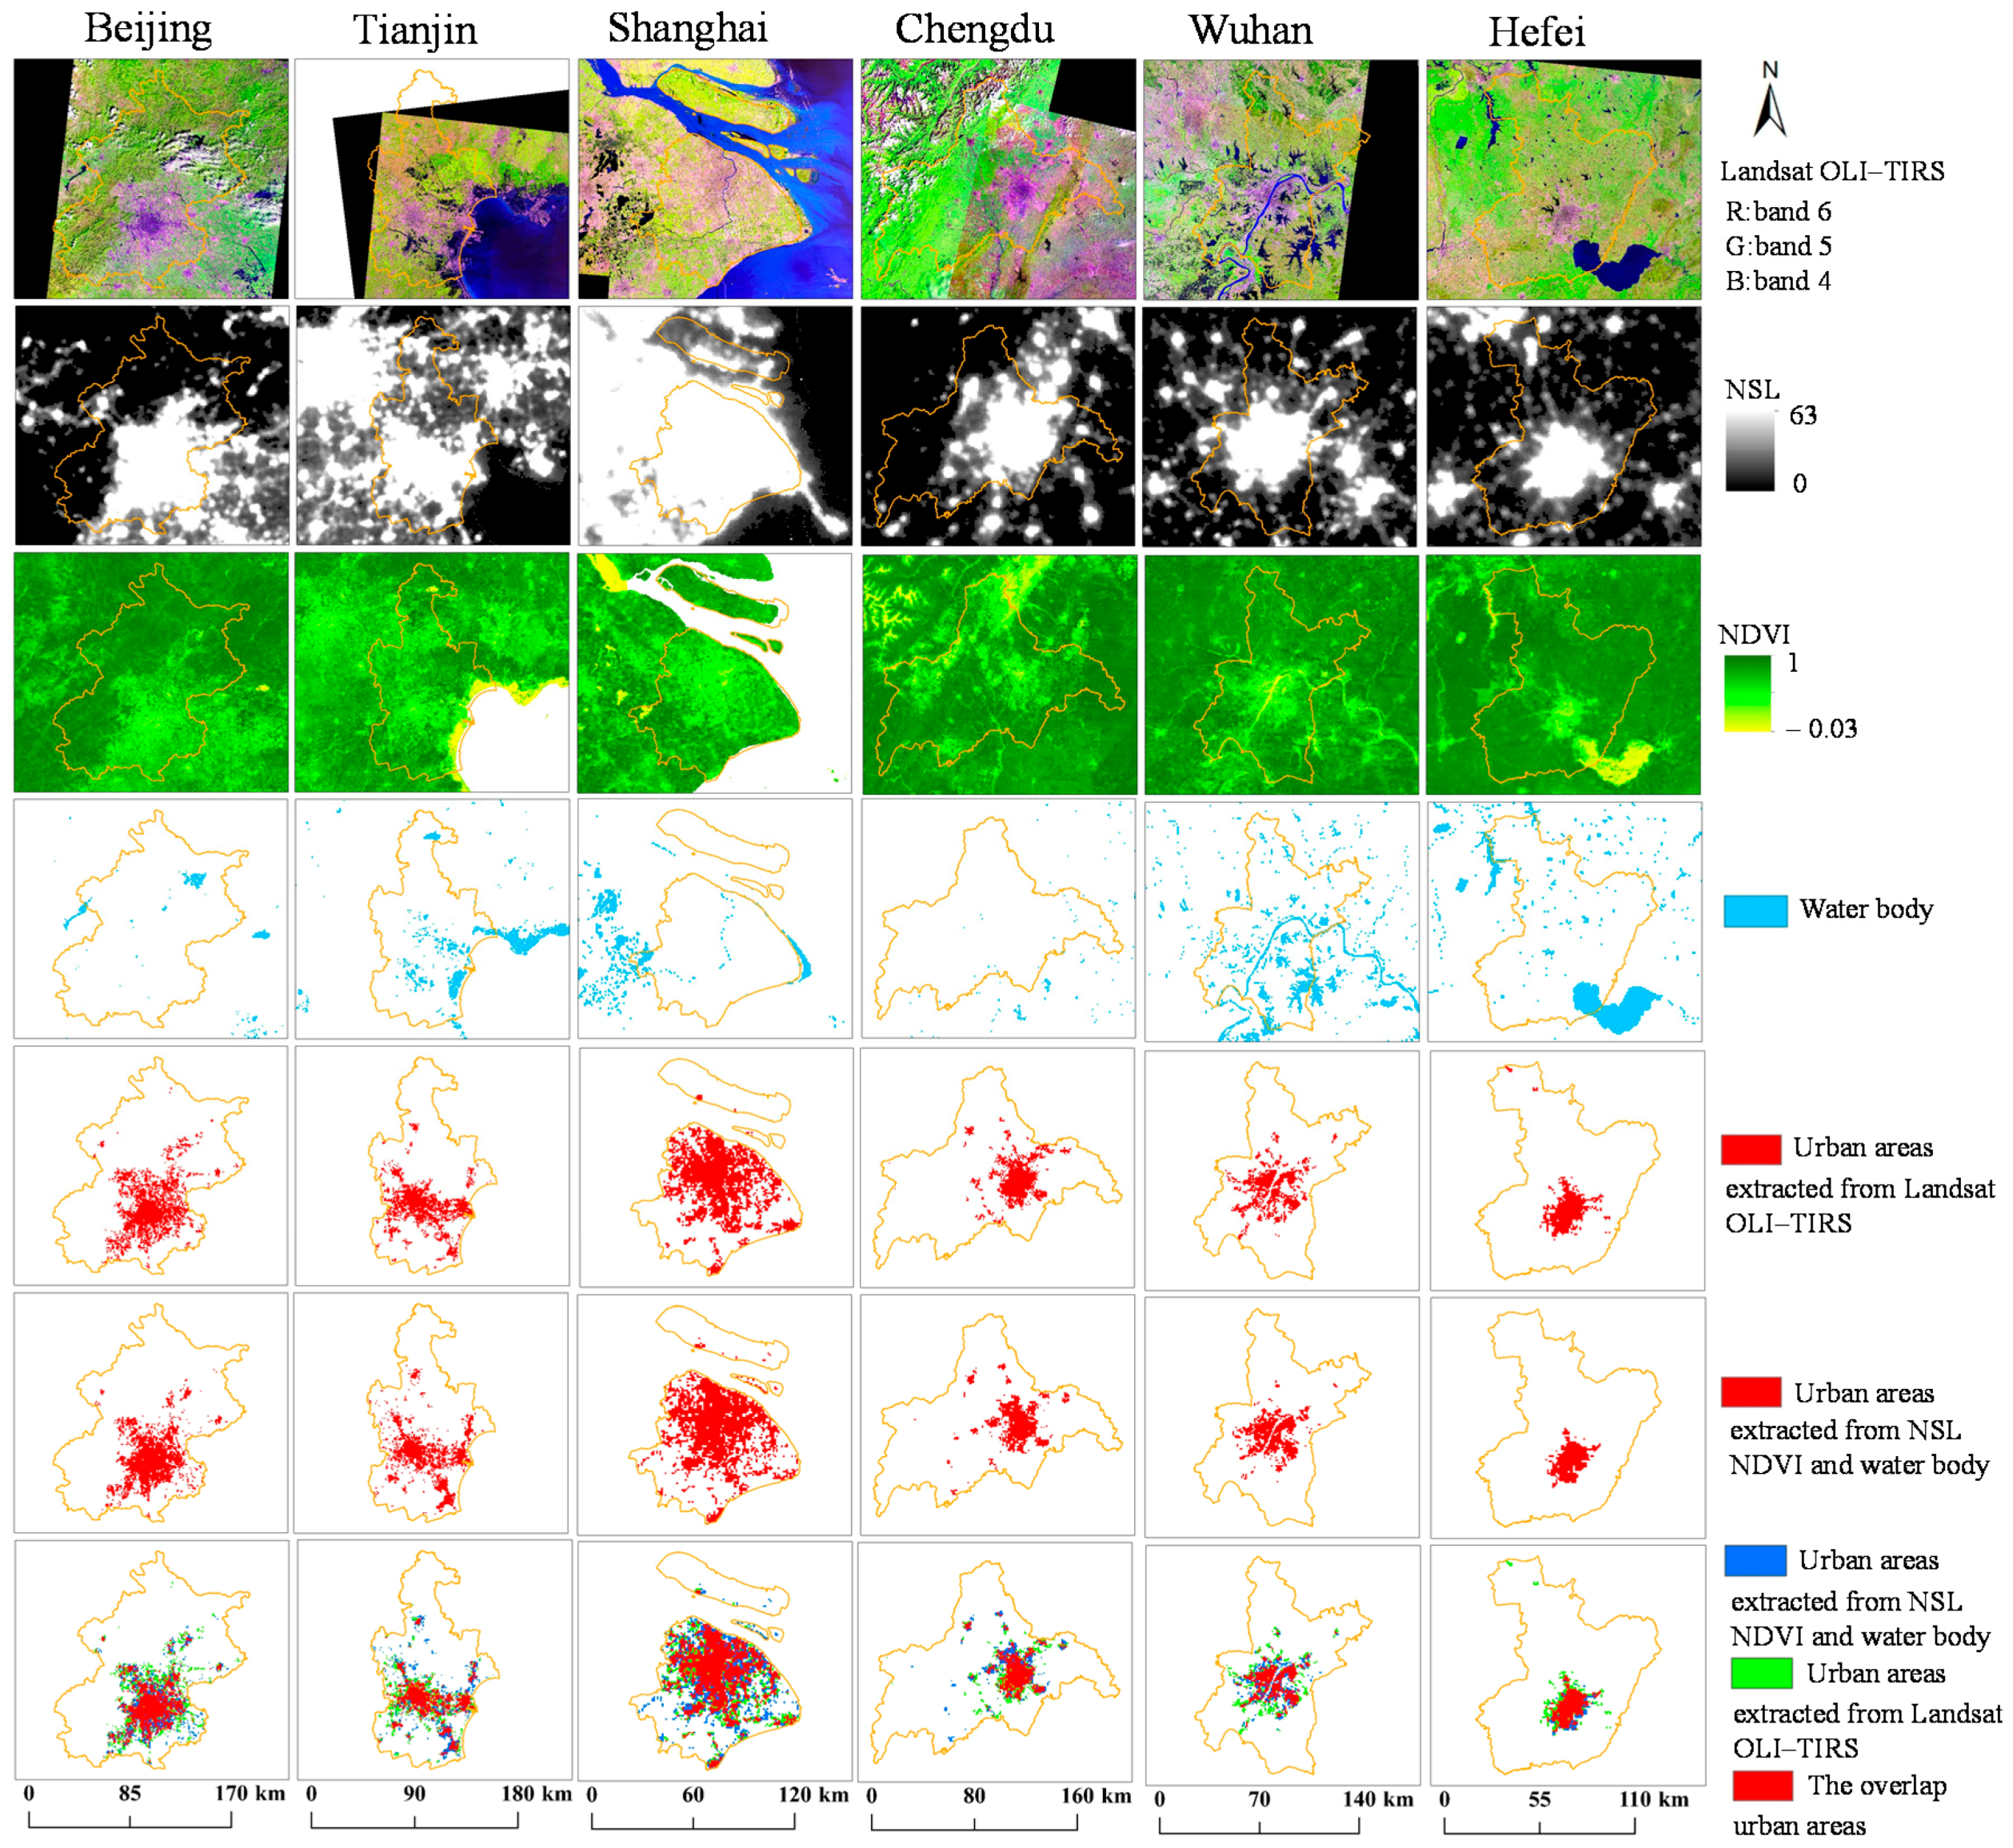
- Mapping urban expansion. The primary urban maps were obtained by overlaying central and marginal urban areas. To deal with any misclassifications in these primary urban maps, we applied NDVI and water body data to remove natural features located within urban areas from the primary urban maps. Moreover, urban areas were assumed to continuously grow outward, and an urban pixel of reclassified urban maps in an earlier year would remain as urban in a later year. Additional information can be found in the supplementary materials.
3.2. Mapping Agricultural Land in 2000
3.3. Estimating Agricultural Land Loss Caused by Urban Expansion
4. Results
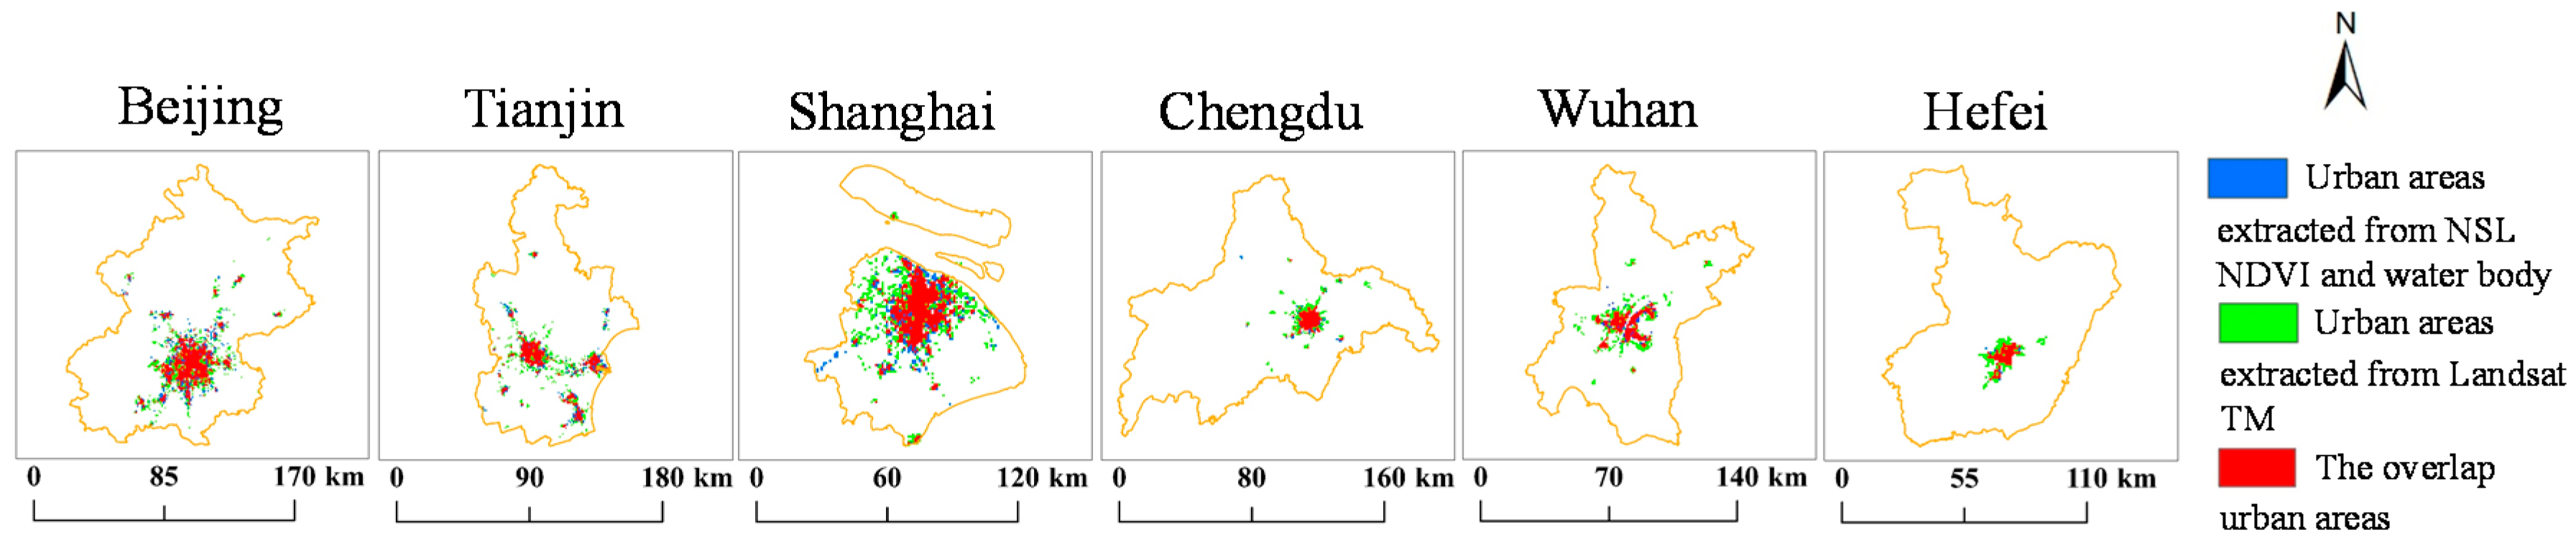
4.1. Validation of Urban Area Extraction
4.2. Urban Expansion from 2001 to 2013
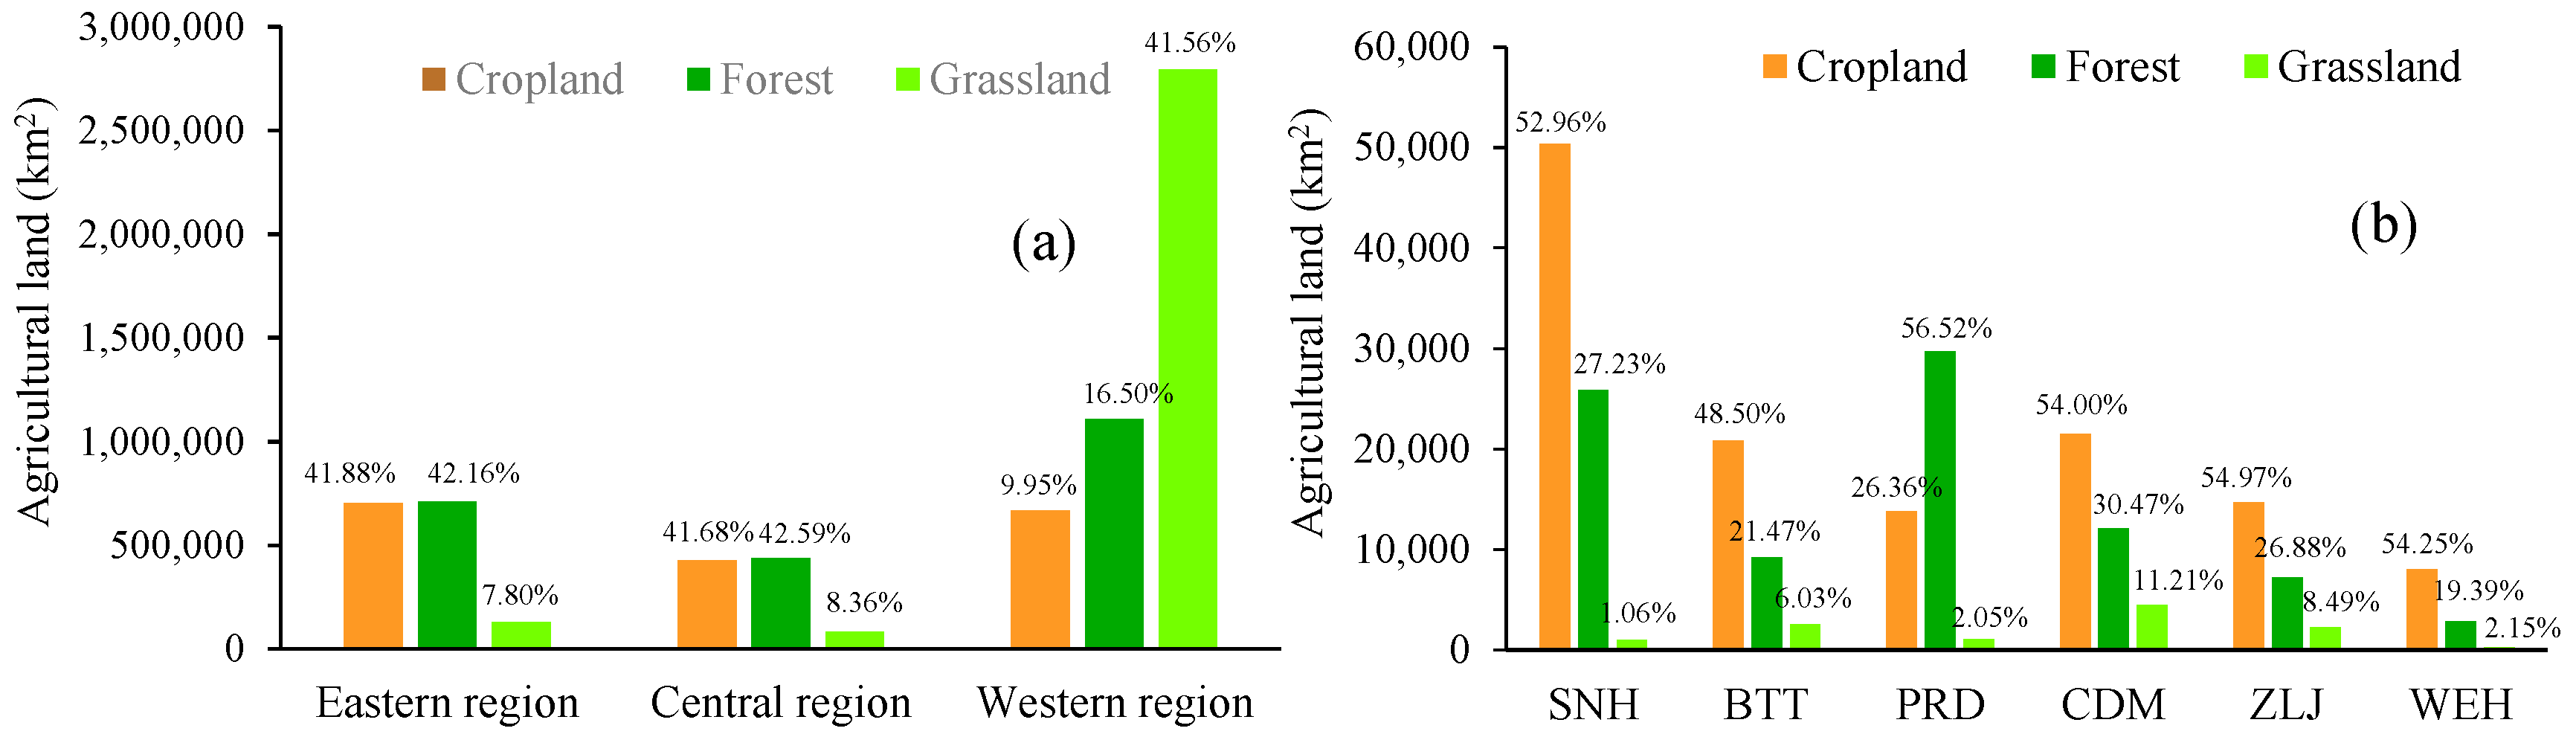
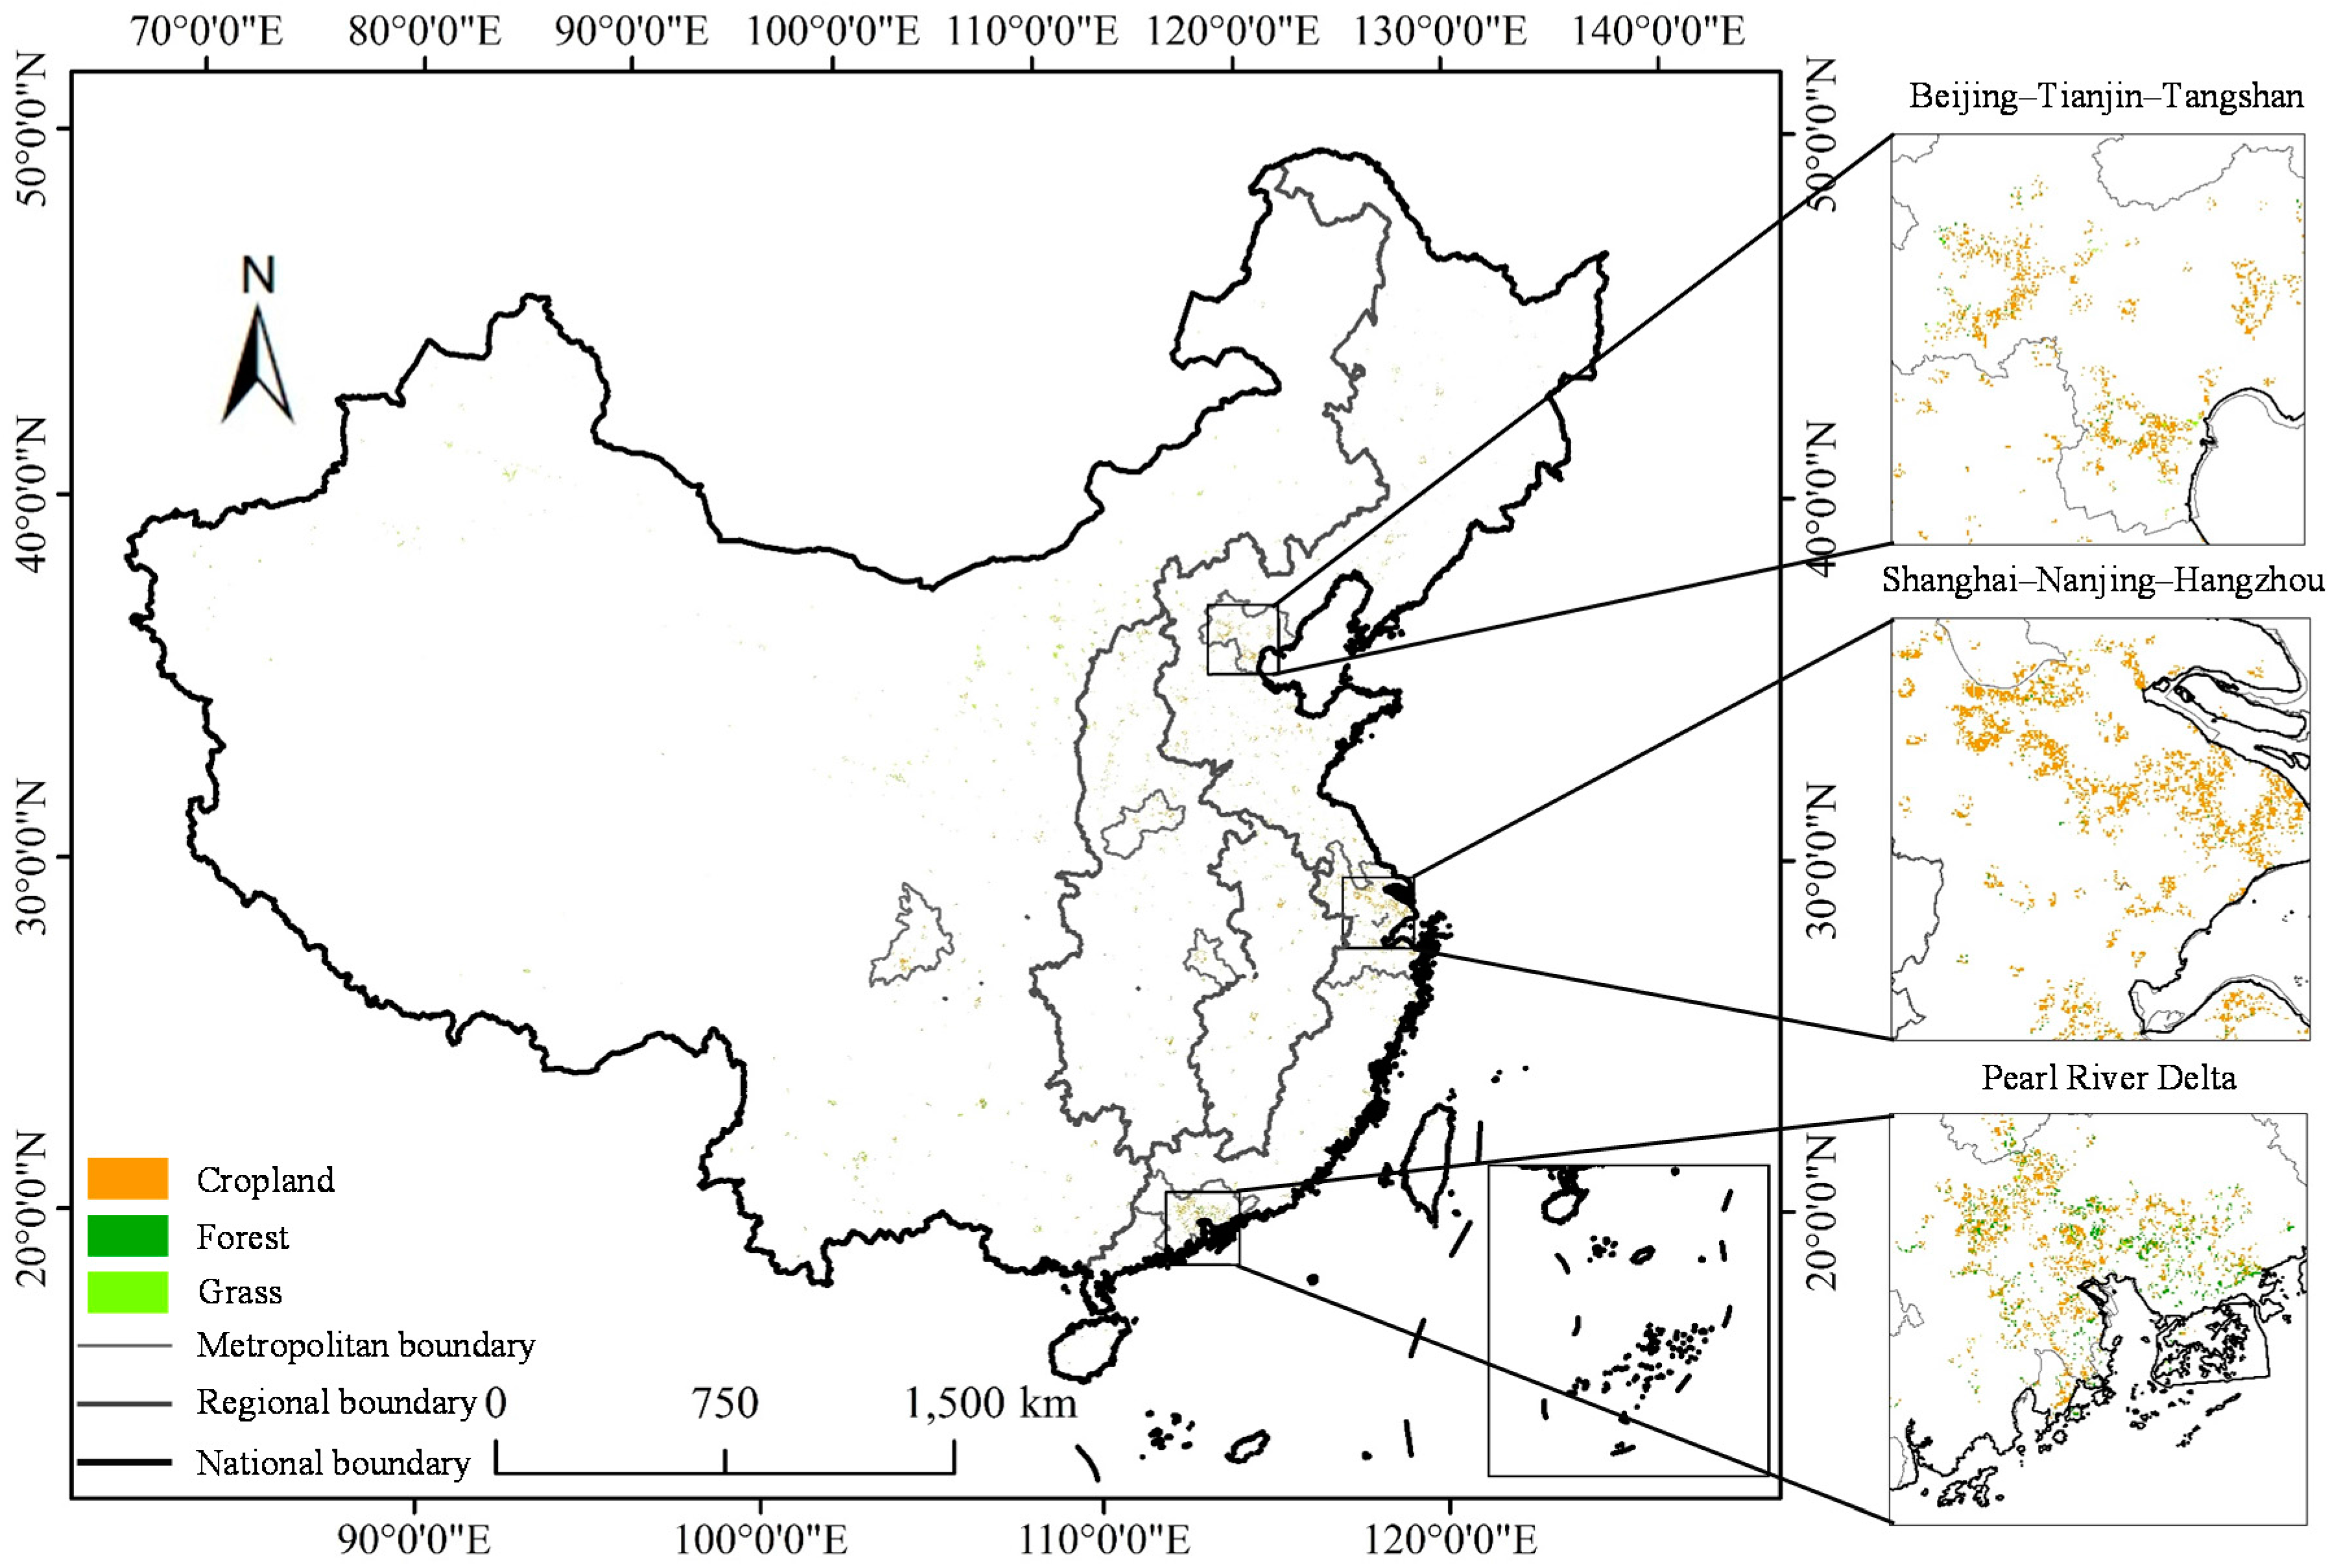
4.3. Agricultural Land in 2000
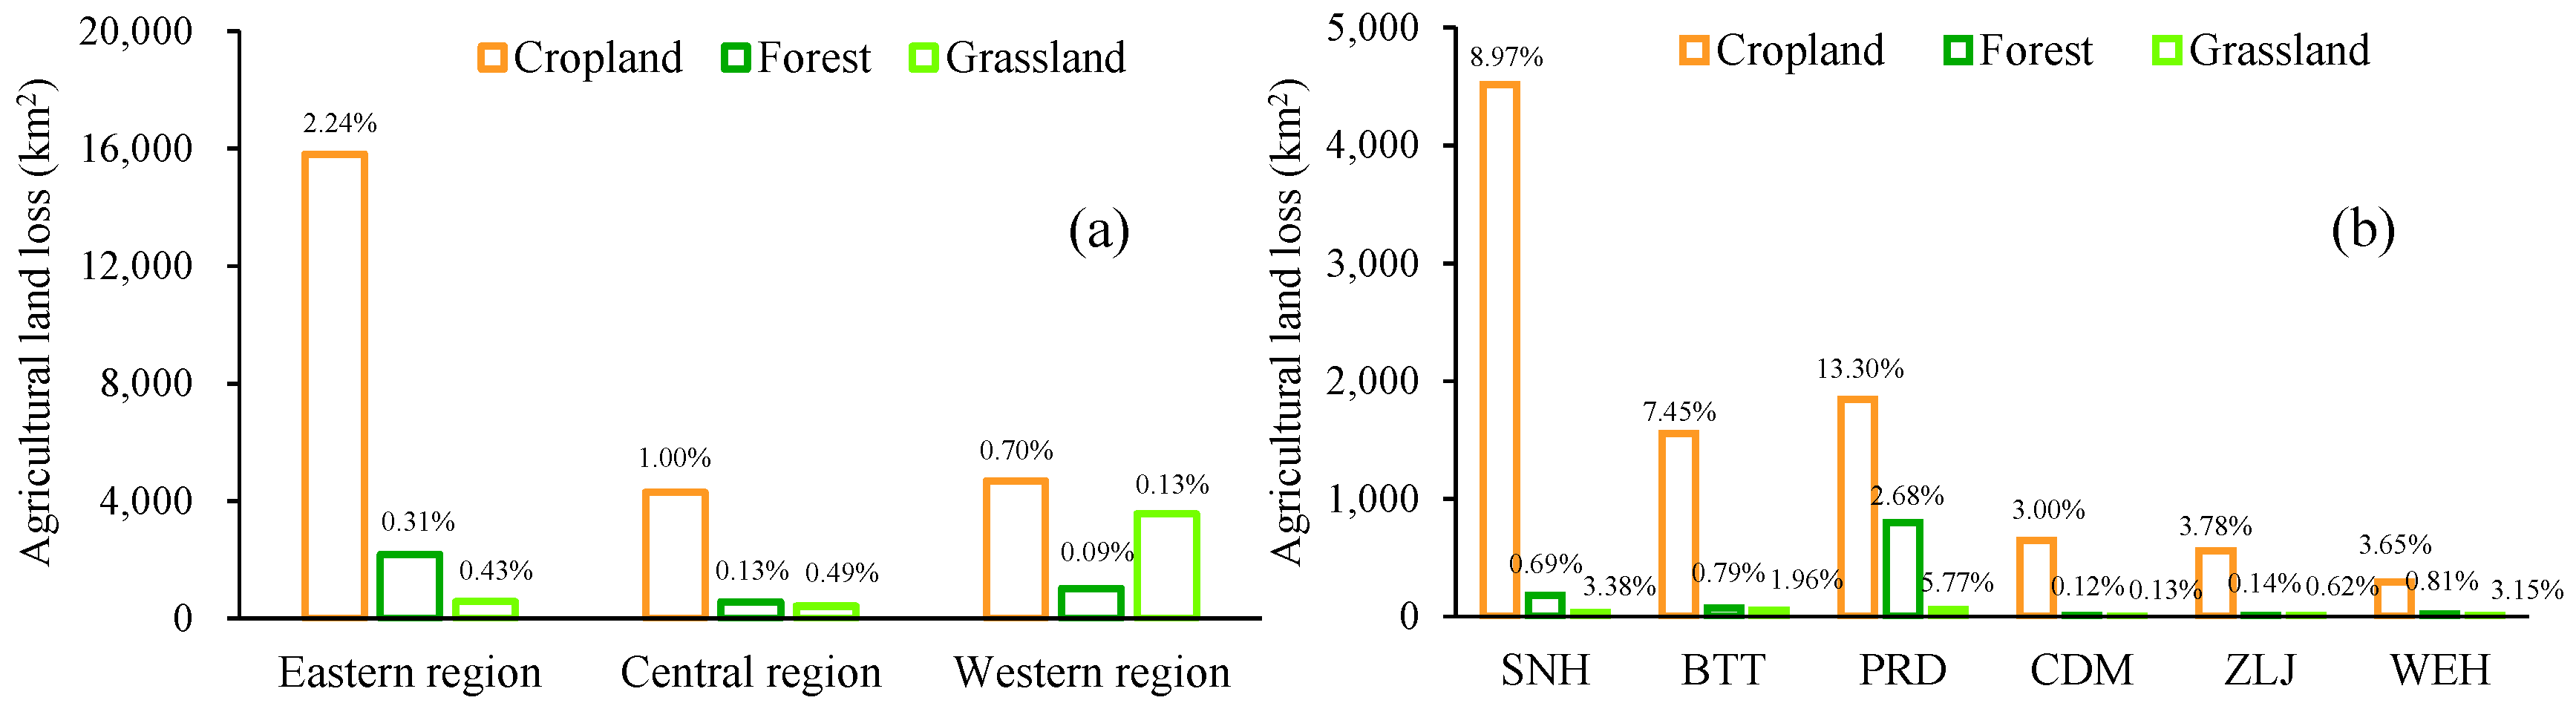
4.4. Urbanization-Related Agricultural Land Loss from 2001 to 2013 at National, Regional, and Metropolitan Scales
5. Discussion
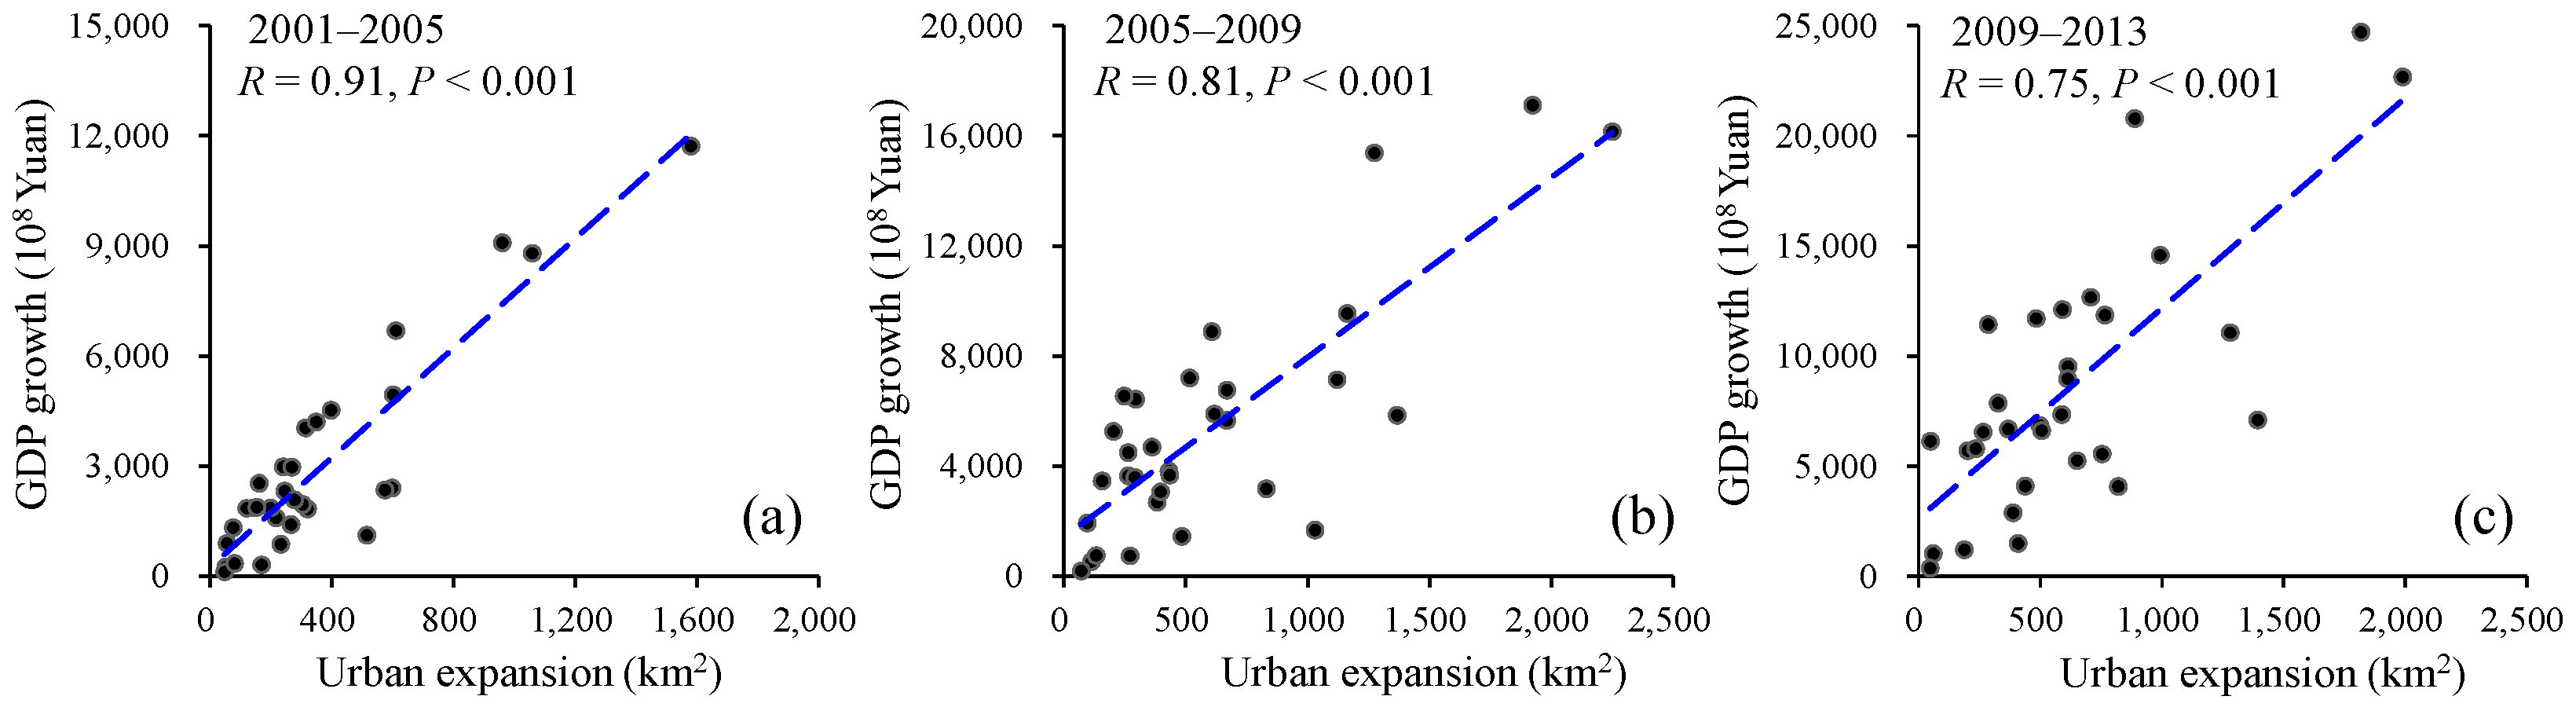
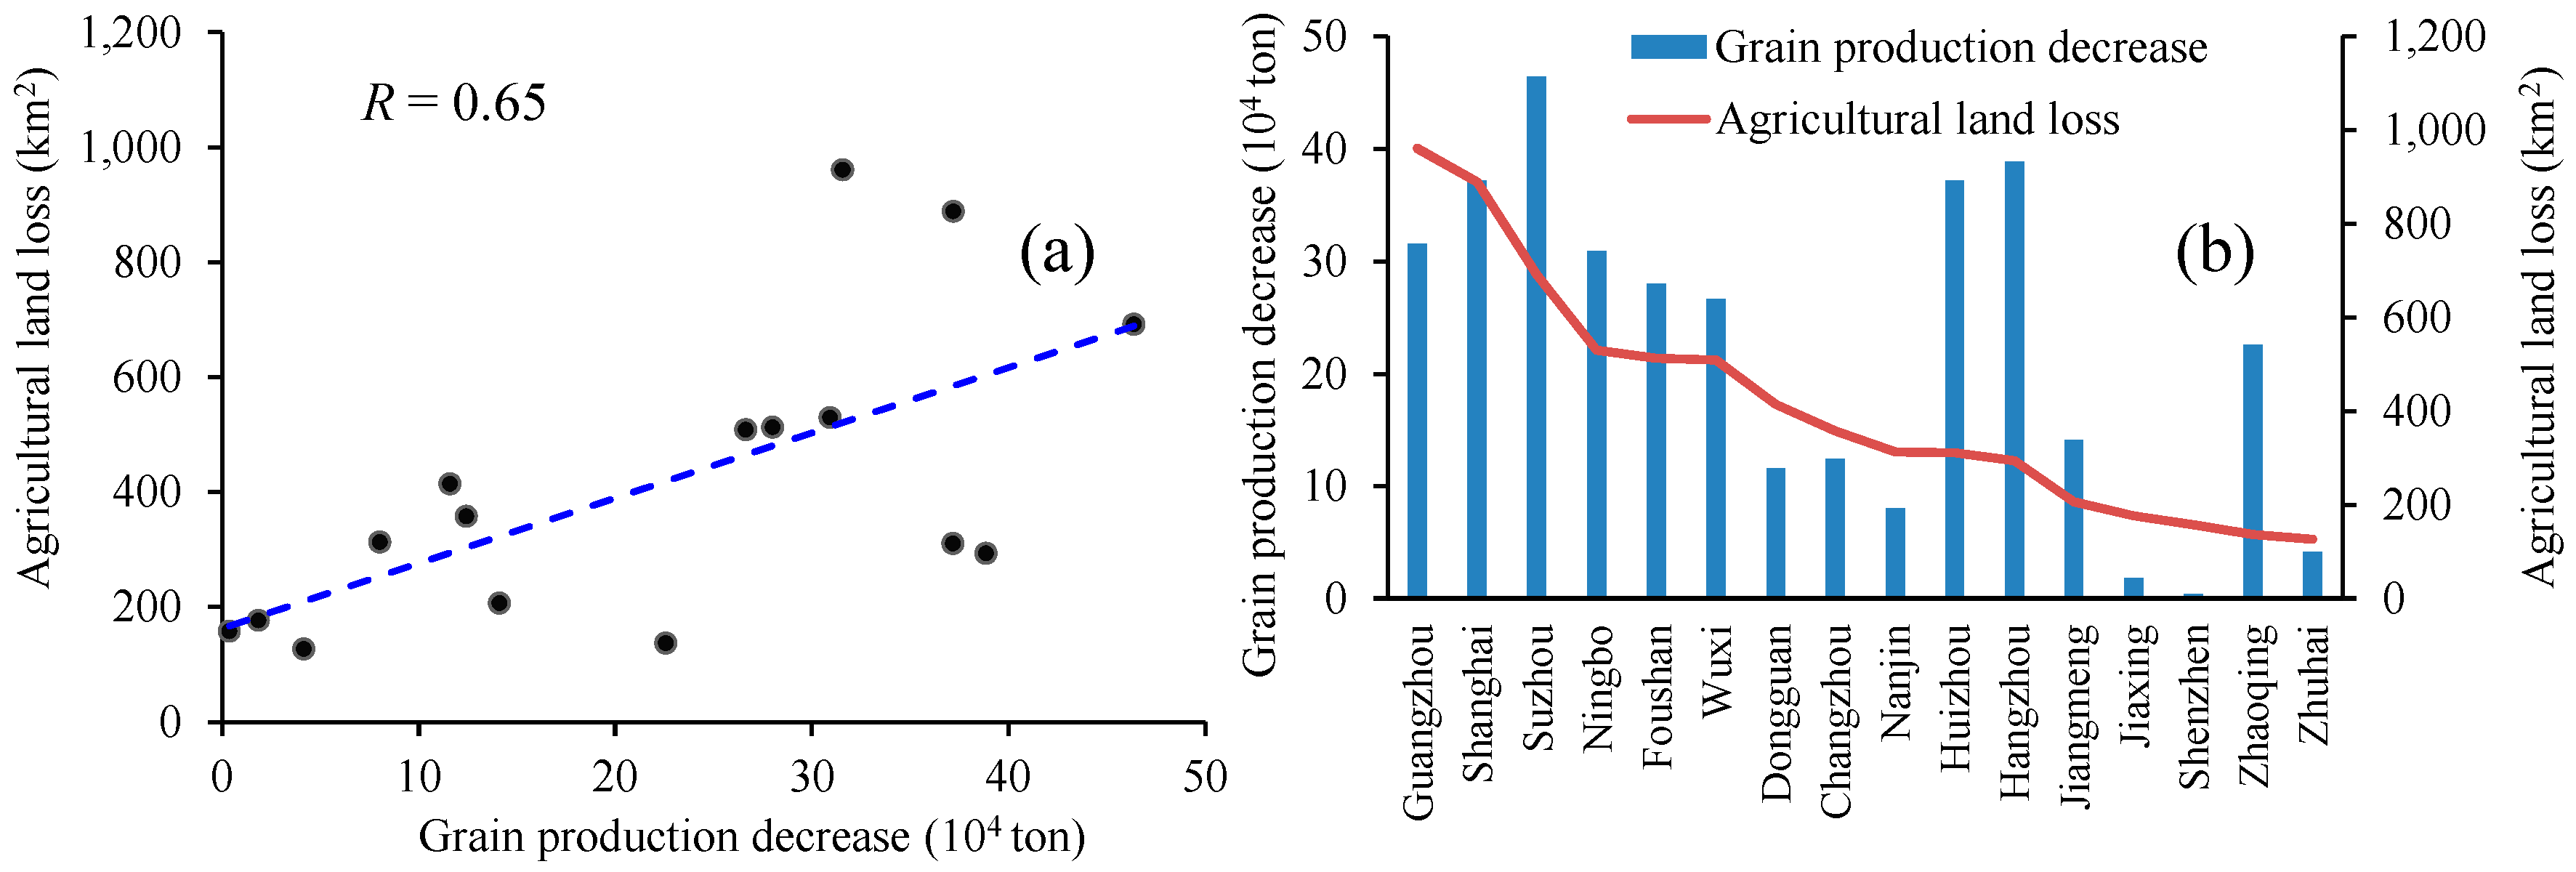
5.1. Correlation between Urbanization-Related Agricultural Land Loss and Grain Production Decrease
5.2. Strategies for Mitigating Urbanization-Related Agricultural Land Loss
5.3. Limitations and Future Perspectives
6. Conclusions
Supplementary Materials
Acknowledgments
Author Contributions
Conflicts of Interest
References
- Lambin, E.F.; Turner, B.L.; Geist, H.J.; Agbola, S.B.; Angelsen, A.; Bruce, J.W.; Coomes, O.T.; Dirzo, R.; Fischer, G.; Folke, C. The causes of land-use and land-cover change: Moving beyond the myths. Glob. Environ. Chang. 2001, 11, 261–269. [Google Scholar] [CrossRef]
- Kraemer, R.; Prishchepov, A.V.; Müller, D.; Kuemmerle, T.; Radeloff, V.C.; Dara, A.; Terekhov, A.; Frühauf, M. Long-term agricultural land-cover change and potential for cropland expansion in the former Virgin Lands area of Kazakhstan. Environ. Res. Lett. 2015. [Google Scholar] [CrossRef]
- Gutzler, C.; Helming, K.; Balla, D.; Dannowski, R.; Deumlich, D.; Glemnitz, M.; Knierim, A.; Mirschel, W.; Nendel, C.; Paul, C. Agricultural land use changes—A scenario-based sustainability impact assessment for Brandenburg, Germany. Ecol. Indic. 2015, 48, 505–517. [Google Scholar] [CrossRef]
- Barati, A.; Asadi, A.; Kalantari, K.; Azadi, H.; Witlox, F. Agricultural land conversion in Northwest Iran. Int. J. Environ. Res. 2015, 9, 281–290. [Google Scholar]
- Del Mar López, T.; Aide, T.M.; Thomlinson, J.R. Urban expansion and the loss of prime agricultural lands in Puerto Rico. Ambio J. Hum. Environ. 2001, 30, 49–54. [Google Scholar] [CrossRef]
- Pandey, B.; Seto, K.C. Urbanization and agricultural land loss in India: Comparing satellite estimates with census data. J. Environ. Manag. 2015, 148, 53–66. [Google Scholar] [CrossRef] [PubMed]
- Pribadi, D.O.; Pauleit, S. The dynamics of peri-urban agriculture during rapid urbanization of Jabodetabek Metropolitan Area. Land Use Pol. 2015, 48, 13–24. [Google Scholar] [CrossRef]
- Thapa, R.B.; Murayama, Y. Examining spatiotemporal urbanization patterns in Kathmandu Valley, Nepal: Remote sensing and spatial metrics approaches. Remote Sens. 2009, 1, 534–556. [Google Scholar] [CrossRef]
- Zhong, T.; Huang, X.; Zhang, X.; Wang, K. Temporal and spatial variability of agricultural land loss in relation to policy and accessibility in a low hilly region of southeast China. Land Use Pol. 2011, 28, 762–769. [Google Scholar]
- Richards, P.D.; Walker, R.T.; Arima, E.Y. Spatially complex land change: The Indirect effect of Brazil’s agricultural sector on land use in Amazonia. Glob. Environ. Chang. 2014, 29, 1–9. [Google Scholar] [CrossRef] [PubMed]
- Bai, X.; Shi, P.; Liu, Y. Society: Realizing China’s urban dream. Nature 2014, 509, 158–160. [Google Scholar] [CrossRef] [PubMed]
- Zhou, L.; Dickinson, R.E.; Tian, Y.; Fang, J.; Li, Q.; Kaufmann, R.K.; Tucker, C.J.; Myneni, R.B. Evidence for a significant urbanization effect on climate in China. Proc. Natl. Acad. Sci. USA 2004, 101, 9540–9544. [Google Scholar] [CrossRef] [PubMed]
- He, C.; Liu, Z.; Tian, J.; Ma, Q. Urban expansion dynamics and natural habitat loss in China: A multiscale landscape perspective. Glob. Chang. Biol. 2014, 20, 2886–2902. [Google Scholar] [CrossRef] [PubMed]
- Jiang, L.; Deng, X.; Seto, K.C. The impact of urban expansion on agricultural land use intensity in China. Land Use Pol. 2013, 35, 33–39. [Google Scholar] [CrossRef]
- Deng, X.; Huang, J.; Rozelle, S.; Zhang, J.; Li, Z. Impact of urbanization on cultivated land changes in China. Land Use Pol. 2015, 45, 1–7. [Google Scholar] [CrossRef]
- Tan, M.; Li, X.; Xie, H.; Lu, C. Urban land expansion and arable land loss in China—A case study of Beijing-Tianjin-Hebei region. Land Use Pol. 2005, 22, 187–196. [Google Scholar] [CrossRef]
- Liang, C.; Penghui, J.; Manchun, L.; Liyan, W.; Yuan, G.; Yuzhe, P.; Nan, X.; Yuewei, D.; Qiuhao, H. Farmland protection policies and rapid urbanization in China: A case study for Changzhou City. Land Use Pol. 2015, 48, 552–566. [Google Scholar] [CrossRef]
- Ma, L.; Guo, J.; Velthof, G.L.; Li, Y.; Chen, Q.; Ma, W.; Oenema, O.; Zhang, F. Impacts of urban expansion on nitrogen and phosphorus flows in the food system of Beijing from 1978 to 2008. Glob. Environ. Chang. 2014, 28, 192–204. [Google Scholar] [CrossRef]
- Fazal, S. Urban expansion and loss of agricultural land—A GIS based study of Saharanpur City, India. Environ. Urban. 2000, 12, 133–149. [Google Scholar] [CrossRef]
- Cao, X.; Chen, J.; Imura, H.; Higashi, O. A SVM-based method to extract urban areas from DMSP-OLS and SPOT VGT data. Remote Sens. Environ. 2009, 113, 2205–2209. [Google Scholar] [CrossRef]
- Ma, Q.; He, C.; Wu, J.; Liu, Z.; Zhang, Q.; Sun, Z. Quantifying spatiotemporal patterns of urban impervious surfaces in China: An improved assessment using nighttime light data. Landsc. Urban Plan. 2014, 130, 36–49. [Google Scholar] [CrossRef]
- Liu, J.; Liu, M.; Tian, H.; Zhuang, D.; Zhang, Z.; Zhang, W.; Tang, X.; Deng, X. Spatial and temporal patterns of China’s cropland during 1990–2000: An analysis based on Landsat TM data. Remote Sens. Environ. 2005, 98, 442–456. [Google Scholar] [CrossRef]
- Liu, J.; Zhang, Z.; Xu, X.; Kuang, W.; Zhou, W.; Zhang, S.; Li, R.; Yan, C.; Yu, D.; Wu, S. Spatial patterns and driving forces of land use change in China during the early 21st century. J. Geogr. Sci. 2010, 20, 483–494. [Google Scholar] [CrossRef]
- Shi, K.; Chen, Y.; Yu, B.; Xu, T.; Chen, Z.; Liu, R.; Li, L.; Wu, J. Modeling spatiotemporal CO2 (carbon dioxide) emission dynamics in China from DMSP-OLS nighttime stable light data using panel data analysis. Appl. Energy 2016, 168, 523–533. [Google Scholar] [CrossRef]
- Xie, Y.; Weng, Q. Detecting urban-scale dynamics of electricity consumption at Chinese cities using time-series DMSP-OLS (Defense Meteorological Satellite Program-Operational Linescan System) nighttime light imageries. Energy 2016, 100, 177–189. [Google Scholar] [CrossRef]
- Elvidge, C.D.; Ziskin, D.; Baugh, K.E.; Tuttle, B.T.; Ghosh, T.; Pack, D.W.; Erwin, E.H.; Zhizhin, M. A fifteen year record of global natural gas flaring derived from satellite data. Energies 2009, 2, 595–622. [Google Scholar] [CrossRef]
- Wu, J.; He, S.; Peng, J.; Li, W.; Zhong, X. Intercalibration of DMSP-OLS night-time light data by the invariant region method. Int. J. Remote Sens. 2013, 34, 7356–7368. [Google Scholar] [CrossRef]
- Liu, Z.; He, C.; Zhang, Q.; Huang, Q.; Yang, Y. Extracting the dynamics of urban expansion in China using DMSP-OLS nighttime light data from 1992 to 2008. Landsc. Urban Plan. 2012, 106, 62–72. [Google Scholar] [CrossRef]
- Pandey, B.; Joshi, P.; Seto, K.C. Monitoring urbanization dynamics in India using DMSP/OLS night time lights and SPOT-VGT data. Int. J. Appl. Earth Observ. Geoinf. 2013, 23, 49–61. [Google Scholar] [CrossRef]
- Shi, K.; Huang, C.; Yu, B.; Yin, B.; Huang, Y.; Wu, J. Evaluation of NPP-VIIRS night-time light composite data for extracting built-up urban areas. Remote Sens. Lett. 2014, 5, 358–366. [Google Scholar] [CrossRef]
- Elvidge, C.D.; Baugh, K.E.; Dietz, J.B.; Bland, T.; Sutton, P.C.; Kroehl, H.W. Radiance calibration of DMSP-OLS low-light imaging data of human settlements. Remote Sens. Environ. 1999, 68, 77–88. [Google Scholar] [CrossRef]
- Small, C.; Pozzi, F.; Elvidge, C.D. Spatial analysis of global urban extent from DMSP-OLS night lights. Remote Sens. Environ. 2005, 96, 277–291. [Google Scholar] [CrossRef]
- Elvidge, C.D.; Tuttle, B.T.; Sutton, P.C.; Baugh, K.E.; Howard, A.T.; Milesi, C.; Bhaduri, B.; Nemani, R. Global distribution and density of constructed impervious surfaces. Sensors 2007, 7, 1962–1979. [Google Scholar] [CrossRef]
- Sutton, P.C. A scale-adjusted measure of “urban sprawl” using nighttime satellite imagery. Remote Sens. Environ. 2003, 86, 353–369. [Google Scholar] [CrossRef]
- Su, Y.; Chen, X.; Wang, C.; Zhang, H.; Liao, J.; Ye, Y.; Wang, C. A new method for extracting built-up urban areas using DMSP-OLS nighttime stable lights: A case study in the Pearl River Delta, southern China. GISci. Remote Sens. 2015, 52, 218–238. [Google Scholar] [CrossRef]
- Su, Y.; Chen, X.; Ye, Y.; Wu, Q.; Zhang, H.O.; Huang, N.; Kuang, Y. The characteristics and mechanisms of carbon emissions from energy consumption in China using DMSP/OLS night light imageries. Acta Geogr. Sin. 2013, 68, 1513–1526. [Google Scholar]
- Yang, Y.; He, C.; Zhang, Q.; Han, L.; Du, S. Timely and accurate national-scale mapping of urban land in China using Defense Meteorological Satellite Program’s Operational Linescan System nighttime stable light data. J. Appl. Remote Sens. 2013, 7, 1–18. [Google Scholar] [CrossRef]
- Huang, Q.; He, C.; Gao, B.; Yang, Y.; Liu, Z.; Zhao, Y.; Dou, Y. Detecting the 20 year city-size dynamics in China with a rank clock approach and DMSP/OLS nighttime data. Landsc. Urban Plan. 2015, 137, 138–148. [Google Scholar] [CrossRef]
- Zhang, Q.; Seto, K.C. Mapping urbanization dynamics at regional and global scales using multi-temporal DMSP/OLS nighttime light data. Remote Sens. Environ. 2011, 115, 2320–2329. [Google Scholar] [CrossRef]
- The Land Use/Cover Classification Scheme (2006–2020) Developed by the Outline of the National Overall Planning on Land Use. Available online: http://www.mlr.gov.cn/xwdt/jrxw/200810/t20081024_111040.htm (accessed on 10 August 2016). (In Chinese)
- Ran, Y.; Li, X.; Lu, L. Evaluation of four remote sensing based land cover products over China. Int. J. Remote Sens. 2010, 31, 391–401. [Google Scholar] [CrossRef]
- Angel, S.; Sheppard, S.; Civco, D.L.; Buckley, R.; Chabaeva, A.; Gitlin, L.; Kraley, A.; Parent, J.; Perlin, M. The Dynamics of Global Urban Expansion; World Bank, Transport and Urban Development Department: Washington, DC, USA, 2005. [Google Scholar]
- Dadi, D.; Azadi, H.; Senbeta, F.; Abebe, K.; Taheri, F.; Stellmacher, T. Urban sprawl and its impacts on land use change in Central Ethiopia. Urban For. Urban Green. 2016, 16, 132–141. [Google Scholar] [CrossRef]
- Sharma, R.; Joshi, P. Mapping environmental impacts of rapid urbanization in the National Capital Region of India using remote sensing inputs. Urban Clim. 2016, 15, 70–82. [Google Scholar] [CrossRef]
- Dewan, A.M.; Yamaguchi, Y. Land use and land cover change in Greater Dhaka, Bangladesh: Using remote sensing to promote sustainable urbanization. Appl. Geogr. 2009, 29, 390–401. [Google Scholar] [CrossRef]
- Chen, J. Rapid urbanization in China: A real challenge to soil protection and food security. Catena 2007, 69, 1–15. [Google Scholar] [CrossRef]
- Qin, X.; Zhang, F.; Liu, C.; Yu, H.; Cao, B.; Tian, S.; Liao, Y.; Siddique, K.H. Wheat yield improvements in China: Past trends and future directions. Field Crop. Res. 2015, 177, 117–124. [Google Scholar] [CrossRef]
- Yan, T.; Wang, J.; Huang, J. Urbanization, agricultural water use, and regional and national crop production in China. Ecol. Model. 2015, 318, 226–235. [Google Scholar] [CrossRef]
- Yi, F.; Sun, D.; Zhou, Y. Grain subsidy, liquidity constraints and food security—Impact of the grain subsidy program on the grain-sown areas in China. Food Policy 2015, 50, 114–124. [Google Scholar] [CrossRef]


| Data | Data Description | Year | Source |
|---|---|---|---|
| NSL | Global nighttime stable light composite data | 2001, 2005, 2009, and 2013 | NOAA/NGDC (http://www.ngdc.noaa.gov/eog/dmsp.html) |
| MODIS–NDVI | Monthly NDVI composite data of China at 1 km resolution | 2001, 2005, 2009, and 2010 | Geospatial Data Cloud (http://www.gscloud.cn) |
| Water body | Shapefile of water in China | 2013 | ESRI Baruch Geoportal |
| TM/OLI–TIRS | Ten images covering six cities (Beijing, Tianjin, Shanghai, Chengdu, Wuhan and Hefei) at 30 m resolution | 2001 and 2013 | Geospatial Data Cloud (http://www.gscloud.cn) |
| NLC | National land cover/use data at 1 km resolution in China | 2000 | National Data Sharing Infrastructure of Earth System Science (http://www2.geodata.cn/index.html) |
| Socioeconomic census data | Annual statistical data of two types—GDP (108 Yuan) and grain production (104 t) in China | 2001, 2005, 2009, and 2013 | The Statistical Database of Economic and Social Development by the National Knowledge Infrastructure of China (http://tongji.cnki.net) |
| Administrative boundaries | Shape files of provinces, cities in China | 2008 | National Geomatics Center of China (http://ngcc.sbsm.gov.cn/article/en/or/an/) |
| Year | Index | Beijing | Tianjin | Shanghai | Chengdu | Wuhan | Hefei |
|---|---|---|---|---|---|---|---|
| 2001 | Kappa | 0.62 | 0.60 | 0.62 | 0.56 | 0.63 | 0.66 |
| OA (%) | 95.22 | 95.34 | 89.78 | 98.51 | 96.73 | 98.75 | |
| CE (%) | 1.62 | 1.38 | 3.22 | 0.25 | 0.55 | 0.11 | |
| OE (%) | 3.17 | 3.27 | 7.00 | 1.24 | 2.72 | 1.15 | |
| 2013 | Kappa | 0.61 | 0.62 | 0.62 | 0.67 | 0.65 | 0.74 |
| OA (%) | 90.46 | 89.75 | 82.96 | 94.89 | 93.43 | 97.15 | |
| CE (%) | 5.33 | 4.55 | 9.24 | 2.36 | 2.54 | 0.85 | |
| OE (%) | 4.21 | 5.70 | 7.80 | 2.75 | 4.02 | 2.00 | |
| Average | Kappa | 0.61 | 0.61 | 0.62 | 0.61 | 0.64 | 0.70 |
| OA (%) | 92.84 | 92.55 | 86.37 | 96.70 | 95.08 | 97.95 | |
| CE (%) | 3.47 | 2.96 | 6.23 | 1.30 | 1.55 | 0.48 | |
| OE (%) | 3.69 | 4.49 | 7.40 | 2.00 | 3.37 | 1.57 |
| Administrative Unit | Total Land Area (km2) | Agricultural Land in 2000 | Urban Expansion from 2001 to 2013 | Agricultural Land Loss from 2001 to 2013 | |||
|---|---|---|---|---|---|---|---|
| Area (km2) | Percentage (%) | Area (km2) | Percentage (%) | Area (km2) | Percentage (%) | ||
| Eastern region | 1,684,856 | 1,547,427 | 91.84 | 28,463 | 1.69 | 18,542 | 1.10 |
| Central region | 1,027,217 | 951,166 | 92.60 | 7736 | 0.75 | 5276 | 0.51 |
| Western region | 6,725,648 | 4,574,035 | 68.01 | 13,612 | 0.20 | 9262 | 0.14 |
| SNH | 95,097 | 77,261 | 81.24 | 6787 | 7.14 | 4728 | 4.97 |
| BTT | 4048 | 32,718 | 76.00 | 2907 | 6.75 | 1680 | 3.90 |
| PRD | 52,556 | 44,636 | 84.93 | 4387 | 8.35 | 2702 | 5.14 |
| CDM | 39,833 | 38,112 | 95.68 | 939 | 2.36 | 666 | 1.67 |
| ZLJ | 26,759 | 24,177 | 90.35 | 928 | 3.47 | 580 | 2.17 |
| WEH | 14,731 | 11,166 | 75.80 | 592 | 4.02 | 325 | 2.21 |
© 2016 by the authors; licensee MDPI, Basel, Switzerland. This article is an open access article distributed under the terms and conditions of the Creative Commons Attribution (CC-BY) license (http://creativecommons.org/licenses/by/4.0/).
Share and Cite
Shi, K.; Chen, Y.; Yu, B.; Xu, T.; Li, L.; Huang, C.; Liu, R.; Chen, Z.; Wu, J. Urban Expansion and Agricultural Land Loss in China: A Multiscale Perspective. Sustainability 2016, 8, 790. https://doi.org/10.3390/su8080790
Shi K, Chen Y, Yu B, Xu T, Li L, Huang C, Liu R, Chen Z, Wu J. Urban Expansion and Agricultural Land Loss in China: A Multiscale Perspective. Sustainability. 2016; 8(8):790. https://doi.org/10.3390/su8080790
Chicago/Turabian StyleShi, Kaifang, Yun Chen, Bailang Yu, Tingbao Xu, Linyi Li, Chang Huang, Rui Liu, Zuoqi Chen, and Jianping Wu. 2016. "Urban Expansion and Agricultural Land Loss in China: A Multiscale Perspective" Sustainability 8, no. 8: 790. https://doi.org/10.3390/su8080790
APA StyleShi, K., Chen, Y., Yu, B., Xu, T., Li, L., Huang, C., Liu, R., Chen, Z., & Wu, J. (2016). Urban Expansion and Agricultural Land Loss in China: A Multiscale Perspective. Sustainability, 8(8), 790. https://doi.org/10.3390/su8080790