Article

Towards a Climate-Responsive Vertical Pedestrian System: An Empirical Study on an Elevated Walkway in Shanghai China

1
College of Architecture and Urban Planning (CAUP), Tongji University, Shanghai 200092, China
2
Key Laboratory of Ecology and Energy-Saving Study of Dense Habitat, Ministry of Education, Tongji University, Shanghai 200092, China
*
Author to whom correspondence should be addressed.
Sustainability 2016, 8(8), 744; https://doi.org/10.3390/su8080744
Submission received: 12 June 2016 / Revised: 26 July 2016 / Accepted: 28 July 2016 / Published: 4 August 2016
(This article belongs to the Special Issue Urban Heat Island)

Abstract

:
Elevated walkways can bring pedestrian-friendly urban space back to high-density urban centers that are planned largely for vehicle traffic—for instance, the Lujiazui CBD in Shanghai. Most studies on elevated walkways have focused on transportation planning, structural safety as well as urban form and design. Few have paid attention to thermal conditions and pedestrian comfort issues on elevated levels. Considering all of the environmental factors that influence human thermal comfort, one could claim that there will be more breezes on elevated levels compared to sidewalks at the ground levels, but they can be exposed to increased solar radiation and thus higher radiant temperatures, if not properly shaded. The overall effect of the change in elevation on human thermal comfort is thus unknown. This study attempts to investigate the microclimate and human thermal comfort of a recently completed Lujiazui Elevated Walkway (LEW) system in the Lujiazui CBD, Shanghai, under a hot-humid sub-tropical climate. Micrometeorological measurements and a guided questionnaire survey were carried out on peak summer days. The data analysis indicates that the LEW is thermally more uncomfortable than its ground level counterpart. Air temperature was higher, whereas wind velocity is lower on the skywalk level than on the ground level, which is counter-intuitive. The resultant physiological equivalent temperature (PET) indicates warm conditions on the ground level (with good shading) while there are hot conditions on the skywalk. Based on the empirical findings, design strategies are proposed to improve the thermal comfort conditions on the LEW, and to better support pedestrian activities in this typical high-rise high-density urban area.

Graphical Abstract

1. Introduction

Elevated walkways are an effective way to connect isolated buildings, enhance their accessibility, and vitalize commercial spaces at the elevated level. In high-density urban areas, carefully-designed skywalk systems create a relatively pedestrian-friendly environment by distancing people from vehicle pollution and noise. Therefore, it has the potential to create safe and comfortable public space for social activities amidst busy urban centers. Currently, it seems that most studies on the subject of elevated walkway have been carried out from the perspective of transportation planning, structural safety or urban form and visual impact [1,2,3]. Few have paid attention to thermal conditions and pedestrian comfort issues on the elevated pedestrian level. It is reasonable to acclaim that it will be likely to have more breezes on the elevated levels compared to sidewalks at the ground levels [4], but it can be exposed to increased solar radiation and thus higher radiant temperature, if not properly shaded. The overall effect of a change in elevation on human thermal comfort is thus unknown. This study aims to investigate the microclimate and human thermal comfort of a recently completed elevated walkway system in the Lujiazui CBD in Shanghai, a large city on the southeastern coast of China and under a hot-humid sub-tropical climate.
Elevated walkways (referred to as EW, hereafter) can be defined as “networks of above-grade connections between buildings that are often enclosed and climate controlled, and which link second-level corridors within buildings and various activity hubs, such as shops and offices” [5] (p. 11). There are other terms such as pedestrian skywalks, skyway systems, etc. These generally refer to the same object. In central urban areas, an EW system can facilitate pedestrian movement, improve accessibility to isolated urban buildings, protect pedestrians from vehicle pollution and noise, and provide shelter under adverse climate conditions, all contributing to a more pedestrian-friendly urban environment. There are some debates on whether or not EW systems will ruin street life in western cities [4]. In Asian cities, where population density is much higher, EW systems can greatly relieve the burden of crowded sidewalks on the ground levels. In some cases, it can help rebuild the pedestrian network, which will otherwise not work due to vehicle-oriented urban planning, for instance, the EW system in the Lujiazui CBD of Shanghai.
Famous examples of EW systems include the skyway in Minneapolis, Minnesota, USA and pedestrian skywalks in Calgary, Canada. These are both North American cities with cold climates featuring long and freezing winters [2]. EW systems can also be found in Central Hong Kong [6] and Zhujiang New District, Guangzhou, China [7], both under hot-humid sub-tropical climates. In contrary to the fully-enclosed “tube” form in cold climates, EWs in warm and hot climates normally keep railings and overhangs where necessary for the sake of safety and protection, and open other surfaces to the ambient environment as much as possible, so as to enjoy natural ventilation while protecting pedestrians from summer sun and rain. Note that the EW system in some extreme climates (e.g., tropical climates) can be completely enclosed and fully air-conditioned [8]. This paper will confine the discussion on naturally ventilated EWs that prevail in sub-tropical Asian cities.
Pedestrian thermal comfort is well studied at the ground level, for instance, from the perspective of wind safety and comfort [9,10], thermal comfort and urban design in response to local climate [11,12]. However, studies focusing on thermal comfort on an elevated level seem very limited, if any. It is well known that human thermal comfort is influenced by environmental factors including air temperature and humidity, air movement and radiant temperature, and personal factors including clothing level and metabolic rate [13]. At the micro-local scale, urban geometry, fabric and surface materials can influence thermal comfort by moderating the abovementioned biometeorological parameters. For instance, a study on the thermal comfort impact of street greenery in the Netherlands indicates that 10% tree cover in a street could lower mean radiant temperature by 1 K [14]. A field study in Curitiba, Brazil found that urban geometry and street canyon orientation, quantified by sky view factor (SVF), is significantly related to daytime heat island intensity and radiant temperature [15]. A study on microclimate in urban open spaces in Greece reveals the significant impact of surface material on local temperature and thermal comfort [16]. Compared with sidewalks at ground level, elevated walkways may be able to enjoy better ventilation but may also be exposed to more solar heat gain, and the composite effect is affected by surrounding urban geometry, fabric and materials. It will be useful to investigate the relationship between variables of built environment and thermal comfort indices, so as to inform future EW design to achieve a more comfortable pedestrian environment.

2. Materials and Methods

The Lujiazui Elevated Walkway (LEW) is chosen as the case of the empirical study (Figure 1). LEW is located in the Small Lujiazui CBD area. The purpose of introducing walkways at such a large scale is to improve the pedestrian environment for office commuters and tourists. The LEW comprises four parts, i.e., Oriental-Pearl Ring, Century Floating Pavilion, Century Sky Bridge and Century Corridor. The length in total is 1373 m. The width ranges from 9.1 m to 10.1 m (excluding enlarged plazas near subway entrance). Elevation is 8 m above ground. Construction is reinforced concrete and steel. The LEW connects all of the entrances of Lujiazui Station, Shanghai Metro Line 2, as well as five major large buildings: Super Brand Mall (a retail-recreational complex); Century floating pavilion (retail and restaurant); Shanghai International Financial Center (IFC) (retail and office), Jinmao Tower (retail and office), and Shanghai World Financial Center (SWFC) (retail and office).
Micrometeorological measurement was carried out on 17, 18 and 22 July 2014. Seven pairs of measurement points were chosen, representing various scenarios of urban morphology on the walkway, and, on the sidewalk level, surface material, degree of space enclosure, green coverage, and degree of shading. Among them, four pairs of measurement points are selected to compare the effect of various shading devices on thermal comfort moderation. The two points in each pair are horizontally close to each other in order to control un-measured effects of other thermal factors. Points with a prefix “A-” are located over the LEW, whereas points with a prefix “B-” are located under the LEW. These include A2 (in middle of the walkway and un-shaded) vs. A2′ (under a steel-glass constructed canopy), A3 (center of an elevated plaza near subway entrance) vs. A3′ (the seat-and-rest area around the plaza, under a steel-glass constructed canopy), B2 (under a tree canopy) vs. B2′ (directly under the LEW), and B3 (near the subway entrance, un-shaded) vs. B3′ (a small pedestrian rest area under and shaded by the LEW) (Figure 2a). Two pedestrian routes connect measurement points at the elevated level and at the ground level, respectively (Figure 2b).
Four rounds of traverse measurements covering all points were carried out during four periods per day: 8 a.m.–9:30 a.m., 10 a.m.–11:30 a.m., 2:30 p.m.–4:00 p.m., and 4:30 p.m. to 6:00 p.m., recording four rounds of air temperature, relative humidity, wind velocity and globe temperature using a portable micro-weather station. A reference station was set up on the open grass lawn of LZJ Central Green. During 8 a.m.–6 p.m., it continuously recorded global solar radiation and wind direction, in addition to the above-mentioned parameters (Table 1).
Mean radiant temperature (MRT) is calculated based on air temperature, relative humidity, wind velocity and globe temperature, according to the method given by [17]. Globe temperature is measured by a temperature sensor placed on the center of a 40 mm-diameter matt-grey table-tennis ball [18]. The equation is as below (Equation (1)):
MRT = [ ( t g + 273.15 ) 4   +   1.1 × 10 8 V a 0.6 ε D 0.4   ×   ( t g t a ) ] 0.25 273.15
where ta is air temperature(in °C), tg is globe temperature (in °C), Va is the air velocity at the level of the globe (in m/s), ε is the emissivity of the black globe (without dimension), D is the diameter of the globe (in meters).
The physiological equivalent temperature (PET) is a bio-meteorological index to measure human outdoor thermal comfort [19]. It takes into account all of the relevant environmental factors (air temperature, air velocity, humidity and mean radiant temperature) while assuming constant clothing and metabolic level. It can be calculated using the method given by Matzarakis et al. [20].
A questionnaire survey was conducted based on guided interviews with LEW users, in order to gather information on subjective evaluation and perception of the respondents on the comfort effect of the ground-level, LEW level and reference level environments.
The guided interview and questionnaire survey were carried out during the period of micrometeorological measurement. Firstly, the demographical information, including age, gender, residence status, clothing level, physical activity level of the respondents at 15 min ago, etc. were recorded. Then, three meteorological parameters (air temperature, Ta, relative humidity RH and wind velocity WV) were subjectively evaluated, followed by a subjective evaluation on personal acceptability towards thermal and wind environments based on the seven-scale thermal sensation vote (TSV) and four-scale wind perception. Evaluation on thermal comfort is based on five-point scales (i.e., 0: comfortable; −1: slightly uncomfortable; −2: uncomfortable; −3: very uncomfortable, and −4: unendurable). In total, 111 respondent questionnaires were collected, among them 45 from above the LEW, 49 from below the LEW and 17 from the Lujiazui Central Green (LCG) (reference station).

3. Results

Micrometeorological conditions at Lujiazui reference station, i.e., Central Green station (CGS), are briefly described below. It can be seen from Table 2 and Figure 3 that, during the measurement period, the prevailing wind direction at the LJZ urban area is from the Southeast (90–180 degree). The hourly-mean wind velocity ranges from 0.7 to 1.0 m/s. Mean air temperature exceeded 30 °C even in the early morning (around 8:30 a.m.) and reached as high as 34 °C during the afternoon (between 3:00 to 3:30 p.m.).

3.1. Comparisons between, over, and under LEW

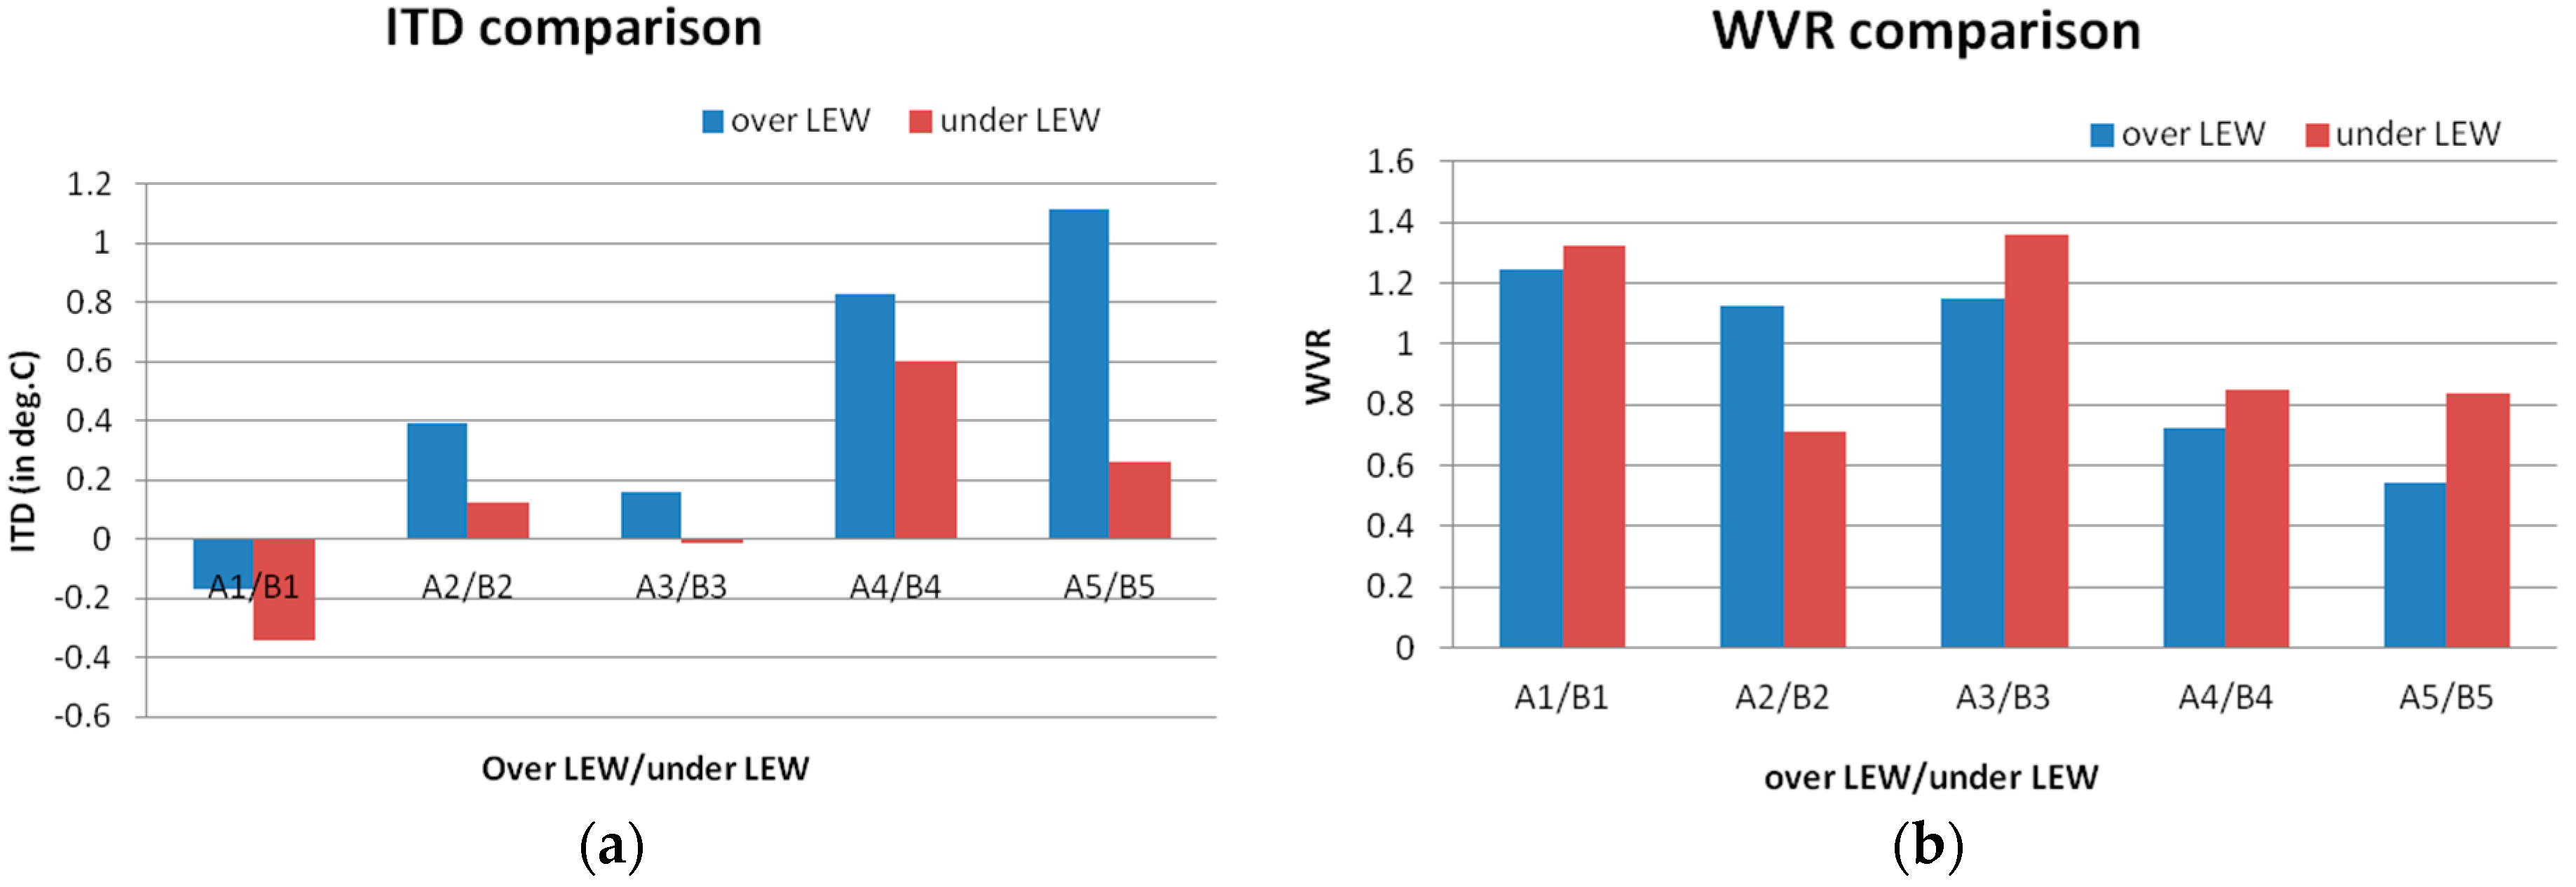
3.1.1. ITD and WVR Comparison

Inter-urban Temperature Differential (ITD) is the air temperature differential between measurement points and the Lujiazui Central Green Station (CGS). Wind Velocity Ratio (WVR) is the ratio of wind velocity at measurement points to that at the CGS.
Not surprisingly, ITD is higher at the points over LEW than those under LEW, due to less shading and thus more solar heat gain. However, it is counter-intuitive to find that WVR over LEW is generally lower than that under LEW (Figure 4).

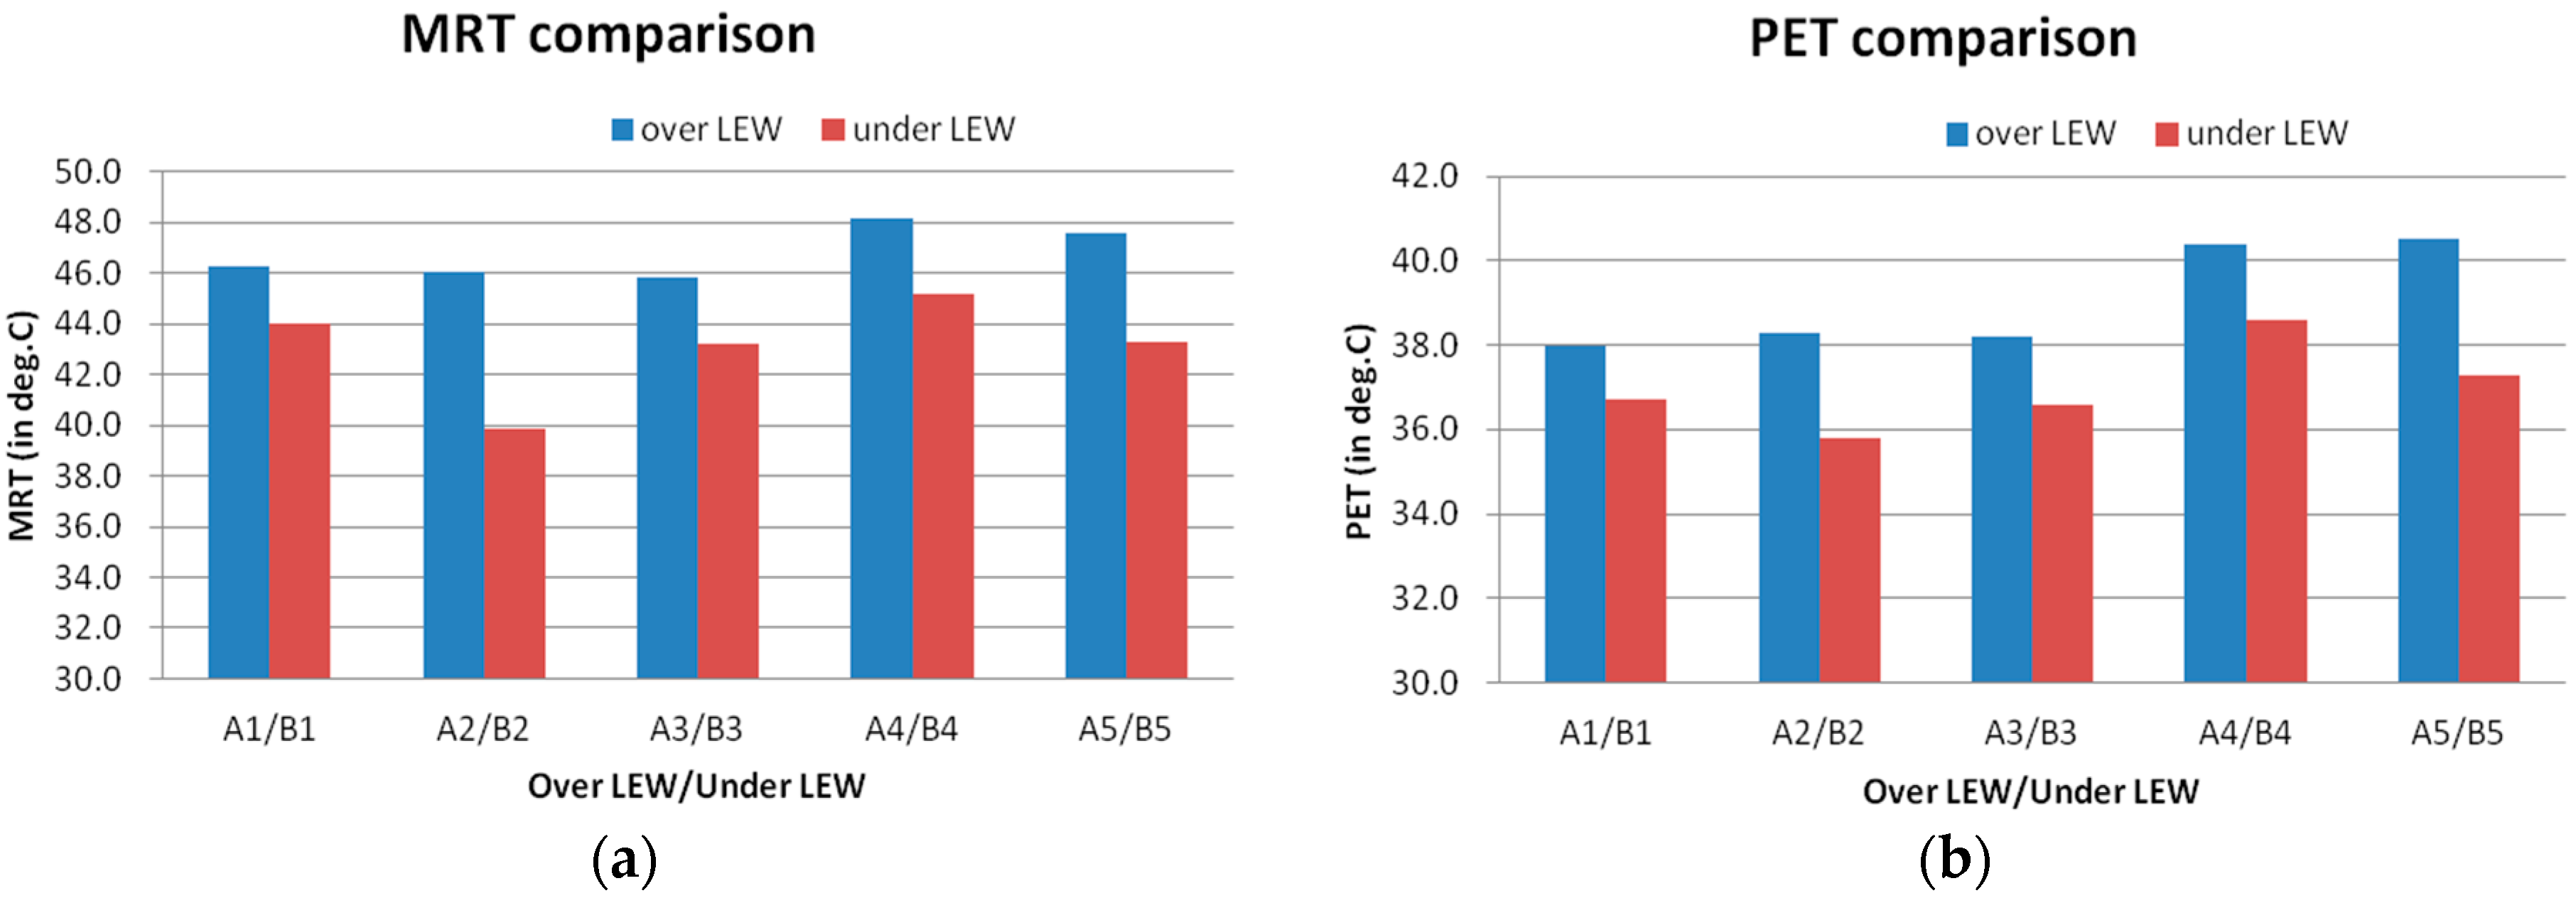
3.1.2. MRT and PET Comparison

The MRT values are all higher at the over-LEW points than their counter-points under LEW, on the order of 2–6 °C, as are the PET values. The differences of PET are on the order of 1–3 °C (Figure 5). According to the criteria given by [17], all of the points are hot (35–41 °C) during the measurement period, but clearly it was less uncomfortable under the LEW than over it.

3.2. Comparison between Shaded and Un-Shaded

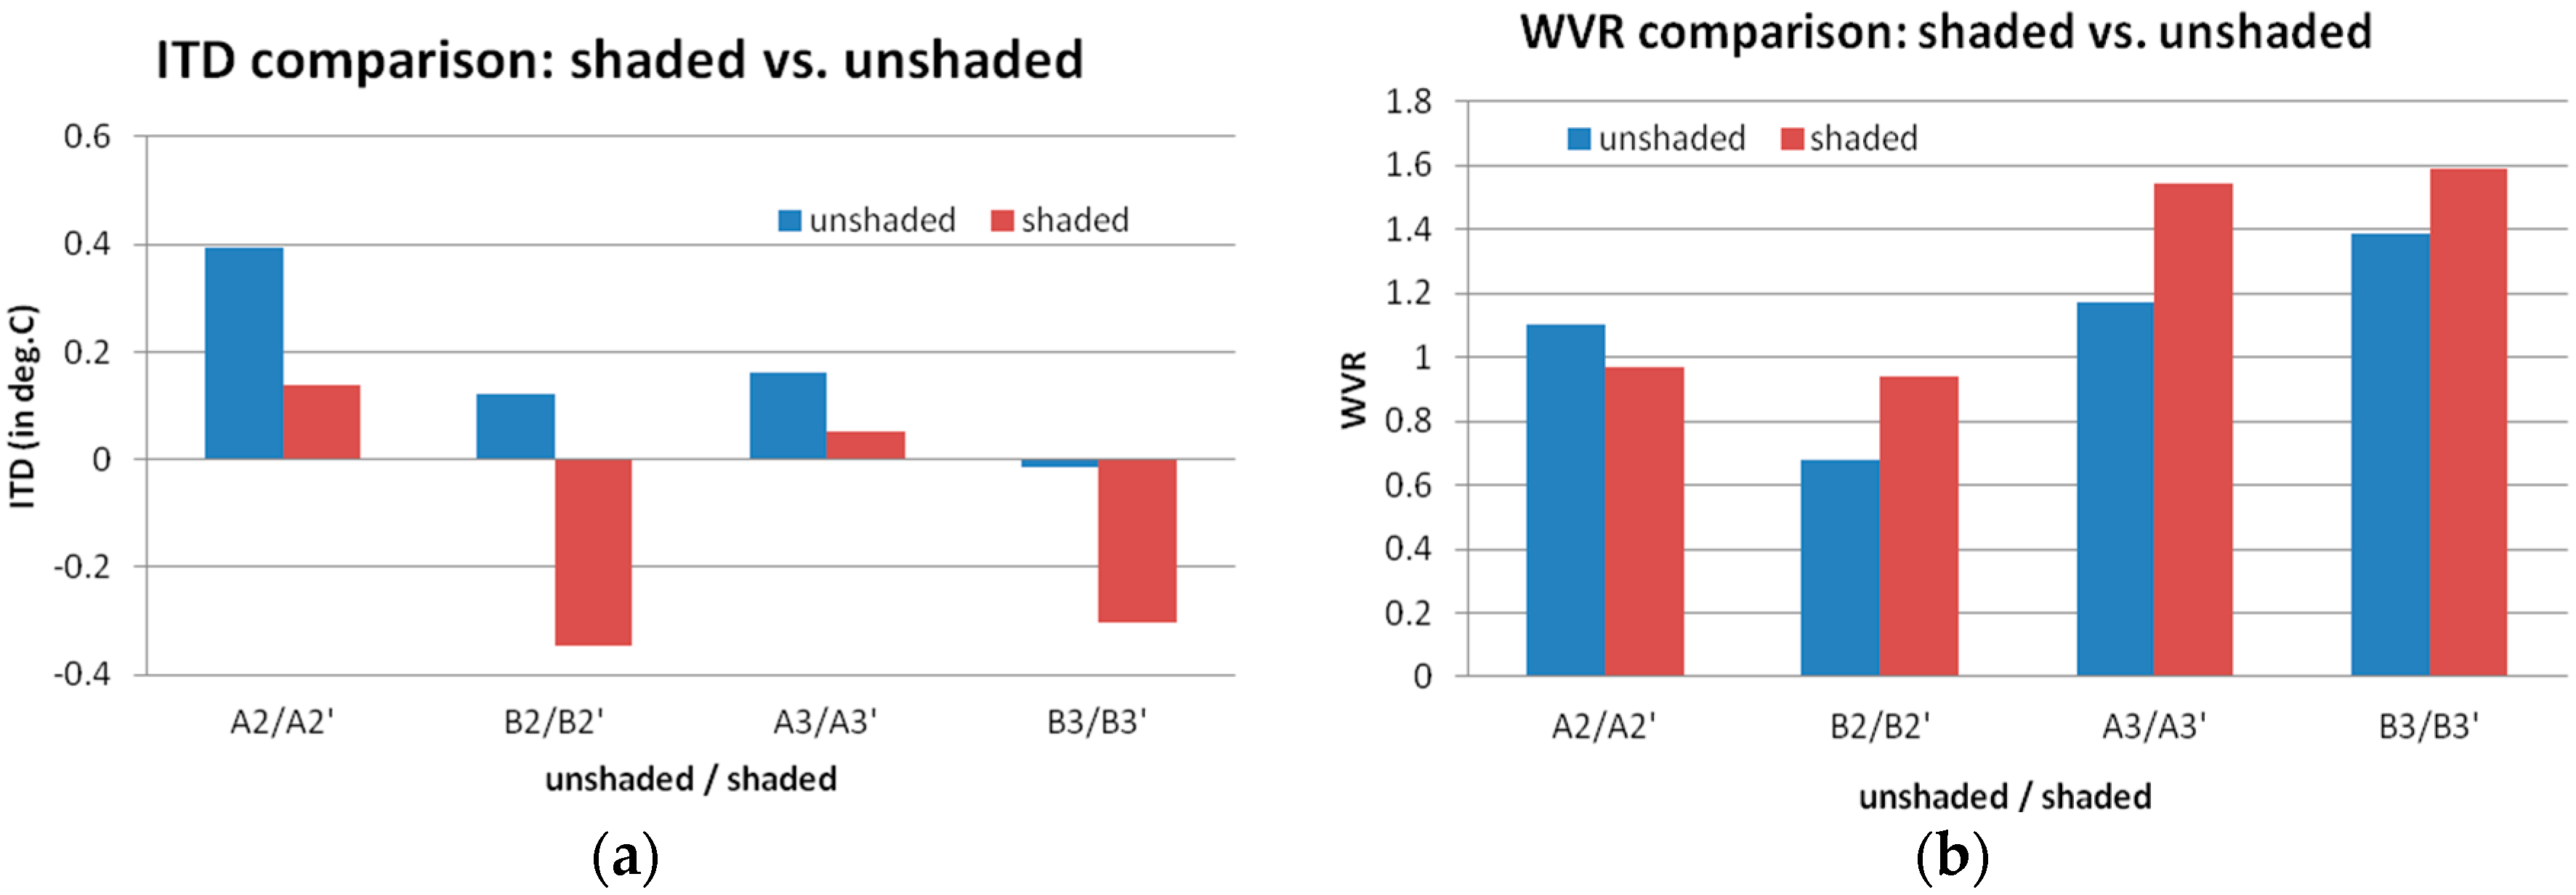
3.2.1. ITD and WVR Comparison

As shown in Figure 6, all shaded points showed lower ITD values, compared to the un-shaded counterpart points. The differences range from 0.2 to 0.5 °C. The two shaded points at the ground level (B2’ and B3’) are markedly cooler than the reference Central Green station. Glass-shading demonstrated a clear effect on Ta reduction (A2’ and A3’), in the range of 0.1–0.3 °C, whereas the cooling effect by the LEW structure was higher (B2′ and B3’), on the order of 0.3–0.5 °C. The point under the LEW (B2’) was clearly cooler than the point under a tree (B2). This is because a tree canopy, depending on the canopy geometry and leaf density, intercepts only a portion of incoming direct solar radiation, compared to the opaque structure of LEW. Regarding WVR, similar to the previous section, shaded points enjoyed higher WVR than their un-shaded counterpart points, except for A2/A2’. As discussed previously, this can be caused by vertical thermal buoyancy and horizontal displacement ventilation between ground surfaces with different degrees of solar heating.

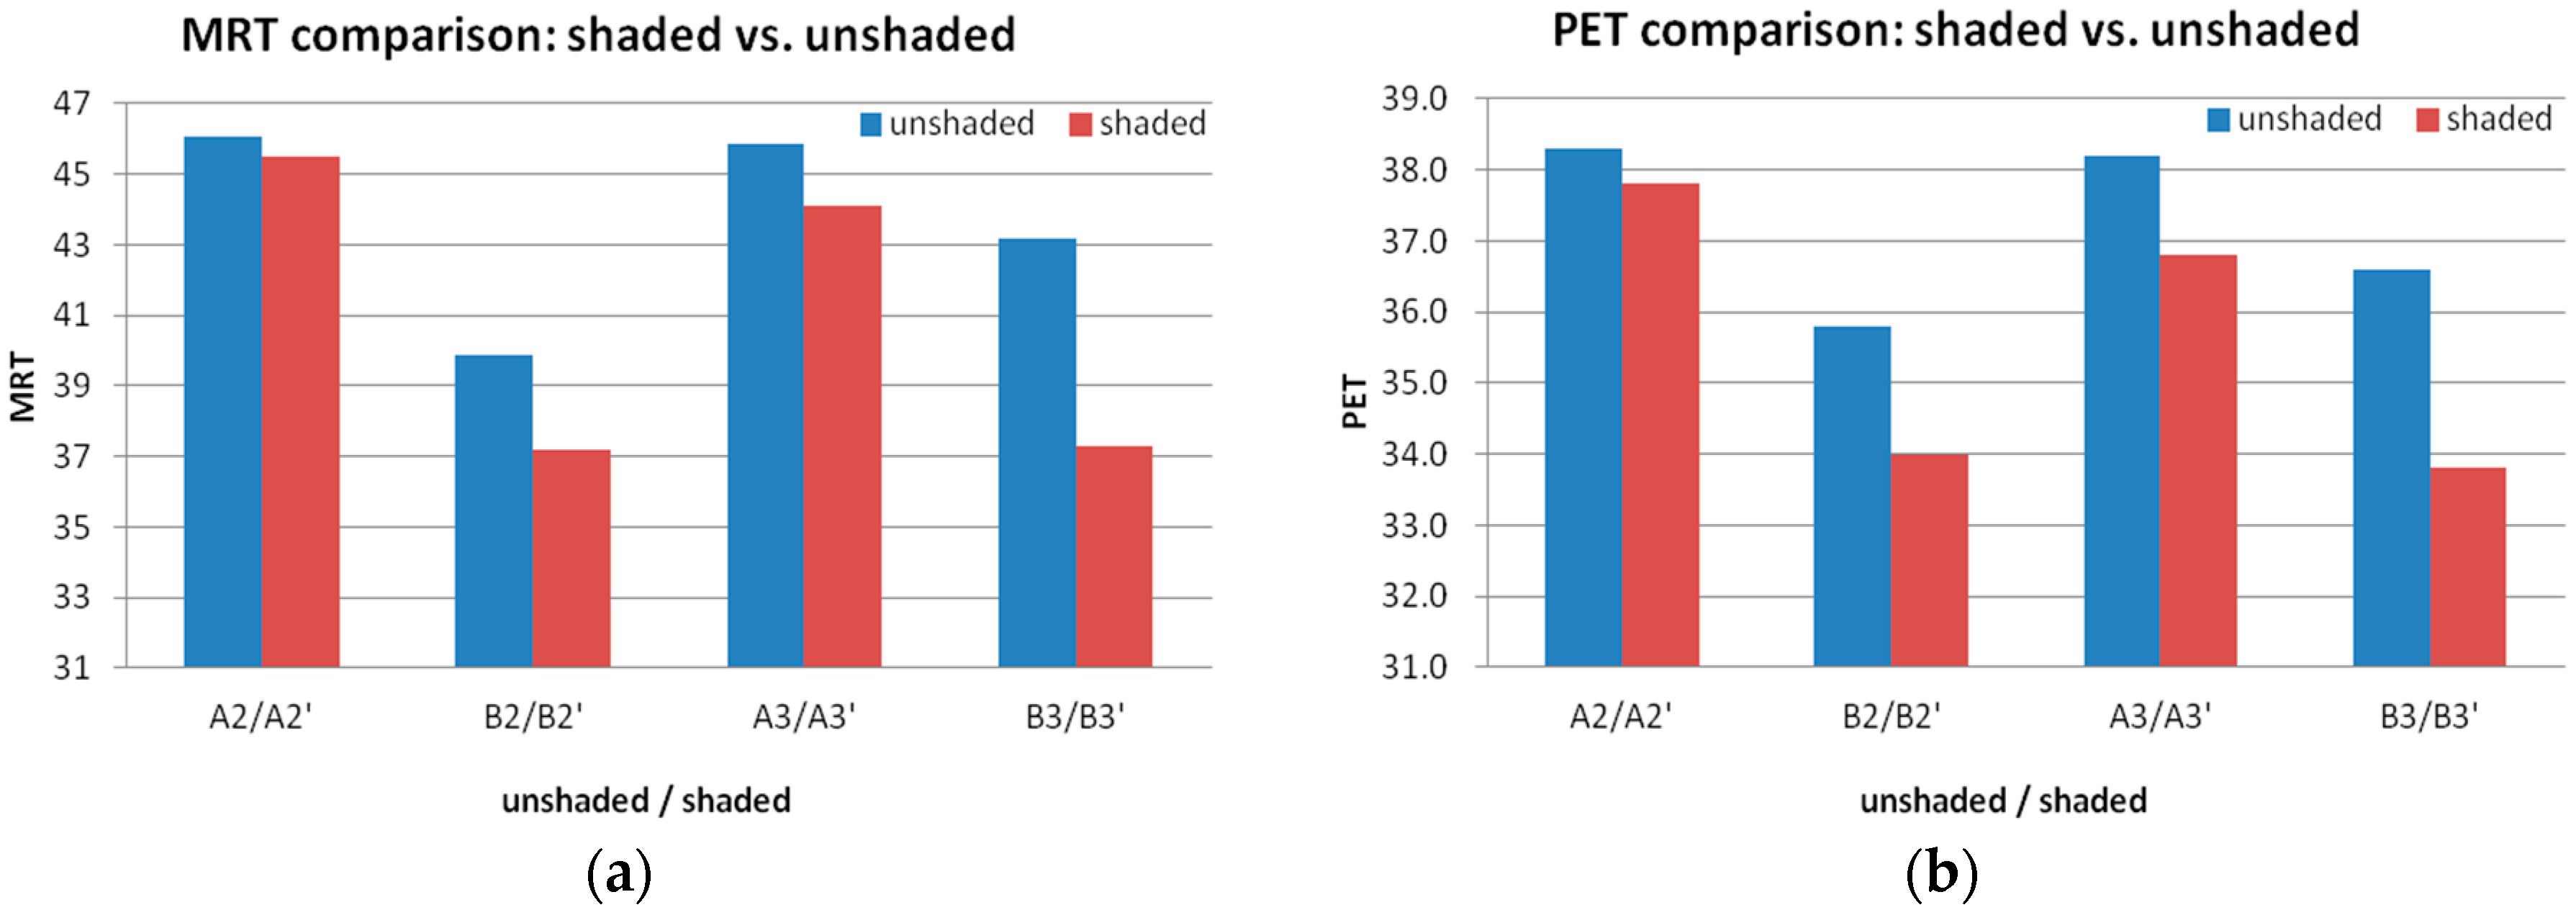
3.2.2. MRT and PET Comparison

As shown in Figure 7, the cooling effect of different shading devices becomes even clearer in MRT comparison: the glass-steel canopy showed limited MRT reduction, on the order of 0.5–1.5 °C. On the contrary, solid shading devices (elevated walkway in this case) lowered MRT by nearly 3 °C compared to a tree canopy shading (B2), and by about 6 °C compared to un-shaded places (B3). The PET comparison has a similar pattern with MRT. The two points under the LEW (B2’ and B3’) are classified as “warm” (29–35 °C in PET) while all other points are classified “hot” (35–41 °C in PET), including the tree-shading point (B2) and two points under the semi-transparent canopy (A2′ and A3′).

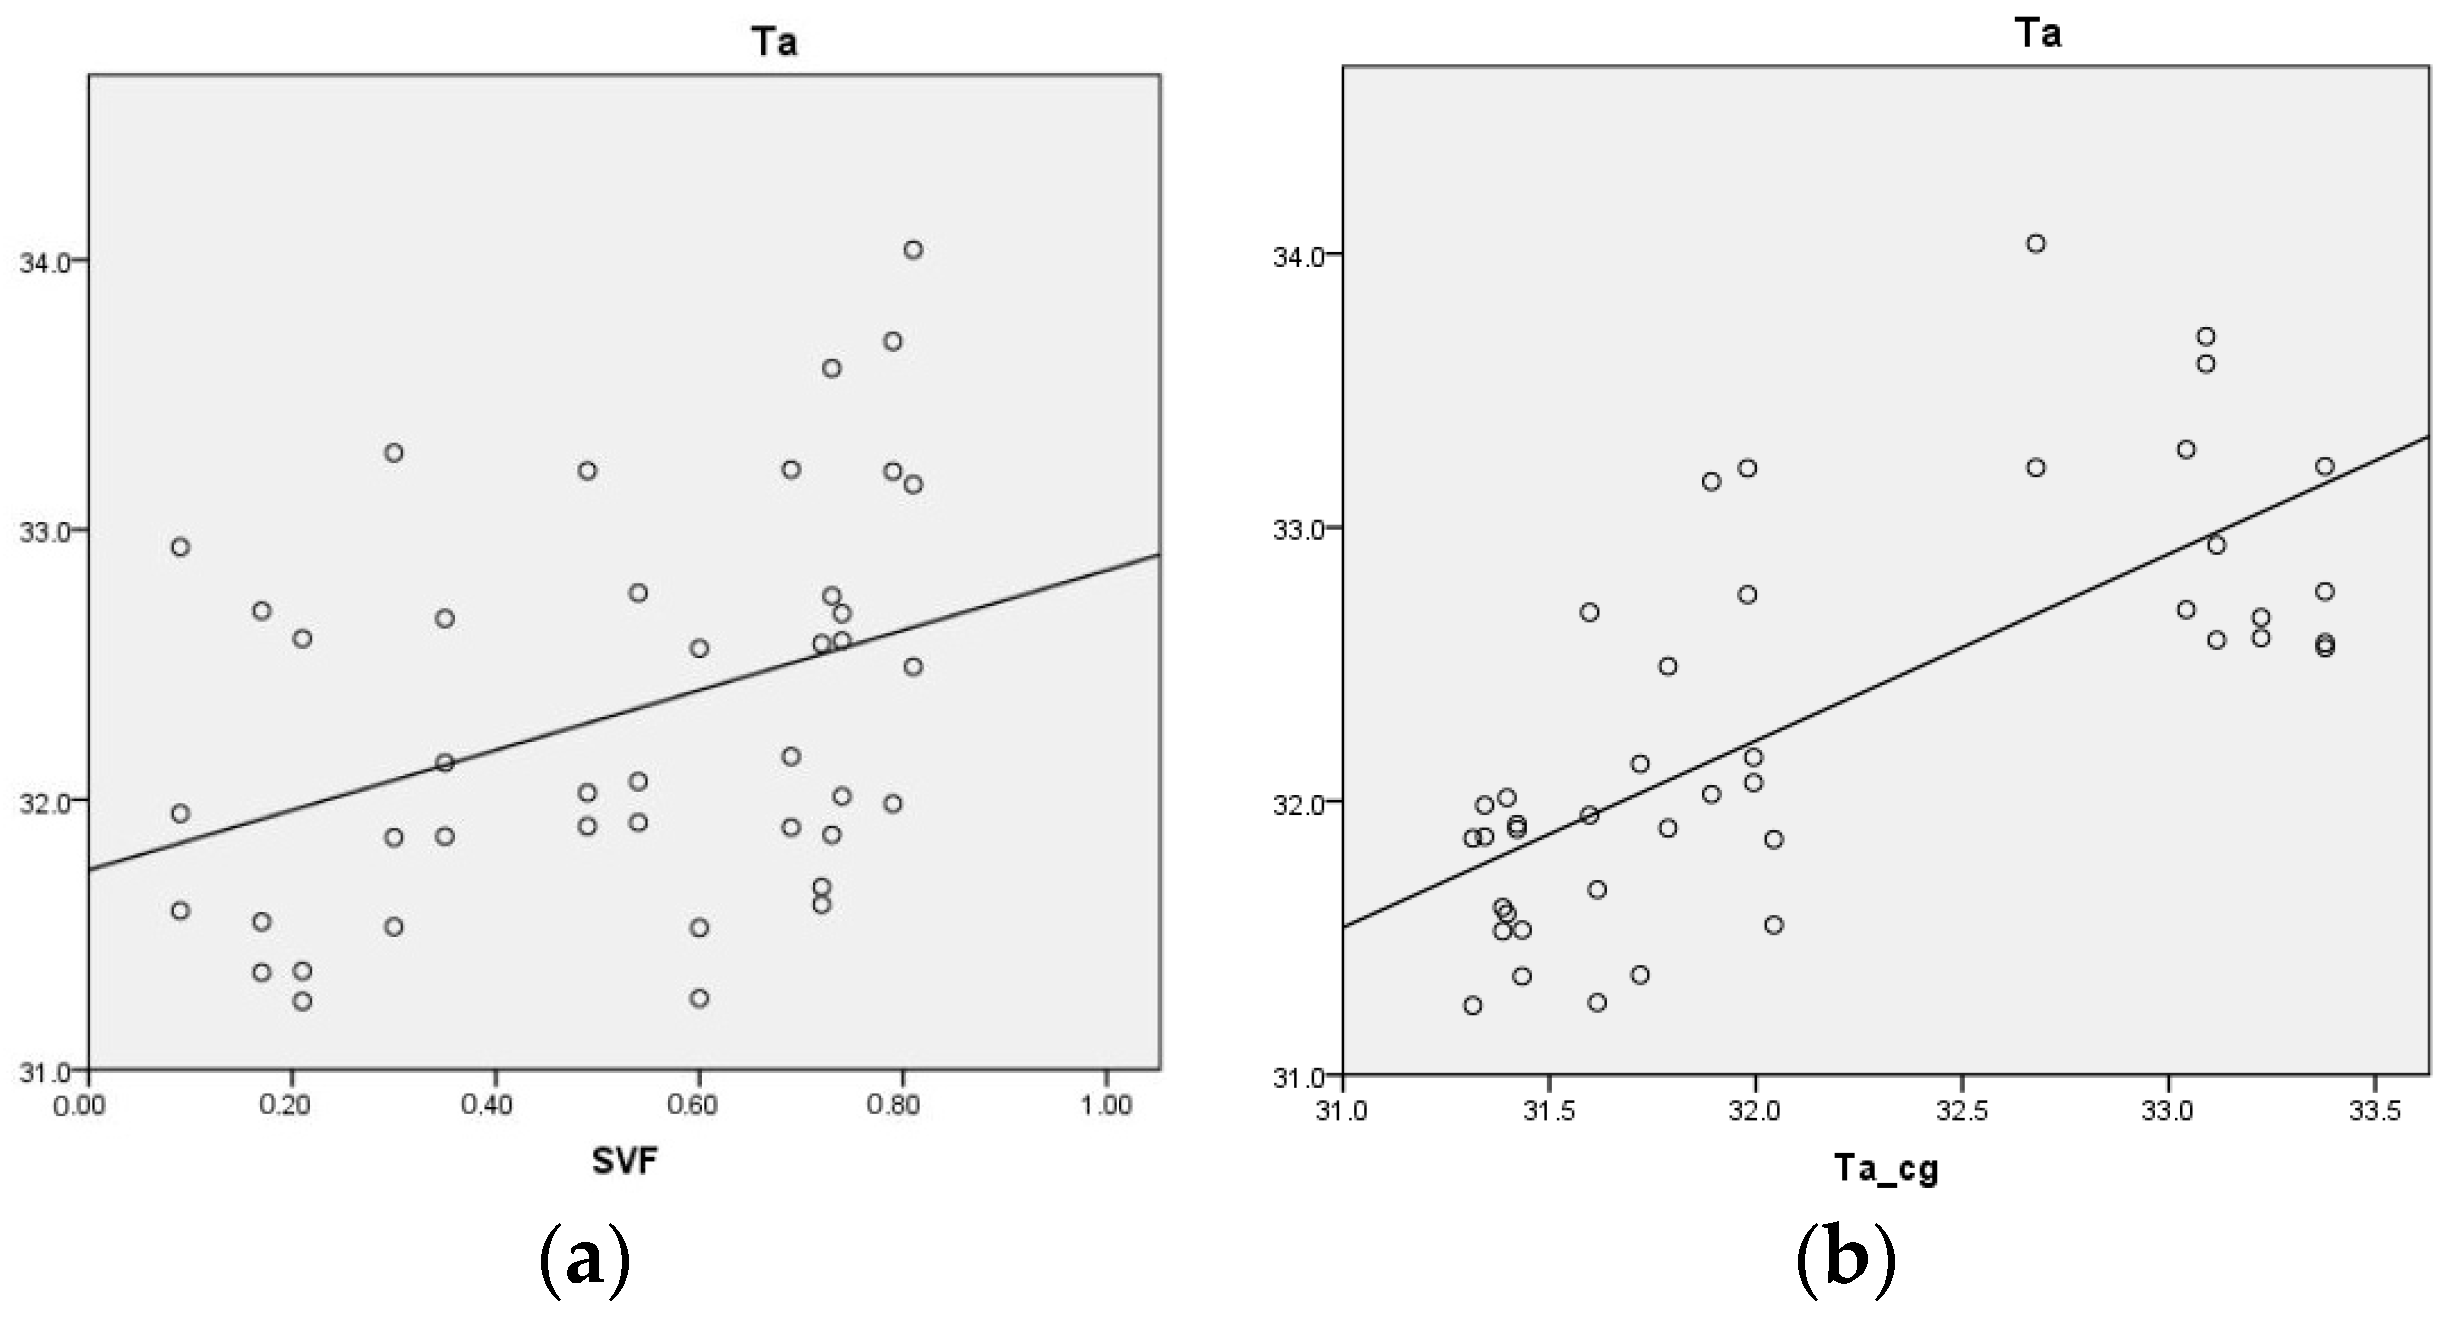
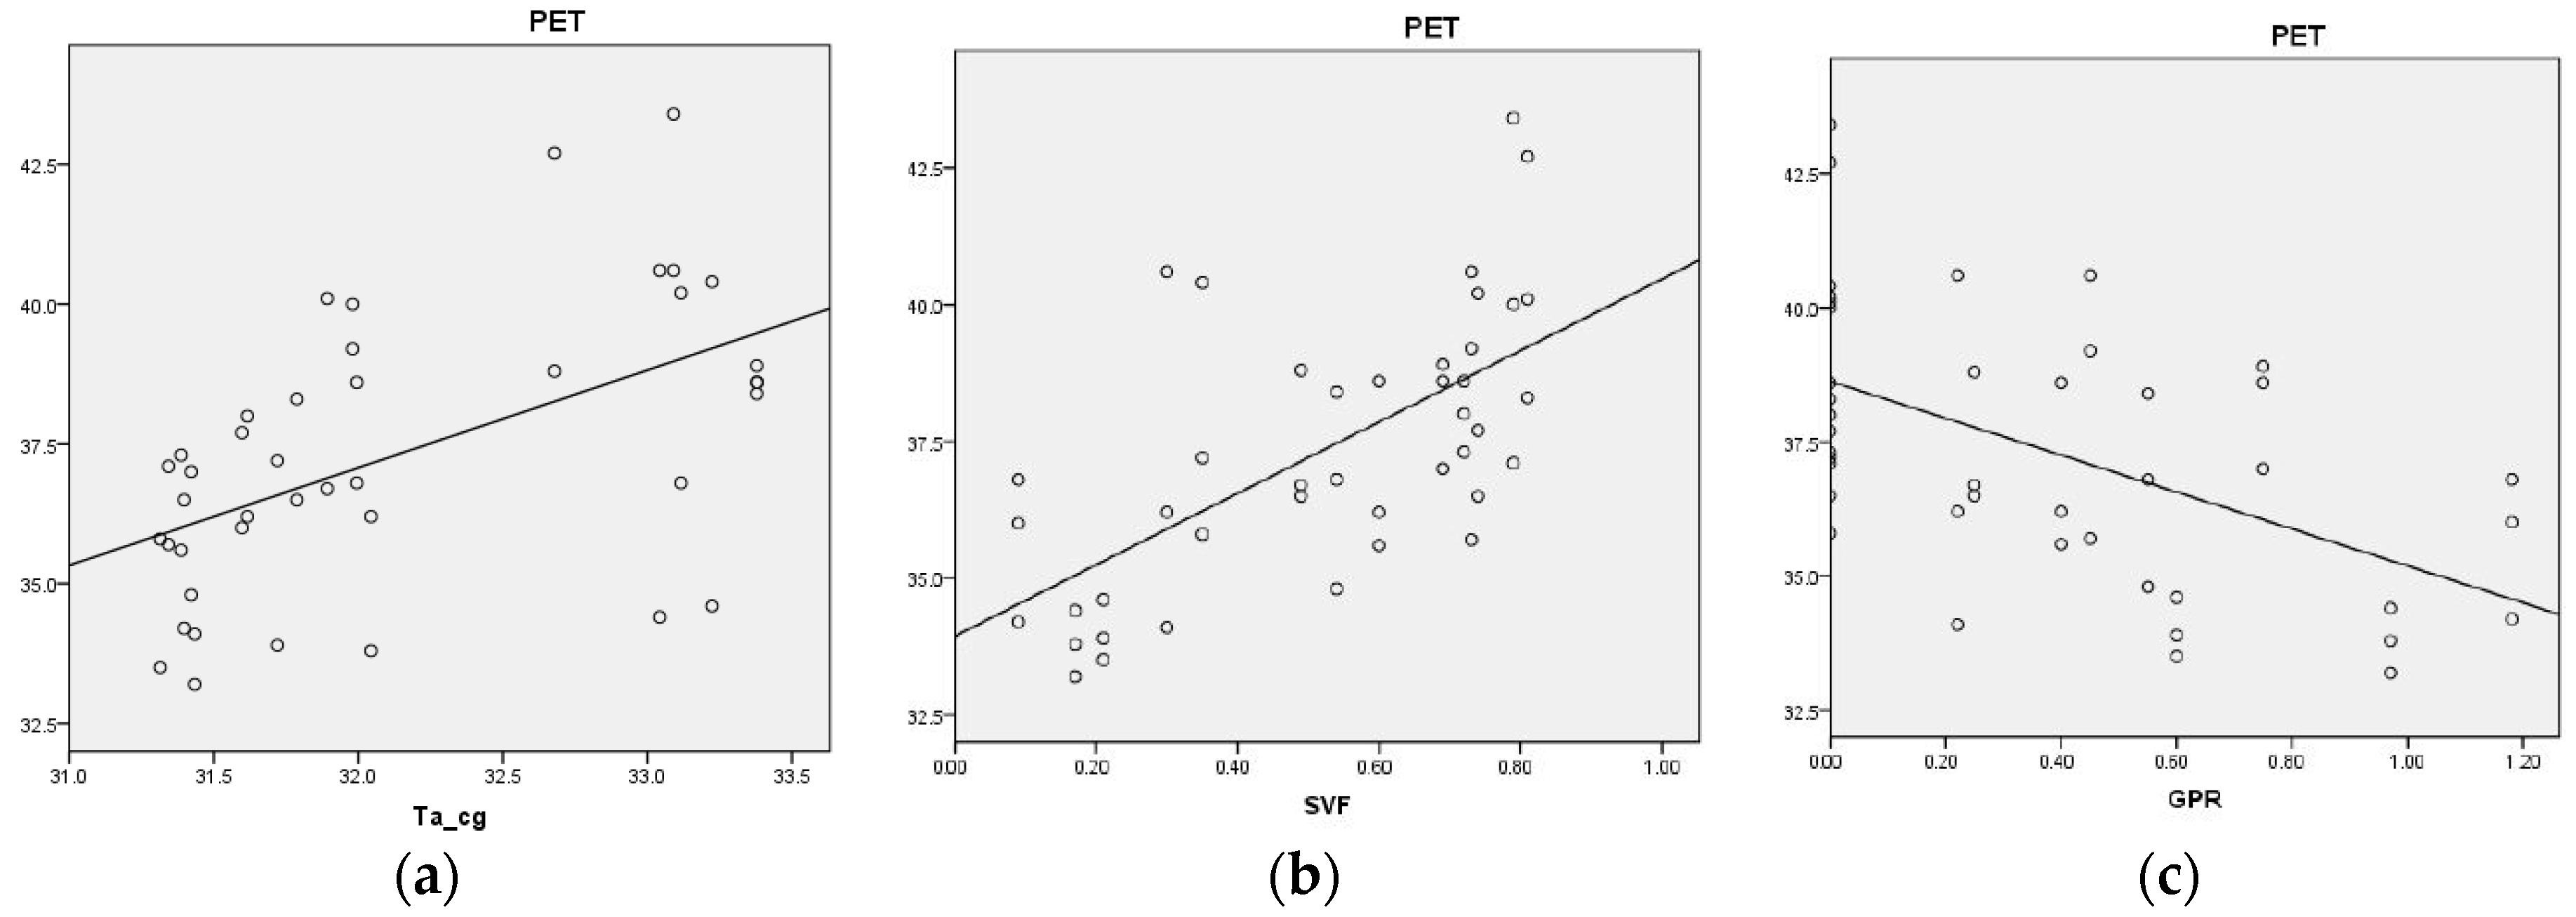
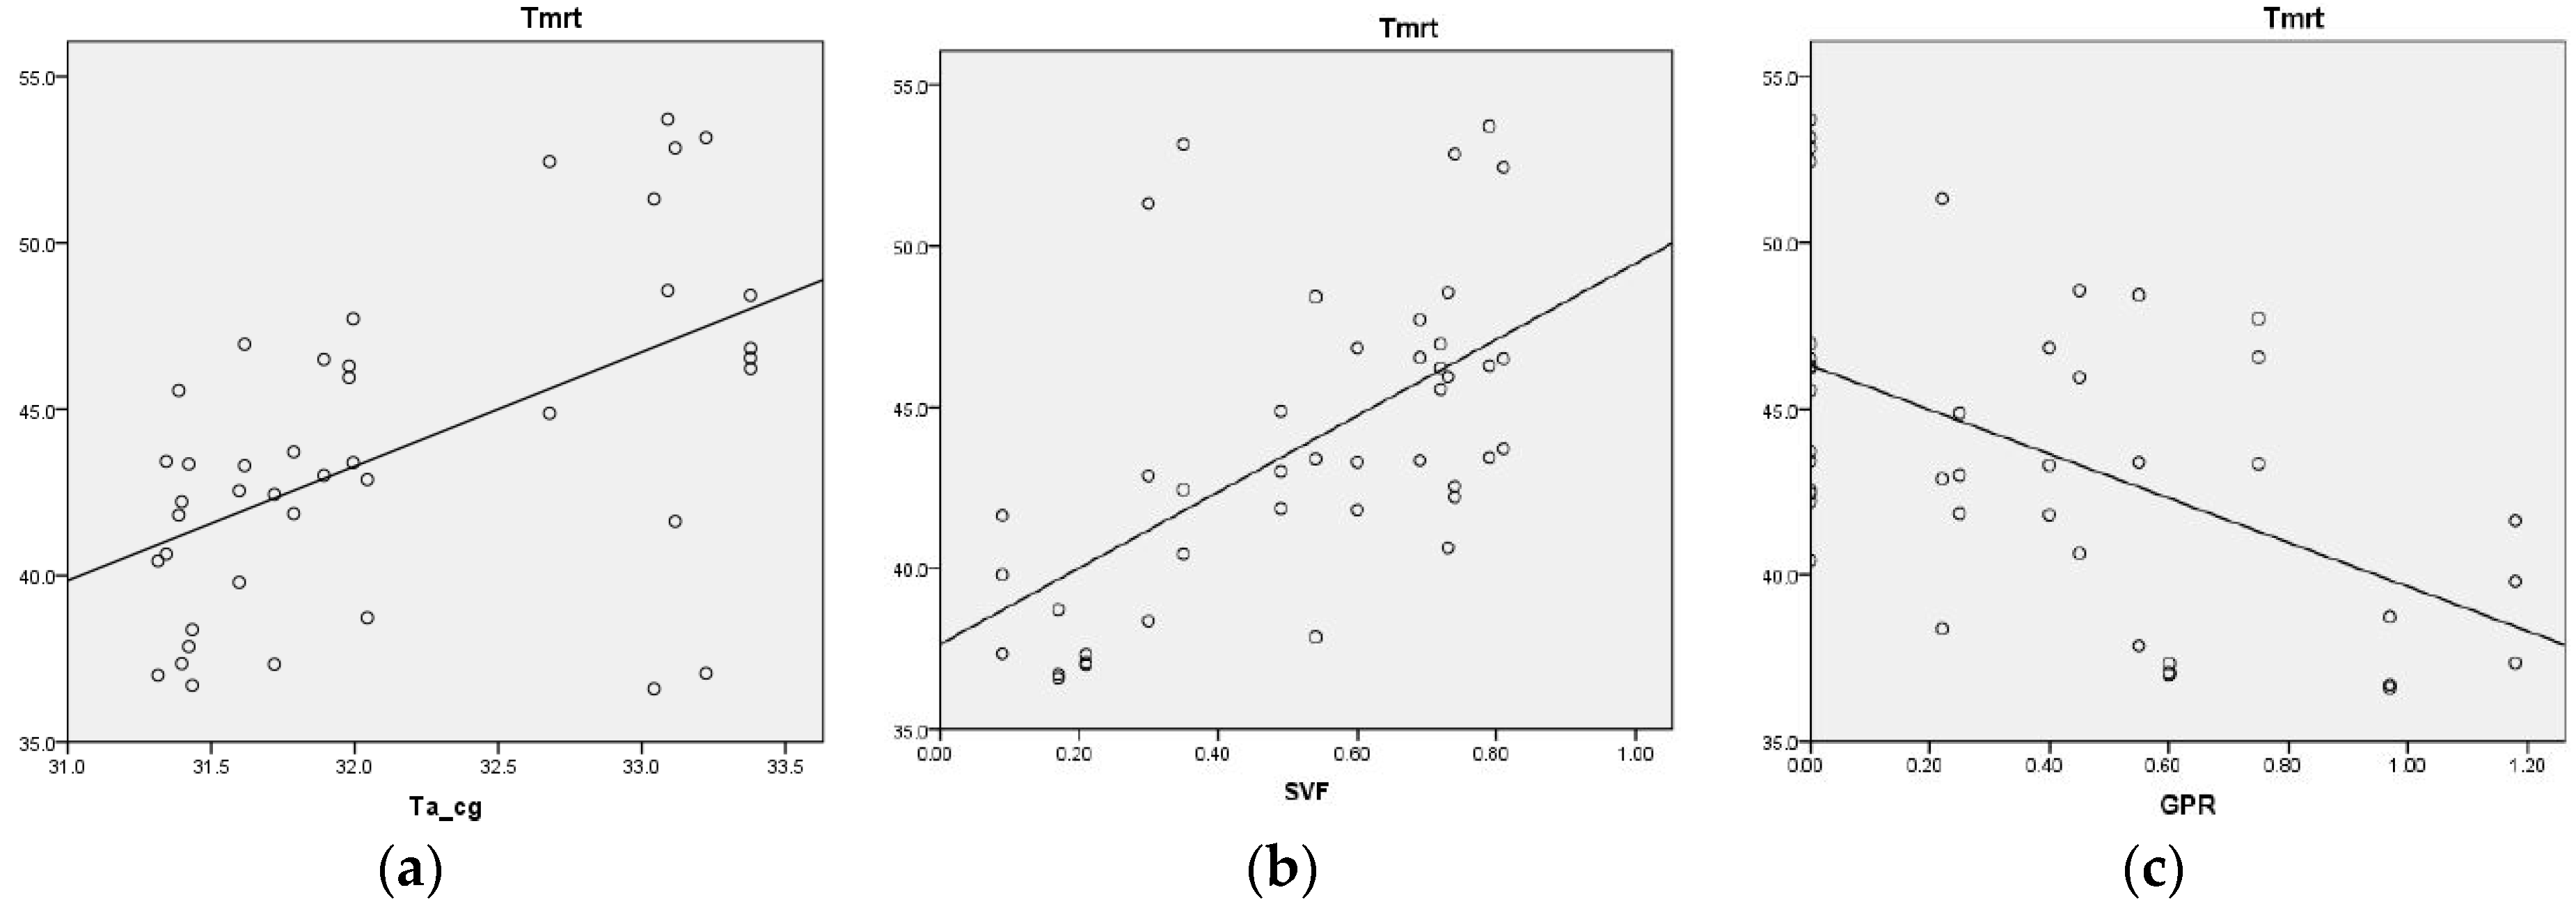
3.3. Regression Analysis

Bivariate and multiple linear regression analysis are applied to identify the causal factors associated with temperature and thermal comfort indices. The significant level is set at 5%. SPSS software (Version 20, IBM Corporation, Armonk, NY, USA) is used to carry out the statistical analysis on the traverse measurement data. The overall sample size including all of the traverse measurement points (see Figure 2 for locations of the points) is 42. The dependent variable is air temperature (Ta), mean radiant temperature (MRT) and physiological equivalent temperature (PET). The independent variables include two point-specific variables, i.e., sky view factor (SVF) and green plot ratio (GPR) [21], and one site-specific variable, i.e., background air temperature measured at CGS (Ta_cg).
Linear-fit estimates indicate that Ta is related to SVF with an R-square of 0.14, significant at the 0.05 level. A significant relationship exists between Ta and Ta_cg (R2 = 0.53; Sig. level: 0.01) (Figure 8). Air temperature variation is subject to many factors at different scales [21], and SVF alone cannot explain the major variation in air temperature [22]. Although SVF as a crucial micro-scale parameter shows a statistically significant relationship, its explanatory power is much less than the reference temperature recorded at the local-scale, i.e., Ta_cg. Higher SVF tends towards increasing Ta, and a higher background temperature tends towards increasing Ta as well. Multiple regression incorporating SVF and Ta_cg yields the following equation. The model is capable of explaining about two-thirds of the variability in Ta (Equation (2)):
Ta = 0.68 × Ta_cg + 1.08 × SVF + 10.03 (R2 = 0.65, F = 35.5)
Linear-fit estimates indicate significant relationship of MRT with Ta_cg (R2 = 0.29; Sig. level: 0.01), SVF (R2 = 0.36; Sig. level: 0.01) and GPR (R2 = 0.28; Sig. level: 0.01) (Figure 9). Higher SVF tends towards increasing MRT, and higher background temperature tends towards increasing MRT as well, whereas higher greenery density tends towards lowering MRT. SVF shows a relatively low R-square value, due to the fact that MRT is highly dependent upon impinging solar radiation, and since SVF does not take solar geometry into account, it is not adequate to quantify solar radiation received at the location of interest [22]. Greenery (trees, shrub and grass) may modify MRT by tree canopy shading (direct solar radiation) and reducing ground albedo (reflected solar radiation) [23]. Multiple regression incorporating SVF, GPR and Ta_cg yields the following equation. The model is capable of explaining about 70% of the variability in MRT (Equation (3)):
MRT = 8.25 × SVF − 3.40 × GPR + 3.42 × Ta_cg − 69.02 (R2 = 0.69, F = 27.6)
Linear-fit estimates indicate a significant relationship of PET with Ta_cg (R2 = 0.29; Sig. level: 0.01); SVF (R2 = 0.42; Sig. level: 0.01) and GPR (R2 = 0.28; Sig. level: 0.01) (Figure 10). Higher SVF tends towards increasing PET, and higher background temperature tends towards increasing PET as well, whereas higher greenery density tends towards lowering PET.
Multiple regression incorporating SVF, GPR and Ta_cg yields the following equation. The model is capable of explaining about 72% of the variability in PET (Equation (4)). The equation with standardized coefficients is as Equation (5). Equation (6) is deducted in a separated study, using field-measured data at ground pedestrian level at the LJZ CBD area [24]. By comparison, it can be seen that Equations (5) and (6) are similar in terms of variable composition and magnitudes of coefficients. Therefore, the robustness of the regression results is verified:
PET = 4.98 × SVF − 1.46 × GPR + 1.73 × Ta_cg − 20.33 (R2 = 0.72, F = 32.4)
PET = 0.49 × SVF − 0.23 × GPR + 0.53 × Ta_cg
PET = 0.56 × SVF − 0.31 × GPR + 0.38 × Ta_cg (R2 = 0.76, F = 24)

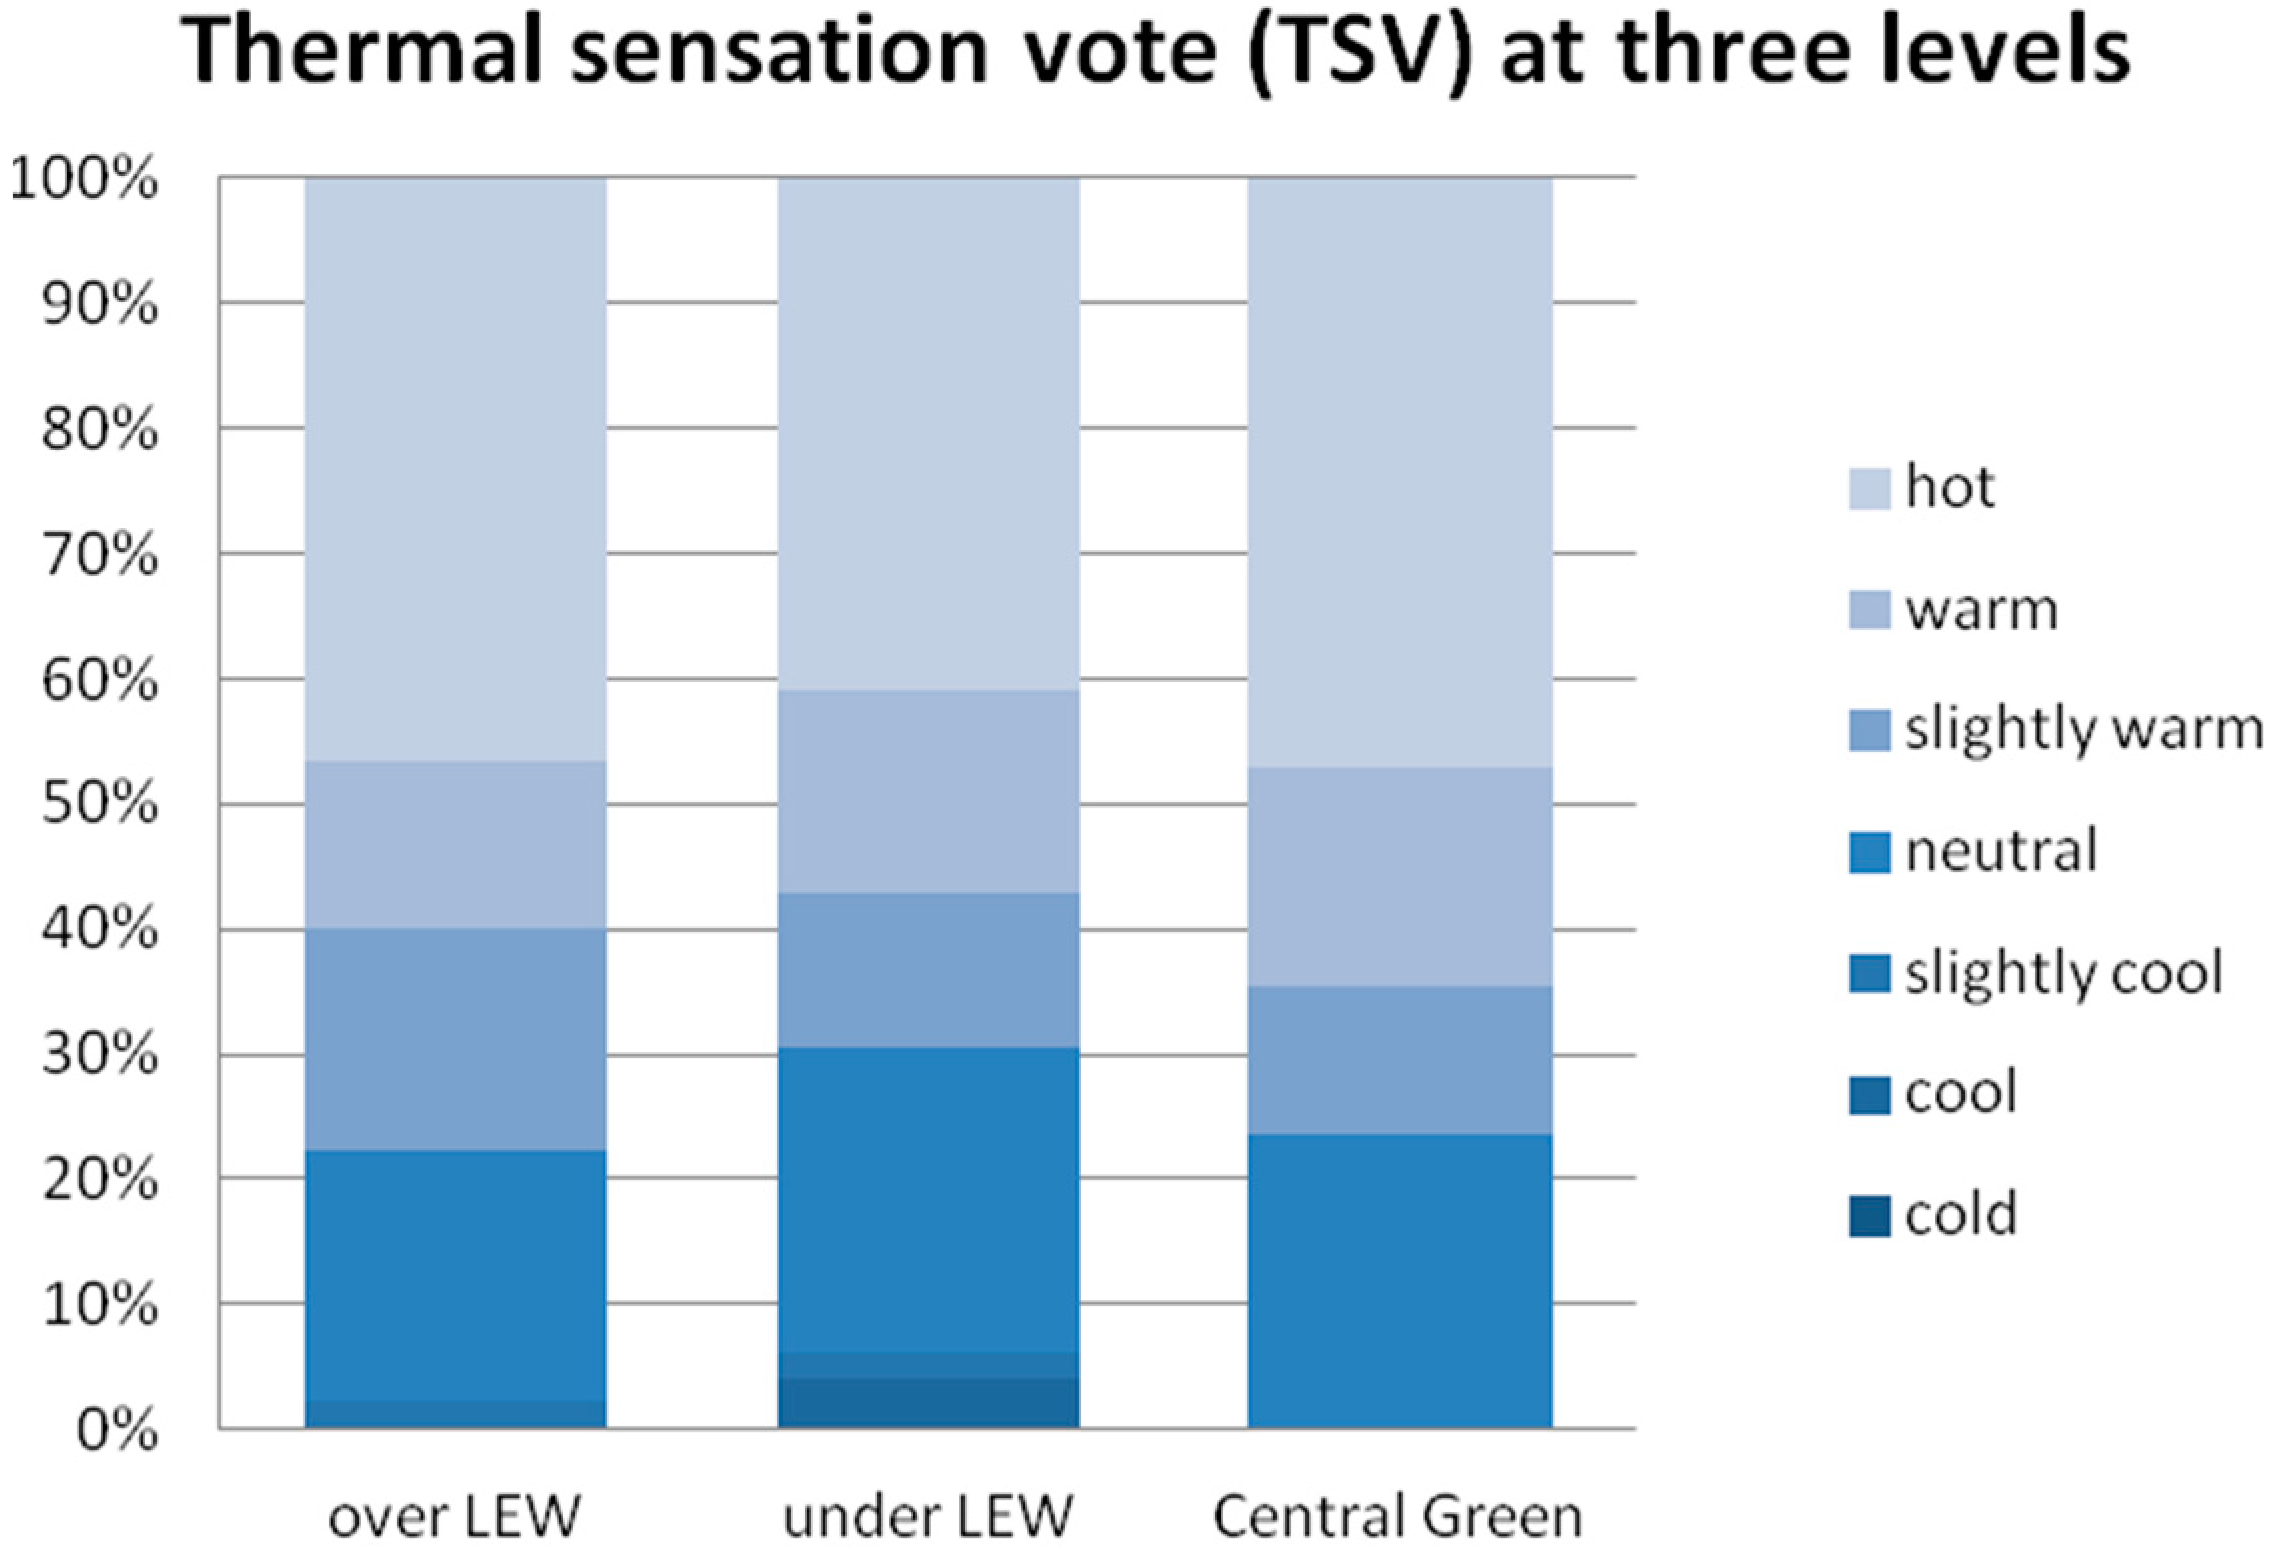
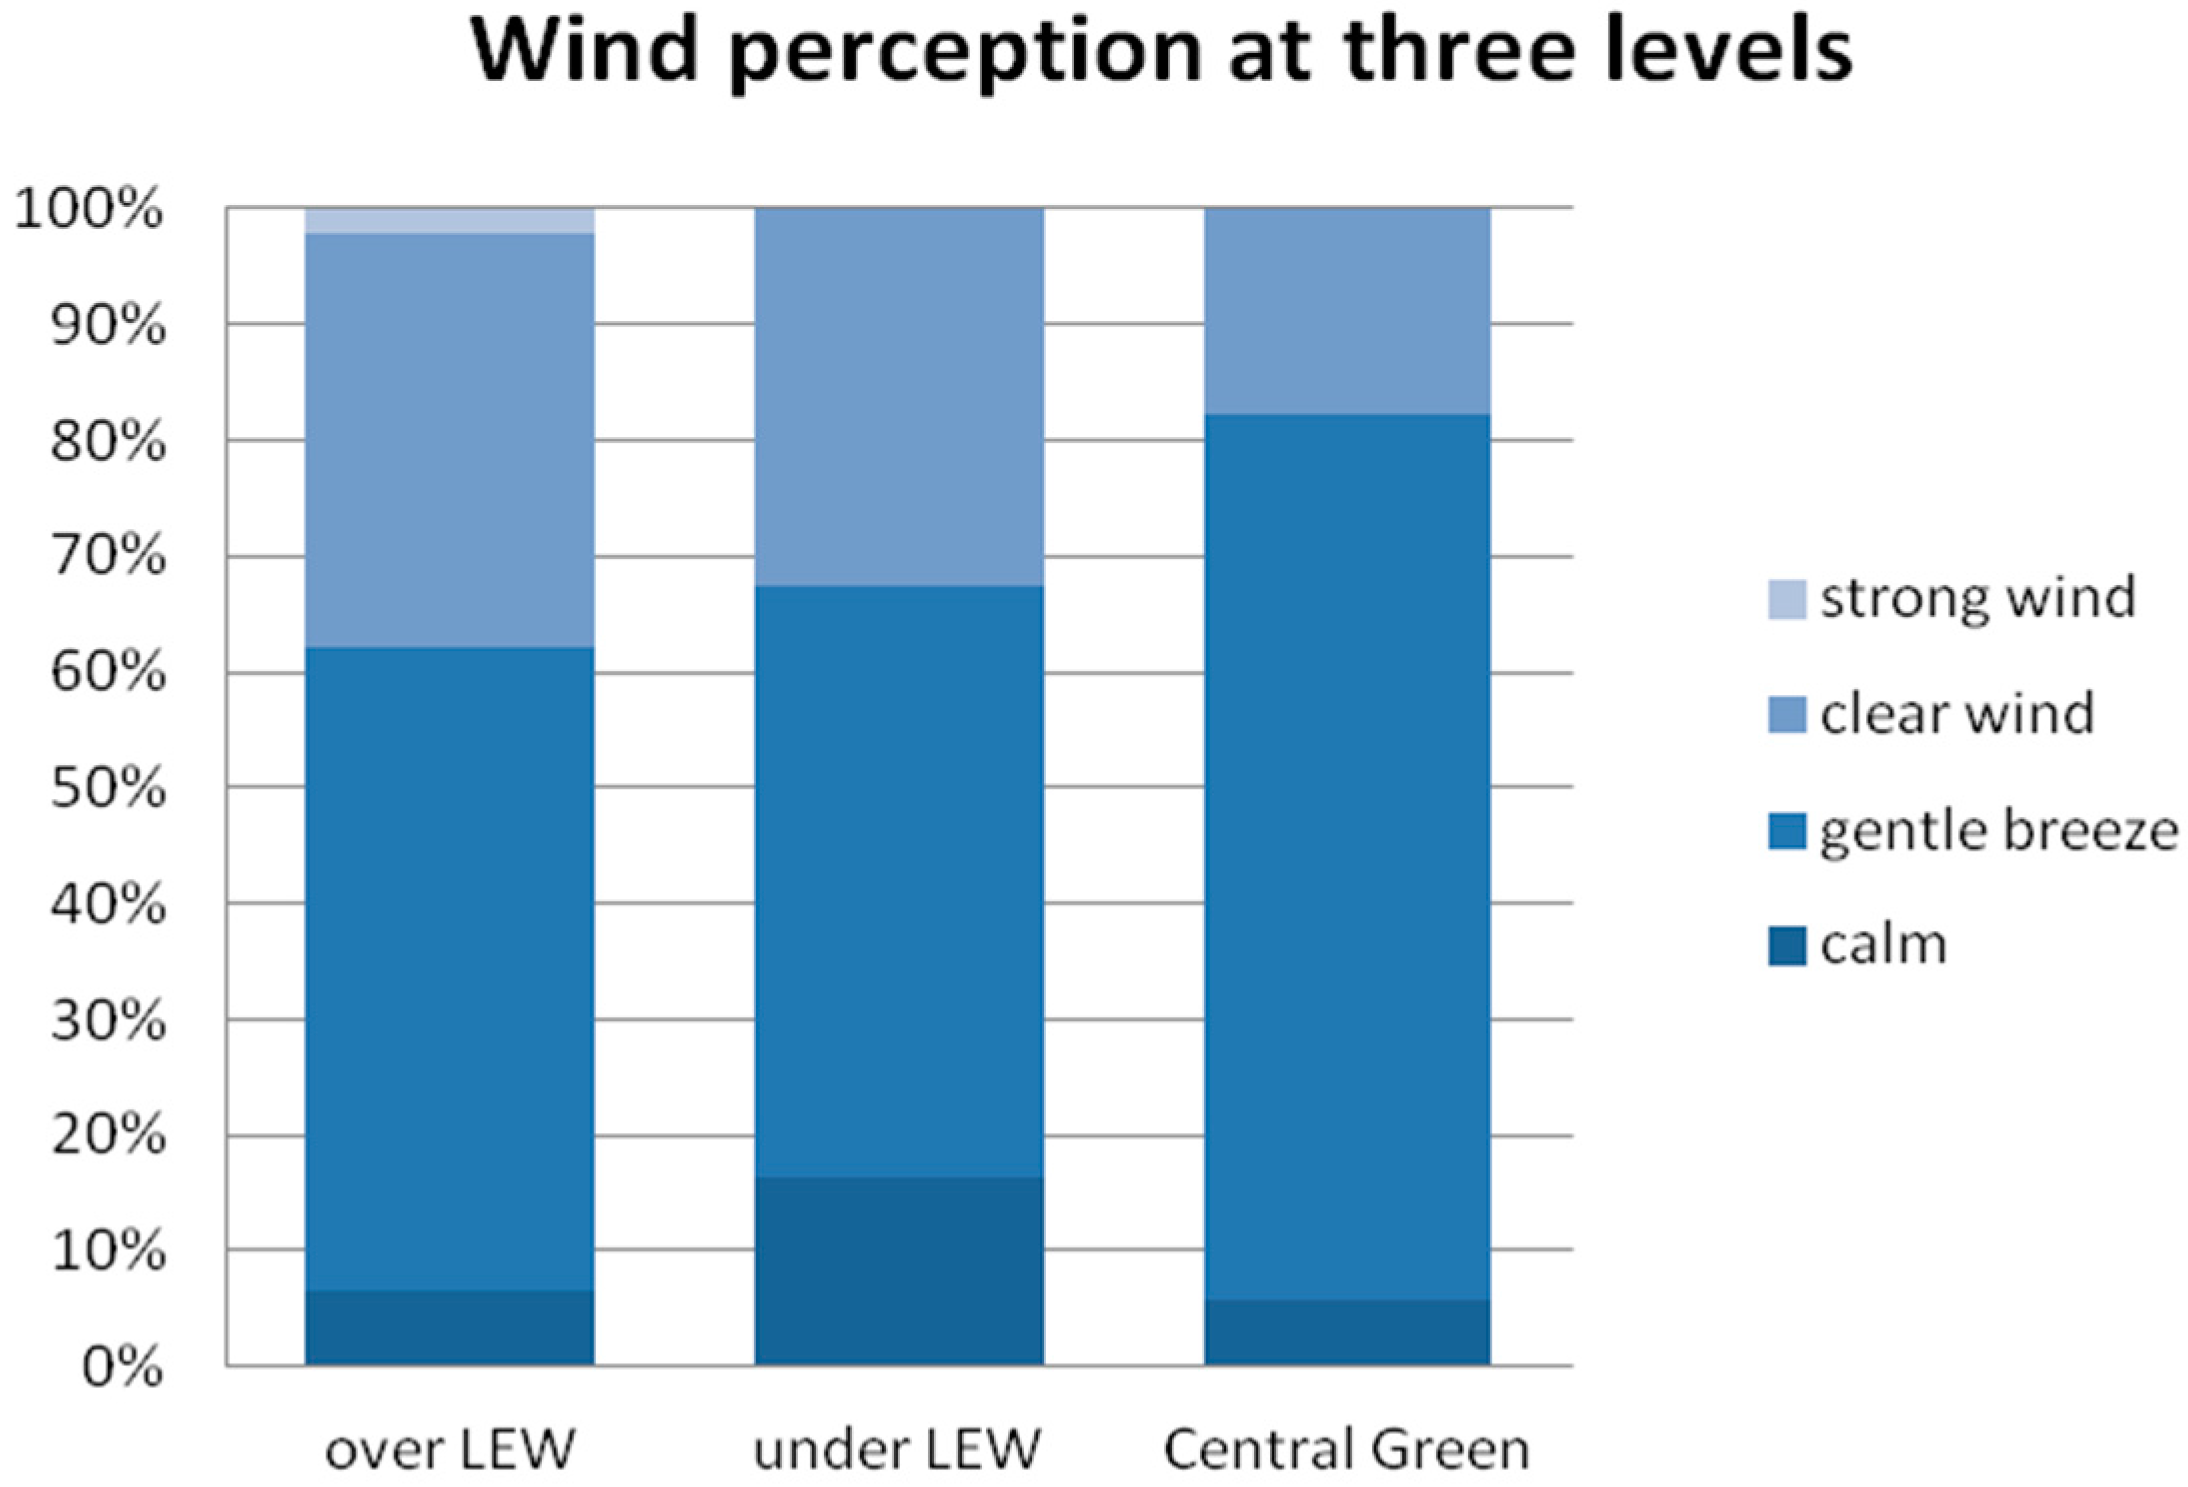
3.4. Questionnaire Survey

Overall, the respondents reported a warm-to-hot environment at LEW and at LCG (Figure 11). The overall portion of respondents reporting warm to hot (+1 to +3) is about 77% above LEW and at LCG, whereas the percentage is about 8% lower in the group below LEW. About two-thirds of respondents above the LEW reported hot (+3), similar with the LCG reference station. In comparison, about 61% of the respondents below the LEW reported hot. In addition, 20%–25% of the respondents reported neutral-to-cool at all three places. Note that all these responses were collected during the 4th round measurement (4:30 p.m.–6 p.m.), when air temperature and solar radiation dropped down considerably compared to peak noon time.
More than 80% of respondents reported perceptible winds at all three places (Figure 12). About 94% of respondents from above LEW reported perceptible winds (+1 to +3, gentle breeze to strong wind), whereas about 84% from below LEW reported perceptible wind, 10% lower than that above LEW.
It is not surprising to find that respondents that felt comfortable comprise only around 20% both above and below the LEW (Figure 13). More people felt comfortable at the under LEW level, but with only a marginal advantage of about 5%. About 30% reported being comfortable at the LCG.

4. Discussion

Climatically, sizable green spaces such as LCG can have a clear assimilating effect on the surrounding urbanized area, and results of the present study indicate that the degree of assimilation is proportional to the distance. In this study, the locations closer to the LCG were measured and found to have smaller Ta differences and higher velocity ratios than those farther away from it (Figure 4). Compared to the ground level, selected locations at the LEW level were measured with higher MRT on the order of 2–6 °C, higher ITD on the order of 0.2–0.8 °C, and lower WVR on the order of 0.1–0.3. The lower velocity ratio at higher elevation seems counter-intuitive. A possible reason can be that the horizontal convection on the ground level was enhanced due to thermal buoyancy between shaded (directly under LEW) and un-shaded places, i.e., thermal buoyancy causes uplift of warmer air at sun-lit spaces, and they were supplied by cooler air from surrounding shaded spaces (Figure 14). Under hot and calm weather conditions, thermal buoyancy could be the major forces behind measured air movement at the pedestrian level [25]. However, more data are to be collected before any solid conclusions can be made on this observation.
Increasing the height of EW could expose it to higher wind speed due to less ground friction. However, to achieve tangible improvement, the height may have to be increased by a factor of two. This will significantly increase the cost of structure and lower the accessibility from ground level. Overall, comfort index PET indicates a hot thermal sensation for people (35–41 °C). However, PET was higher on the LEW level, on the order of 1–3 °C, indicating an even more uncomfortable thermal environment compared to the ground level.
Shading can be effective in reducing MRT and lowering PET, and thus can be en essential measure to improving thermal comfort. Field study further indicates that, among various materials, opaque shading with high thermal mass (concrete elevated walkway in this case) showed the best effect in lowering radiant temperature, on the order of 3–6 °C, followed by porous green mass (street tree canopy) (on the order of 1–3 °C), and semitransparent (tinted glass with steel frame) structure (on the order of 0.5–1.5 °C). Due to its high thermal mass, concrete surfaces maintain relatively lower surface temperature in addition to intercepting 100 percent direct solar radiation. Concrete shading is not new. Its application to building façades can be traced back to the Brise-soleil populated by Le Corbusier; famous examples include Chandigarh City Hall in India and Unité d′habitation in France. However, aesthetically, its raw and “brutalism” look might seem incompatible with the modern glass-steel towers commonly found in CBD areas. Alternatively, various shading devices that are light-weight and opaque can be applied in the EW design. Note that vegetation density is found significantly correlated with mean radiant temperature and the thermal comfort index. At the LEW level, planting trees would be structurally difficult and not cost-effective. The effective strategy to increase greenery mass can be shading canopy by climbing plants (Figure 15 and Figure 16).
Under the peak summer weather conditions in Shanghai, outdoor thermal comfort cannot be met even with sufficient shading. A previous study shows that when outdoor air temperature is in the range of 30–32 °C, shaded street space can be comfortable with wind velocity on the order of 2.2–3.6 m/s [25]. The measured WVR and reference WV indicate that, on average, this WV range was not achieved during the field measurement. To boost air movement at the pedestrian level over the LEW, electrical fans can be installed on the shading canopy. For instance, in the Clarke Quay redevelopment in Singapore, air-ducts and mechanical fans were incorporated into the canopy structure over the pedestrian area to promote air ventilation under nearly calm weather conditions [26]. Combined with water misting devices to lower sensible heat (by increasing latent heat), the LEW canopy can be upgraded into a “cool corridor” during the daytime. The installation and maintenance can be costly, but for a high-profile walkway being heavily used such as LEW, it can be worthwhile to invest.

5. Conclusions

This study investigated the relationship between urban morphology and urban microclimate and thermal comfort of the recently completed Lujiazui Elevated Walkway (LEW) system in Shanghai, featuring a hot-humid sub-tropical climate. Micrometeorological measurement was carried out in the peak summer period for three continuous days. Seven pairs of measurement points were chosen, representing various scenarios of urban morphology on the LEW, and, on the sidewalk level, surface material, degree of enclosure, greenery coverage, and degree of shading. Two pedestrian routes connect measurement points at the elevated levels and at the ground levels, respectively, recording air temperature, relative humidity, wind velocity, and globe temperature using portable micro-weather stations. A reference station was set up on the open grass lawn of LZJ Central Green. Guided interviews and questionnaire surveys on thermal and wind perception were also carried out spontaneously with the field measurement. The data analysis indicates that:
(1)
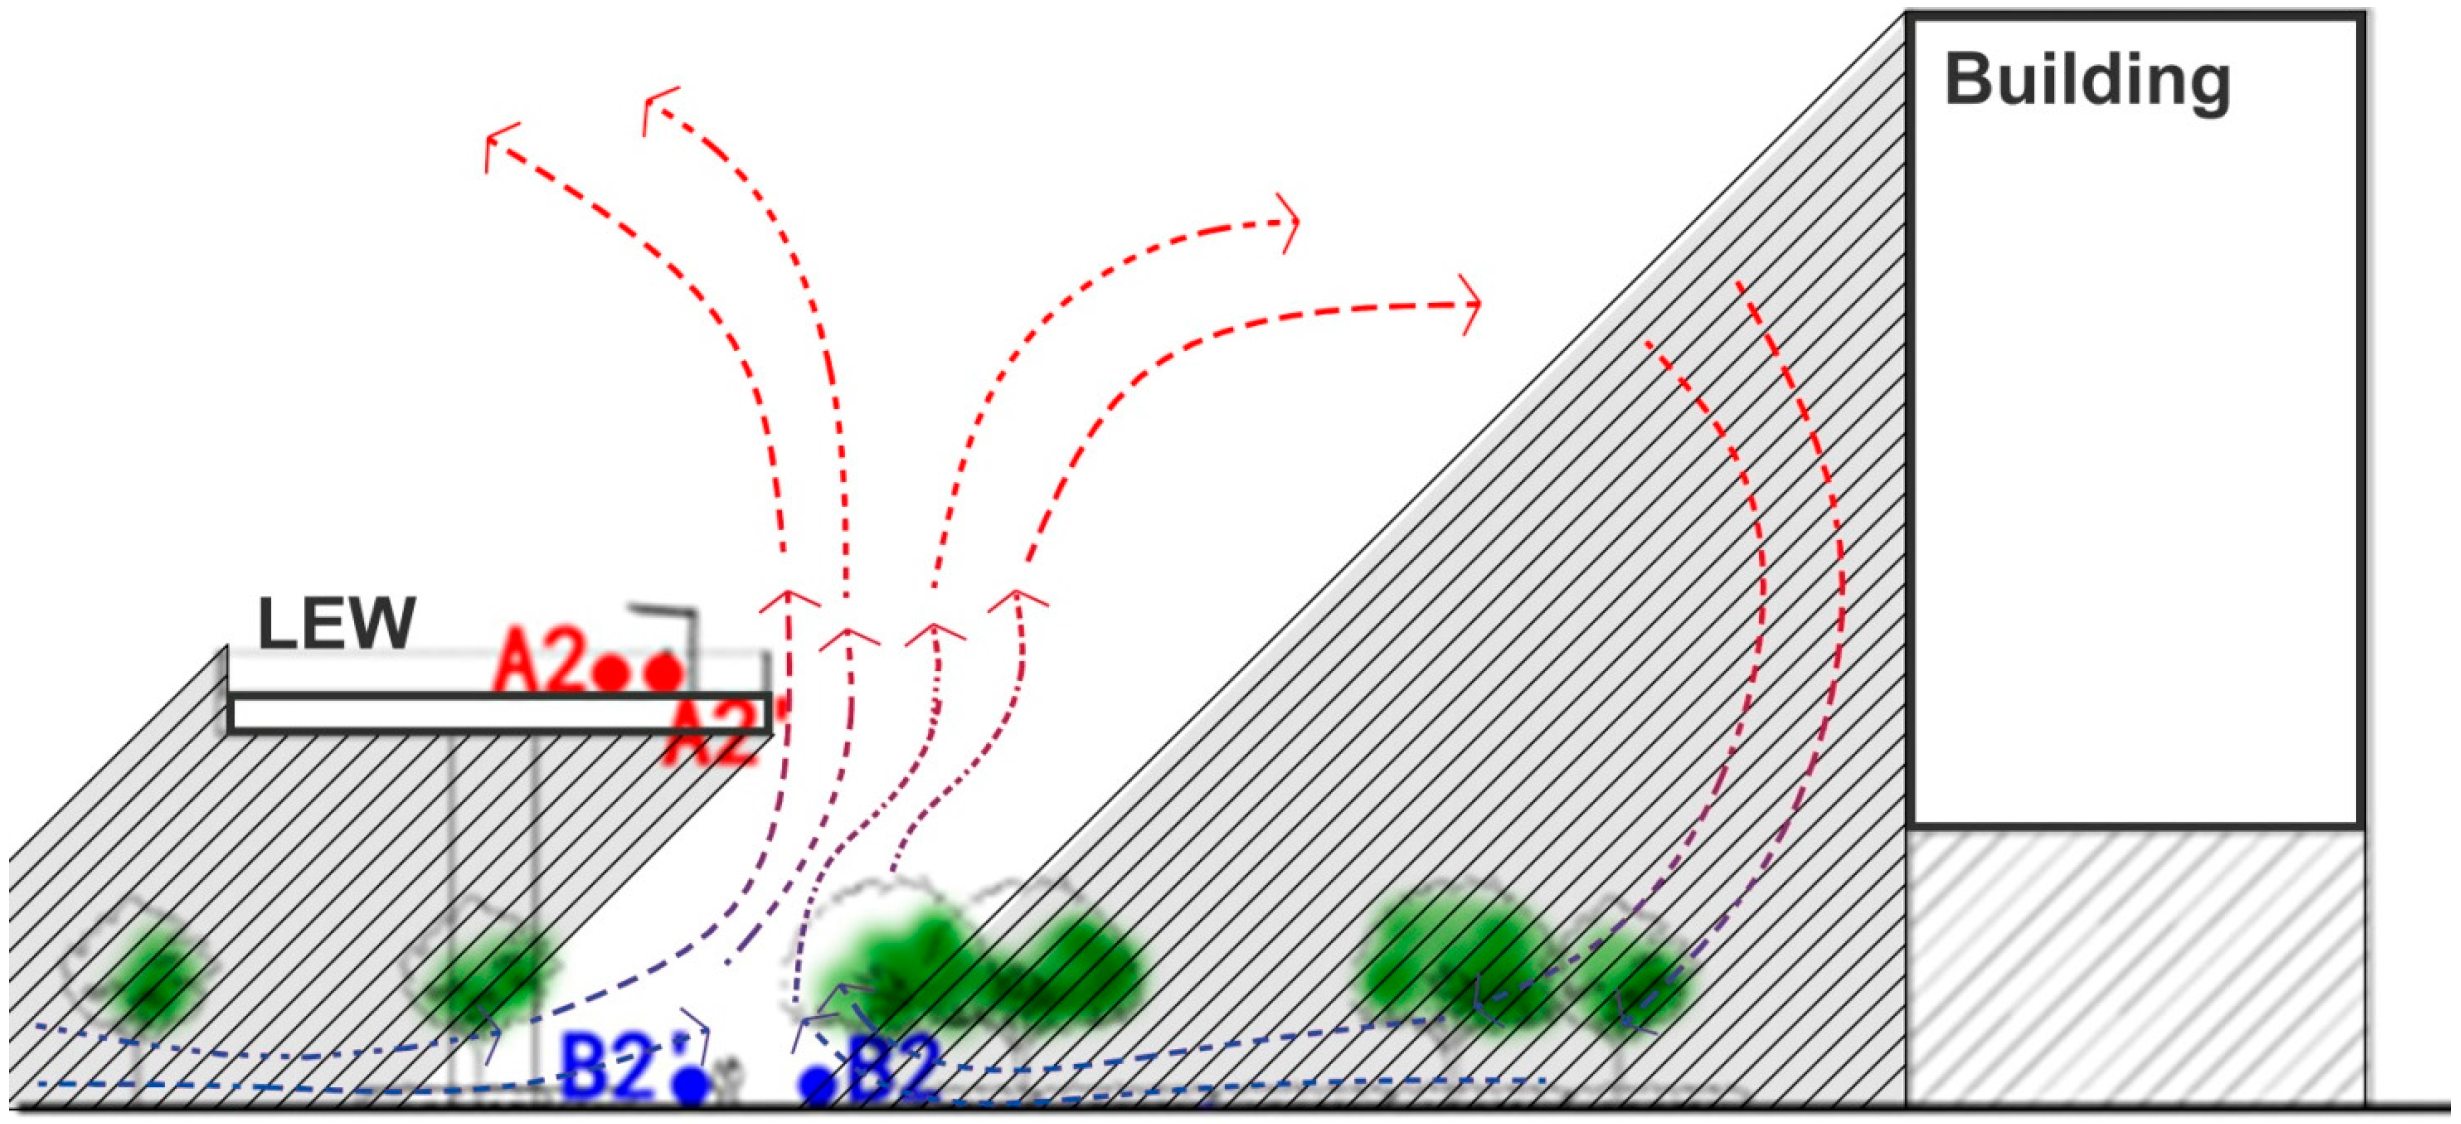
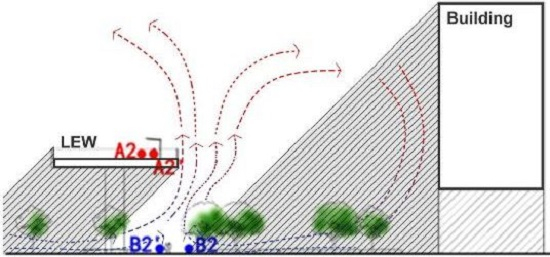
The measured locations over the LEW are thermally more uncomfortable than those below it. Air temperature was higher, whereas wind velocity is lower on the LEW level than on the ground level, which is counter-intuitive. It is possible that the horizontal convection on the ground level was enhanced due to thermal buoyancy between shaded and un-shaded places.
(2)
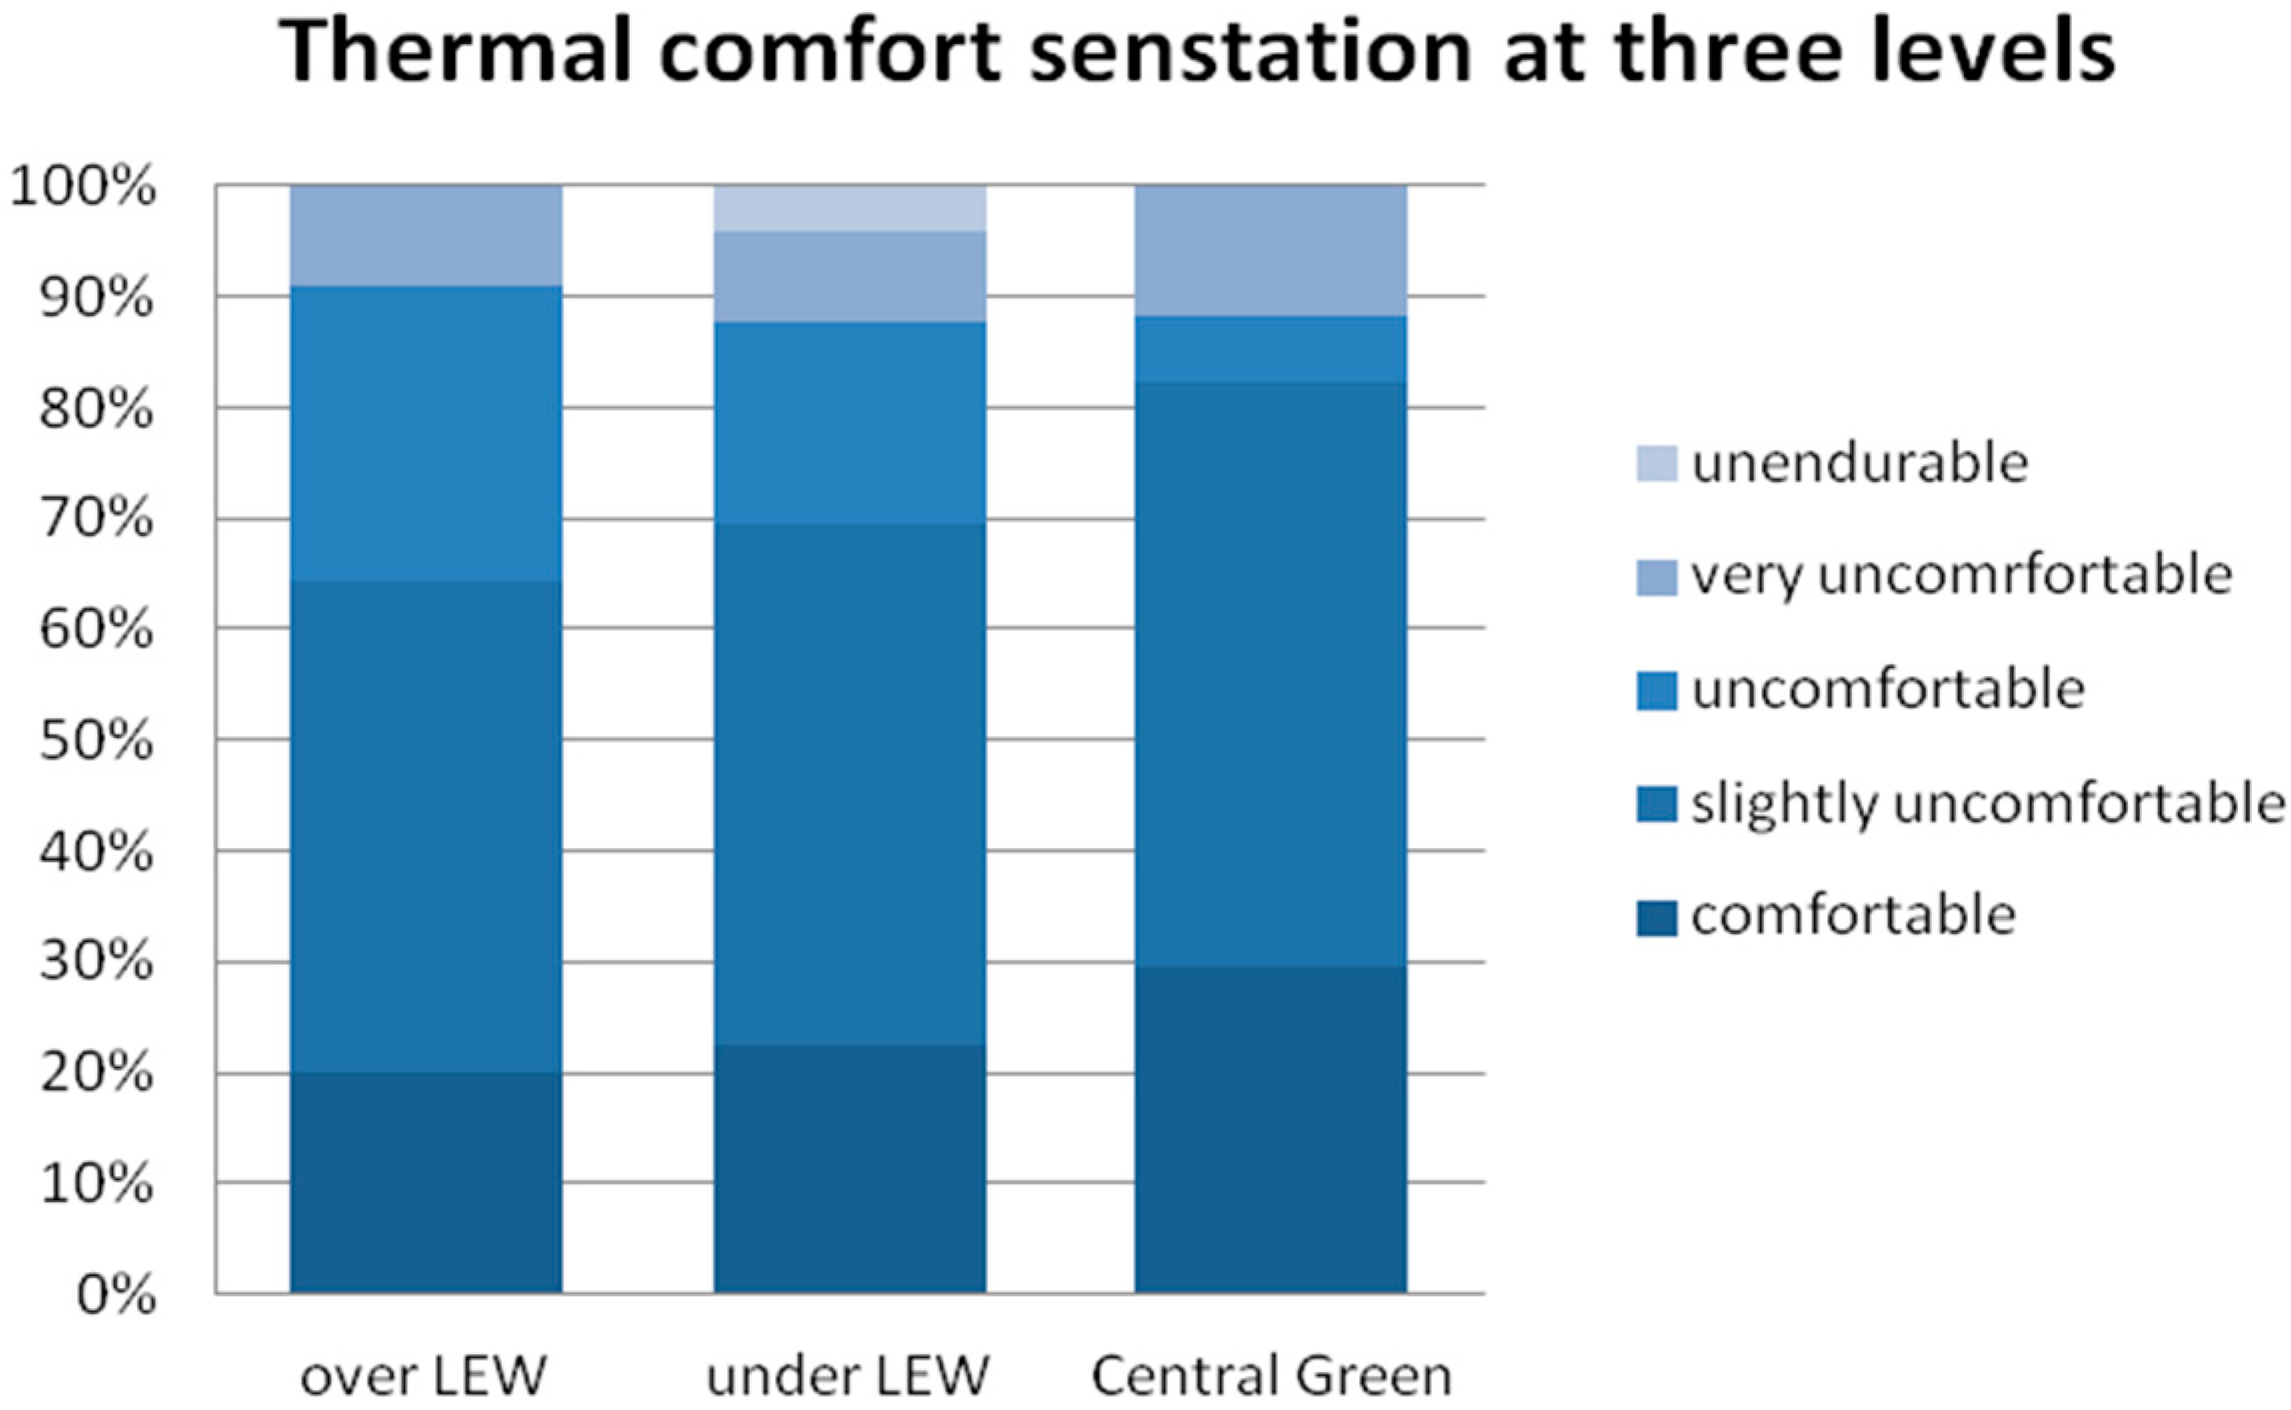
Indicated by the calculated thermal comfort index (physiological equivalent temperature, PET), it was averagely hot both over and below the LEW during the measured period, although PET was 1–3 °C lower at below the LEW. In addition, about 80% of respondents reported being uncomfortable above the LEW, whereas this was 5% lower at below the LEW.
(3)
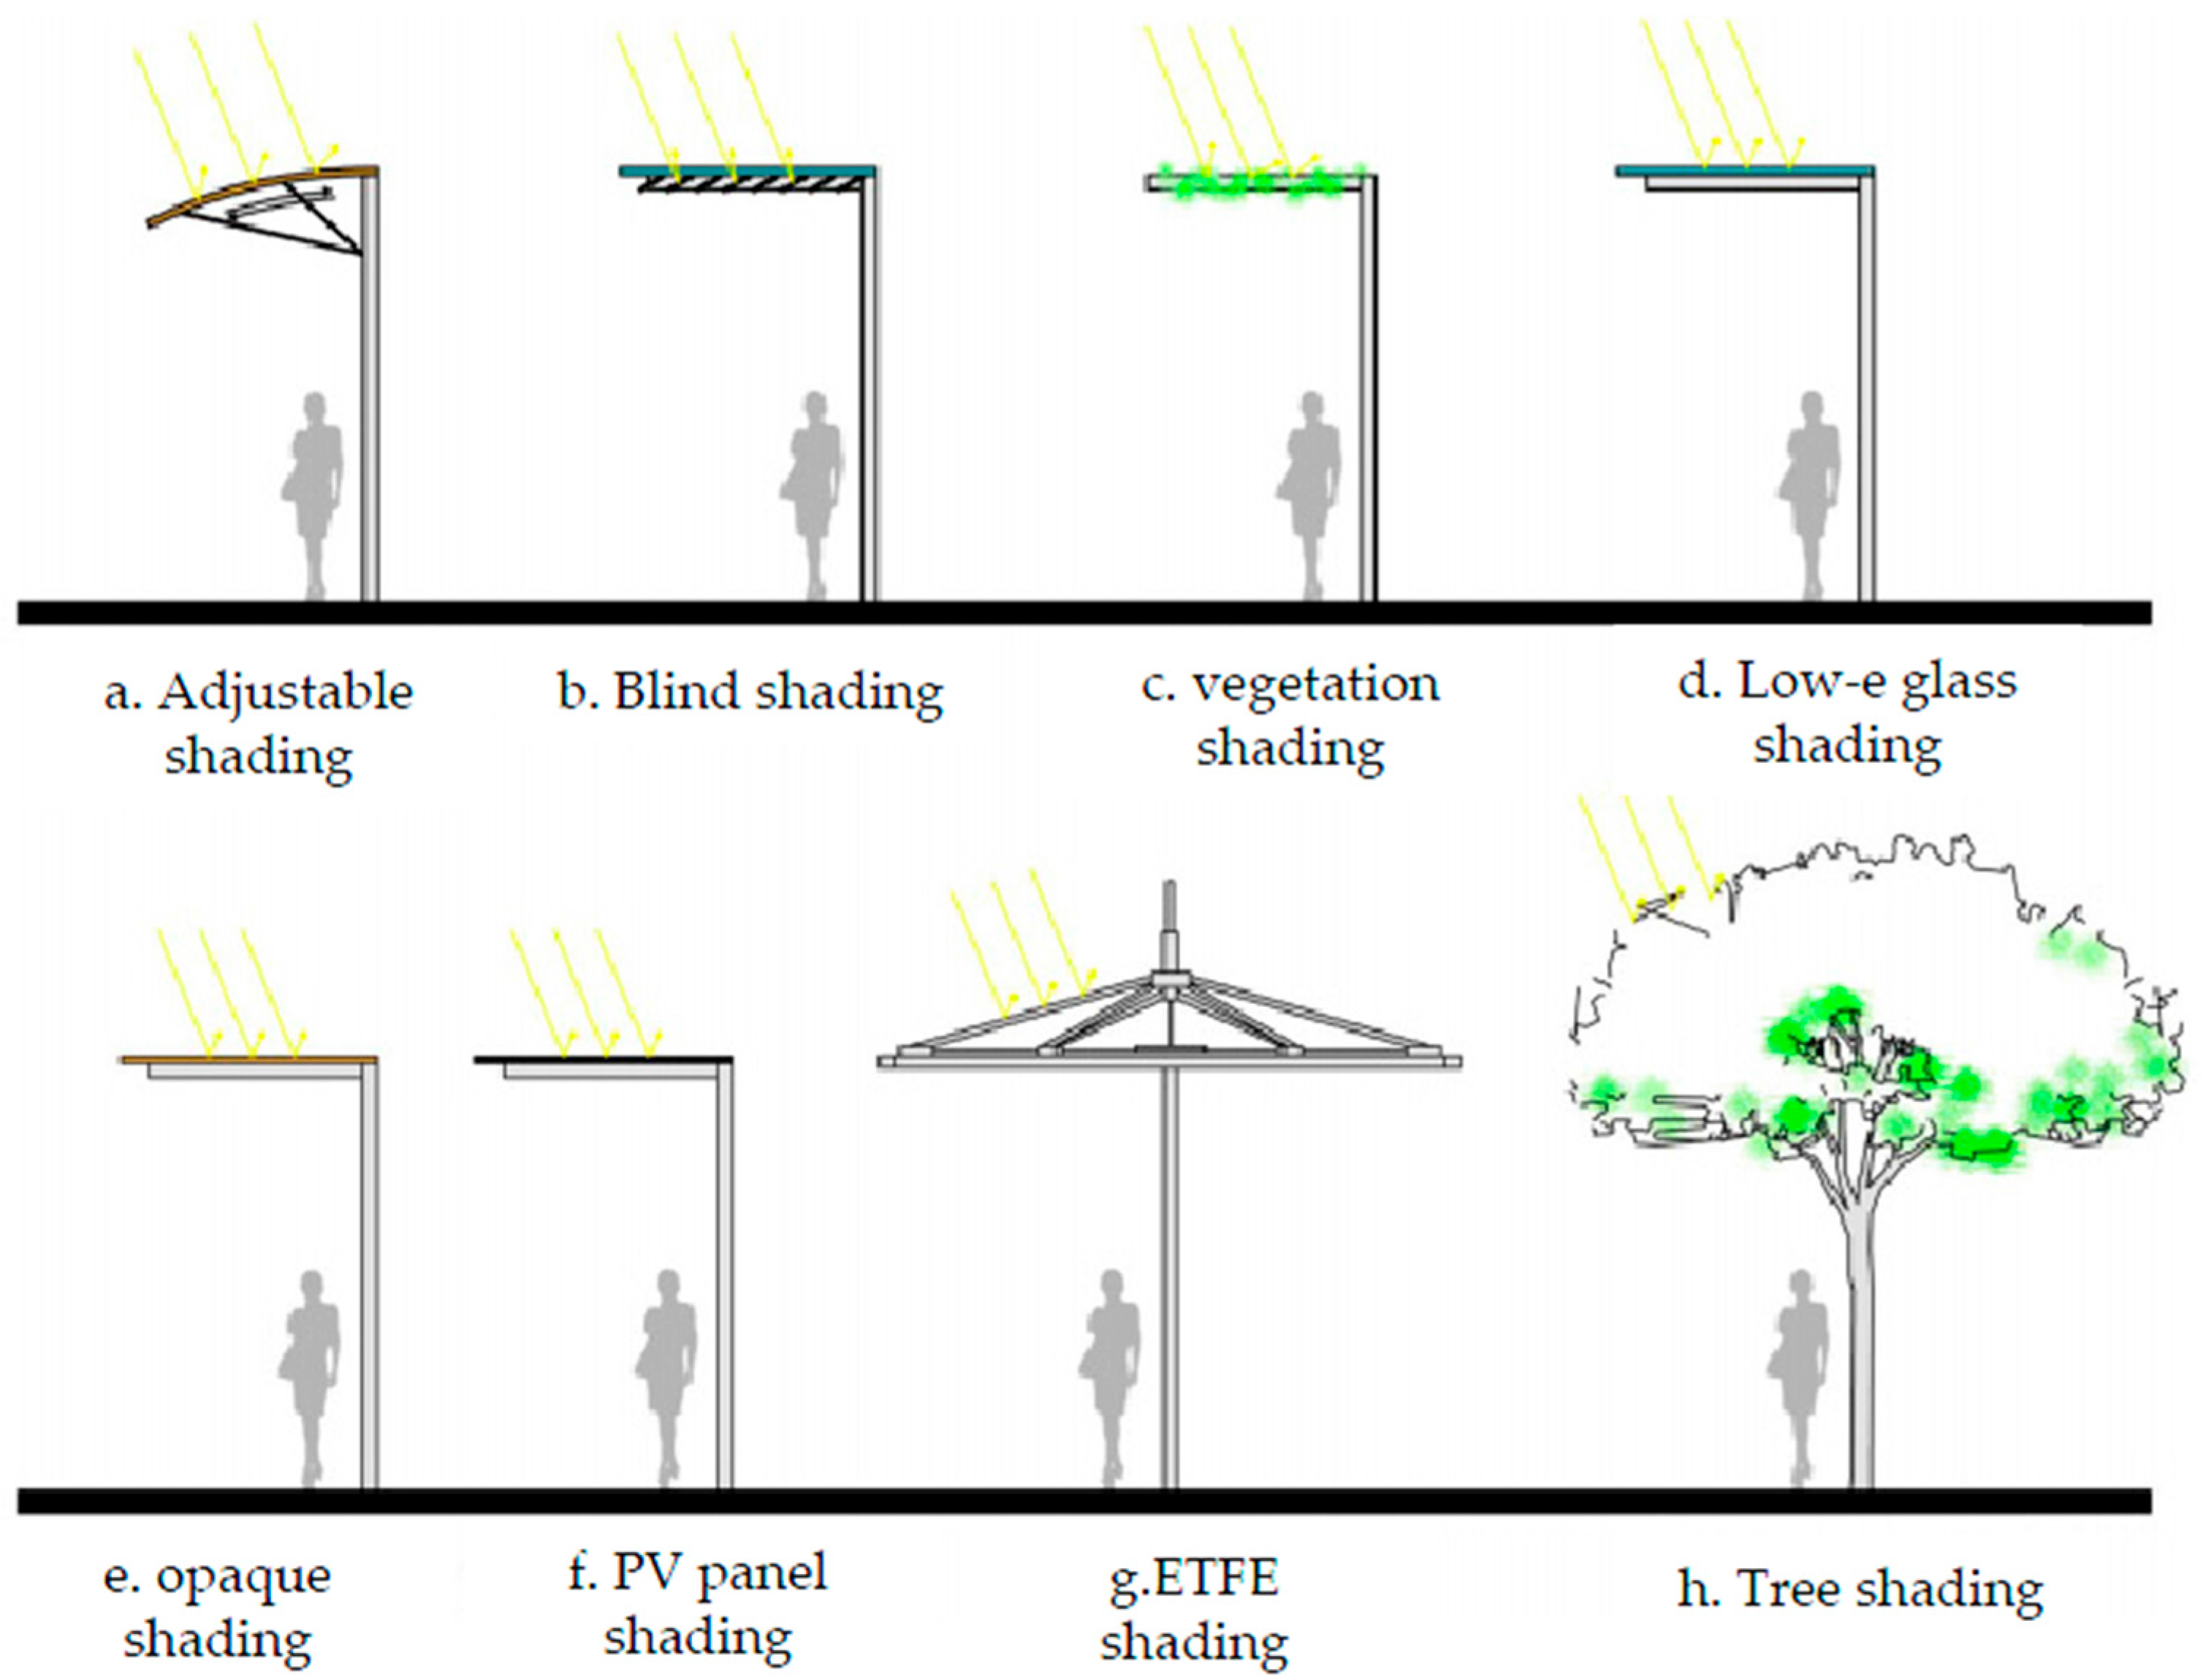
Shaded locations can be warm while un-shaded places can be hot indicated by PET. Opaque concrete shading is most effective in lowering Tmrt, followed by tree canopy and glass-steel canopy.
(4)
To achieve a thermally comfortable LEW, passive cooling systems such as shading are vital but not enough. Active energy measures can be combined with shading devices, to increase air movement and reduce sensible heat, by a carefully integrated system design.

Acknowledgments

This paper is supported by the Innovation Program of Shanghai Municipal Education Commission (Project No. 15ZZ020), the Fundamental Research Funds for the Central Universities (Project No. 0100219161) and the Shanghai Summit Program.

Author Contributions

Feng Yang conceived and designed the experiments; Wanzhu Zhao participated in the experiments; Feng Yang and Wanzhu Zhao analyzed the data; Feng Qian contributed reagents/materials/analysis tools; Feng Yang wrote the paper.

Conflicts of Interest

The authors declare no conflict of interest.

Abbreviations

CBDcentral business district
CGSCentral Green station
EWelevated walkway
GPRgreen plot ratio
GSRglobal solar radiation
ITDinter-urban temperature differential
LCGLujiazui Central Green
LEWLujiazui elevated walkway
LJZLujiazui
MRTmean radiant temperature
PETphysiological equivalent temperature
RHrelative humidity
SVFsky view factor
Taair temperature
Ta_cgbackground air temperature measured at CGS
Tgglobe temperature
TSVthermal sensation vote
WDwind direction
WVwind velocity
WVRwind velocity ratio

References

  1. Corbett, M.J.; Xie, F.; Levinson, D.M. Evolution of the second-story city: The Minneapolis Skyway System. Environ. Plan. B Plan. Des. 2009, 36, 711–724. [Google Scholar] [CrossRef]
  2. Robertson, K.A. Pedestrian skywalks in Calgary, Canada: A comparison with US downtown systems. Cities 1987, 4, 207–214. [Google Scholar] [CrossRef]
  3. Cui, J.; Allan, A.; Lin, D. The development of grade separation pedestrian system: A review. Tunn. Undergr. Space Technol. 2013, 38, 151–160. [Google Scholar] [CrossRef]
  4. Rotmeyer, J. Can elevated pedestrian walkways be sustainable? WIT Trans. Ecol. Environ. 2006, 93, 293–302. [Google Scholar]
  5. Byers, J.P. Breaking the Ground Plane: The Evolution of Grade Separated Cities in North America; University of Minnesota: Minneapolis, MN, USA, 1998. [Google Scholar]
  6. Lau, S.S.Y.; Giridharan, R.; Ganesan, S. Multiple and intensive land use: Case studies in Hong Kong. Habitat Int. 2005, 29, 527–546. [Google Scholar] [CrossRef]
  7. Hu, S. Planning an Above Ground Pedestrian Network in Central Zhujiang New District Guangzhou. J. Plan. 2010, 26, 36–40. (In Chinese) [Google Scholar]
  8. Mastura, A.; Keumala, N.; Taofeekat, O.M.; Rohana, J. Innovative Elevated Walkway for a Liveable Kuala Lumpur City. In World Renewable Energy Congress—WREC XIII; Kingston University: London, UK, 2014. [Google Scholar]
  9. Bottema, M. Towards rules of thumb for wind comfort and air quality. Atmos. Environ. 1999, 33, 4009–4017. [Google Scholar] [CrossRef]
  10. Janssen, W.D.; Blocken, B.; van Hooff, T. Pedestrian wind comfort around buildings: Comparison of wind comfort criteria based on whole-flow field data for a complex case study. Build. Environ. 2013, 59, 547–562. [Google Scholar] [CrossRef]
  11. Wu, H.; Kriksic, F. Designing for pedestrian comfort in response to local climate. J. Wind Eng. Ind. Aerodyn. 2012, 104–106, 397–407. [Google Scholar] [CrossRef]
  12. Peng, C.; Ming, T.; Gui, J.; Tao, Y.; Peng, Z. Numerical analysis on the thermal environment of an old city district during urban renewal. Energy Build. 2015, 89, 18–31. [Google Scholar] [CrossRef]
  13. Parsons, K.C. Human Thermal Environments: The Effects of Hot, Moderate, and Cold Environments on Human Health Comfort and Performance; Taylor & Francis: London, UK, 2003. [Google Scholar]
  14. Klemm, W.; Heusinkveld, B.G.; Lenzholzer, S.; van Hove, B. Street greenery and its physical and psychological impact on thermal comfort. Landsc. Urban Plan. 2015, 138, 87–98. [Google Scholar] [CrossRef]
  15. Krüger, E.L.; Minella, F.O.; Rasia, F. Impact of urban geometry on outdoor thermal comfort and air quality from field measurements in Curitiba, Brazil. Build. Environ. 2011, 46, 621–634. [Google Scholar]
  16. Chatzidimitriou, A.; Yannas, S. Microclimate development in open urban spaces: The influence of form and materials. Energy Build. 2015, 108, 156–174. [Google Scholar] [CrossRef]
  17. ISO. Ergonomics of the Thermal Environment—Instruments for Measuring Physical Quantities; ISO-7726; International Organization for Standardization (ISO): Geneva, Switzerland, 1998. [Google Scholar]
  18. Ng, E.; Chen, V. Urban human thermal comfort in hot and humid Hong Kong. Energy Build. 2012, in press. [Google Scholar] [CrossRef]
  19. Hoppe, P. The physiological equivalent temperature—A universal index for the biometeorological assessment of the thermal environment. Int. J. Biometeorol. 1999, 43, 71–75. [Google Scholar] [CrossRef] [PubMed]
  20. Matzarakis, A.; Mayer, H.; Iziomon, M.G. Applications of a universal thermal index: Physiological equivalent temperature. Int. J. Biometeorol. 1999, 43, 76–84. [Google Scholar] [CrossRef] [PubMed]
  21. Yang, F.; Lau, S.S.Y.; Qian, F. Urban design to lower summertime outdoor temperatures: An empirical study on high-rise housing in Shanghai. Build. Environ. 2011, 46, 769–785. [Google Scholar] [CrossRef]
  22. Yang, F.; Lau, S.S.Y.; Qian, F. Summertime heat island intensities in three high-rise housing quarters in inner-city Shanghai China: Building layout, density and greenery. Build. Environ. 2010, 45, 115–134. [Google Scholar] [CrossRef]
  23. Yang, F.; Lau, S.; Qian, F. Cooling performance of residential greenery in localised urban climates: A case study in Shanghai China. Int. J. Environ. Technol. Manag. 2015, 18, 478–503. [Google Scholar] [CrossRef]
  24. Yang, F.; Chen, L. Developing a thermal atlas for climate-responsive urban design based on empirical modeling and urban morphological analysis. Energy Build. 2016, 111, 120–130. [Google Scholar] [CrossRef]
  25. Yang, F.; Qian, F.; Lau, S.S.Y. Urban form and density as indicators for summertime outdoor ventilation potential: A case study on high-rise housing in Shanghai. Build. Environ. 2013, 70, 122–137. [Google Scholar] [CrossRef]
  26. Erell, E.; Pearlmutter, D.; Williamson, T. Urban Microclmate: Designing the Spaces between Buildings; Earthscan: London, UK, 2011; p. 257. [Google Scholar]
Figure 1. Bird-view (a) and satellite image (b) of Lujiazui (LJZ) elevated walkway.
Sustainability 08 00744 g001
Figure 2. Field measurement on the Lujiazui Elevated Walkway (LEW): measured points (a) and traverse routes (b).
Sustainability 08 00744 g002
Figure 3. Meteorological data at Lujiazui Central Green Station (CGS). (a) air temperature, humidity and solar radiation; (b) wind direction; (c) wind velocity.
Sustainability 08 00744 g003
Figure 4. Inter-urban Temperature Differential (ITD) (a) and Wind Velocity Ratio (WVR); (b) comparison below and above LEW.
Sustainability 08 00744 g004
Figure 5. Mean radiant temperature (MRT) (a) and physiological equivalent temperature (PET); (b) comparison below and above LEW.
Sustainability 08 00744 g005
Figure 6. ITD (a) and WVR (b) comparison shaded and un-shaded.
Sustainability 08 00744 g006
Figure 7. MRT (a) and PET (b) comparison between shaded and un-shaded.
Sustainability 08 00744 g007
Figure 8. Linear-fit estimates of air temperature (Ta) with (a) sky view factor (SVF) and (b) Ta_cg.
Sustainability 08 00744 g008
Figure 9. Linear-fit estimates of Mean radiant temperature (MRT) with (a) Ta_cg; (b) SVF and (c) Green plot ratio (GPR).
Sustainability 08 00744 g009
Figure 10. Linear-fit estimates of PET with (a) Ta_cg; (b) SVF and (c) GPR.
Sustainability 08 00744 g010
Figure 11. Thermal sensation vote comparison.
Sustainability 08 00744 g011
Figure 12. Wind velocity perception comparison.
Sustainability 08 00744 g012
Figure 13. Thermal comfort perception comparison.
Sustainability 08 00744 g013
Figure 14. Diagram showing possible thermal buoyancy circulation under LEW.
Sustainability 08 00744 g014
Figure 15. Diagrams of various forms of shading form for elevated walkway (EW). (a) Adjustable shading; (b) Blind shading; (c) vegetation shading; (d) Low-e glass shading; (e) opaque shading; (f) PV panel shading; (g) ETFE shading; (h) Tree shading.
Sustainability 08 00744 g015
Figure 16. Examples of shading devices for EW.
Sustainability 08 00744 g016
Table 1. Instrument specification.
ModelParameterAccuracyOperating Range
Temperature/RH Smart Sensor: Hobo S-THB-M002Ta, RH±0.2 °C (0–50 °C); ±2.5% RH (10%–90%)−40 °C–75 °C; RH ≤ 95%
Wind direction smart sensors: Hobo S-WDA-M003 (on the fixed station only)WD ±3% (17–30 m/s); ±4% (30–44 m/s) WV; ±5° (WD)0–44 m/s WV
0–355° WD
Wind velocity sensor: Cambridge Accusense sensor T-DCI-F900-S-P WV±5% of reading or ±0.05 m/s (15–35 °C)0–10 m/s
Temperature smart sensor: S-TMB-M002 (installed in a 40 mm matt-grey vinyl ball) Tg±0.2 °C (0–50 °C)−40–100 °C
Global radiation sensor: Hobo S-LIB-M003 (on the fixed station only)GSR±2% at 45° from vertical0–1280 W/m2 (300–1100 nm)
Note: Ta-air temperature; RH-relative humidity; WD-wind direction; WV-wind velocity; Tg-globe temperature; GSR-global solar radiation.
Table 2. Micrometeorological conditions during the field campaign at the Central Green Station.
DateTa (°C)RH (%)WV (m/s)GSR (W/m2)
MaxMinMeanMaxMinMeanMaxMeanMaxMinMean
7.1734.329.232.076.457.465.33.780.7712770.60481
7.1833.629.131.980.258.767.84.530.77116953.1325
7.2236.230.633.874.549.559.74.531.1095688.1683
Mean34.729.732.577.055.264.34.280.88113447.3496

