Towards a Climate-Responsive Vertical Pedestrian System: An Empirical Study on an Elevated Walkway in Shanghai China
Abstract
:1. Introduction
2. Materials and Methods
3. Results
3.1. Comparisons between, over, and under LEW
3.1.1. ITD and WVR Comparison
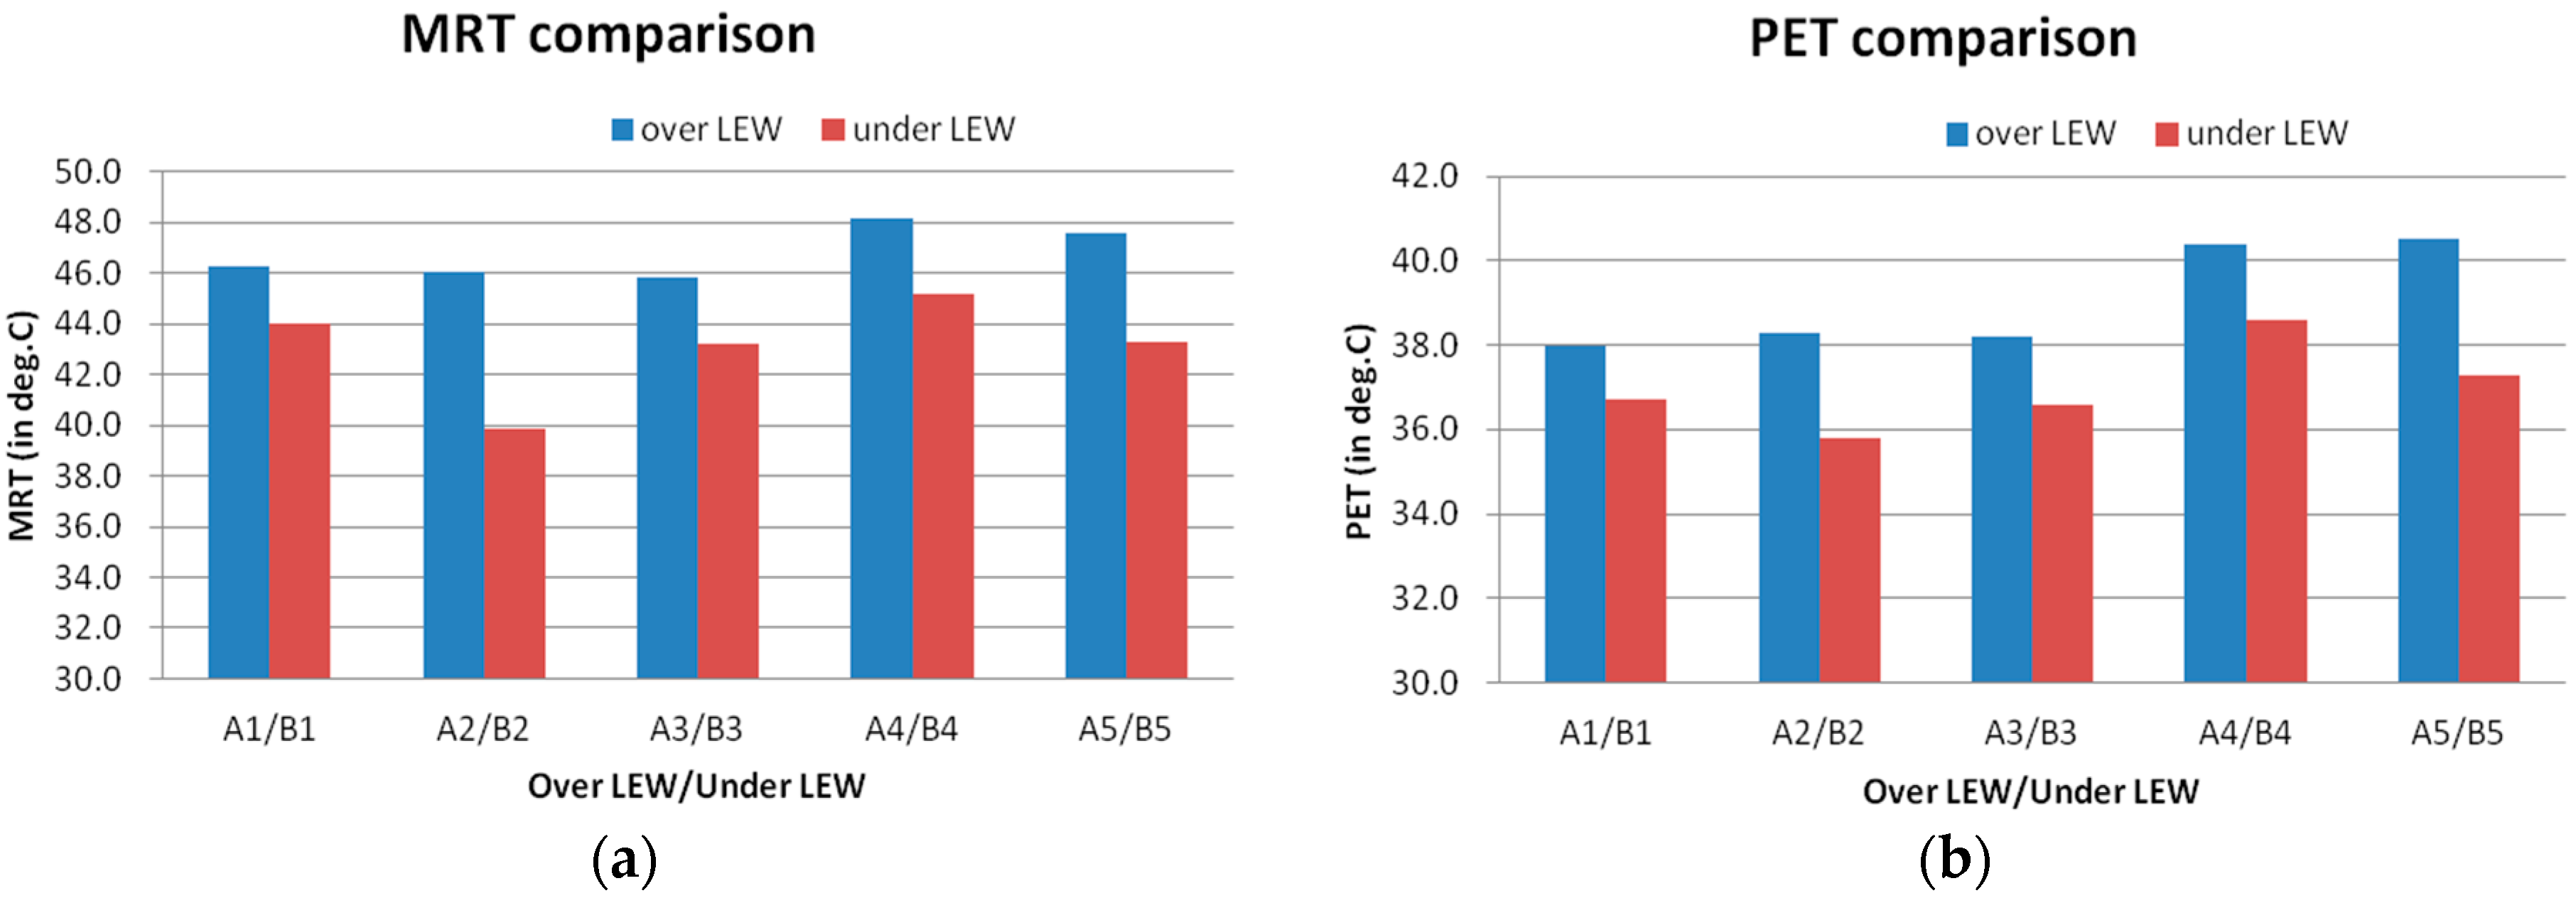
3.1.2. MRT and PET Comparison
3.2. Comparison between Shaded and Un-Shaded
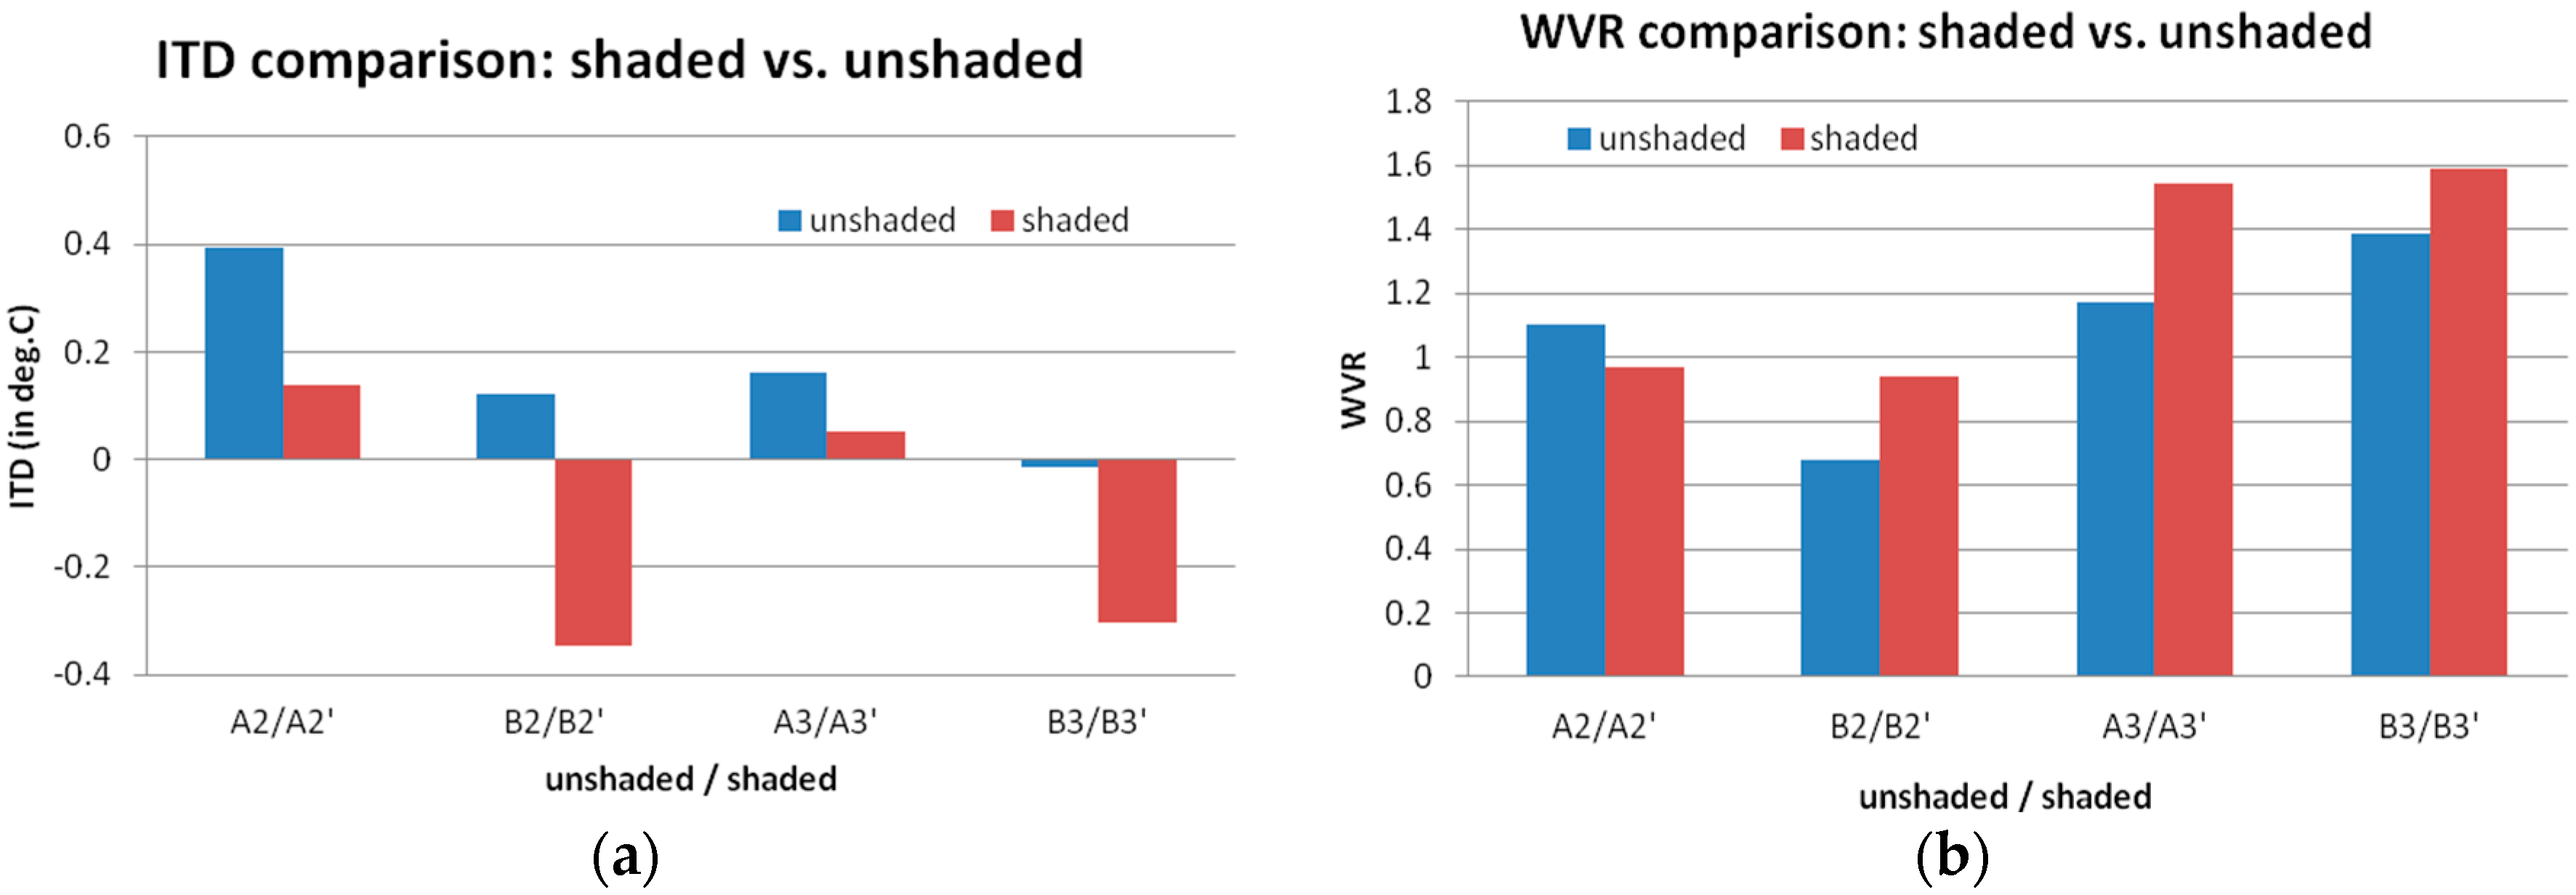
3.2.1. ITD and WVR Comparison
3.2.2. MRT and PET Comparison
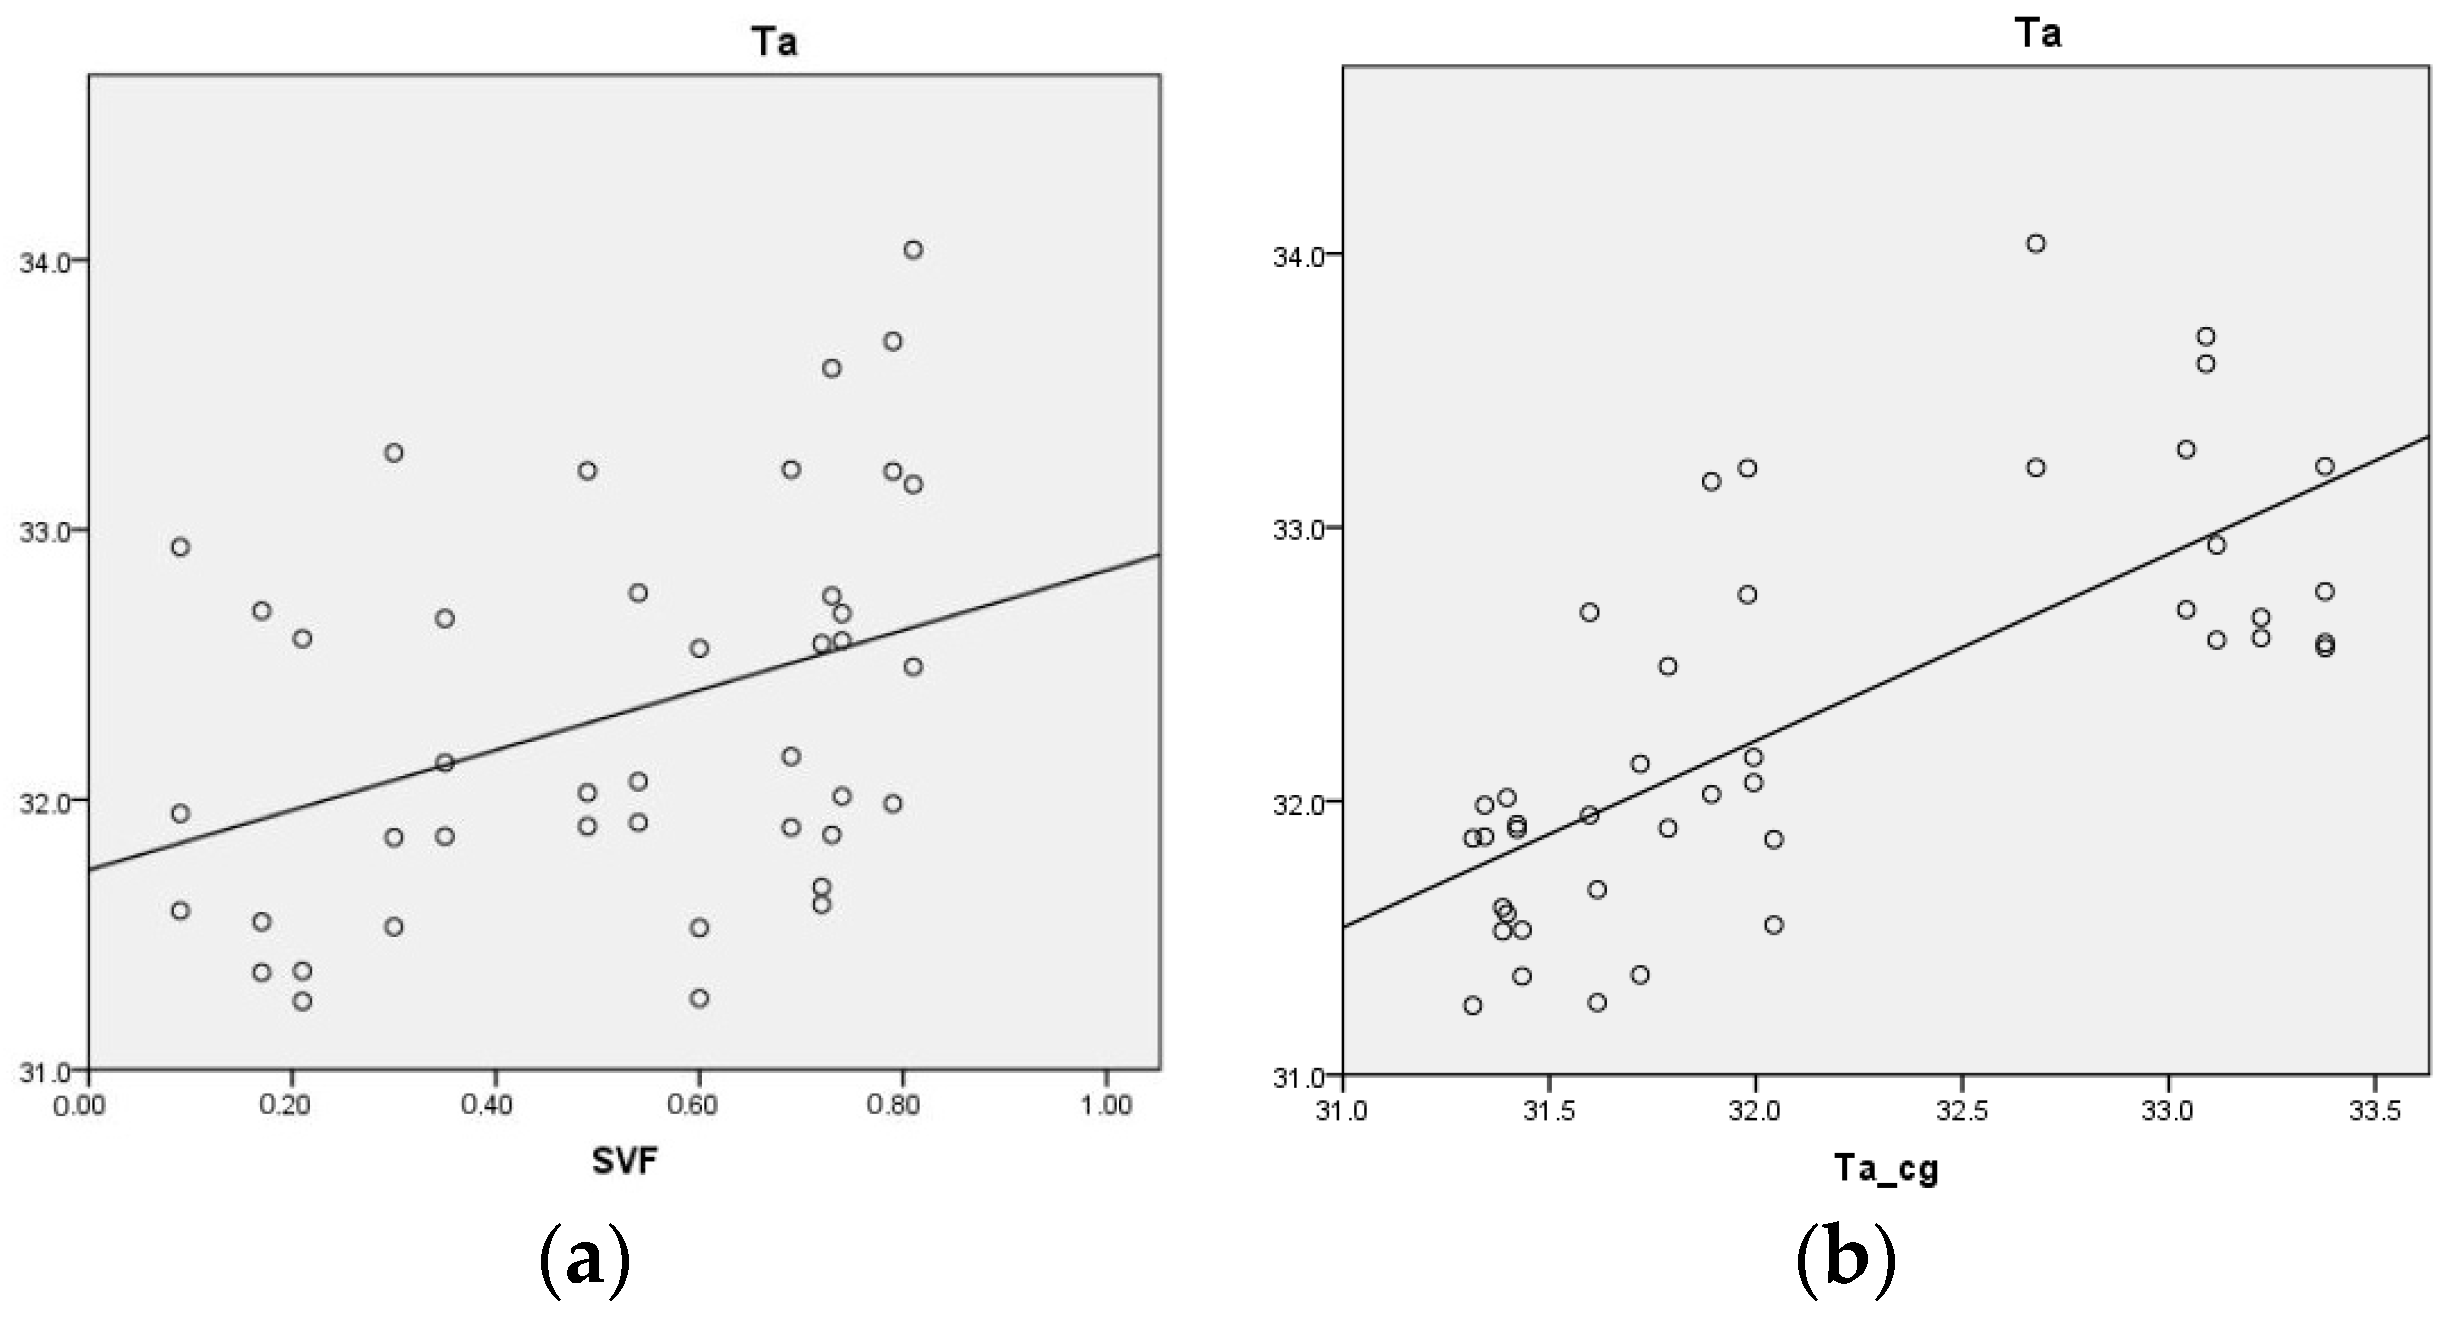
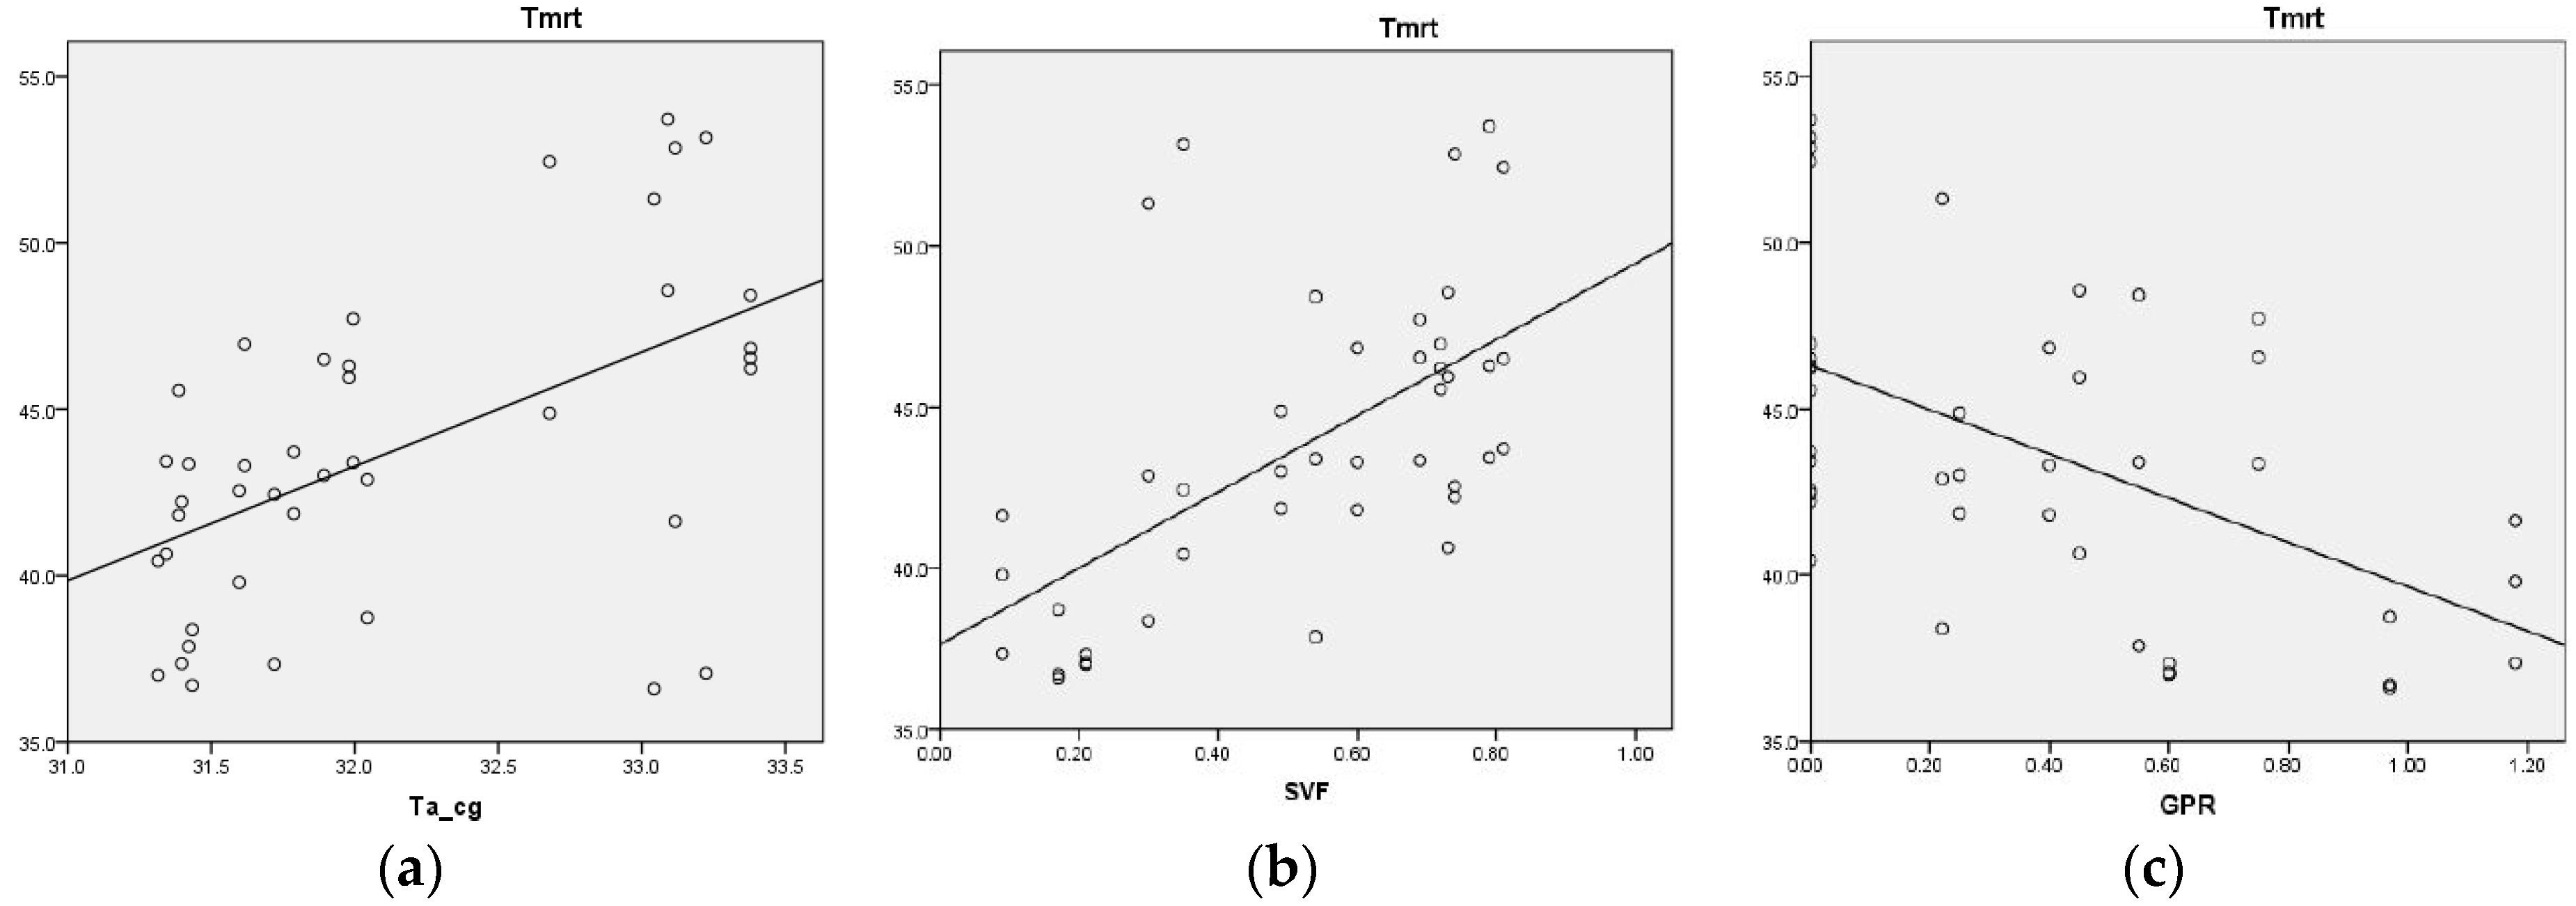
3.3. Regression Analysis
3.4. Questionnaire Survey
4. Discussion
5. Conclusions
- (1)
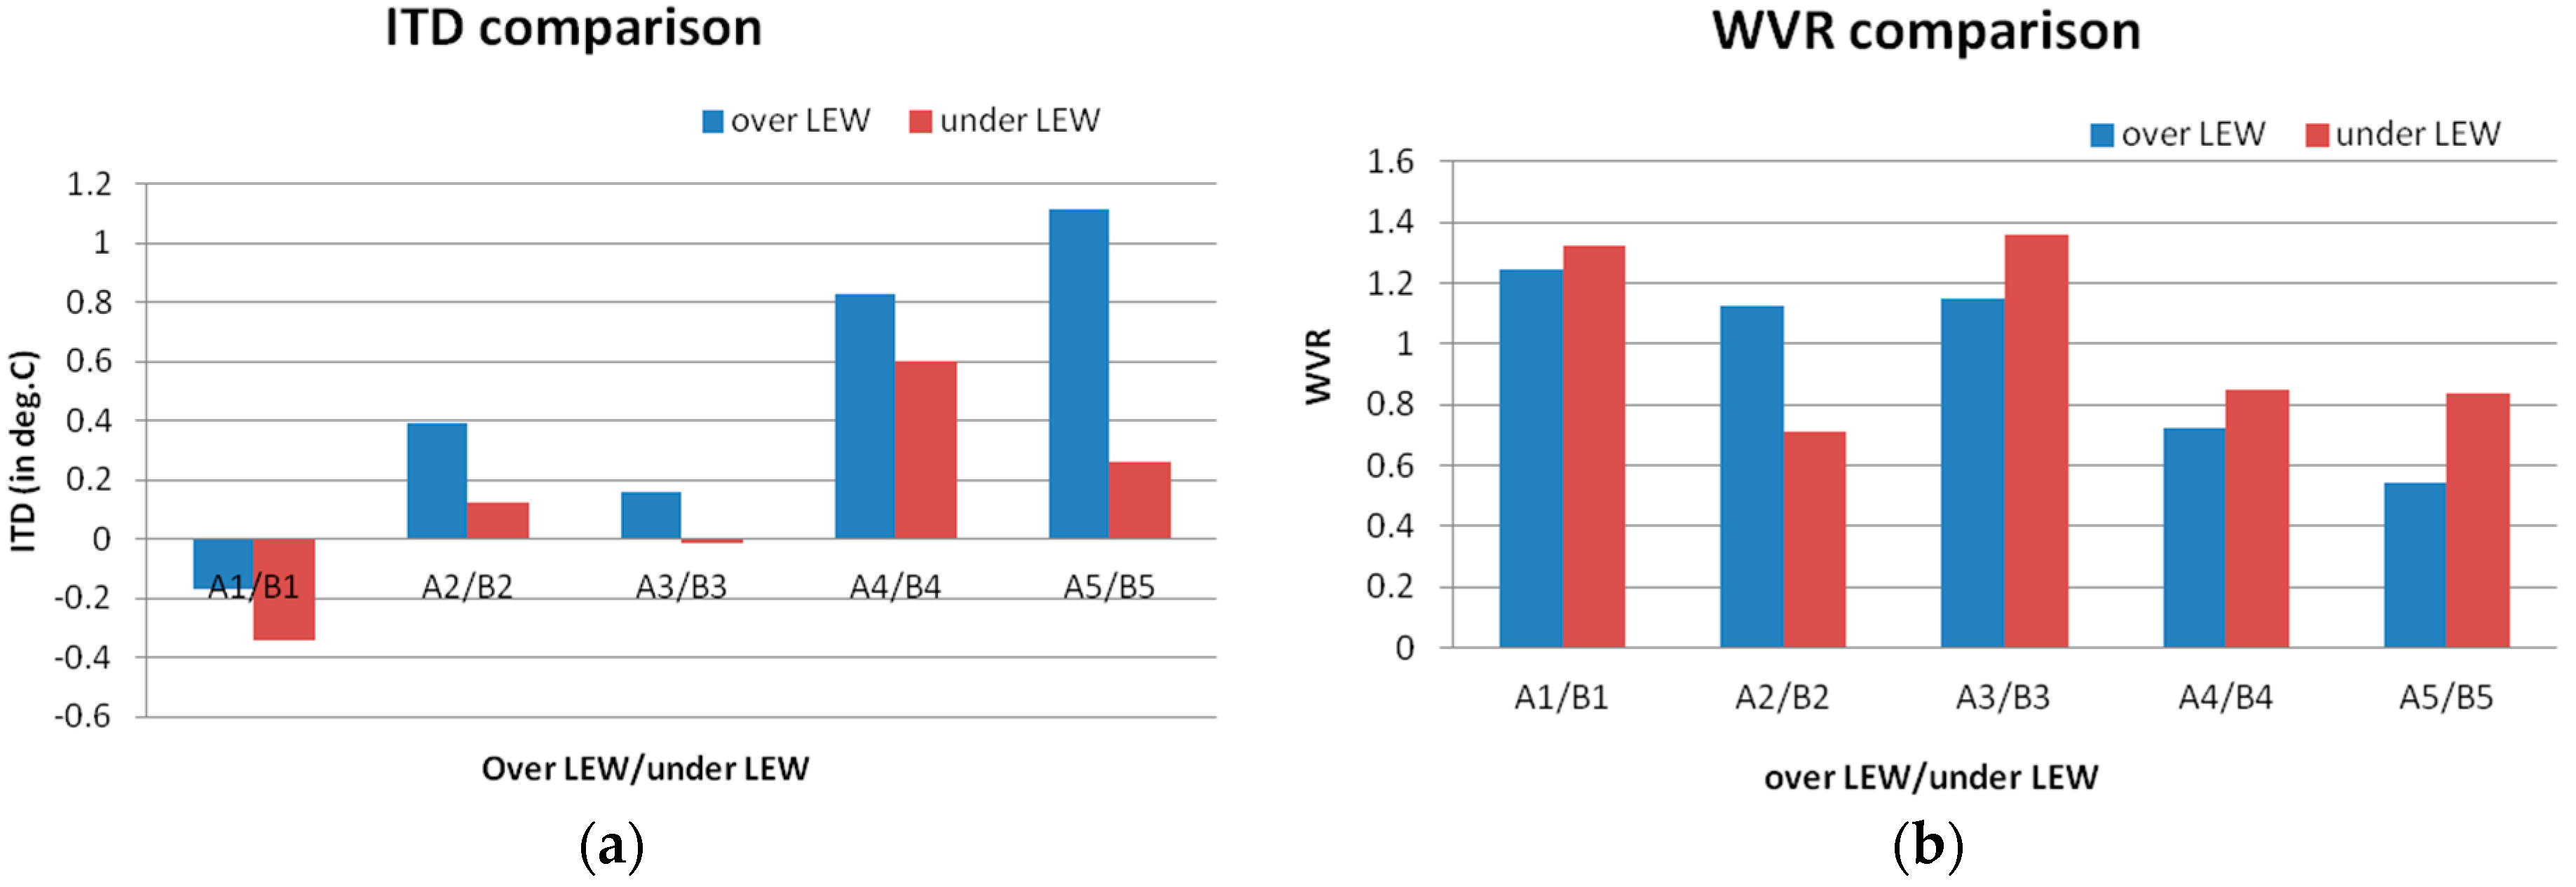
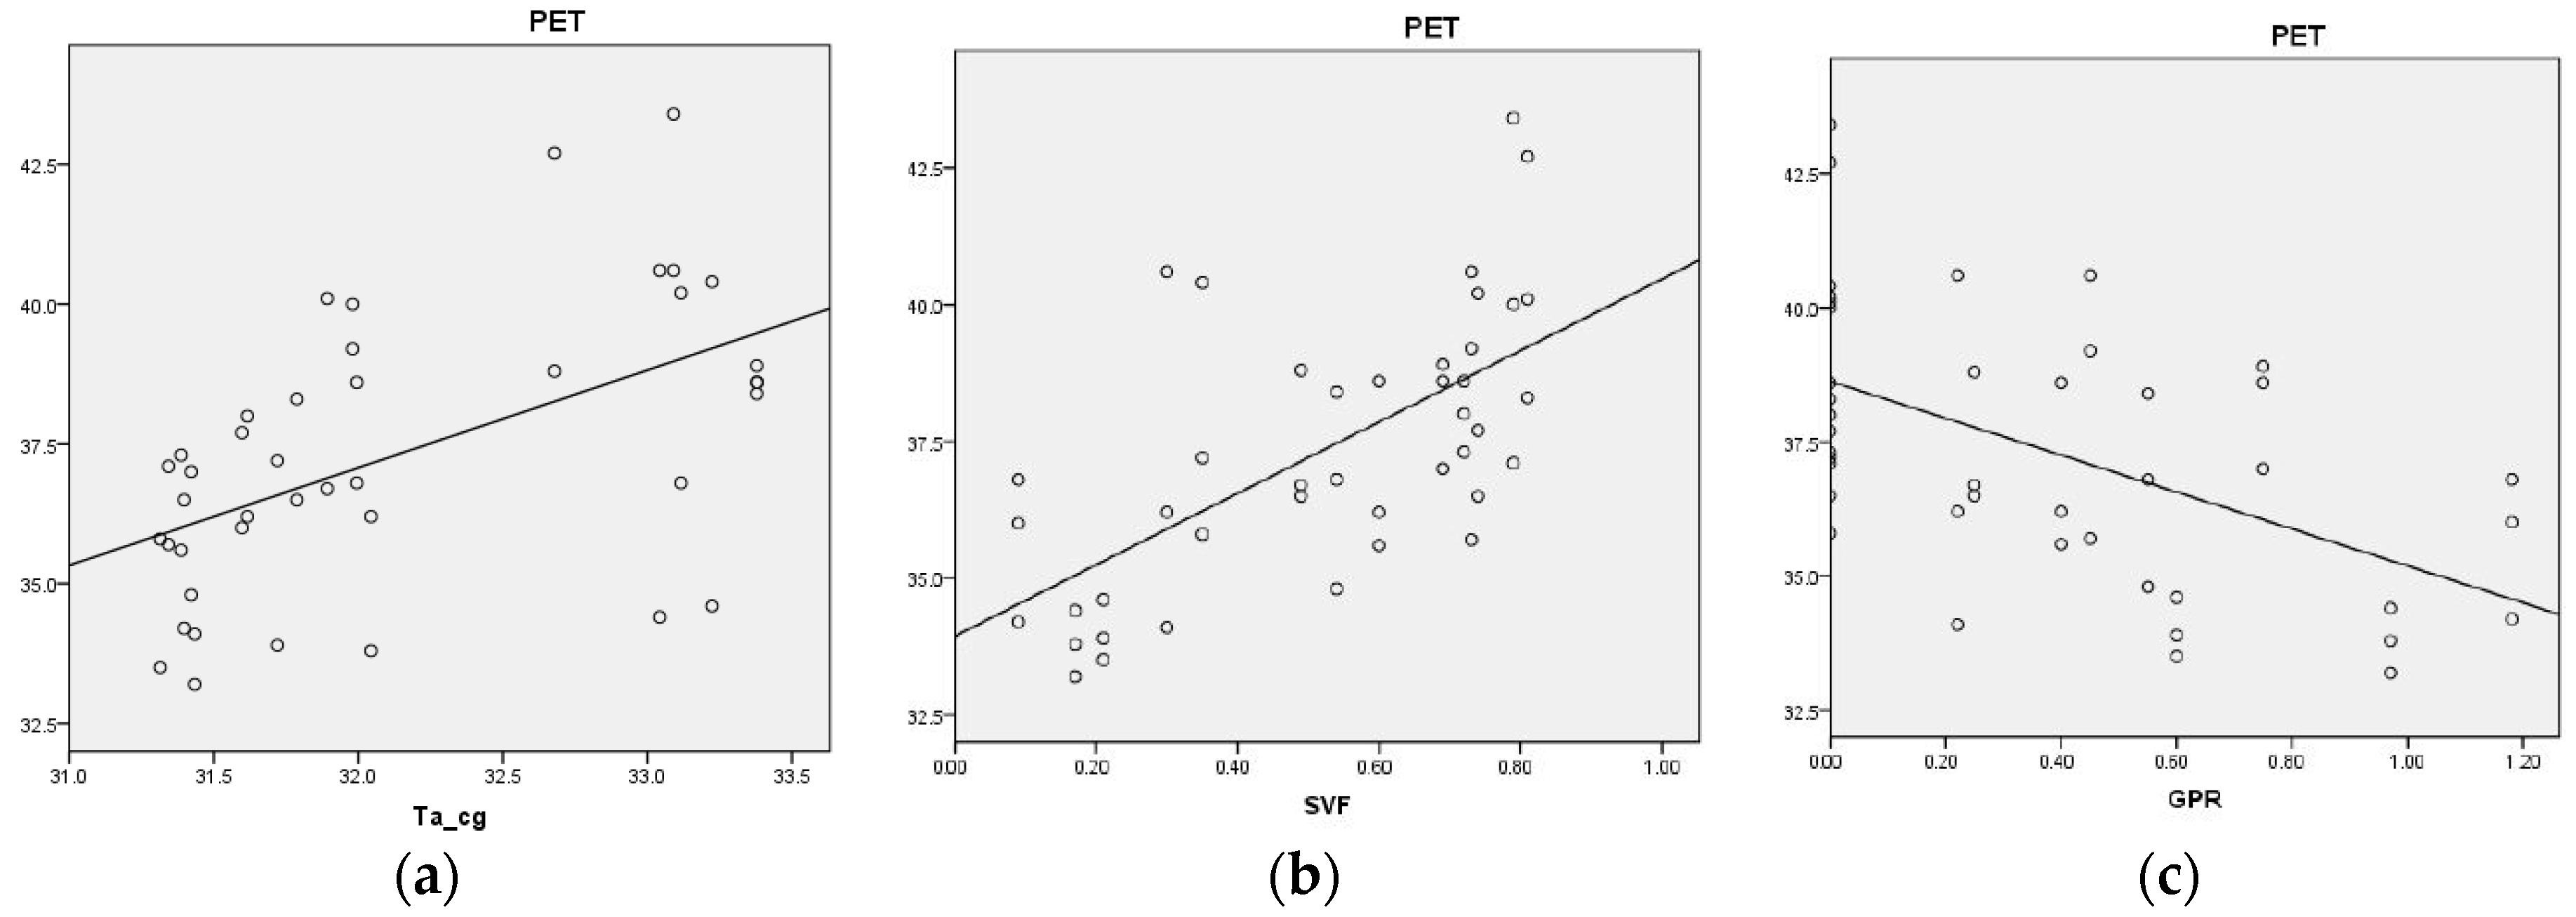
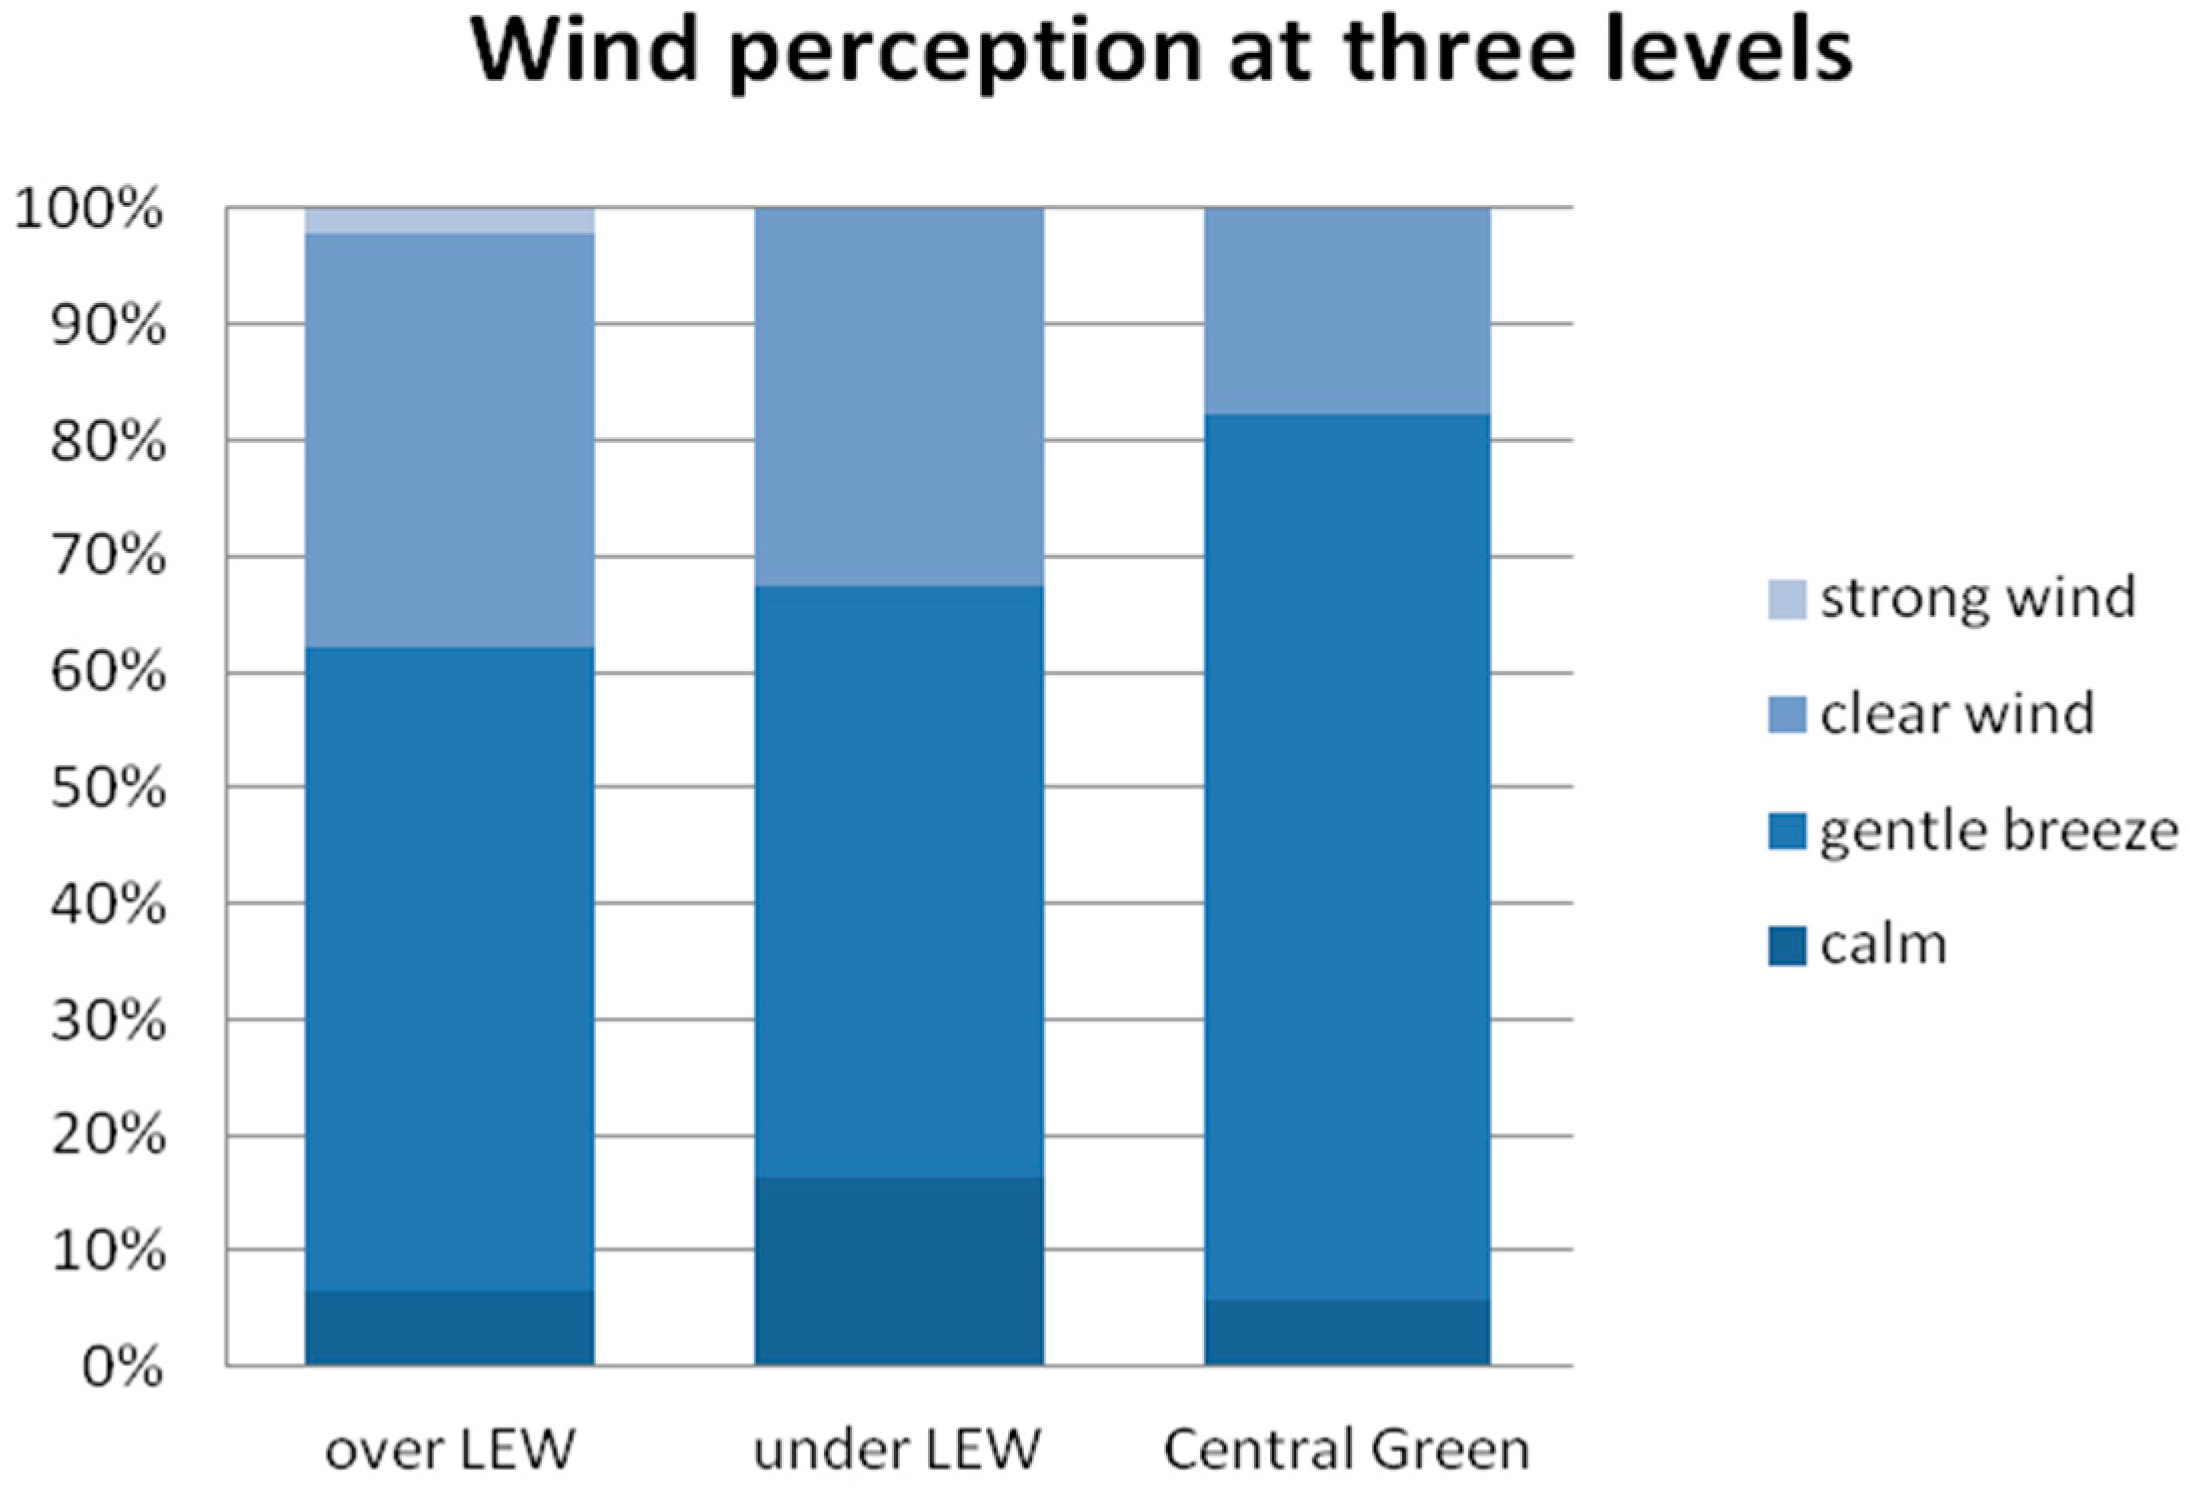
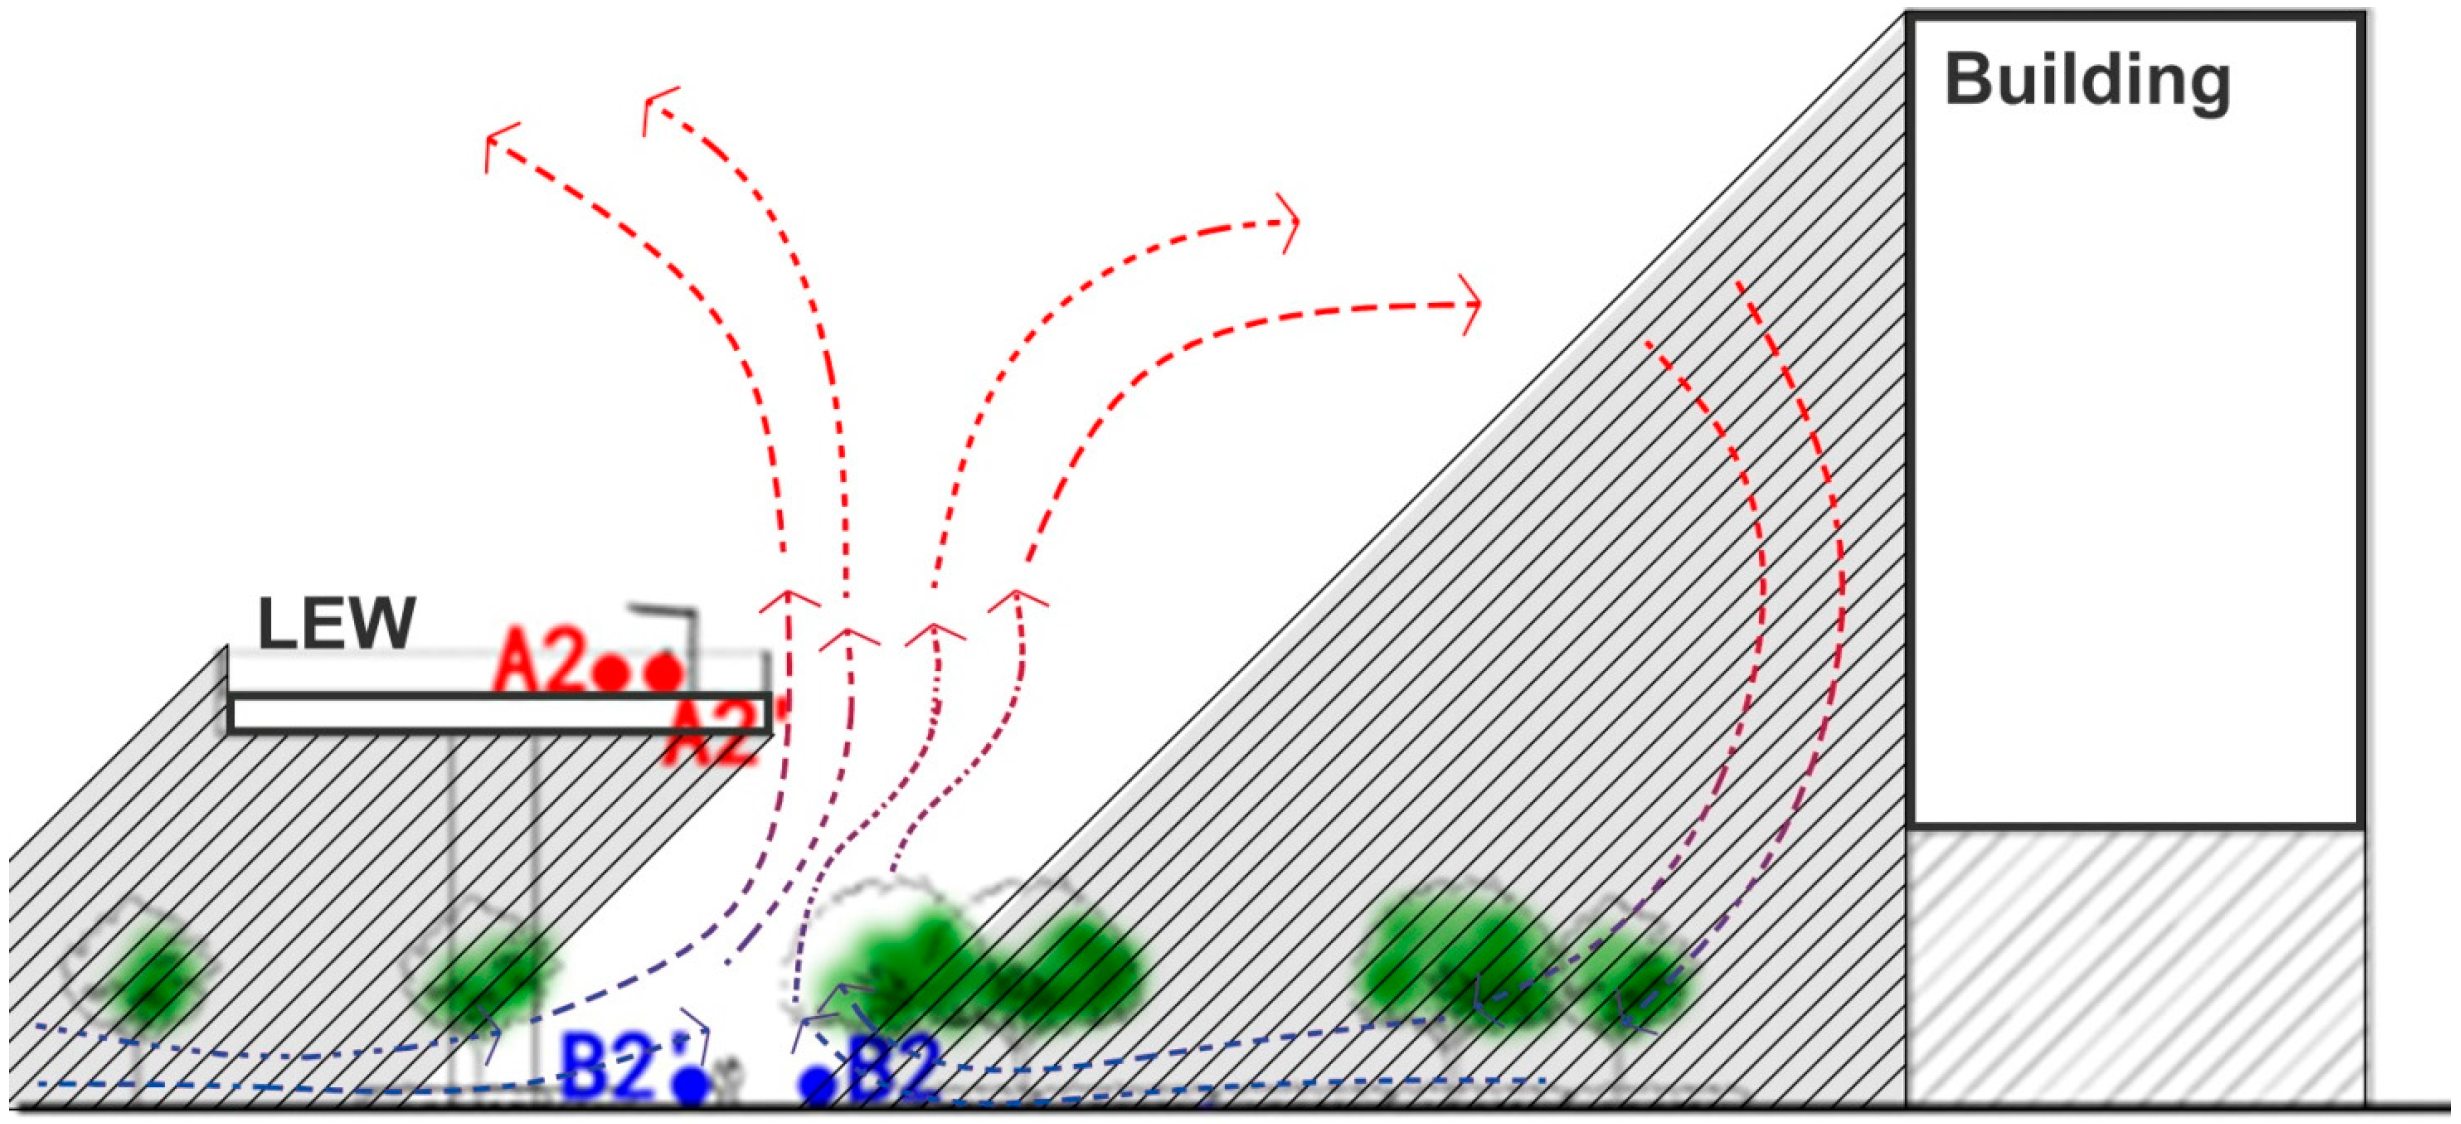
- The measured locations over the LEW are thermally more uncomfortable than those below it. Air temperature was higher, whereas wind velocity is lower on the LEW level than on the ground level, which is counter-intuitive. It is possible that the horizontal convection on the ground level was enhanced due to thermal buoyancy between shaded and un-shaded places.
- (2)
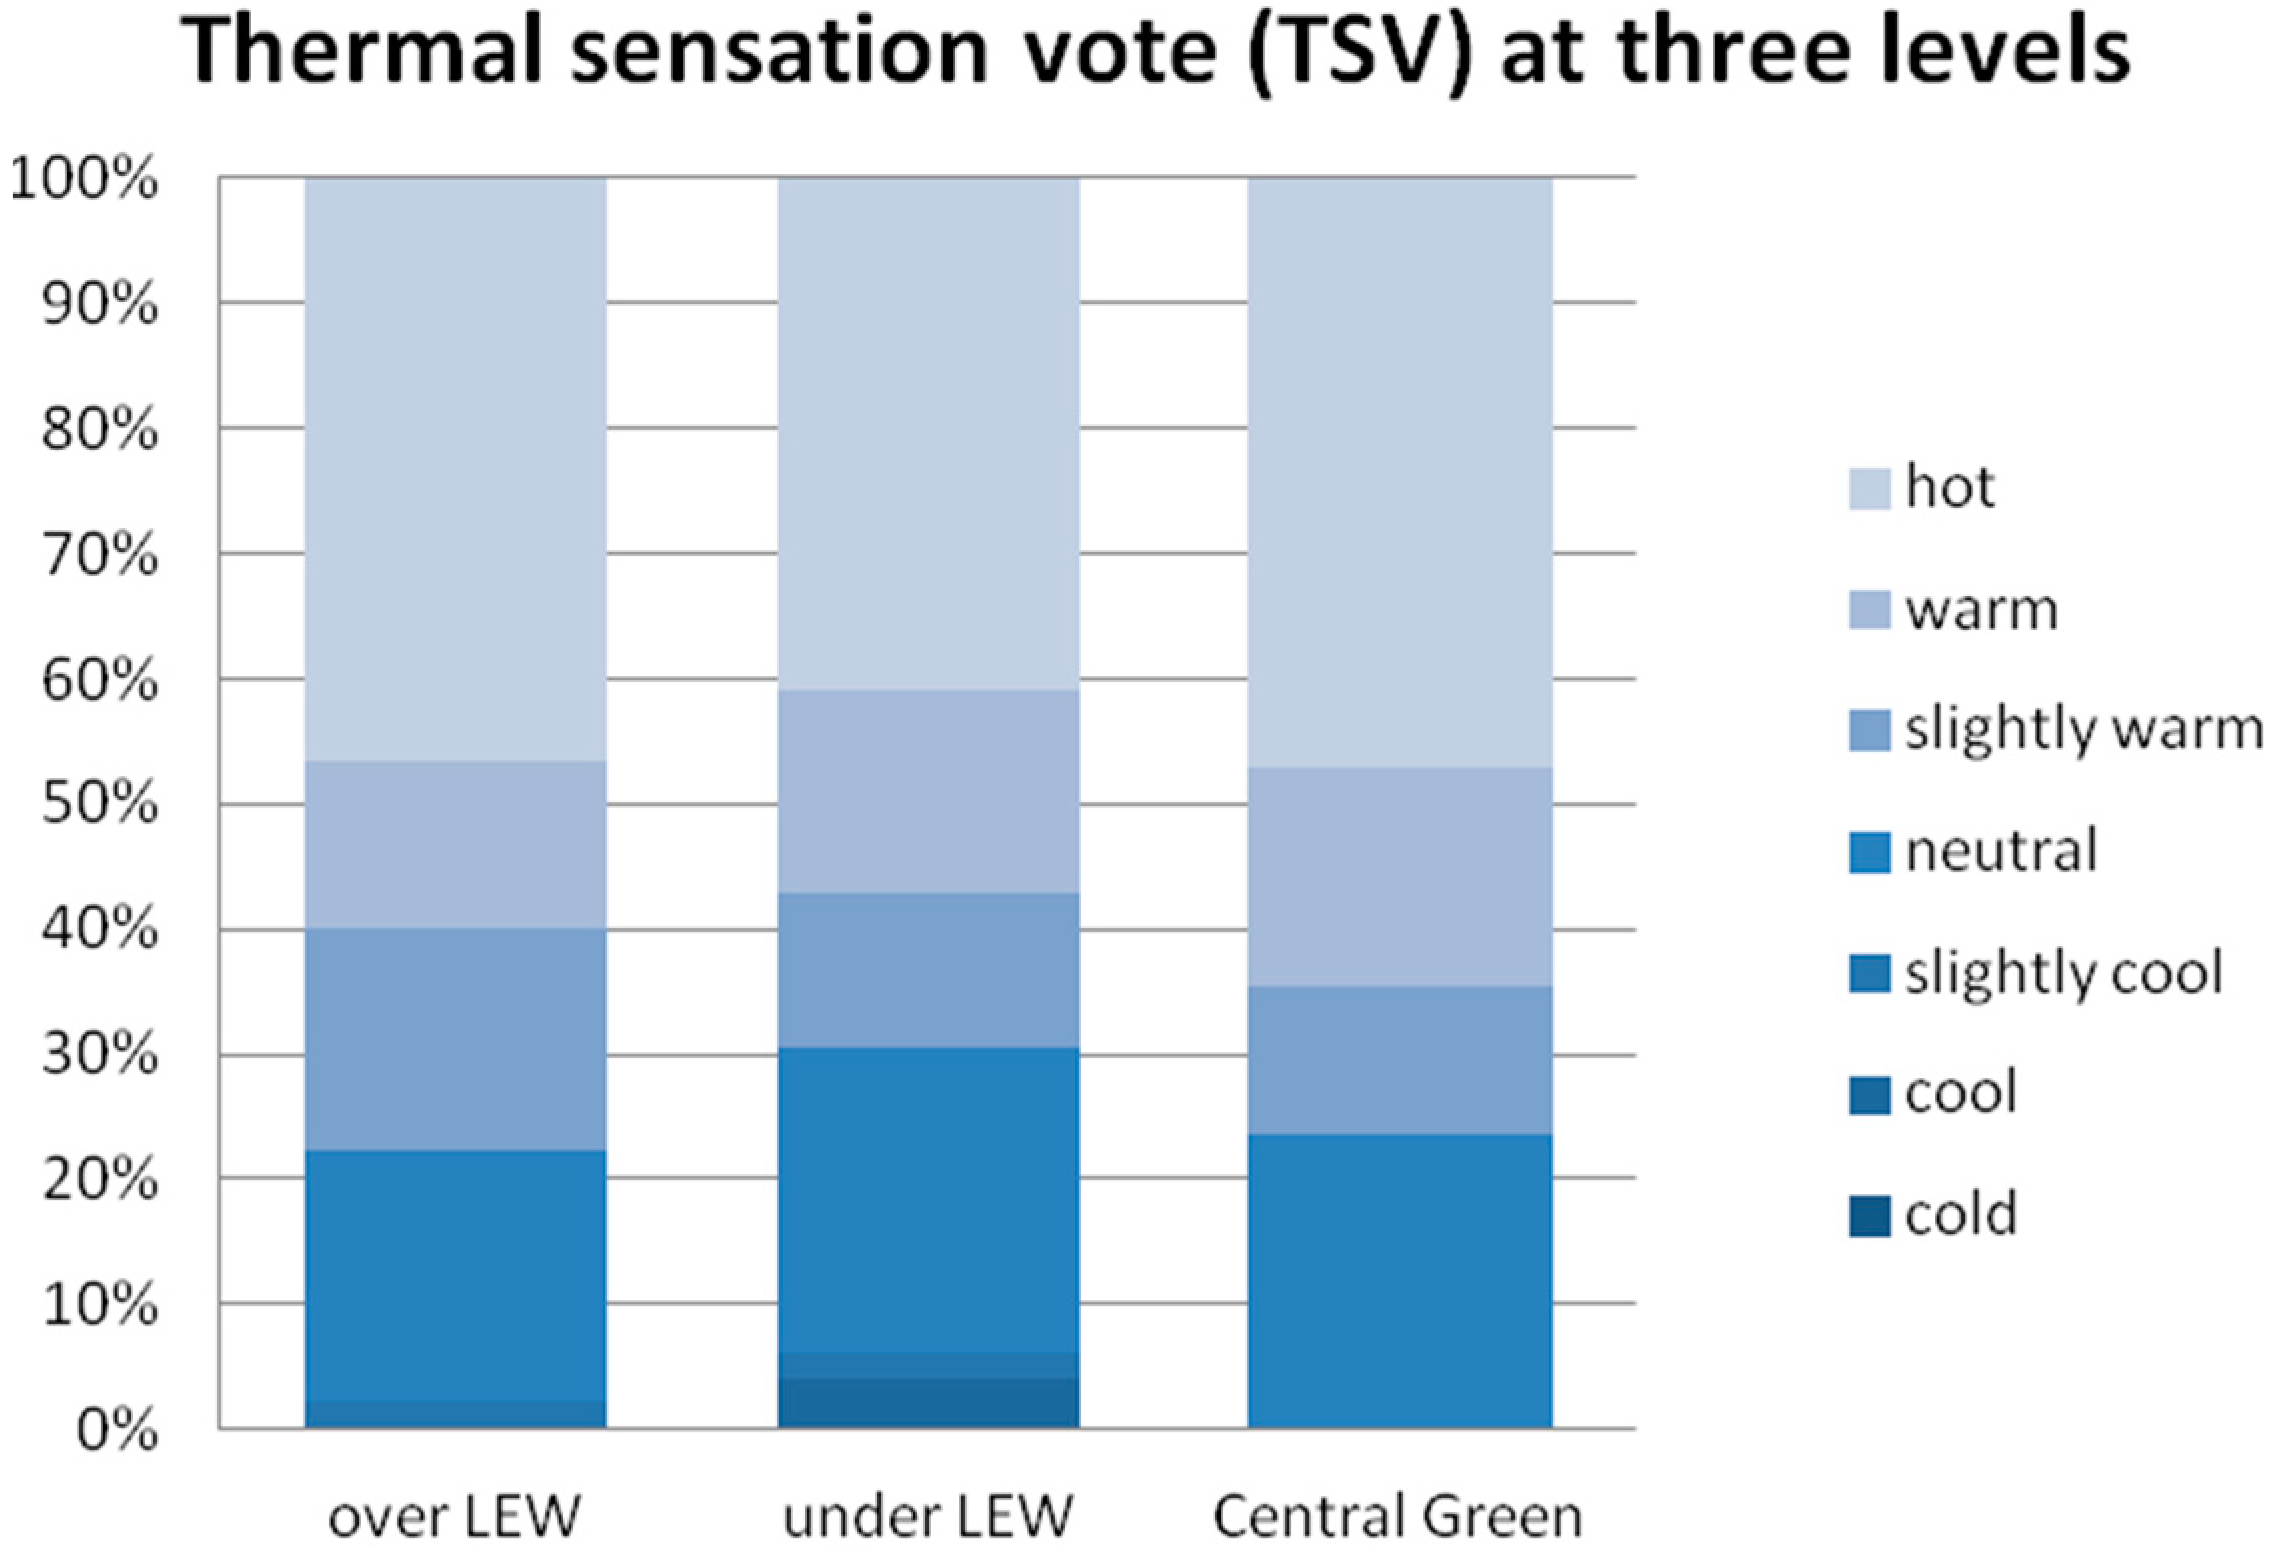
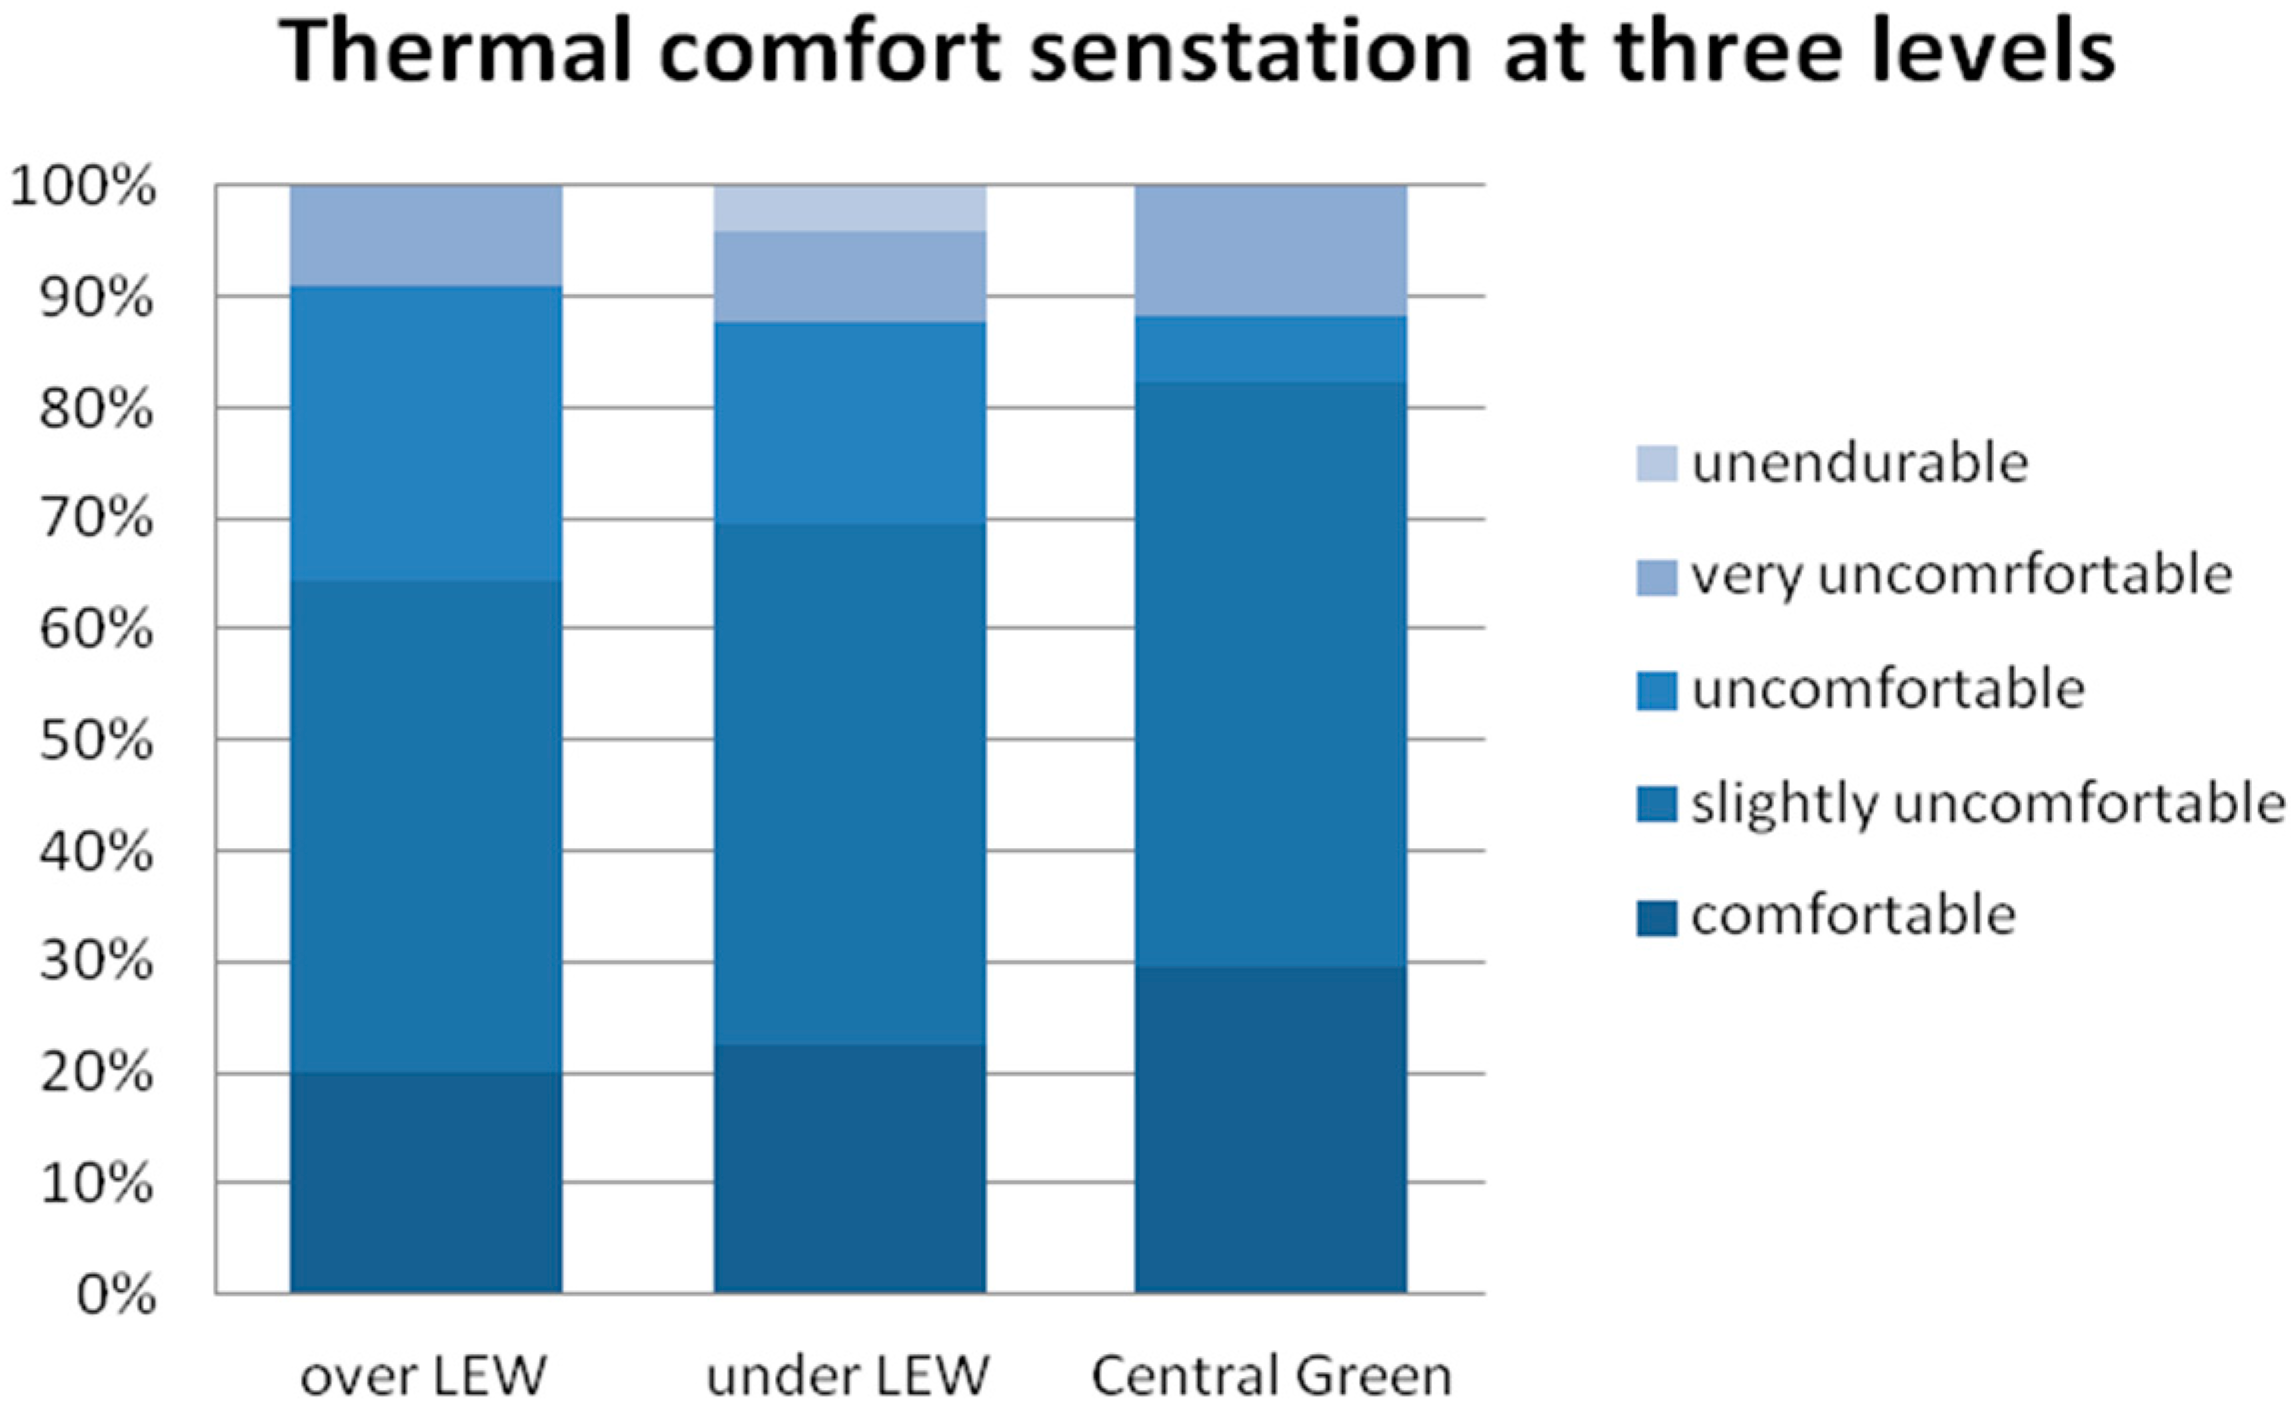
- Indicated by the calculated thermal comfort index (physiological equivalent temperature, PET), it was averagely hot both over and below the LEW during the measured period, although PET was 1–3 °C lower at below the LEW. In addition, about 80% of respondents reported being uncomfortable above the LEW, whereas this was 5% lower at below the LEW.
- (3)
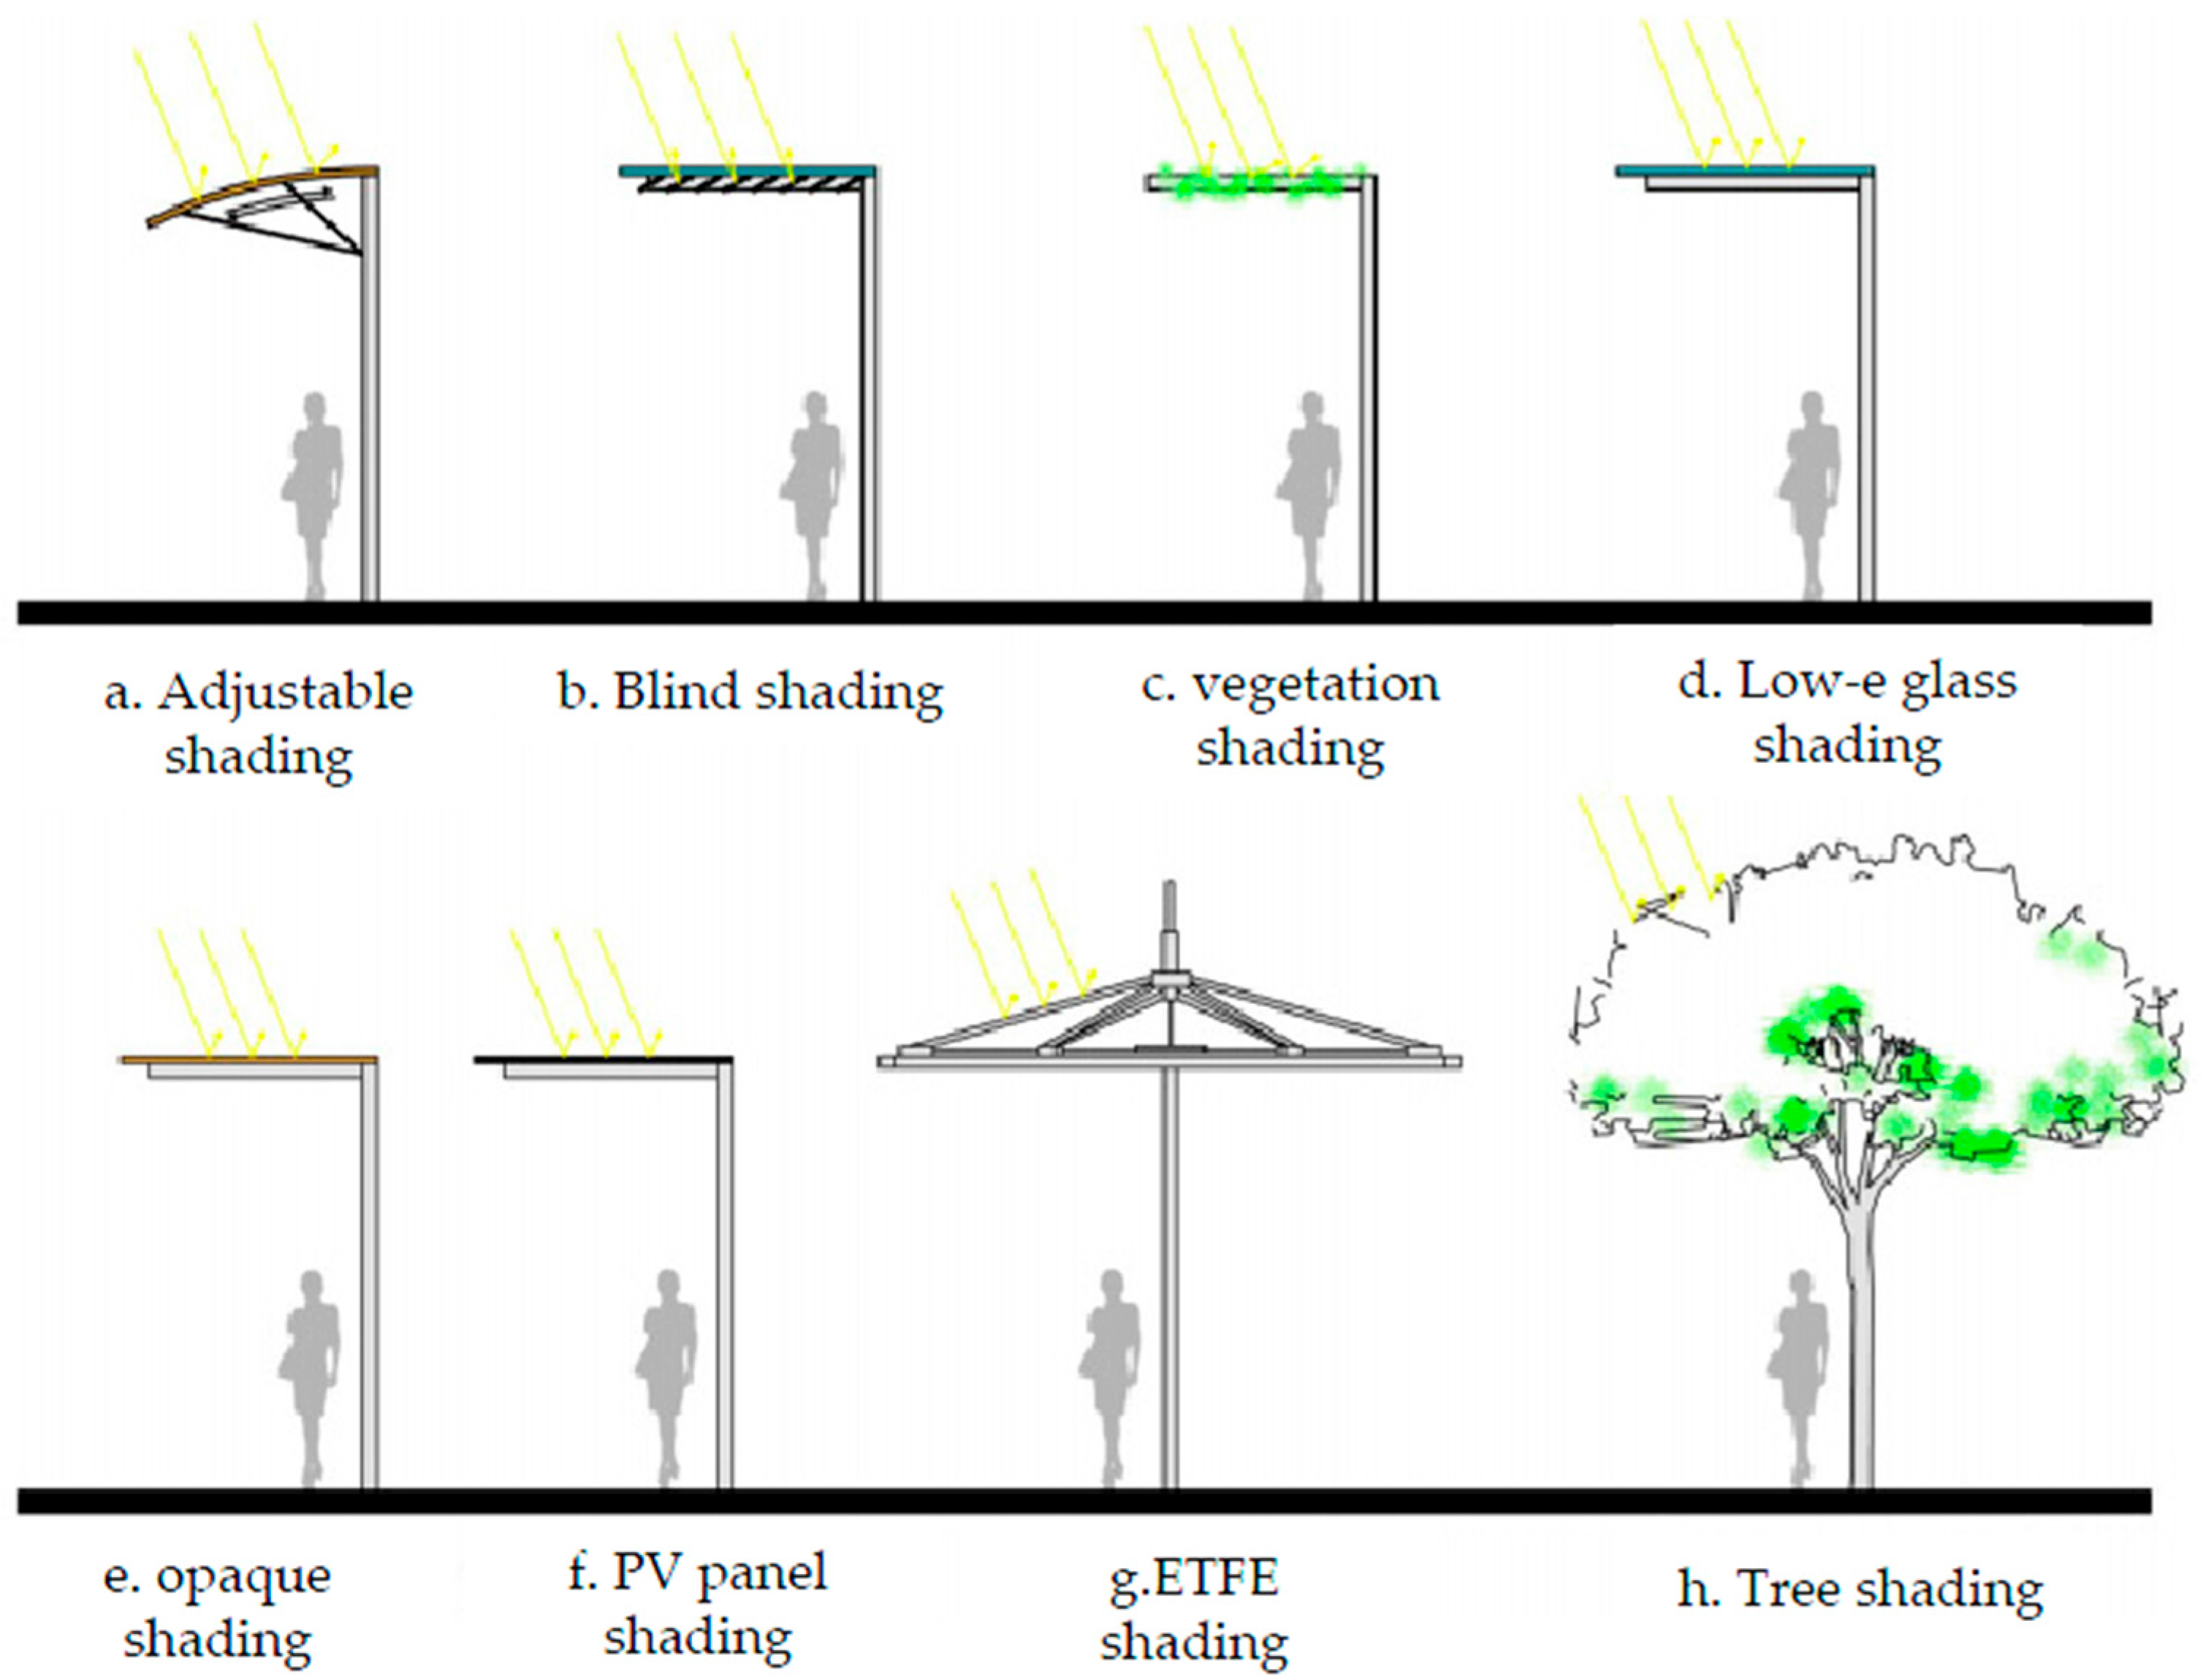
- Shaded locations can be warm while un-shaded places can be hot indicated by PET. Opaque concrete shading is most effective in lowering Tmrt, followed by tree canopy and glass-steel canopy.
- (4)
- To achieve a thermally comfortable LEW, passive cooling systems such as shading are vital but not enough. Active energy measures can be combined with shading devices, to increase air movement and reduce sensible heat, by a carefully integrated system design.
Acknowledgments
Author Contributions
Conflicts of Interest
Abbreviations
| CBD | central business district |
| CGS | Central Green station |
| EW | elevated walkway |
| GPR | green plot ratio |
| GSR | global solar radiation |
| ITD | inter-urban temperature differential |
| LCG | Lujiazui Central Green |
| LEW | Lujiazui elevated walkway |
| LJZ | Lujiazui |
| MRT | mean radiant temperature |
| PET | physiological equivalent temperature |
| RH | relative humidity |
| SVF | sky view factor |
| Ta | air temperature |
| Ta_cg | background air temperature measured at CGS |
| Tg | globe temperature |
| TSV | thermal sensation vote |
| WD | wind direction |
| WV | wind velocity |
| WVR | wind velocity ratio |
References
- Corbett, M.J.; Xie, F.; Levinson, D.M. Evolution of the second-story city: The Minneapolis Skyway System. Environ. Plan. B Plan. Des. 2009, 36, 711–724. [Google Scholar] [CrossRef]
- Robertson, K.A. Pedestrian skywalks in Calgary, Canada: A comparison with US downtown systems. Cities 1987, 4, 207–214. [Google Scholar] [CrossRef]
- Cui, J.; Allan, A.; Lin, D. The development of grade separation pedestrian system: A review. Tunn. Undergr. Space Technol. 2013, 38, 151–160. [Google Scholar] [CrossRef]
- Rotmeyer, J. Can elevated pedestrian walkways be sustainable? WIT Trans. Ecol. Environ. 2006, 93, 293–302. [Google Scholar]
- Byers, J.P. Breaking the Ground Plane: The Evolution of Grade Separated Cities in North America; University of Minnesota: Minneapolis, MN, USA, 1998. [Google Scholar]
- Lau, S.S.Y.; Giridharan, R.; Ganesan, S. Multiple and intensive land use: Case studies in Hong Kong. Habitat Int. 2005, 29, 527–546. [Google Scholar] [CrossRef]
- Hu, S. Planning an Above Ground Pedestrian Network in Central Zhujiang New District Guangzhou. J. Plan. 2010, 26, 36–40. (In Chinese) [Google Scholar]
- Mastura, A.; Keumala, N.; Taofeekat, O.M.; Rohana, J. Innovative Elevated Walkway for a Liveable Kuala Lumpur City. In World Renewable Energy Congress—WREC XIII; Kingston University: London, UK, 2014. [Google Scholar]
- Bottema, M. Towards rules of thumb for wind comfort and air quality. Atmos. Environ. 1999, 33, 4009–4017. [Google Scholar] [CrossRef]
- Janssen, W.D.; Blocken, B.; van Hooff, T. Pedestrian wind comfort around buildings: Comparison of wind comfort criteria based on whole-flow field data for a complex case study. Build. Environ. 2013, 59, 547–562. [Google Scholar] [CrossRef]
- Wu, H.; Kriksic, F. Designing for pedestrian comfort in response to local climate. J. Wind Eng. Ind. Aerodyn. 2012, 104–106, 397–407. [Google Scholar] [CrossRef]
- Peng, C.; Ming, T.; Gui, J.; Tao, Y.; Peng, Z. Numerical analysis on the thermal environment of an old city district during urban renewal. Energy Build. 2015, 89, 18–31. [Google Scholar] [CrossRef]
- Parsons, K.C. Human Thermal Environments: The Effects of Hot, Moderate, and Cold Environments on Human Health Comfort and Performance; Taylor & Francis: London, UK, 2003. [Google Scholar]
- Klemm, W.; Heusinkveld, B.G.; Lenzholzer, S.; van Hove, B. Street greenery and its physical and psychological impact on thermal comfort. Landsc. Urban Plan. 2015, 138, 87–98. [Google Scholar] [CrossRef]
- Krüger, E.L.; Minella, F.O.; Rasia, F. Impact of urban geometry on outdoor thermal comfort and air quality from field measurements in Curitiba, Brazil. Build. Environ. 2011, 46, 621–634. [Google Scholar]
- Chatzidimitriou, A.; Yannas, S. Microclimate development in open urban spaces: The influence of form and materials. Energy Build. 2015, 108, 156–174. [Google Scholar] [CrossRef]
- ISO. Ergonomics of the Thermal Environment—Instruments for Measuring Physical Quantities; ISO-7726; International Organization for Standardization (ISO): Geneva, Switzerland, 1998. [Google Scholar]
- Ng, E.; Chen, V. Urban human thermal comfort in hot and humid Hong Kong. Energy Build. 2012, in press. [Google Scholar] [CrossRef]
- Hoppe, P. The physiological equivalent temperature—A universal index for the biometeorological assessment of the thermal environment. Int. J. Biometeorol. 1999, 43, 71–75. [Google Scholar] [CrossRef] [PubMed]
- Matzarakis, A.; Mayer, H.; Iziomon, M.G. Applications of a universal thermal index: Physiological equivalent temperature. Int. J. Biometeorol. 1999, 43, 76–84. [Google Scholar] [CrossRef] [PubMed]
- Yang, F.; Lau, S.S.Y.; Qian, F. Urban design to lower summertime outdoor temperatures: An empirical study on high-rise housing in Shanghai. Build. Environ. 2011, 46, 769–785. [Google Scholar] [CrossRef]
- Yang, F.; Lau, S.S.Y.; Qian, F. Summertime heat island intensities in three high-rise housing quarters in inner-city Shanghai China: Building layout, density and greenery. Build. Environ. 2010, 45, 115–134. [Google Scholar] [CrossRef]
- Yang, F.; Lau, S.; Qian, F. Cooling performance of residential greenery in localised urban climates: A case study in Shanghai China. Int. J. Environ. Technol. Manag. 2015, 18, 478–503. [Google Scholar] [CrossRef]
- Yang, F.; Chen, L. Developing a thermal atlas for climate-responsive urban design based on empirical modeling and urban morphological analysis. Energy Build. 2016, 111, 120–130. [Google Scholar] [CrossRef]
- Yang, F.; Qian, F.; Lau, S.S.Y. Urban form and density as indicators for summertime outdoor ventilation potential: A case study on high-rise housing in Shanghai. Build. Environ. 2013, 70, 122–137. [Google Scholar] [CrossRef]
- Erell, E.; Pearlmutter, D.; Williamson, T. Urban Microclmate: Designing the Spaces between Buildings; Earthscan: London, UK, 2011; p. 257. [Google Scholar]


| Model | Parameter | Accuracy | Operating Range |
|---|---|---|---|
| Temperature/RH Smart Sensor: Hobo S-THB-M002 | Ta, RH | ±0.2 °C (0–50 °C); ±2.5% RH (10%–90%) | −40 °C–75 °C; RH ≤ 95% |
| Wind direction smart sensors: Hobo S-WDA-M003 (on the fixed station only) | WD | ±3% (17–30 m/s); ±4% (30–44 m/s) WV; ±5° (WD) | 0–44 m/s WV 0–355° WD |
| Wind velocity sensor: Cambridge Accusense sensor T-DCI-F900-S-P | WV | ±5% of reading or ±0.05 m/s (15–35 °C) | 0–10 m/s |
| Temperature smart sensor: S-TMB-M002 (installed in a 40 mm matt-grey vinyl ball) | Tg | ±0.2 °C (0–50 °C) | −40–100 °C |
| Global radiation sensor: Hobo S-LIB-M003 (on the fixed station only) | GSR | ±2% at 45° from vertical | 0–1280 W/m2 (300–1100 nm) |
| Date | Ta (°C) | RH (%) | WV (m/s) | GSR (W/m2) | |||||||
|---|---|---|---|---|---|---|---|---|---|---|---|
| Max | Min | Mean | Max | Min | Mean | Max | Mean | Max | Min | Mean | |
| 7.17 | 34.3 | 29.2 | 32.0 | 76.4 | 57.4 | 65.3 | 3.78 | 0.77 | 1277 | 0.60 | 481 |
| 7.18 | 33.6 | 29.1 | 31.9 | 80.2 | 58.7 | 67.8 | 4.53 | 0.77 | 1169 | 53.1 | 325 |
| 7.22 | 36.2 | 30.6 | 33.8 | 74.5 | 49.5 | 59.7 | 4.53 | 1.10 | 956 | 88.1 | 683 |
| Mean | 34.7 | 29.7 | 32.5 | 77.0 | 55.2 | 64.3 | 4.28 | 0.88 | 1134 | 47.3 | 496 |
© 2016 by the authors; licensee MDPI, Basel, Switzerland. This article is an open access article distributed under the terms and conditions of the Creative Commons Attribution (CC-BY) license (http://creativecommons.org/licenses/by/4.0/).
Share and Cite
Yang, F.; Qian, F.; Zhao, W. Towards a Climate-Responsive Vertical Pedestrian System: An Empirical Study on an Elevated Walkway in Shanghai China. Sustainability 2016, 8, 744. https://doi.org/10.3390/su8080744
Yang F, Qian F, Zhao W. Towards a Climate-Responsive Vertical Pedestrian System: An Empirical Study on an Elevated Walkway in Shanghai China. Sustainability. 2016; 8(8):744. https://doi.org/10.3390/su8080744
Chicago/Turabian StyleYang, Feng, Feng Qian, and Wanzhu Zhao. 2016. "Towards a Climate-Responsive Vertical Pedestrian System: An Empirical Study on an Elevated Walkway in Shanghai China" Sustainability 8, no. 8: 744. https://doi.org/10.3390/su8080744
APA StyleYang, F., Qian, F., & Zhao, W. (2016). Towards a Climate-Responsive Vertical Pedestrian System: An Empirical Study on an Elevated Walkway in Shanghai China. Sustainability, 8(8), 744. https://doi.org/10.3390/su8080744


