1. Introduction
Crop production is important for people in Taiwan, while manufacturing industries face more issues than agricultural production. Issues in agricultural production include climatic factors, pests, diseases and the treatment process. Hence, farmers engaged in production, or those indirectly related to agricultural agencies, need to predict their crop yield accurately to avoid imbalances in market supply and demand caused or hastened by harvest crop quality and poor results. The agricultural forecasting provided by the Council of Agriculture is mainly based on the planted area and experience to predict the yield, but does not consider the impact of the plant environment on yield.
To understand the effect of important meteorological parameters, and to predict crop yields effectively, this work adopts stepwise regression and an ensemble neural network (ENN) method for analysis with the aim of improving the accuracy of crop yield prediction.
The rest of this study is organized as follows. The research backgrounds and related works of data mining methods, agricultural production forecasting, stepwise regression, and back-propagation neural networks (BPNs) are presented in
Section 2.
Section 3 proposes an ENN method to analyze agriculture data. The experimental results and discussions are illustrated in
Section 4.
Section 5 gives conclusions and future work.
2. Research Backgrounds and Related Works
The literature review of data mining methods, agricultural production forecasting, stepwise regression, and BPNs is discussed in the following subsections.
2.1. Data Mining Methods
Data mining is a part of database knowledge discovery. As the name suggests, it involves accumulating large amounts of data and extracting useful information from them. However, with the current development of information technology, the increasing amount of data, and different data types and sources and diversification, big data has become a major research topic in recent years for governments and industries. Big data technology is still based on traditional data mining methods. The objective of data mining or big data analysis is to identify implicit information from data, and thus enhance the value of information. Data analysis can be conducted using many approaches, such as cluster analysis, classification and statistical analysis.
2.1.1. Cluster Analysis
Fahad et al. [
1] divided cluster analysis methods into five types, namely segmentation-based, hierarchical-based, density-based, grid-based and model-based methods, as listed in
Table 1.
2.1.2. Classification
A classification model is generated from property values of existing data, then employed to predict the category of new data. The main goal of classification is to analyze the influence of each factor or variable on forecast data values. The result is a supervised learning network, containing neural networks and decision trees [
2,
3,
4].
2.1.3. Statistical Analysis
This is based on mathematical principles, and can be categorized as descriptive statistics and inferential statistics [
5,
6,
7].
Data mining creates high value for enterprises in sectors such as health and medical care, personal location information, retail and manufacturing [
8]. The proportion of US health care spending is very high. Analyzing the massive amount of health care data would significantly reduce capital costs. The retail sector has employed data mining analysis techniques for a long time: customer purchase records are applied to predict a future purchases list, and to adjust marketing strategies or merchandise display modes. The manufacturing sector, which is the backbone of the global trading industry, has a complex and widely dispersed value chain. Analyzing the available data would enable increased productivity, process improvements and reduced product delivery times.
2.2. Agricultural Production Forecasting
Many factors, mainly meteorological and environmental factors, influence crop yield. The variables covering changes in the weather include temperature, the amount of sunlight, and rain. Some studies concluded that temperatures and rainfall affect the growth of crops, thus affecting the final yield. Environmental factors that affect crop growth include latitude and soil. Chen et al. (2008) [
9] accumulated data about crop damage, the economic growth rate, pesticide sales, the rate of change in agricultural production, the index of agricultural production and the gross national product to determine the effect of these variables on the amount of fresh fruits and vegetables in the market output as a factor of economic variables. Other investigations have observed that the usage of fertilizer and the mechanization of production are factors that affect crop yield.
Some agricultural prediction algorithms utilize neural networks. Zhang et al. (2010) [
10] accumulated meteorological and crop growth data, and employed these to compare the performance of artificial neural networks, the k-nearest neighbors algorithm (kNN) and regression methods to predict soybean growth and flowering stages in the schedule model. Their results show that artificial neural networks predicted the soybean growth and flowering stages more accurately than the two other models. Tsai et al. (2004) [
11] constructed a production forecast model based on meteorological factors and growth traits factors, and analyzed it using the back-propagation network and other methods. Their analytical results demonstrated that the BPN forecasting performed better than others. Ma et al. employed regression analysis, the genetic algorithm, the back propagation neural network, and regression analysis combined with genetic algorithms to predict sales of pineapple, grapes and wax apples. According to their experimental data, the BPN best predicted wax apple sales, while regression analysis combined with genetic algorithms was most accurate for predicting pineapple and grape sales.
2.3. Stepwise Regression
Regression analysis by one or more independent variables is performed on the degree of correlation of a dependent variable to understand the influence of each independent variable. The methods of regression analysis are entering, forward, backward and stepwise regression. Stepwise regression analysis combines the forward and backward regression return characteristics, beginning with the selected independent and dependent variables with the largest number of relationships. The dependent variables are successively removed from the regression equation, then added back to determine whether they should be included in the equation. Thus, forward and backward regression is utilized to obtain the best regression model [
12,
13].
2.4. Back-Propagation Neural Network
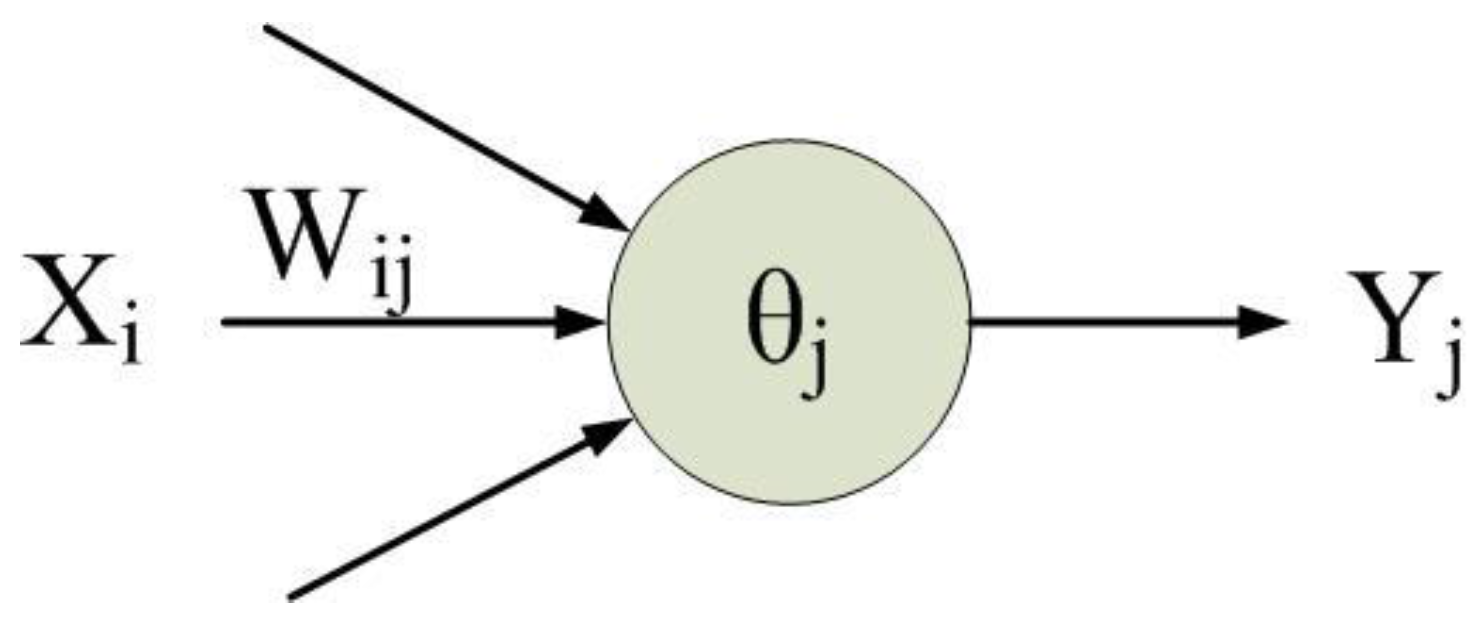
An artificial neural network (ANN) simulates messaging between neurons in a biological neural network. It comprises a plurality of neurons, as depicted in
Figure 1.
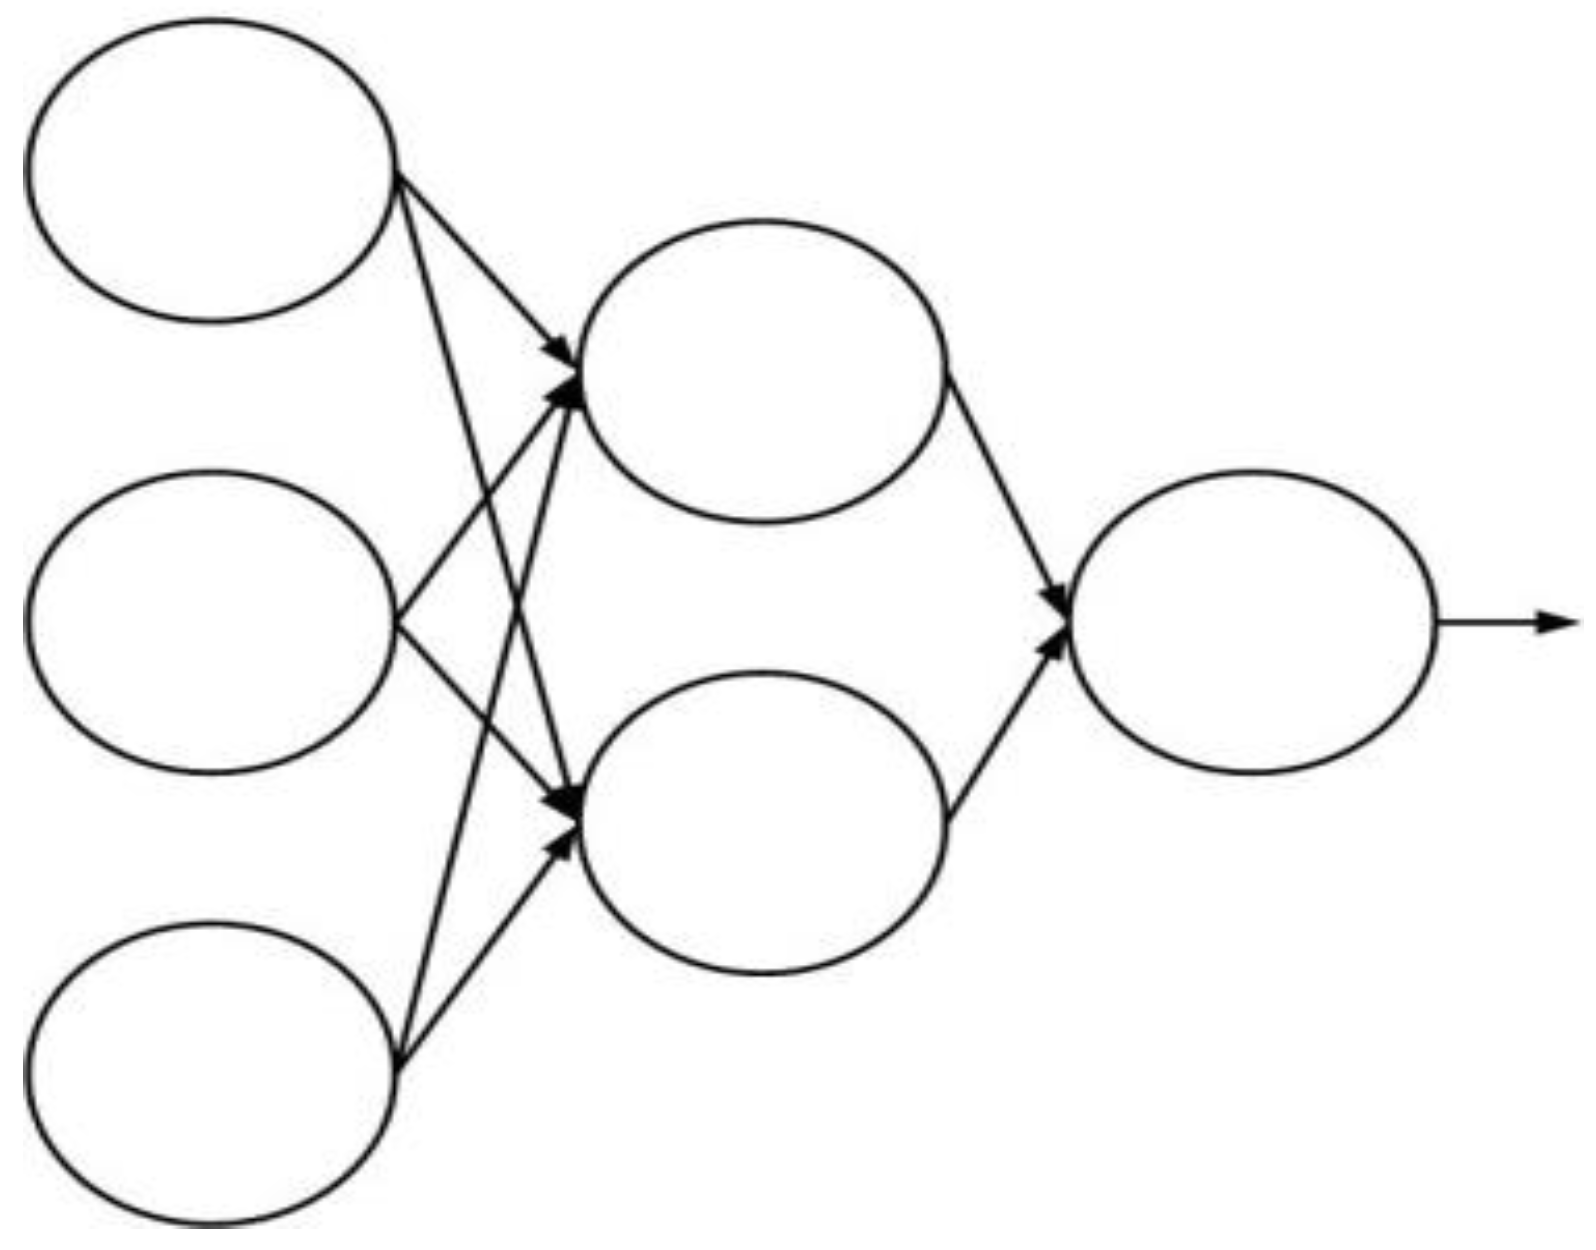
Figure 2 illustrates the network structure, also called the network topology [
14,
15,
16].
The traditional BPN which is a supervised learning network can be used for classification and prediction. In the learning stage, the BPN can update the weights among neurons in accordance with the error rate between the predicted output and the actual output in each iteration, and the error rate can be minimized after several iterations. The steps of the BPN method are described in the following [
14,
15,
16].
- (1)
Setting the parameters (e.g., neural network structure, learning rate, etc.) of the BPN.
- (2)
Setting the weights (e.g.,
Wi,j in
Figure 1) among neurons in the BPN.
- (3)
Setting the input neurons (e.g.,
Xi in
Figure 1) and the output neurons (e.g.,
Yj in
Figure 1).
- (4)
Calculating the output value of each neuron in the hidden layer in accordance with inputs and the output value of the neuron (e.g.,
Yj in
Figure 1) in the output layer.
- (5)
Evaluating the error rate between the predicted output and actual output.
- (6)
Evaluating the error rate among the value of the output neuron, the output value of each neuron in the hidden layer, and the value of the input neurons.
- (7)
Updating the weights of neurons in accordance with error rates.
- (8)
Repeating Steps (4)–(7) until convergence.
While the BPN can analyze data and optimize the weights of the neural network, a local optimal solution may be performed by the BPN. Therefore, this study proposes an ENN to combine multiple BPNs with several compositions of data.
3. Materials and Methods
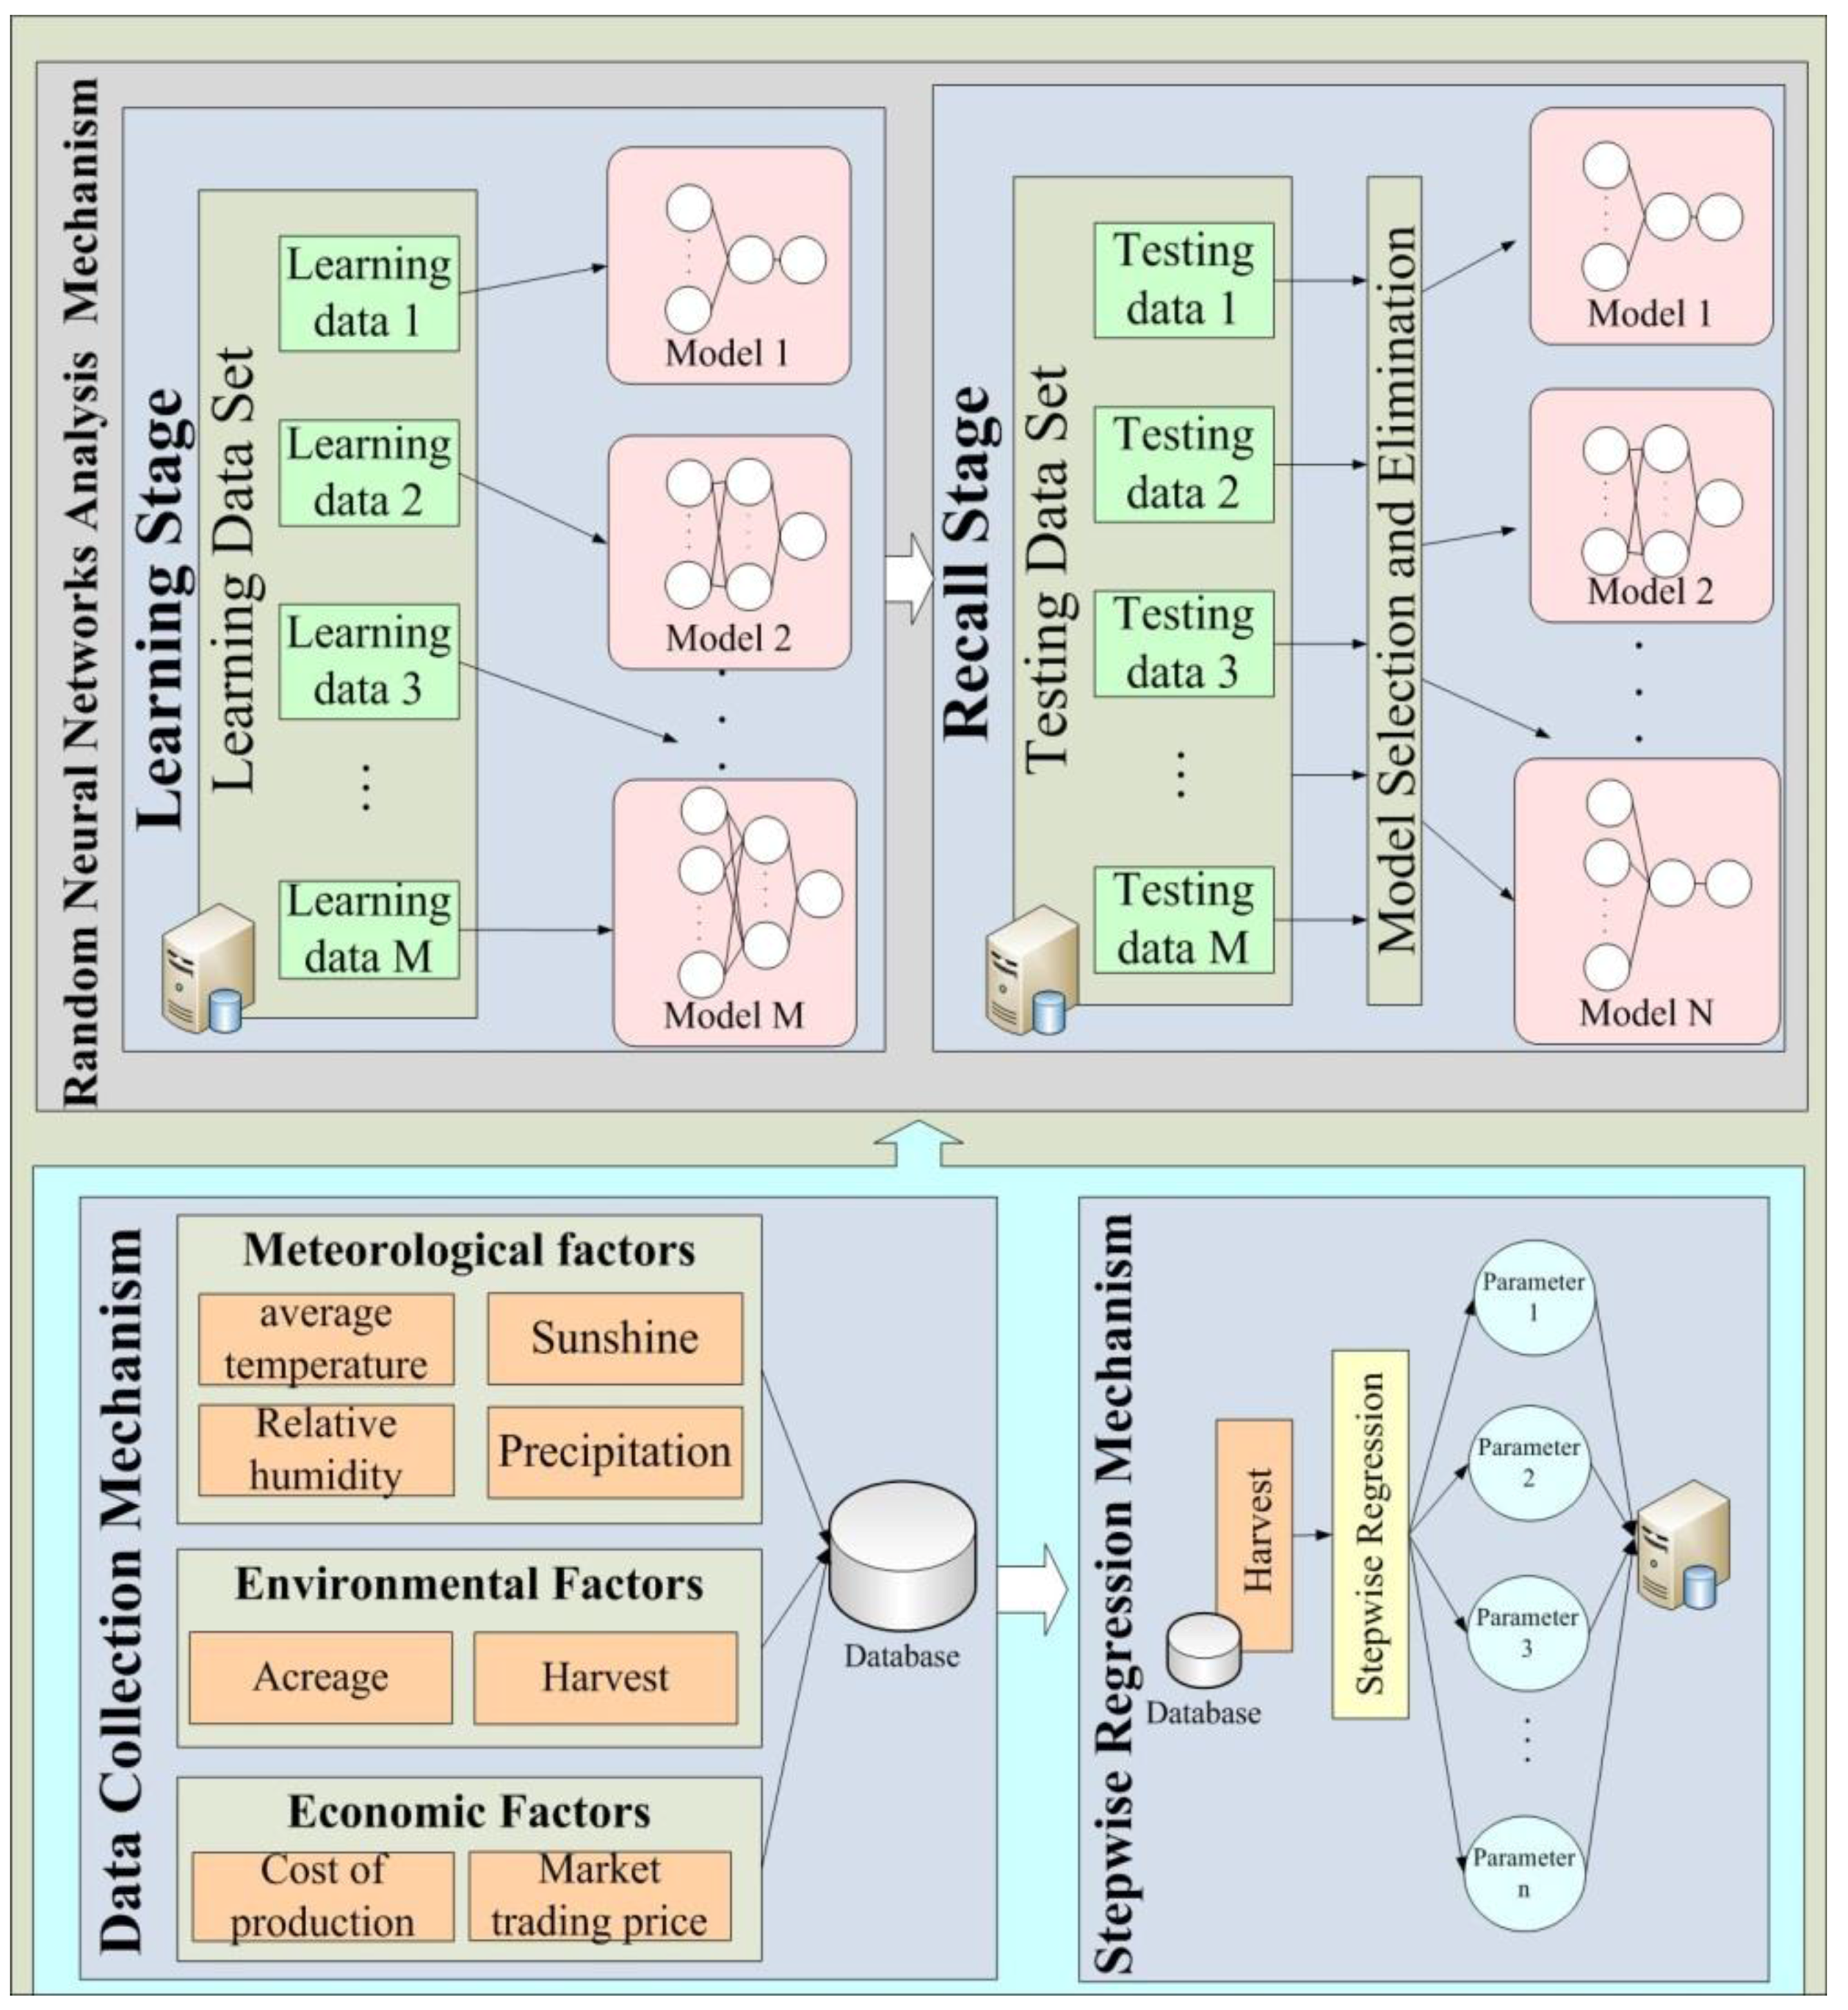
This investigation designs an accuracy analysis mechanism for agriculture data using the ENN method. The designed mechanism is employed for agricultural applications.
Figure 3 shows the architecture of this mechanism.
3.1. Data Collection Mechanism
This is the underlying data analysis layer. It accumulates meteorological factors (e.g., relative humidity, precipitation, and air temperature), environmental factors (e.g., planting area, harvested area, harvest and harvest per unit volume), and economic factors (e.g., the cost of production and the market trading price) which are shown in
Table 2 from many different open data sources.
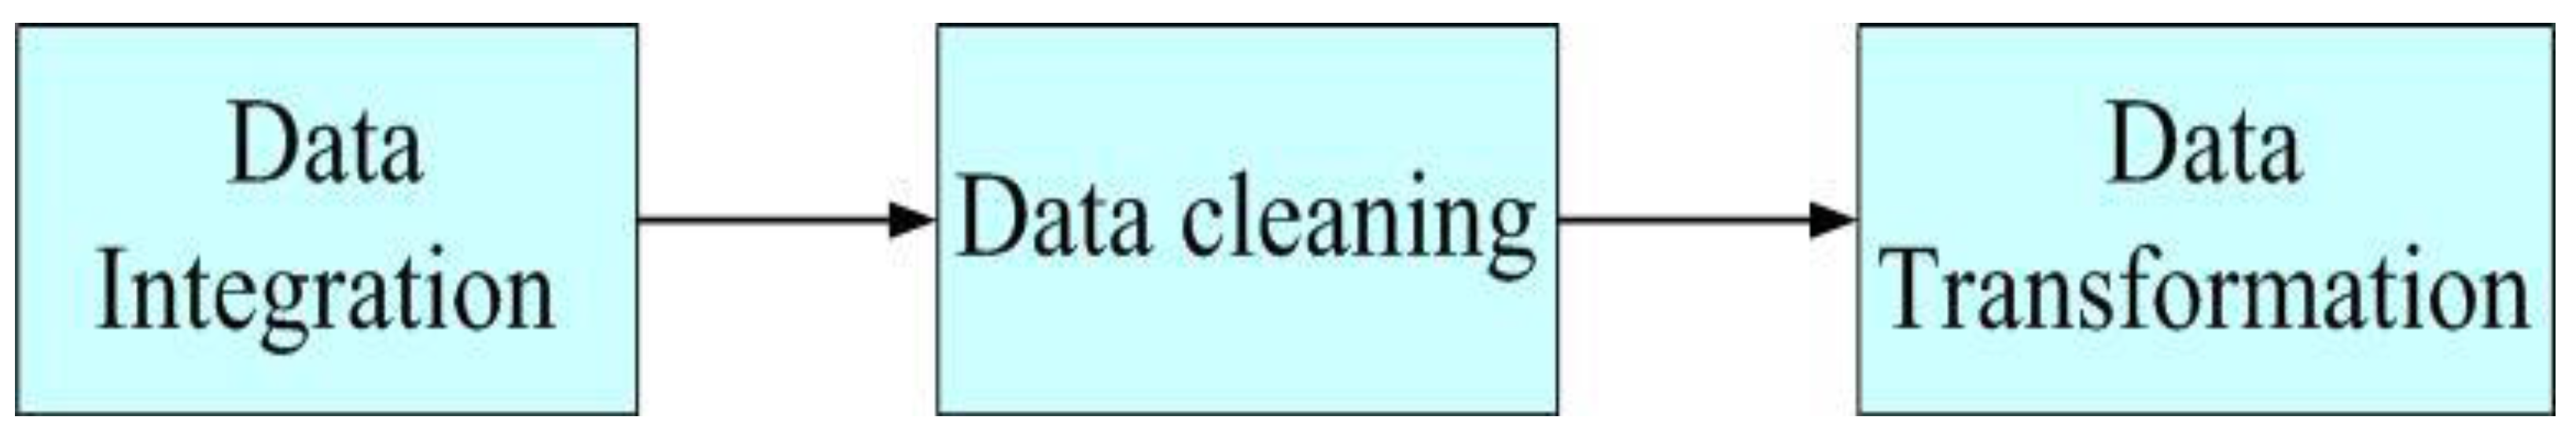
Figure 4 illustrates the data preprocessing stage, which involves data integration, data cleaning and data transformation. Each step is presented in the following paragraph.
(1) Data integration
The data from different databases (e.g., the Agriculture and Food Agency of Council of Agriculture in Taiwan) are collected and stored into a database.
(2) Data cleaning
Due to the wide range of sources of information, information may be incomplete, non-conformant or noisy. Therefore, the data are cleaned to ensure the integrity and accuracy of the information
(3) Data transformation
For data normalization, data transformation is performed to normalize the data by using Equations (1)–(3). For instance, the average of the relative humidity during the
j-th month can be defined as
a1,j, and the mean and standard deviation of the relative humidity in the historical dataset can be calculated by Equations (1) and (2), respectively. Then the normalized average of the relative humidity during the
j-th month can be expressed as
x1,j by Equation (3).
3.2. Stepwise Multiple Regression Mechanism
Selecting the input variables of the neural network is a very important issue. Irrelevant input variables may lead to high network error, and indirectly reduce the network model reliability. To discover the relationship between meteorological factors and yields, this work derives a dependent variable from the monthly average temperature, relative humidity, sunshine and precipitation as independent variables.
3.3. Ensemble Neural Network Analysis Mechanism
The ENN method is based on BPNs. The ENN mechanism randomly generates a plurality of neural networks, each with a different architecture. For instance, the numbers of hidden layers and hidden layer neurons are generated randomly.
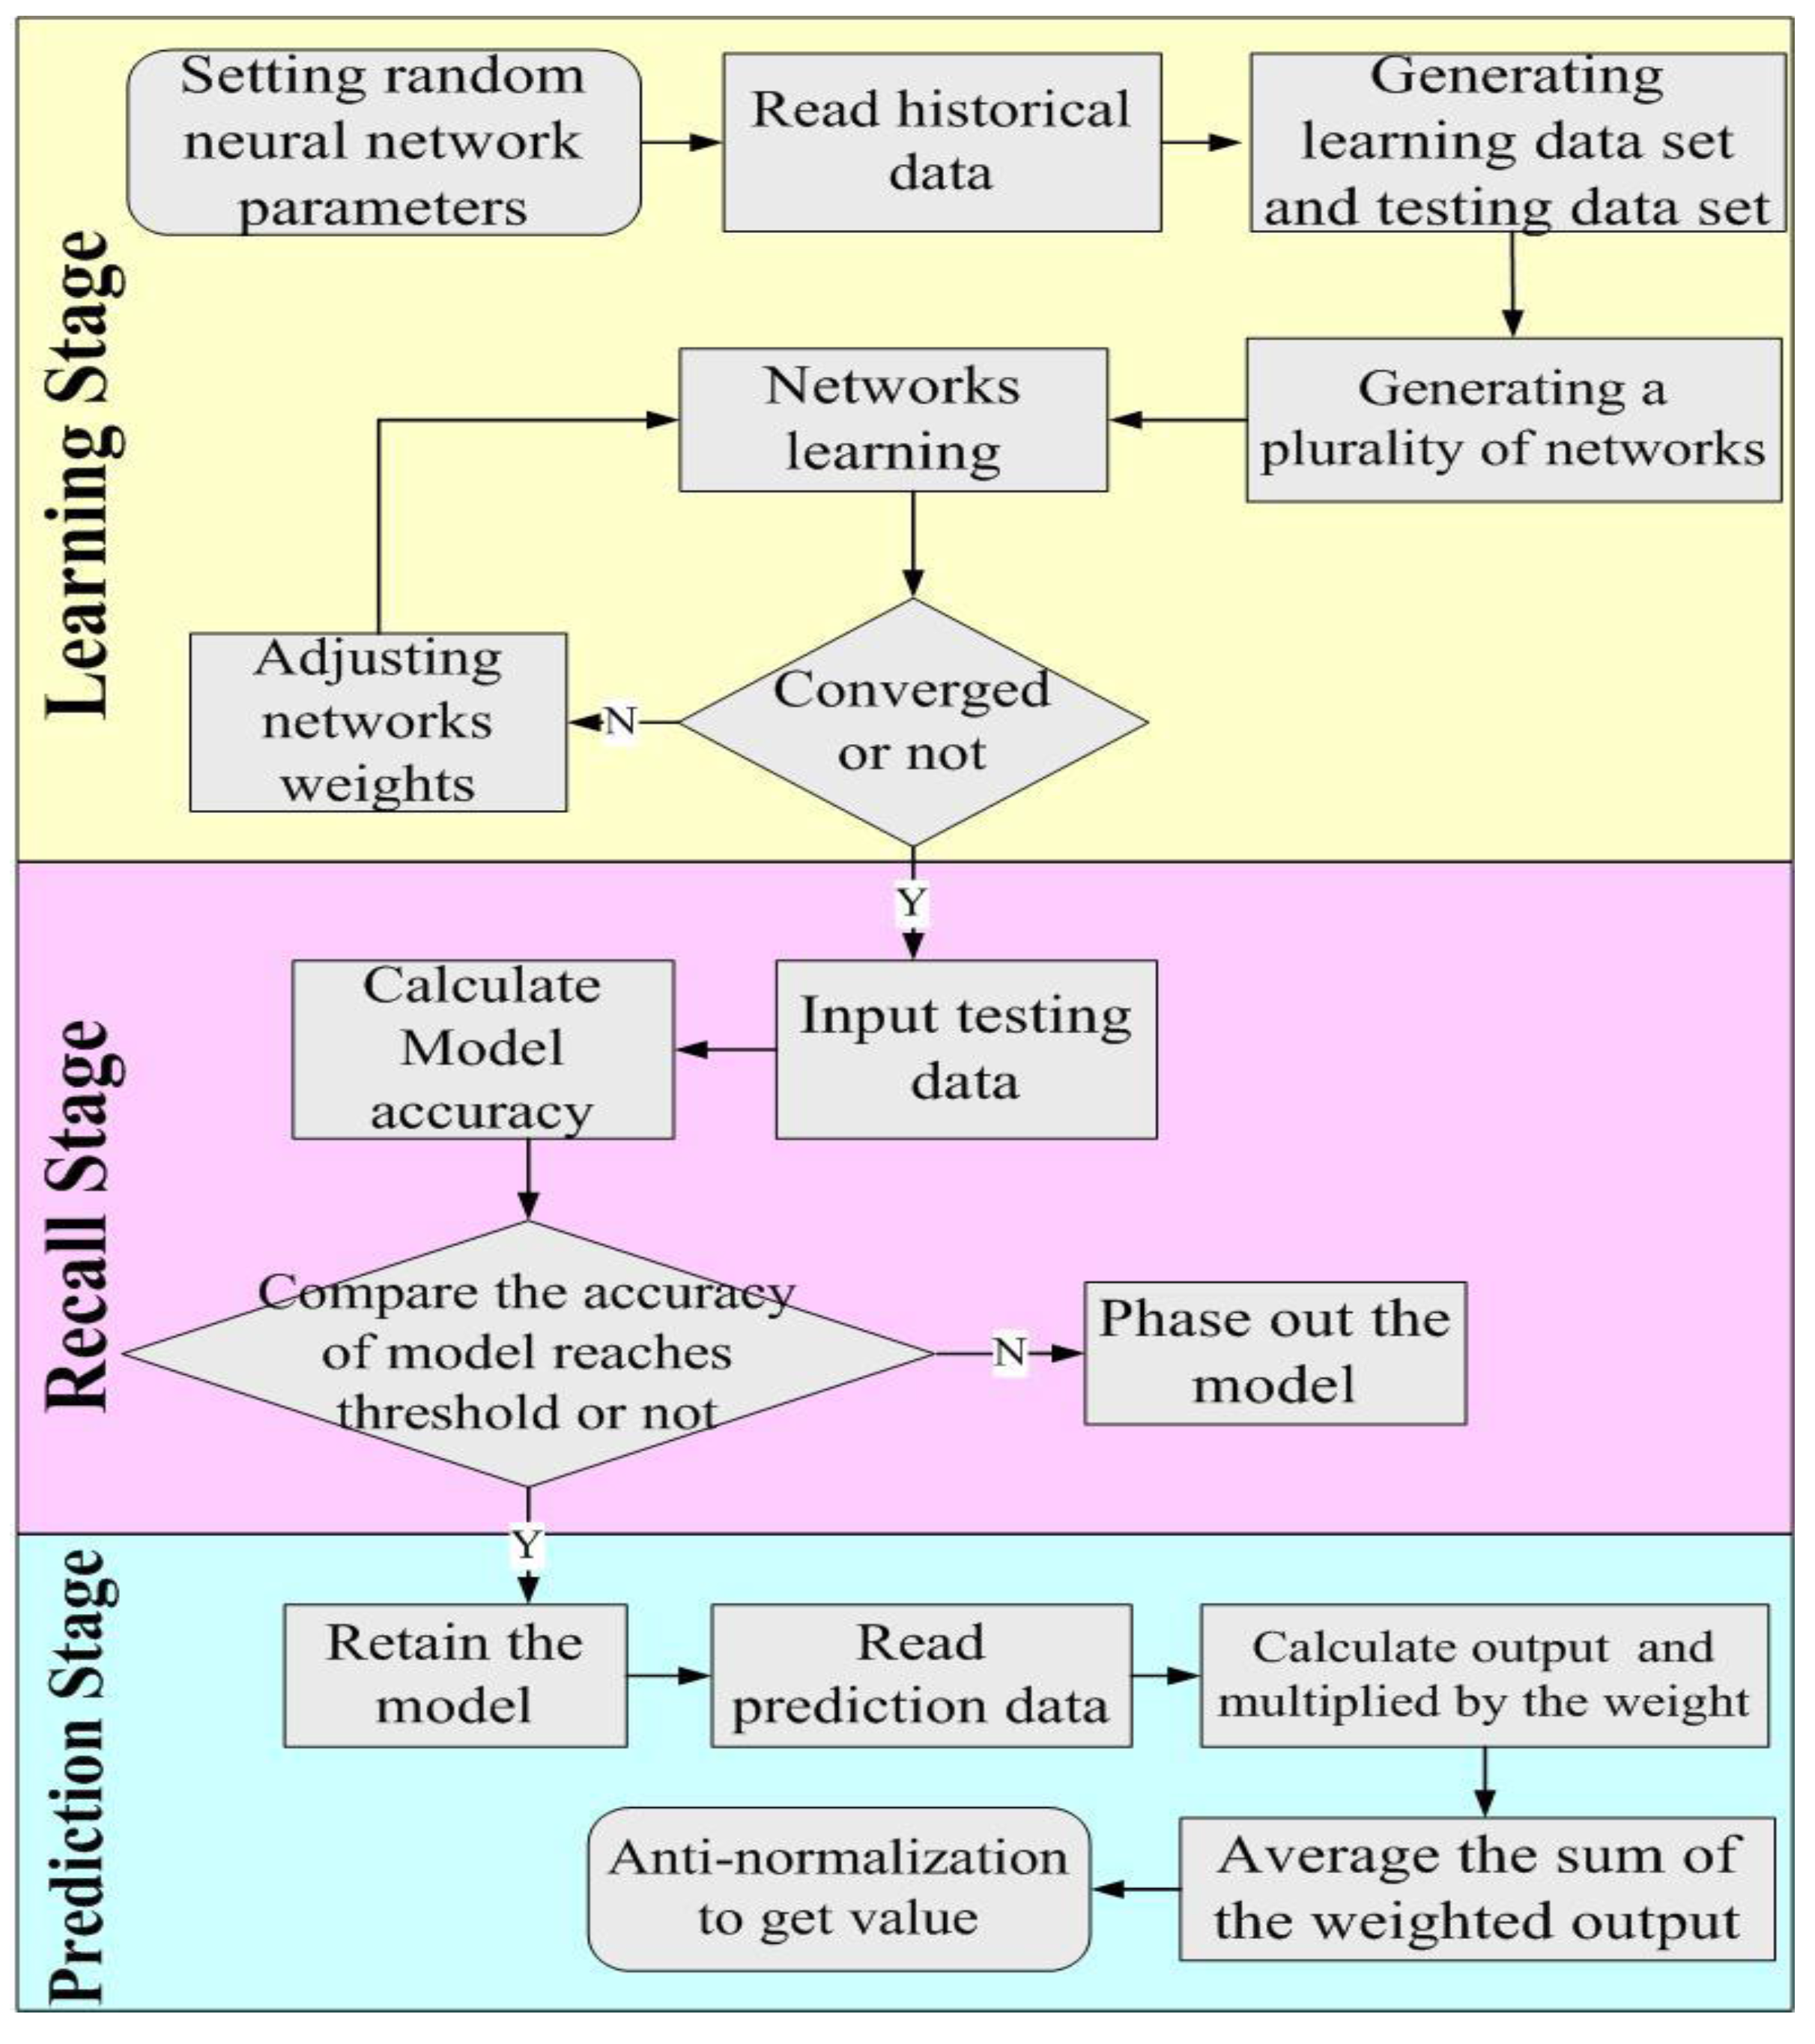
Figure 5 illustrates the main process, which is divided into three stages, namely learning, recall and forecast.
3.3.1. Learning Stage
This algorithm generates
M neural networks, each with different numbers of hidden layers and neurons in each hidden layer. In the learning stage, the learning data set is input into the networks. Input parameters, including meteorological data entry, contain the previous stage of the regional yield important parameters, environmental factors and economic factors. A neural network is a supervised learning network. In the learning stage, the input layer of the target maps to a known state in the output layer.
Table 3 depicts the group summary. Hence, the main objective of this investigation is to construct a neuron coupling model between neurons for the learning stage, by constantly modifying the weights of neurons, in order to establish a correspondence between the input and output data in the study sample through learning.
3.3.2. Recall Stage
Each network model constructs its network architecture model based on the preceding learning stage. The testing data set are entered for each network model which is then reconstructed based on the best correspondence.
Table 4 presents the group summary. The actual output value is then obtained. This is then compared with the target output value to obtain the accuracy for each network model. This accuracy is reused as the weight in the prediction stage. Furthermore, a threshold is considered and adopted for heuristic design. Any model that does not reach the accuracy threshold is eliminated.
3.3.3. Prediction Stage
Any new data to be analyzed are entered into the remaining network models. Each network model determines the output based on the learning results and predictions. These network models which more accurately predict the overall results have a greater impact on the overall result.
4. Analyses of Experimental Results
This section presents the experimental environments and performs traditional BPNs and ENN to predict agricultural production.
4.1. Experimental Environments
All tomato data, meteorology data, environment data and economic data were accumulated. The total data set had 9953 records from the Agriculture and Food Agency of the Council of Agriculture in Taiwan from 1997 to 2014. The meteorological factors included the average air temperature, relative humidity, and precipitation; the environmental factors included the planting area, harvested area, harvest and harvest per unit volume; and the economic factors included the cost of production and the market trading price. In this study, the input parameters include the average air temperature, relative humidity, precipitation, planting area, cost of production, and market trading price; the output is harvest. The tools used in the experimental environments are listed in
Table 5.
4.2. Experimental Results and Discussions
This study randomly generated five neural network models. Each network model generated up to five random hidden layers, and up to five neurons. Each network model used 60% of the available data for the learning data set, and the remaining 40% for the testing data set. The accuracy threshold was set as 90%, and the learning rate of each neural network was set as 0.1. That is, any model with accuracy below 90% was eliminated. Five tests were run in the learning stage.
Table 6 shows the network model and network infrastructure for each test run.
In the first experiment, the accuracy rates of network models 1–5 were 90.81%, 86.70%, 88.10%, 89.87%, 93.30%, respectively. Only network models 1 and 5 had accuracy above 90%. In back-propagation neural technology research and analysis, a network model is only adopted if the accuracy rate of the network model has reached a threshold value. In this case, the model is used for later analysis to verify its prediction accuracy. The experimental conditions and parameters are fixed in this stage. A datum is randomly selected from the data cluster. The traditional BPN model is then run to predict the results of multiple regression analysis and comparison.
4.2.1. Regression Analysis of Experimental Results
The regression equation based on regression analysis is defined as Equation (4). Each parameter in
Table 2 was adopted into the regression model to predict harvests. This study used the root mean squared error (RMSE) to evaluate the error rate of the prediction method. The error rate of this method is about 12.4% which is higher than the error rates of traditional BPNs and ENNs.
4.2.2. Experimental Results of Traditional Back-Propagation Neural Network Analysis
The same consideration threshold of 90% of the model was compared to the first experiments. The actual production forecast was obtained by Model 1 which includes the neural network structure {1,3,1,2,1}. The output of Model 1 was 179,582 kg, and the actual yield was 191,500 kg. The result from Model 1 was thus 11,918 kg, or 6.64%, less than the actual production. The production forecast with Model 5 (i.e., neural network structure {1,3,2}) was 202,587 kg, which is 11,087 kg greater than the actual yield, giving a network model error of 5.47%.
4.2.3. Ensemble Neural Network Analysis of Experimental Results
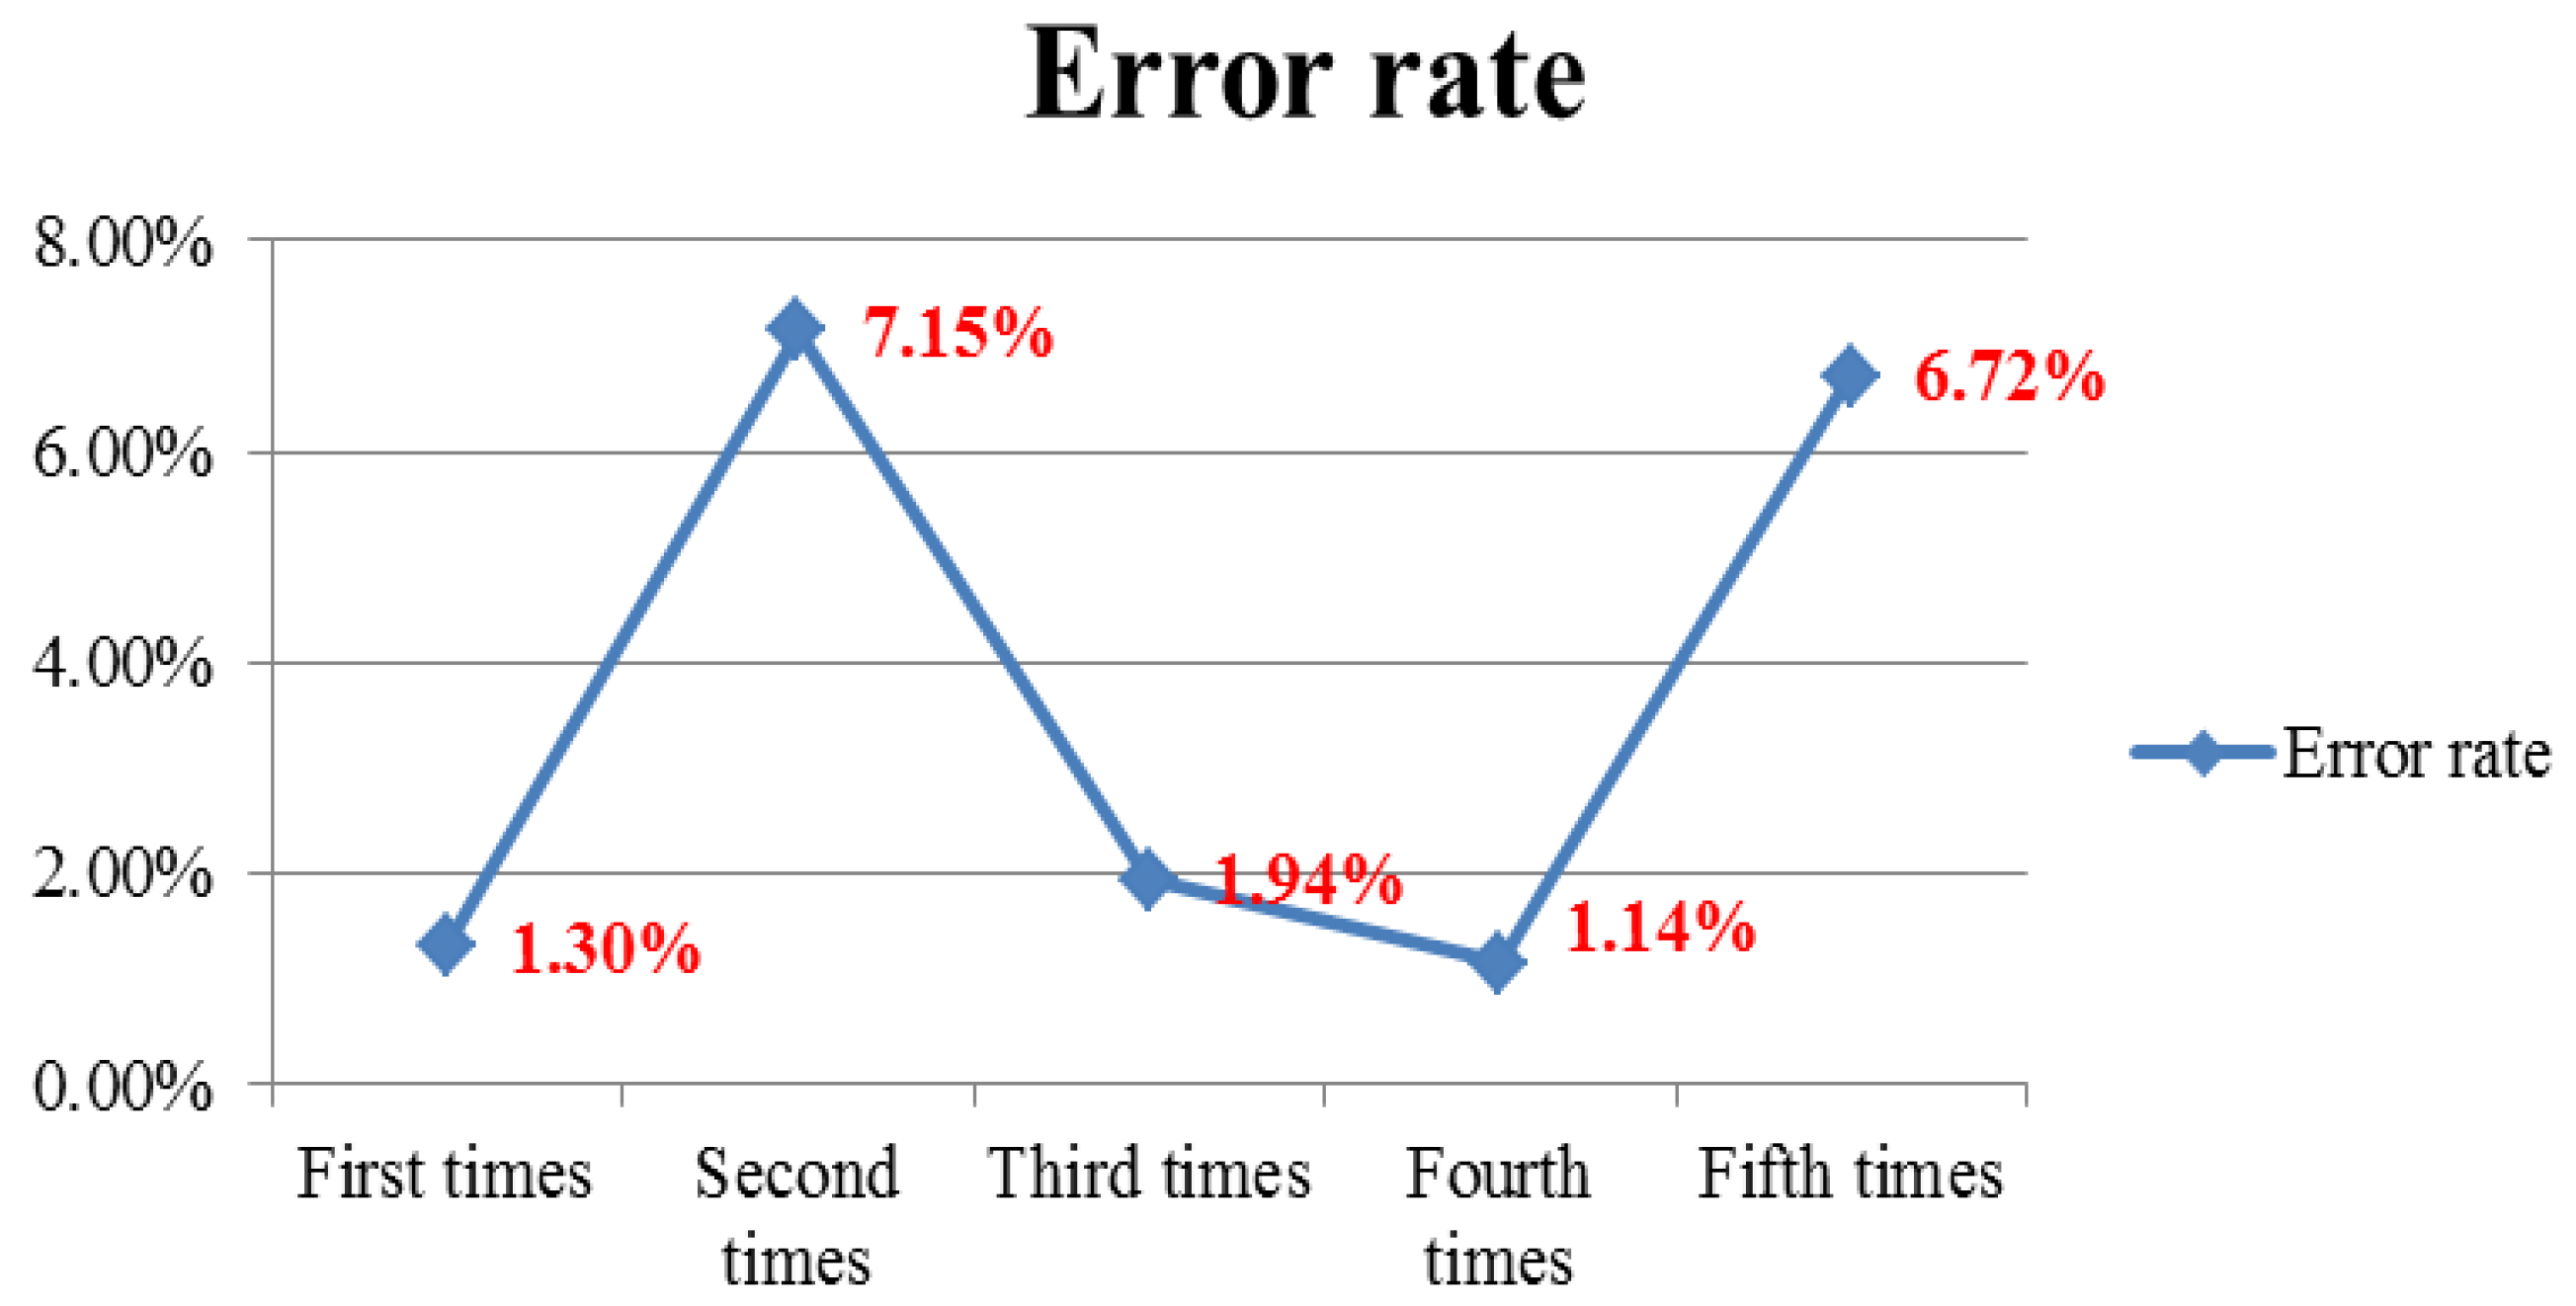
The merit of this method is that it also considers the accuracy of the threshold through the network model. In the first experiment, ENNs were run to obtain the output value of Models 1 and 5. The weighted average yield was found to be 191,240 kg. The error rate of the ENN in Experiment 1 was 1.30% which is smaller than the error rate of traditional BPNs. The error rate was under 2% in Experiments 1, 3 and 4. The error rates of the models in Experiments 2 and 5 were higher, so Experiments 2 and 5 had high error rates. However, considering the weighted average significantly reduced the error rate.
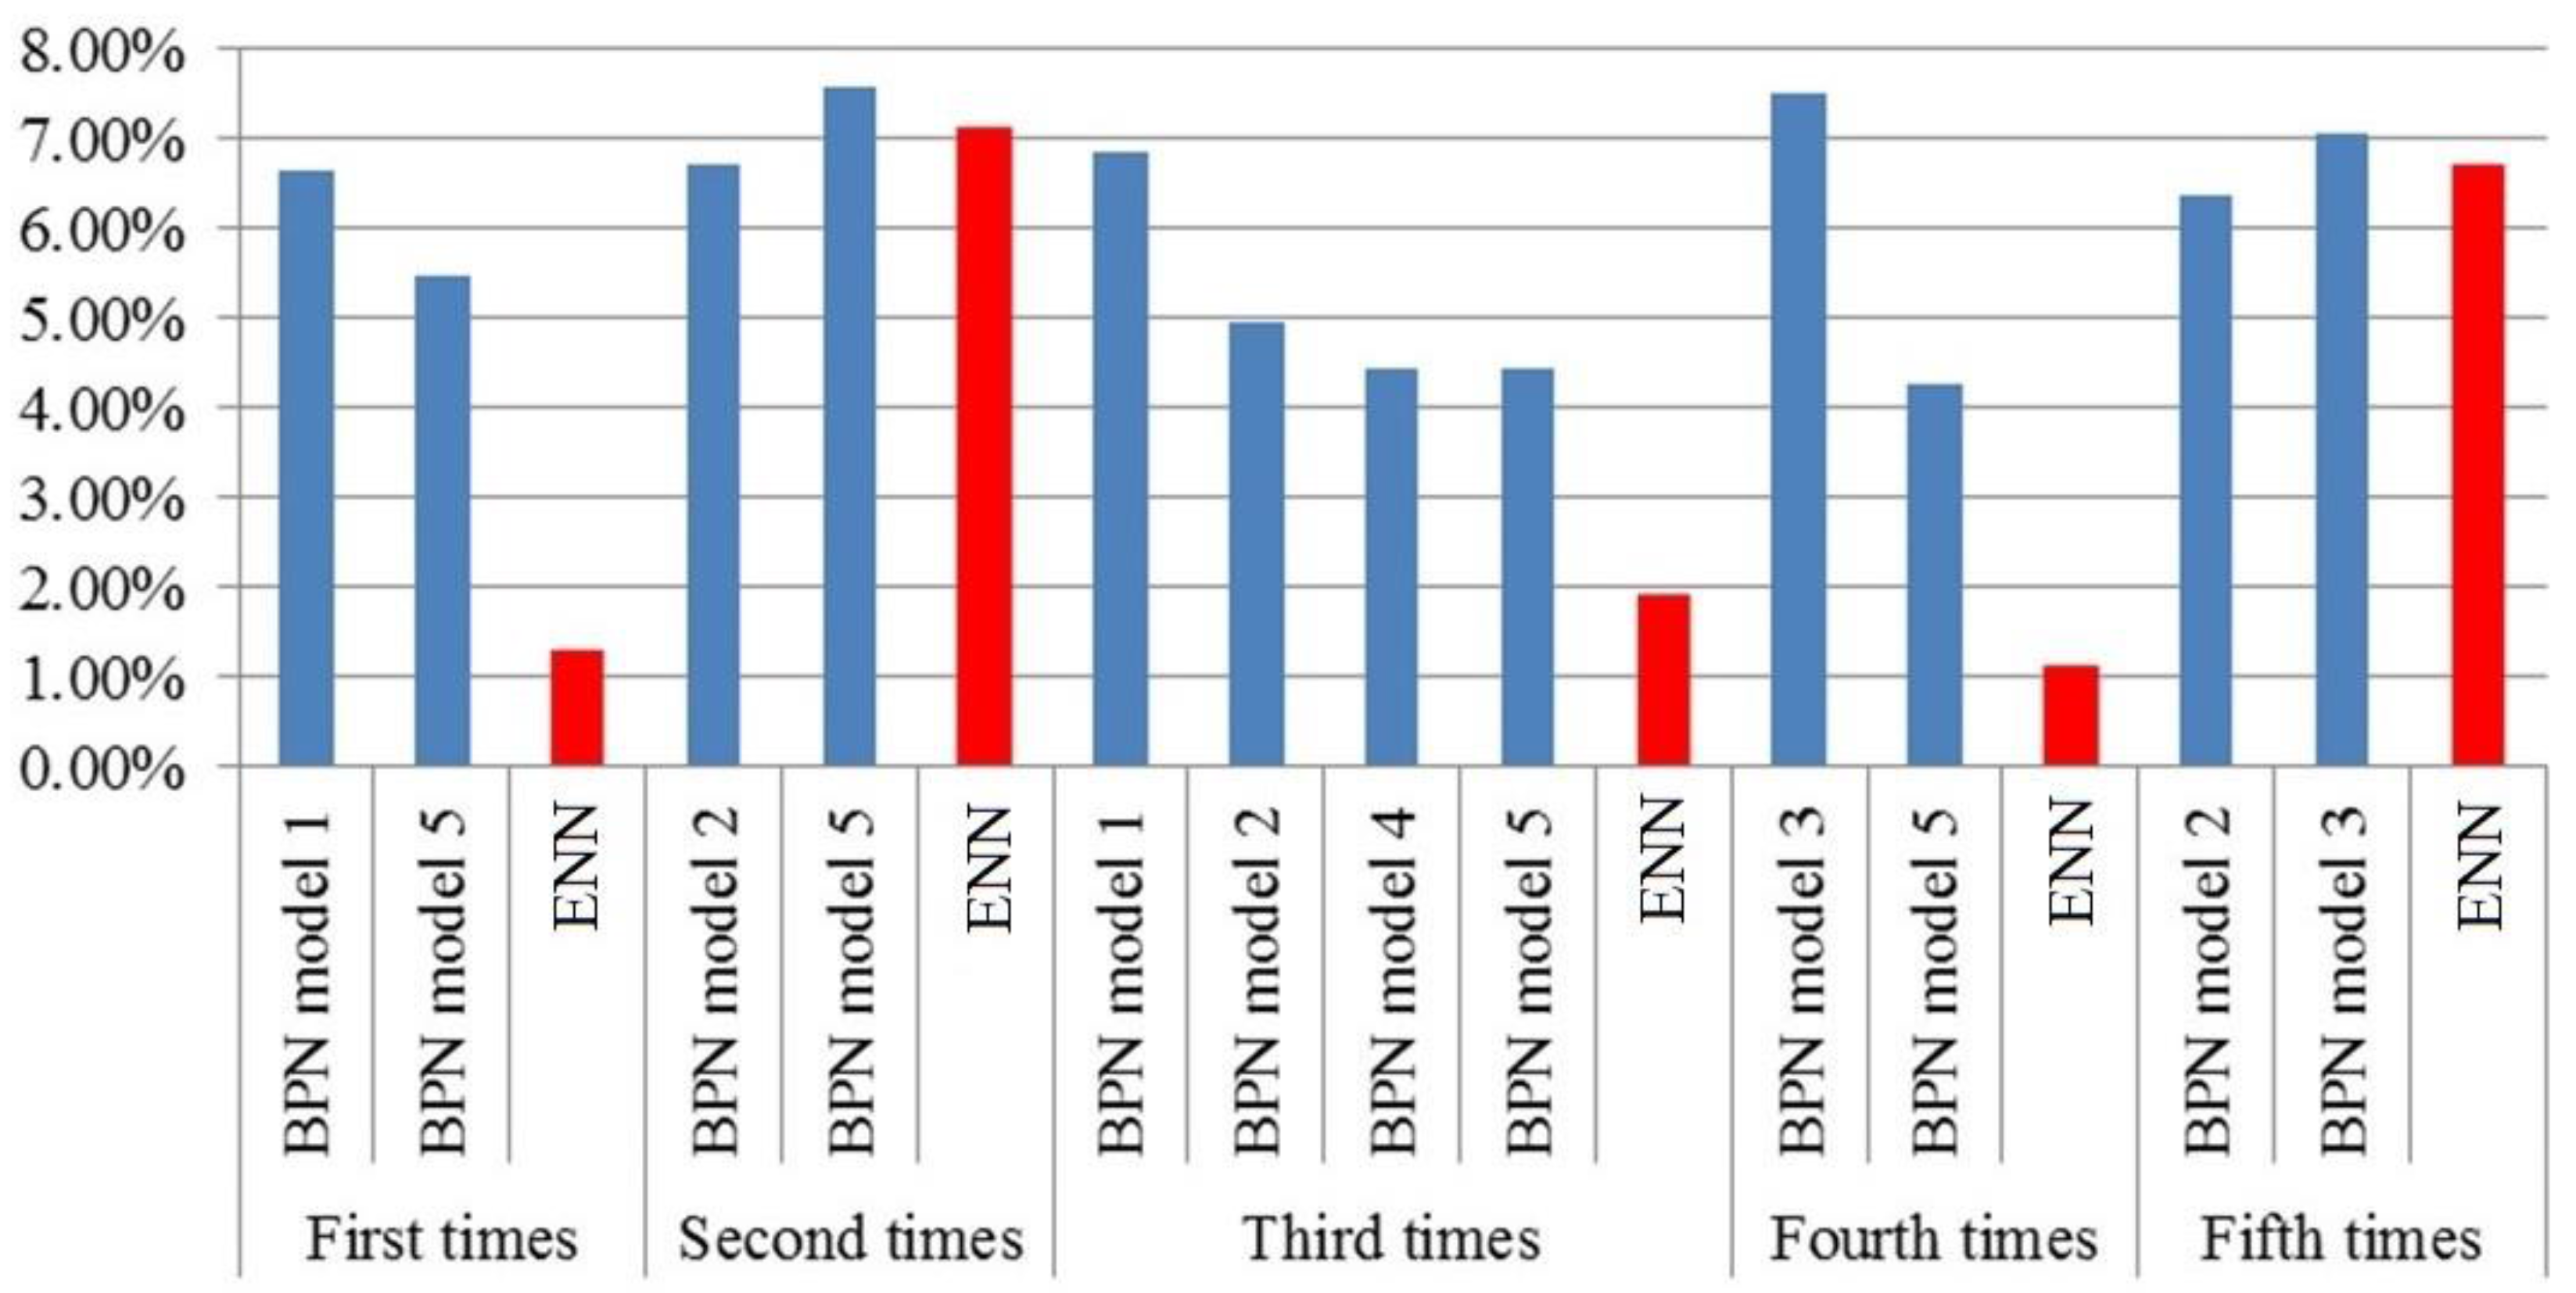
Figure 6 depicts the error rate for each experiment, and
Figure 7 shows the error rate comparisons of BPNs and the ENN.
5. Conclusions and Future Work
With the advancement of information technology in various fields and the daily growth rate in data, neural networks are being widely adopted in industry, business, science and finance. However, the optimal number of hidden layers and neurons is mostly determined by experience or a formula. Considering a variety of analytical models is not possible. This study utilized stepwise regression analysis and ENN for the design guidelines to use in agriculture forecast analysis. The ENN method randomly creates a plurality of networks for analysis and forecasting and analyzes the results of all network models in order to improve the accuracy of the analysis. Experimental results reveal that the ENNs have the lowest error rate and highest accuracy, followed by traditional BPNs and multiple regression analysis.
Acknowledgments
The research is supported by the Ministry of Science and Technology of Taiwan under grant No. MOST 105-2221-E-020-024. This study is also conducted under the “Online and Offline Integrated Smart Commerce Platform (3/4)” of the Institute for Information Industry, which is subsidized by the Ministry of Economy Affairs of Taiwan.
Author Contributions
Hsu-Yang Kung and Chi-Hua Chen conceived and designed the experiments; Pei-Yu Tsai and Ting-Huan Kuo performed the experiments; Hsu-Yang Kung and Pei-Yu Tsai analyzed the data; Pei-Yu Tsai, Chi-Hua Chen and Ting-Huan Kuo contributed analysis tools; Pei-Yu Tsai and Chi-Hua Chen wrote the paper.
Conflicts of Interest
The authors declare no conflict of interest.
References
- Fahad, A.; Alshatri, N.; Tari, Z.; Alamri, A.; Khalil, I.; Zomaya, A.Y.; Foufou, S.; Bouras, A. A survey of clustering algorithms for big data: Taxonomy and empirical analysis. IEEE Trans. Emerg. Top. Comput. 2014, 2, 267–279. [Google Scholar] [CrossRef]
- Huang, G.B.; Zhou, H.; Ding, X.; Zhang, R. Extreme learning machine for regression and multiclass classification. IEEE Trans. Syst. Man Cybern. B Cybern. 2012, 42, 513–529. [Google Scholar] [CrossRef] [PubMed]
- Bai, Z.; Huang, G.B.; Wang, D.; Wang, H.; Westover, M.B. Sparse extreme learning machine for classification. IEEE Trans. Cybern. 2014, 44, 1858–1870. [Google Scholar] [PubMed]
- Lo, C.C.; Chen, C.H.; Cheng, D.Y.; Kung, H.Y. Ubiquitous healthcare service system with context-awareness capability: Design and implementation. Expert Syst. Appl. 2011, 38, 4416–4436. [Google Scholar] [CrossRef]
- Lu, F.; Sugano, Y.; Okabe, T.; Sato, Y. Adaptive linear regression for appearance-based gaze estimation. IEEE Trans. Pattern Anal. Mach. Intell. 2014, 36, 2033–2046. [Google Scholar] [CrossRef] [PubMed]
- Chen, C.H.; Lin, J.H.; Kuan, T.S.; Lo, K.R. A high-efficiency method of mobile positioning based on commercial vehicle operation data. ISPRS Int. J. Geo-Inf. 2016, 5. [Google Scholar] [CrossRef]
- Chen, C.H.; Yang, Y.T.; Chang, C.S.; Hsieh, C.M.; Kuan, T.S.; Lo, K.R. The design and implementation of a garbage truck fleet management system. S. Afr. J. Ind. Eng. 2016, 27, 32–46. [Google Scholar] [CrossRef]
- Zhou, Z.H.; Chawla, N.V.; Jin, Y.; Williams, G.J. Big data opportunities and challenges: Discussions from data analytics perspectives. IEEE Comput. Intell. Mag. 2014, 9, 62–74. [Google Scholar] [CrossRef]
- Chen, J.C.; Wang, K.J.; Wu, C.J.; Lai, Y.L.; Chen, C.W. Application of artificial neural network to Taiwan’s agriculture forecasting. J. Adv. Eng. 2008, 3, 241–249. [Google Scholar]
- Zhang, L.; Zhang, J.; Kyei-Boahen, S.; Zhang, M. Simulation and prediction of soybean growth and development under field conditions. Am. Eurasian J. Agric. Environ. Sci. 2010, 7, 374–385. [Google Scholar]
- Tsai, C.Y.; Shiue, Y.C. Predicting the productions of napier-grass based on back-propagation neural network. Acad. J. Kang-Ning 2004, 6, 97–107. [Google Scholar]
- Ghunem, R.A.; Assaleh, K.; El-hag, A.H. Artificial neural networks with stepwise regression for predicting transformer oil furan content. IEEE Trans. Dielectr. Electr. Insul. 2012, 19, 414–420. [Google Scholar] [CrossRef]
- Zhou, N.; Pierre, J.W.; Trudnowski, D. A stepwise regression method for estimating dominant electromechanical modes. IEEE Trans. Power Syst. 2012, 27, 1051–1059. [Google Scholar] [CrossRef]
- Heermann, P.D.; Khazenie, N. Classification of multispectral remote sensing data using a back-propagation neural network. IEEE Trans. Geosci. Remote Sens. 1992, 30, 81–88. [Google Scholar] [CrossRef]
- Yuan, J.; Yu, S. Privacy preserving back-propagation neural network learning made practical with cloud computing. IEEE Trans. Parallel Distrib. Syst. 2013, 25, 212–221. [Google Scholar] [CrossRef]
- Lin, H.F.; Chen, C.H. Design and application of augmented reality query-answering system in mobile phone information navigation. Expert Syst. Appl. 2015, 42, 810–820. [Google Scholar] [CrossRef]
© 2016 by the authors; licensee MDPI, Basel, Switzerland. This article is an open access article distributed under the terms and conditions of the Creative Commons Attribution (CC-BY) license (http://creativecommons.org/licenses/by/4.0/).


