Article

A Patent Analysis for Sustainable Technology Management

1
Department of Secretarial Management, Kimpo University, Gyeonggi 10020, Korea
2
Department of Statistics, Cheongju University, Chungbuk 28503, Korea
3
Graduate School of Management of Technology, Korea University, Seoul 02841, Korea
*
Author to whom correspondence should be addressed.
Sustainability 2016, 8(7), 688; https://doi.org/10.3390/su8070688
Submission received: 4 June 2016 / Revised: 10 July 2016 / Accepted: 14 July 2016 / Published: 18 July 2016
(This article belongs to the Section Sustainable Engineering and Science)

Abstract

:
Technology analysis (TA) is an important issue in the management of technology. Most R&D (Research & Development) policies have depended on diverse TA results. Traditional TA results have been obtained through qualitative approaches such as the Delphi expert survey, scenario analysis, or technology road mapping. Although they are representative methods for TA, they are not stable because their results are dependent on the experts’ knowledge and subjective experience. To solve this problem, recently many studies on TA have been focused on quantitative approaches, such as patent analysis. A patent document has diverse information of developed technologies, and thus, patent is one form of objective data for TA. In addition, sustainable technology has been a big issue in the TA fields, because most companies have their technological competitiveness through the sustainable technology. Sustainable technology is a technology keeping the technological superiority of a company. So a country as well as a company should consider sustainable technology for technological competition and continuous economic growth. Also it is important to manage sustainable technology in a given technology domain. In this paper, we propose a new patent analysis approach based on statistical analysis for the management of sustainable technology (MOST). Our proposed methodology for the MOST is to extract a technological structure and relationship for knowing the sustainable technology. To do this, we develop a hierarchical diagram of technology for finding the causal relationships among technological keywords of a given domain. The aim of the paper is to select the sustainable technology and to create the hierarchical technology paths to sustainable technology for the MOST. This contributes to planning R&D strategy for the sustainability of a company. To show how the methodology can be applied to real problem, we perform a case study using retrieved patent documents related to telematics technology.

1. Introduction

Technology analysis (TA) is an important task in technology management fields such as technological forecasting, innovation and transfer [1,2,3,4]. TA is one of the popular works in the management of technology (MOT) [5]. TA is employed to find the future trends and relationships among technologies in a given technology domain [5]. In addition, TA is a very complicated and sophisticated process concerning social and technological changes [5,6]. Thus, although much TA research has been conducted, there is no general TA model [5,7,8]. Today, TA is an interesting issue in the MOT, and MOT is a major undertaking in most companies [9]. The R&D (Research & Development) policy of a company influences its rise and fall, and R&D planning has depended on TA results [10]. Existing TA methods are based on technological literature analyses and the Delphi expert survey [5]; furthermore, most TA approaches are based on quantitative and qualitative methods. Although the Delphi method is representative of the qualitative approach for TA, it is not stable because its TA results depend on the subjective experience of the domain expert group [2,5,6]. Recently, TA methods have focused on a quantitative approach, such as through patent analysis [2,11,12,13,14,15]. Choi et al. (2013) proposed a patent analysis method based on subject-action-object (SAO) and text mining for technology road-mapping [11]. Using SAO-based text mining techniques, they analyzed the patent keywords for constructing technology road-mapping. In this paper, we also carry out a patent analysis, but we use statistical methods; furthermore, we build a hierarchical structure for understanding sustainable technology. Patents contain a huge amount of information of researched and developed technologies [16,17], and patent documents are considered objective data for TA modeling [18]. Many works relating to patent analysis have been published, including citation analysis, patent clustering, and patent maps [2,8,14,19,20,21,22,23]. Lee et al. (2009) studied a patent analysis for technology-driven road-mapping, and carried out a business plan using technological capabilities [24]. They tried to overcome the limitations of conventional patent analyses using design technology–driven road-mapping. OuYang and Weng (2011) proposed a patent analysis approach for new product development [25]. In addition, Grimaldi et al. (2015) published a patent portfolio value analysis for strategic technology planning [26]. This research used the concepts of technical scope, forward citation frequency, international scope, patenting strategy, and economic relevance for analyzing the patent portfolio value. The previous research was focused on the entire technologies of countries and companies, and it provided meaningful research results. However, we need to target a technology for the technological competitiveness of a company. In this paper, we consider sustainable technology as the target technology. The sustainable technology is a technology keeping the technological superiority of a company [5]. In many tasks of MOT, the management of sustainable technology is very important because sustainability in the technological domain is the essence of world economic developments. Recently sustainable technology has been big issue in the TA fields, because most companies maintain their technological competitiveness through sustainable technology [27,28]. A country as well as a company has to consider sustainable technology for continuous economic growth. So it is important to manage sustainable technology in a given technology domain. A motivation for the proposed work is based on the necessity to keep the technological sustainability of countries and companies. So, the aim of the paper is to find the sustainable technology and to create the hierarchical technology paths to sustainable technology for the Management of Sustainable Technology (MOST). This contributes to planning R&D strategy for the sustainability of a company. In this paper, we propose a new patent analysis approach based on statistical analysis for sustainable technology management (STM). Our methodology for STM is to extract technological rules to understand sustainable technology. To do this, we construct a Hierarchical Diagram of Technology (HDT) for finding the causal relationships among keywords representing technologies. To show how the methodology can be applied to real problem, we perform a case study using retrieved patent documents related to telematics technology from the patent databases of the world such as the U.S. Patent and Trademark Office (USPTO) and WIPS Corporation [29,30,31]. Therefore, we illustrate how the HDT can be applied to the STM. In the following section, we introduce sustainable technology. In Section 3, we propose the management of sustainable technology using statistical patent analysis to construct the HDT. We illustrate how the proposed methodology can be applied to a real domain by a case study based on experimental results. Lastly, in the conclusion section, we represent the contribution of our research and future works.

2. Sustainable Technology

Sustainable growth and development are positively necessary to maintain the survival and prosperity of humankind [5]. In governments and companies, sustainable technology is an important area for their continuous development. In addition, renewable energy, material resources, and recycling usage are all big issues in sustainable technology [5]. Thus, to understand individual technology with sustainability, such as the new solar plane, is important in MOT, but it is significant to know the structure and characteristics of sustainable technology. So in this paper, we study the management of sustainable technology for understanding the sustainable technology itself. The sustainable technology of our research is the essential technology for continuing the technological competition of a company. By understanding the technological relationship between the sustainable technology and other technologies, we can keep the representative technology of a company with sustainability. So we build a causal structure of the technologies including sustainable technology in a given technology domain using statistical patent analysis.

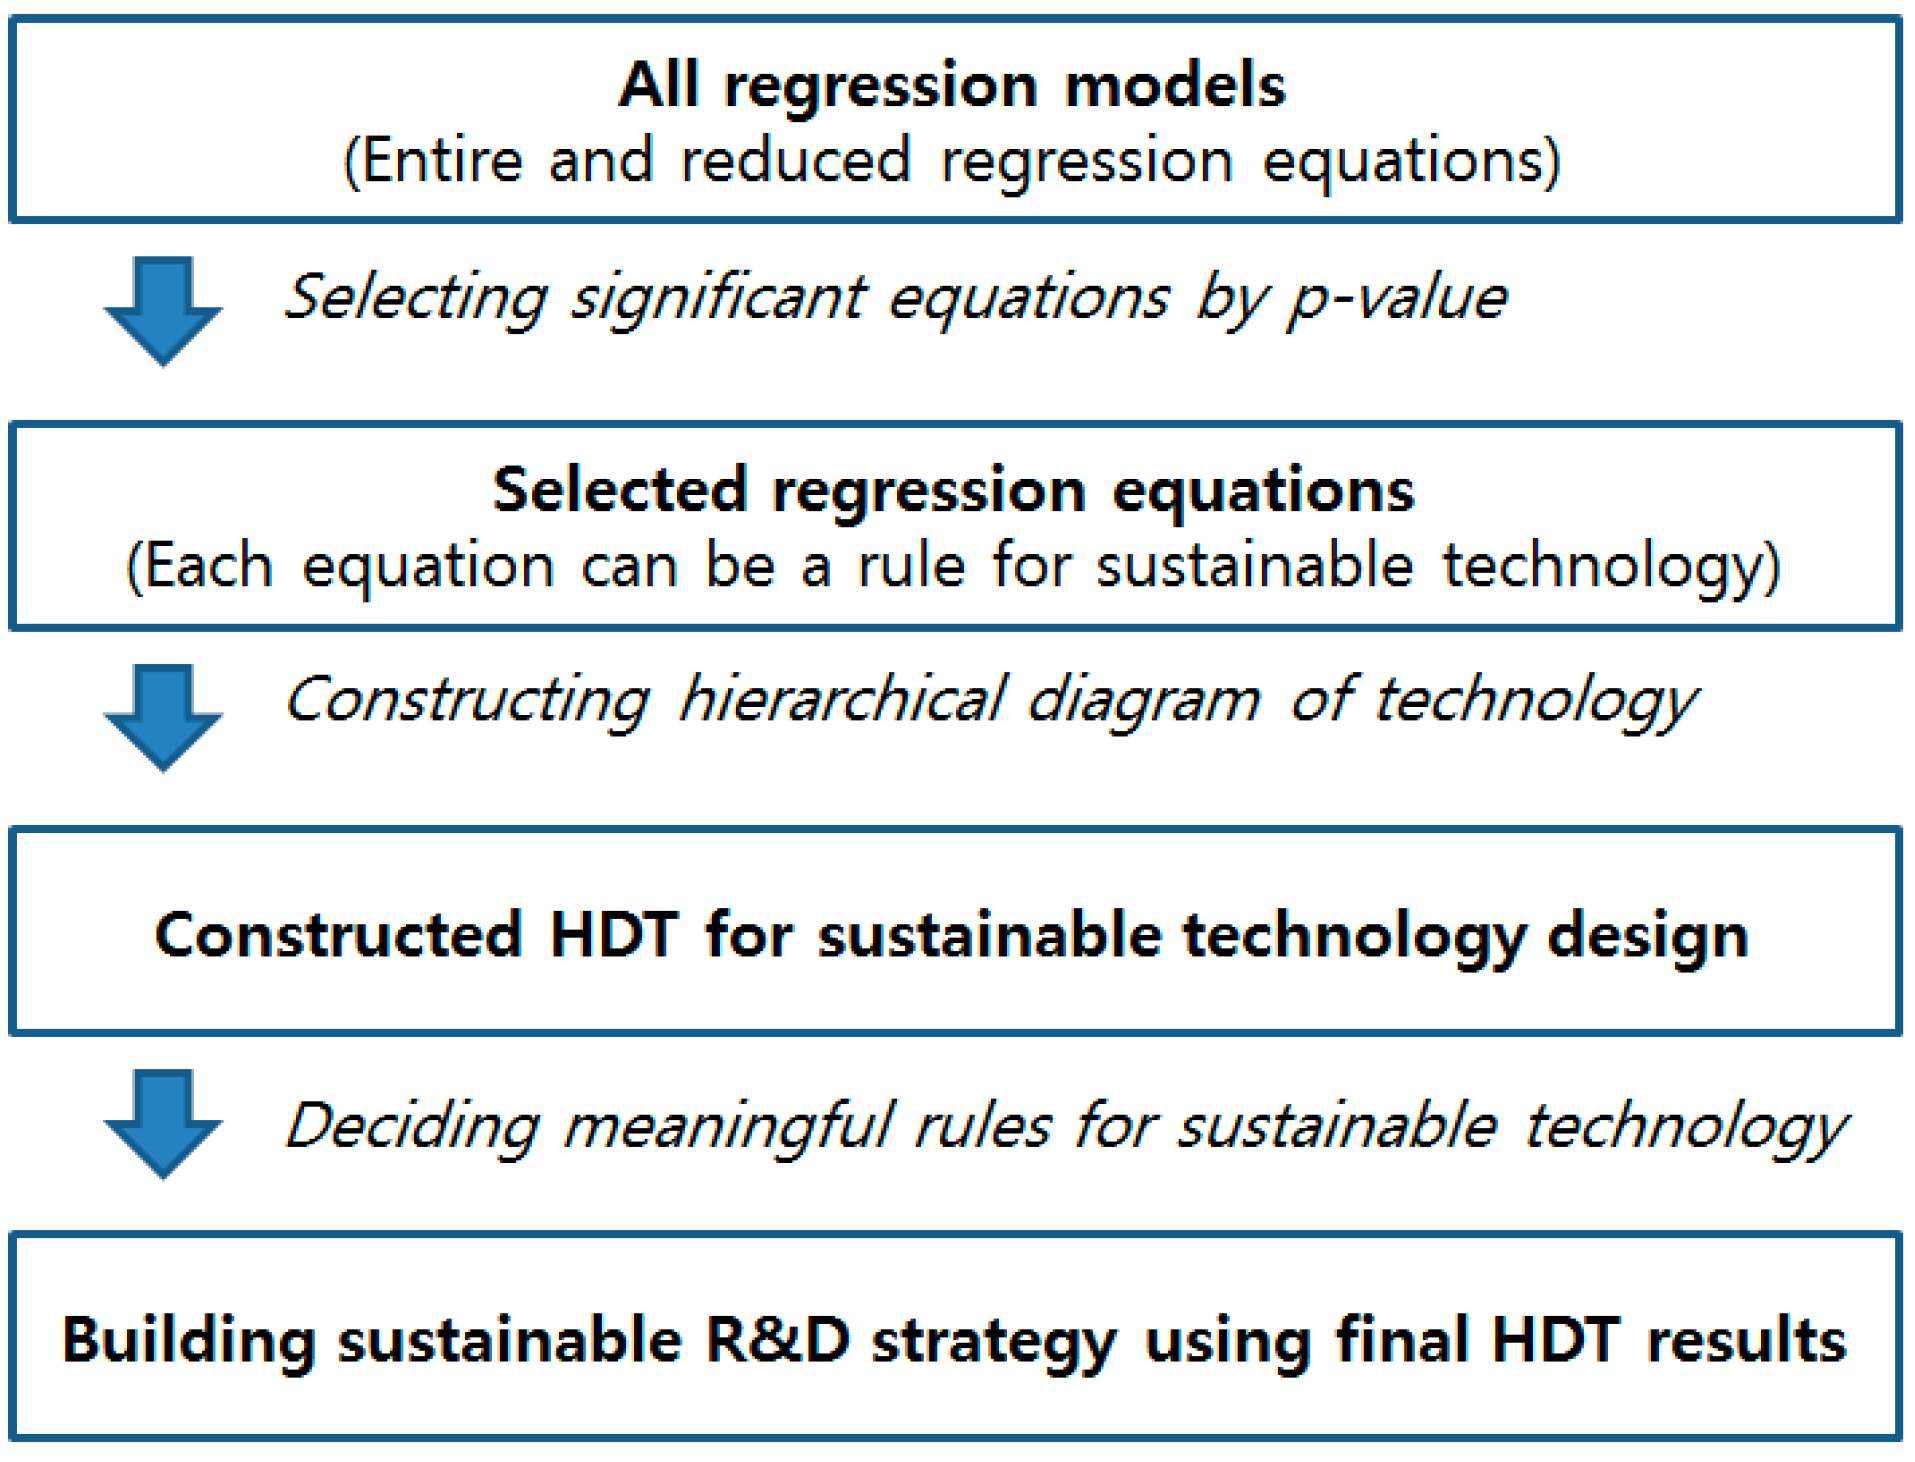
3. Management of Sustainable Technology using Statistical Patent Analysis

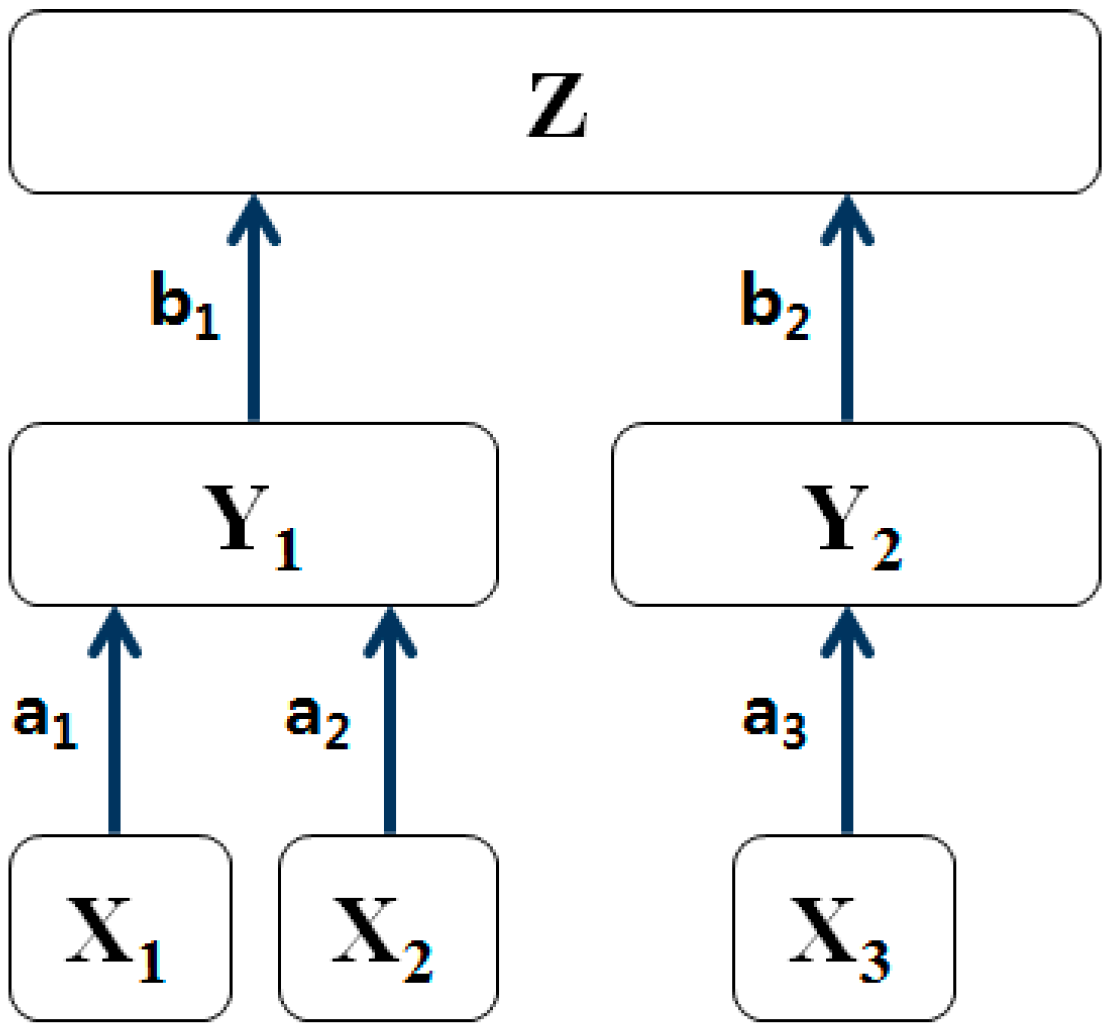
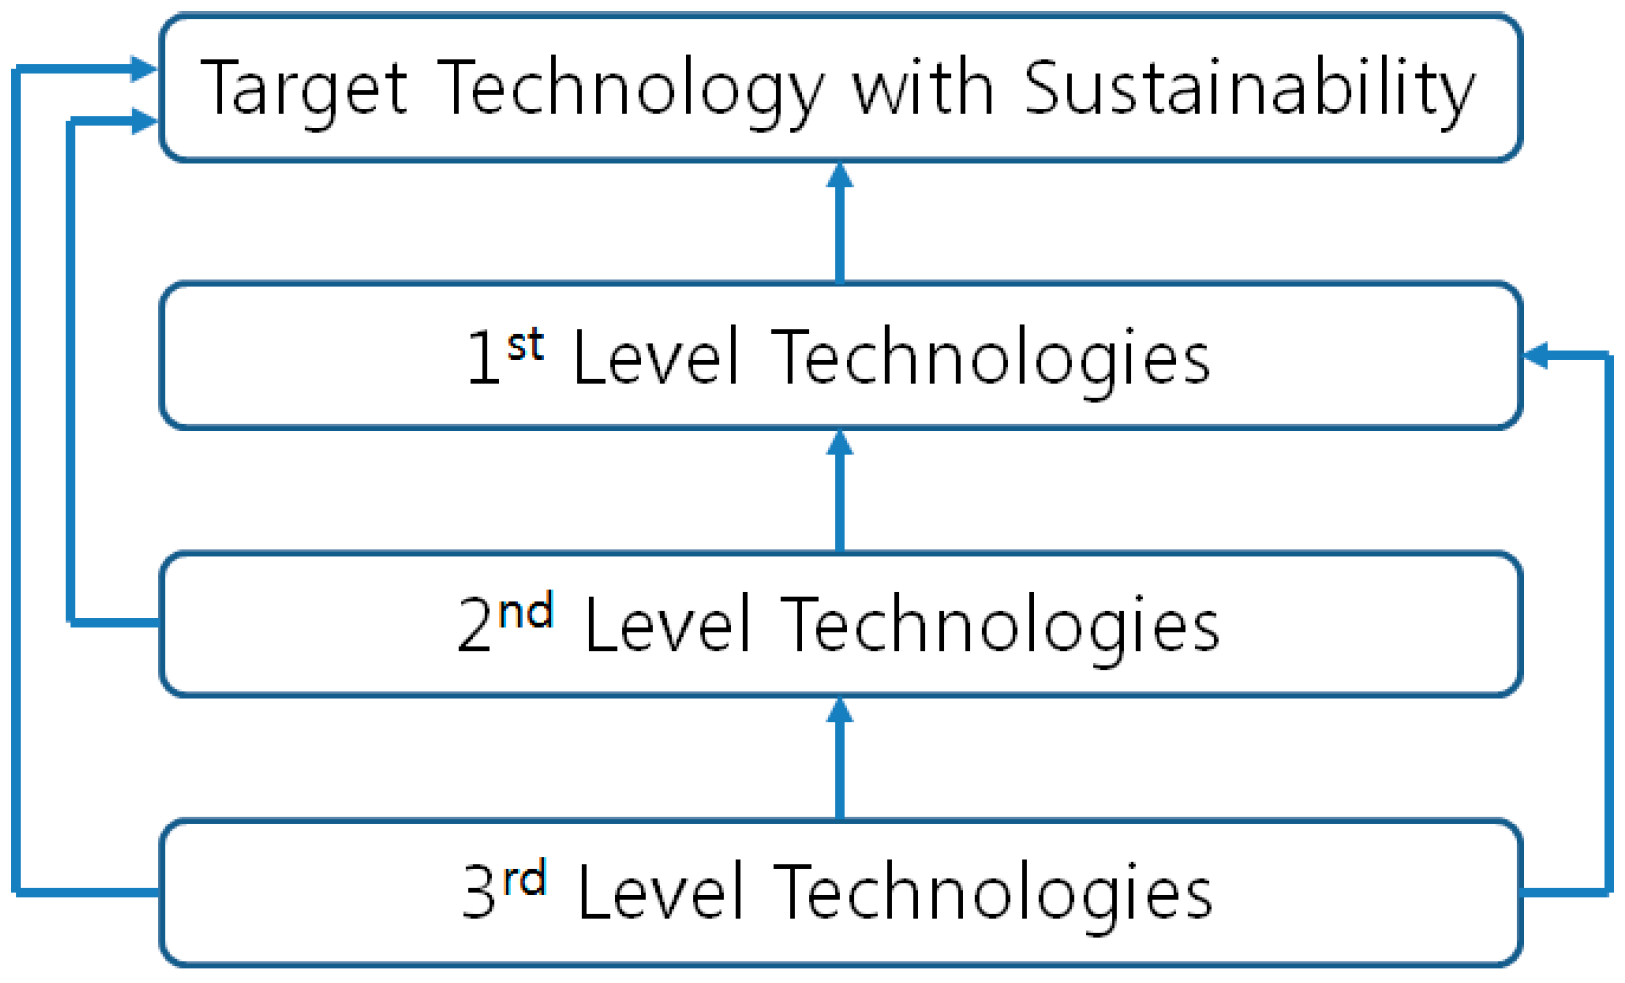
3.1. Statistical Path Analysis for Hierarchical Diagram of Technology

We propose a hierarchical diagram for knowing the sustainable technology structure. The target technology with sustainability is influenced by other technologies directly or indirectly. Figure 1 shows the proposed structure of sustainable technology.
In Figure 1, the first-level technologies have a direct effect on the target technology with sustainability. The second-level technologies influence the first-level technologies directly, and affect the target technology with sustainability indirectly via the first-level technologies. Also the third-level technologies have an influence on the second-level technologies directly, and affect the target technology with sustainability and the first-level technologies indirectly. For example, we have keywords related to the “telematics” technology field as follows: “center”, “communication”, “connection”, “control”, “device”, “diagnostic”, “information”, “message”, “mobile”, “network”, “receiving”, “request”, “service”, “signal”, “terminal”, “transmit”, “unit”, “user”, and “vehicle”. Firstly, we choose ‘telematics’ as a target technology with sustainability for the MOST. Next we use “telematics” as a dependent variable and all keywords as independent variables for a linear regression model, and select first-level technologies by p-values. The processes to select second- and third-level technologies are the same as the approach to select the first-level technologies. According to the scope of the target technology, the size of the technological levels can be larger. In this paper, we call this structure the HDT. We use the statistical path analysis (SPA) to make the HDT. Our SPA is used to construct the causal paths of the decomposed relationships between dependent and independent variables with each path, respectively, showing the connecting strength of its variables [32,33]. In this model, a variable represents a technology, and the causal structure of the variables shows the causal structure of technologies. The SPA is a hierarchical regression model, an example of which is structured in Figure 2.
Z is a dependent (predicted) variable, and the others are independent variables. The connecting weights (a1, a2, a3, b1, and b2) represent the causal strength between an independent variable (lower) and a dependent variable (higher). In our research, a variable is a patent keyword, and the keyword represents its corresponding sub-technologies in a given technology. This sample structure has five edges, with the weight of each being computed using regression analysis. For example, the weight of a1 is the parameter of linear regression, as follows.
Y 1 = a 0 + a i X 1 + ε
where Y1 is a dependent variable and X1 is an independent variable. The term a0 is the intercept and, thus, is not meaningful in the statistical model. That is, X1 is a developed technology and Y1 is a technology that needs to be developed. The regression parameter a1 is the impact strength of the antecedent technology (X1) to the consequent technology (Y1). The aim of this analysis is to find the final edges. In other words, we want to show the causal relationship between Z and other variables as follows.
Z = b 0 + b 1 Y 1 + b 2 Y 2 + ε
where Y1 and Y2 are also explained using the lower-side variables. Like the above regression in Equation (1), we use technological keywords for the variables. This theory was applied to some technology management works [7,34,35]. We apply this to our research on the STM. In this paper, we will develop a new network model for patent analysis. The patent is to protect the inventors’ rights of developed and registered technology over limited periods by governments. So, most developed technologies are filed in the patent system. Also, patent documents include detailed results of developed technologies, because the inventors want to have their rights for as many technological areas as possible. Therefore, the TA based on patent analysis is a meaningful approach for managing sustainable technology rules [5], and we construct the HDT for sustainable technology management using SPA.

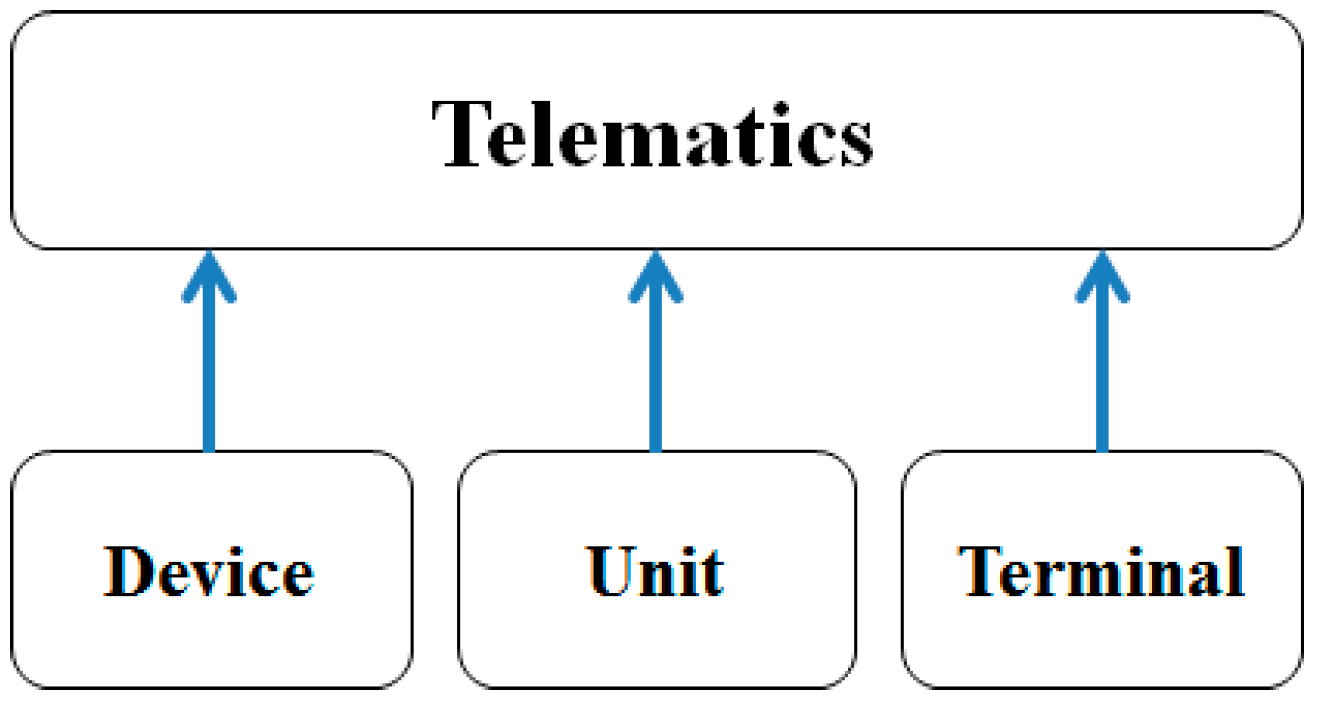
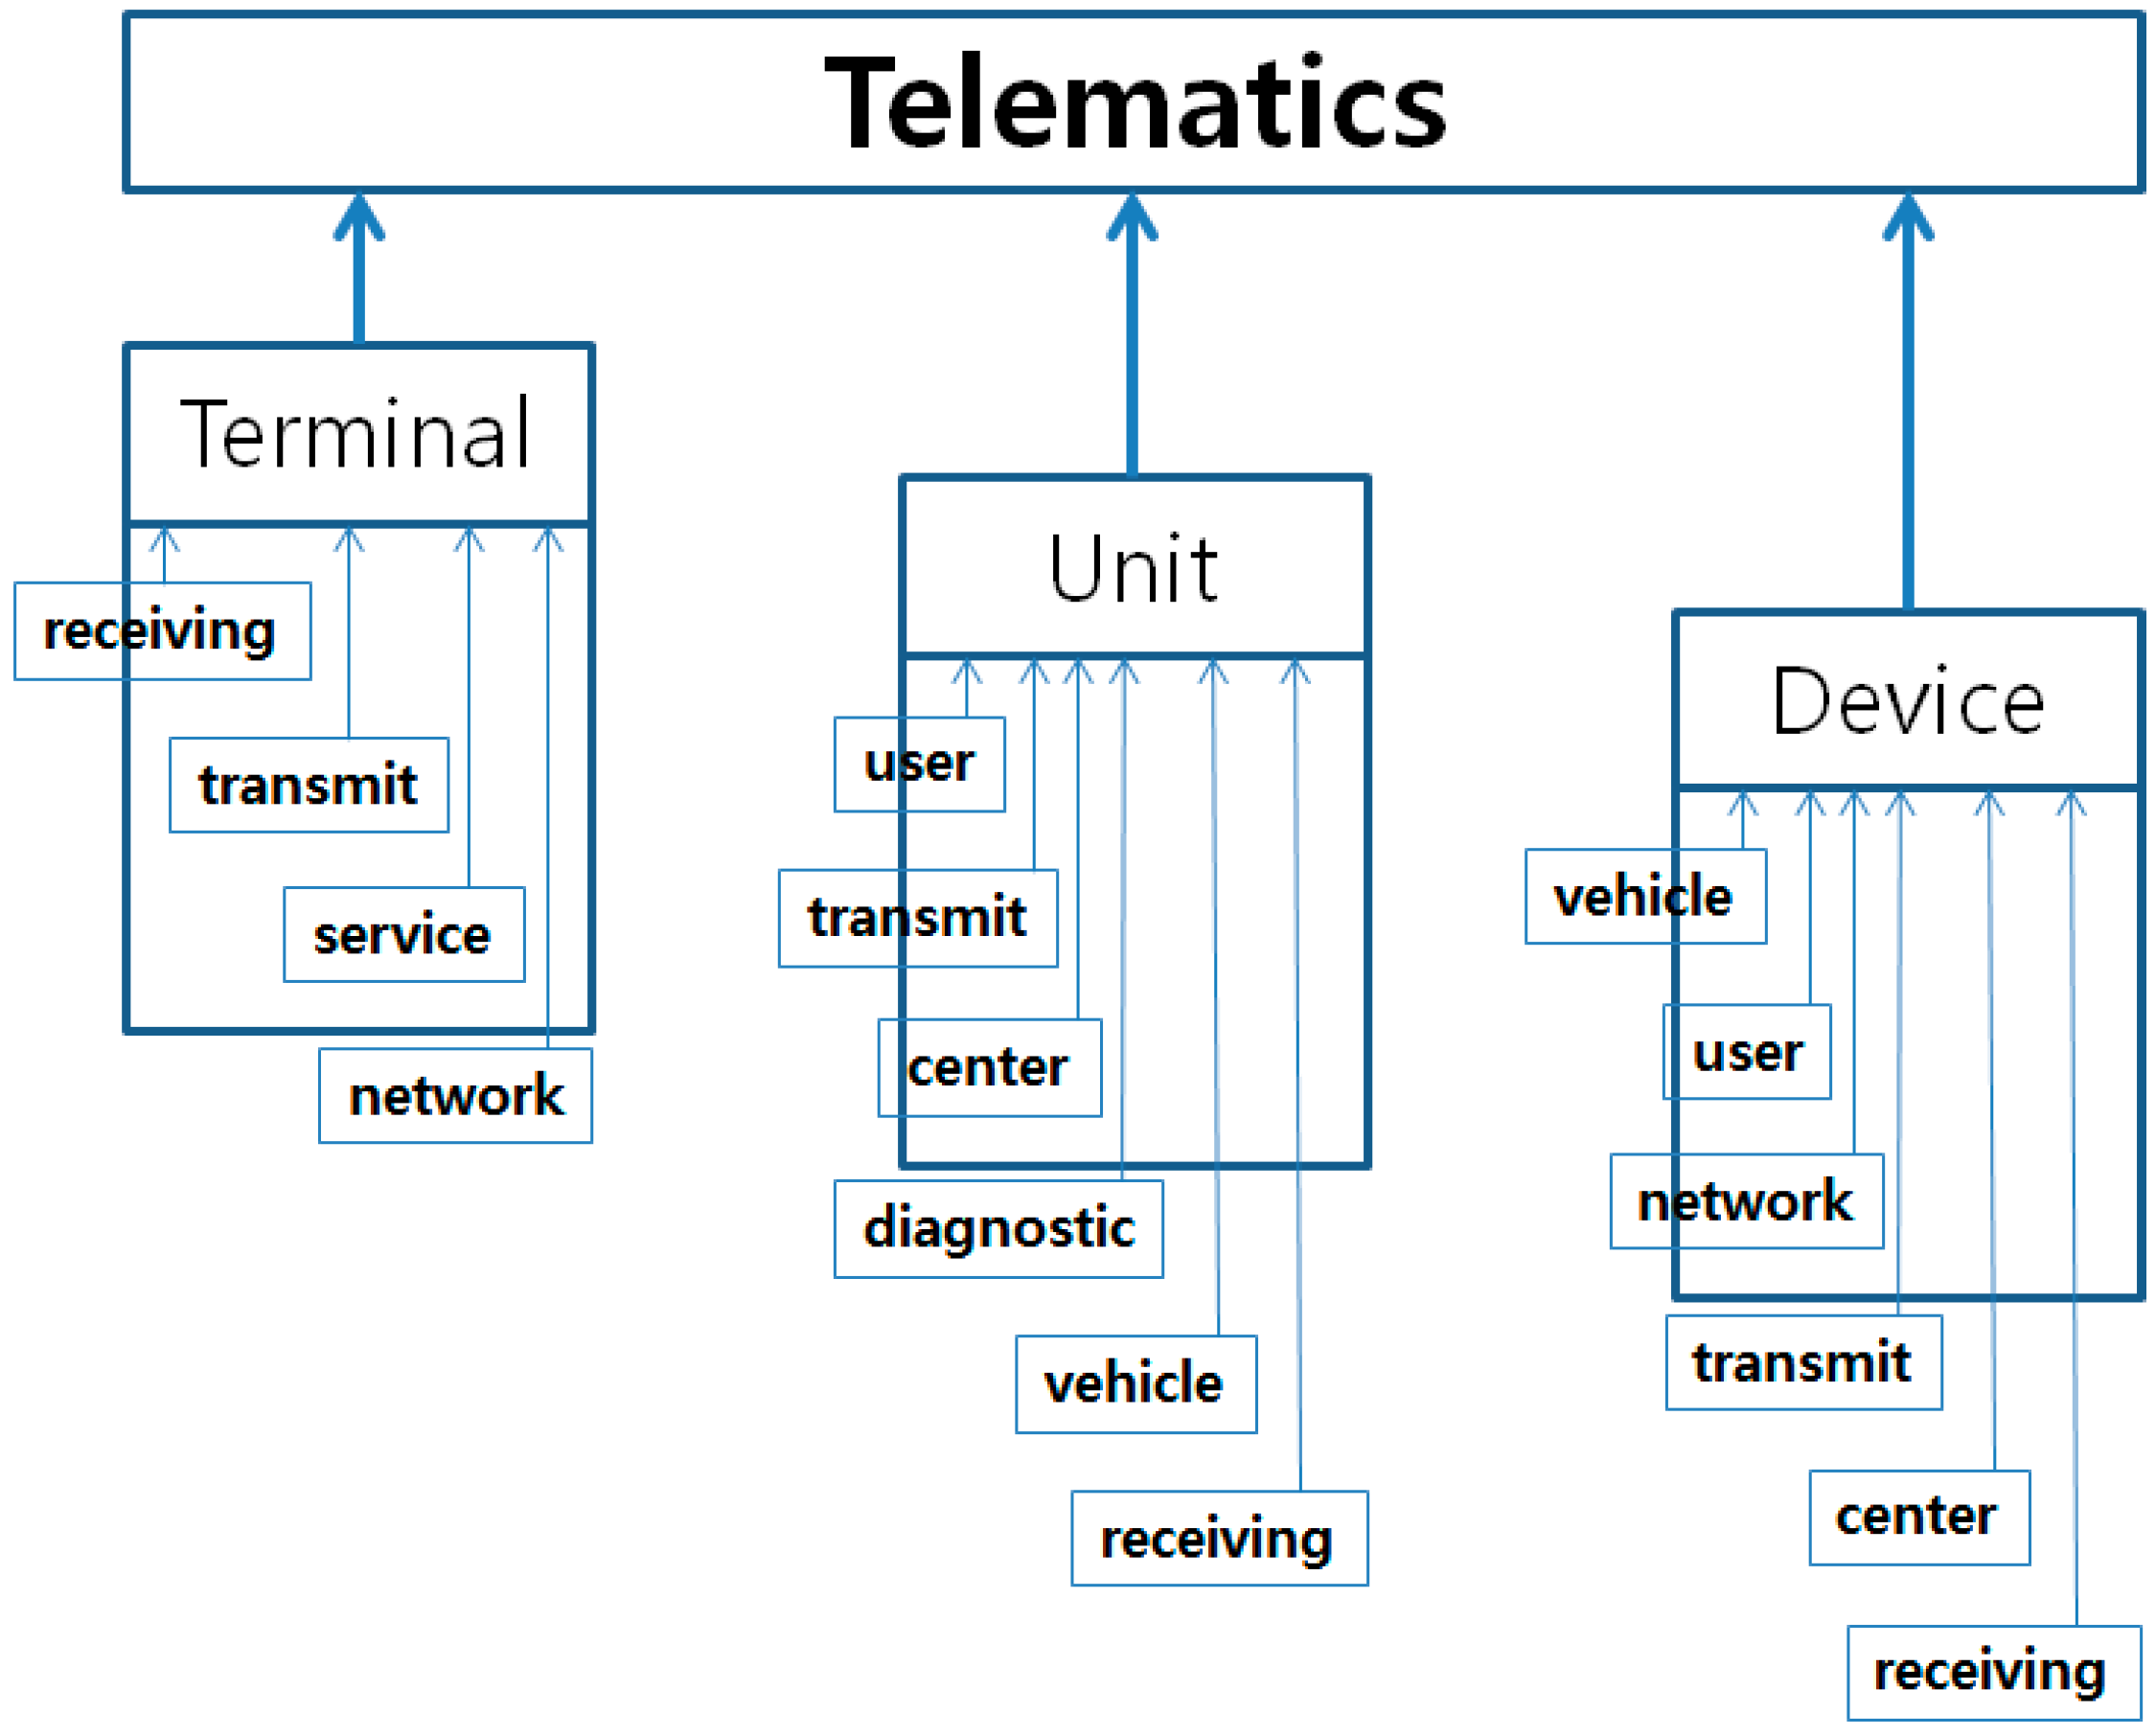
3.2. Hierarchical Diagram of Technology for Sustainable Technology Management

In this paper, we propose a methodology of HDT for the STM. This research is considered an approach to a patent analysis method; that is, we analyze patent data to construct our HDT model. Thus, we have to retrieve patent documents from patent offices worldwide consisting of items such as the patent title, filing date, grant date, name of inventor, abstract, specification, claims, and drawings [13]. From these patent data sources, we attempt to perform diverse patent analyses. In our research, we use some text mining techniques to preprocess retrieved patent documents [36,37,38,39]. First, we extract the abstracts from the retrieved patent documents. Using the corpus and text repository of the text mining techniques, we construct a patent-term matrix (PTM) [2]. The rows and columns of this matrix represent the documents and terms, respectively. In addition, the PTM element is the frequency value of the term occurrence in each document. In general, the matrix dimension is very large, and, thus, we have to reduce this dimension. In this paper, we select keywords from the PTM, and this approach settles the dimension problem of the PTM. After stemming and eliminating meaningless terms such as whitespace from the PTM, we find the top-ranked terms to determine the keywords for constructing our HDT. From the top-ranked terms, we remove meaningless terms such as “is” and “the”, using the remaining terms as our keywords. Second, we build a patent-keyword matrix (PKM) using the determined keywords [40]. Similar to the PTM, the rows and columns of the PKM are the patents and keywords, respectively. The elements of this matrix also represent the keyword occurrence frequency in each patent. Third, we perform full and reduced regression analyses to construct our HDT model. In this paper, we use a multiple linear regression model, as follows.
Z = β 0 + β 1 X 1 + β 2 X 2 + + β k X k + ε
where Z is the dependent variable (technology that needs to be developed), and Xs are independent variables (developed technologies). In addition, ε is the error term. The regression parameters (β1, β2, …, βk) represent the causal strength between the two technologies represented by keywords. For example, β1 is the negative or positive change in the Z value by a one-unit change of X1. In the full regression model, we use all independent variables and construct hypotheses as follows.
H 0 : β i = 0 v s . H 1 : β i 0 , i = 1 , 2 , ... , k
To determine the significant X technologies affecting the Z technology, we should perform the hypothesis testing. The null hypothesis H0 represents the ith regression parameter equaling zero. This means that the ith technology Xi does not affect the target technology Z. Also, the alternative hypothesis H1 shows that the ith regression parameter is not equal to zero, so the development of technology Z is dependent on technology Xi. To conclude that technology Xi significantly affects Z, we can reject H0 by statistical testing. We use t-distribution with n − (k + 1) degrees of freedom for hypothesis testing. The n and k are the data size and the number of variables. If H0 is true, we can compute the test statistic as follows:
t = β ^ i S β ^ i
where β ^ i is the estimator of β i and S β ^ i is the standard error of β ^ i . To reject H0, the following condition should be satisfied:
| t | > t ( n ( k + 1 ) ) , α 2
where α is the significance level, and we also can get the value of t(n−(k+1)),α/2 from the t-table. To perform easier testing, we use the probability value (p-value). The p-value is the smallest significance level required to check whether a variable is significant [41]. If the p-value of a variable is less than 0.05 in the regression result, this variable is significant (i.e., at the 95% confidence interval). We conclude that the technology of Xi is significant when the p-value of its test statistic is less than 0.05. That is, to develop the reduced regression model, we select variables with p-values less than 0.05. With some results of our reduced regression models, we can construct our HDT model in Figure 3.
Here, our dependent technology is Z and other variables are all independent technologies that explain Z. Each path is a regression model that represents a reduced regression analysis, for example the path u11 is a reduced regression model, as follows.
X 1 = u 01 + u 11 W 1
We consider X1 an affected technology, and W1 a developed technology. Furthermore, u11 is the causal strength between X1 and W1. The aim of the proposed model is to find all causal strengths to predict the technological trend of Z. The technology of Wm influences the development of technology Z according to the causal strength of (ump × vpn × rn). Therefore, we can calculate all causal strengths of all technologies, except Z for the Technology Forecasting (TF) of Z. So the process from the regression model based on SPA to sustainable R&D planning is shown in Figure 4.
We start to perform all regression models according to the variable (patent keyword) combinations. The result of this step contains entire and reduced regression equations by p-value. The selected regression equations can be the rules for managing sustainable technology, and we construct the HDT using the rules. Finally, we extract the meaningful rules from the HDT, and use them for building sustainable R&D strategy. Therefore, Figure 5 shows the whole procedure for our methodology.
This figure shows all the steps taken from the patent document retrieval to the completed HDT. Detailed research steps are presented as follows.
Step 1.
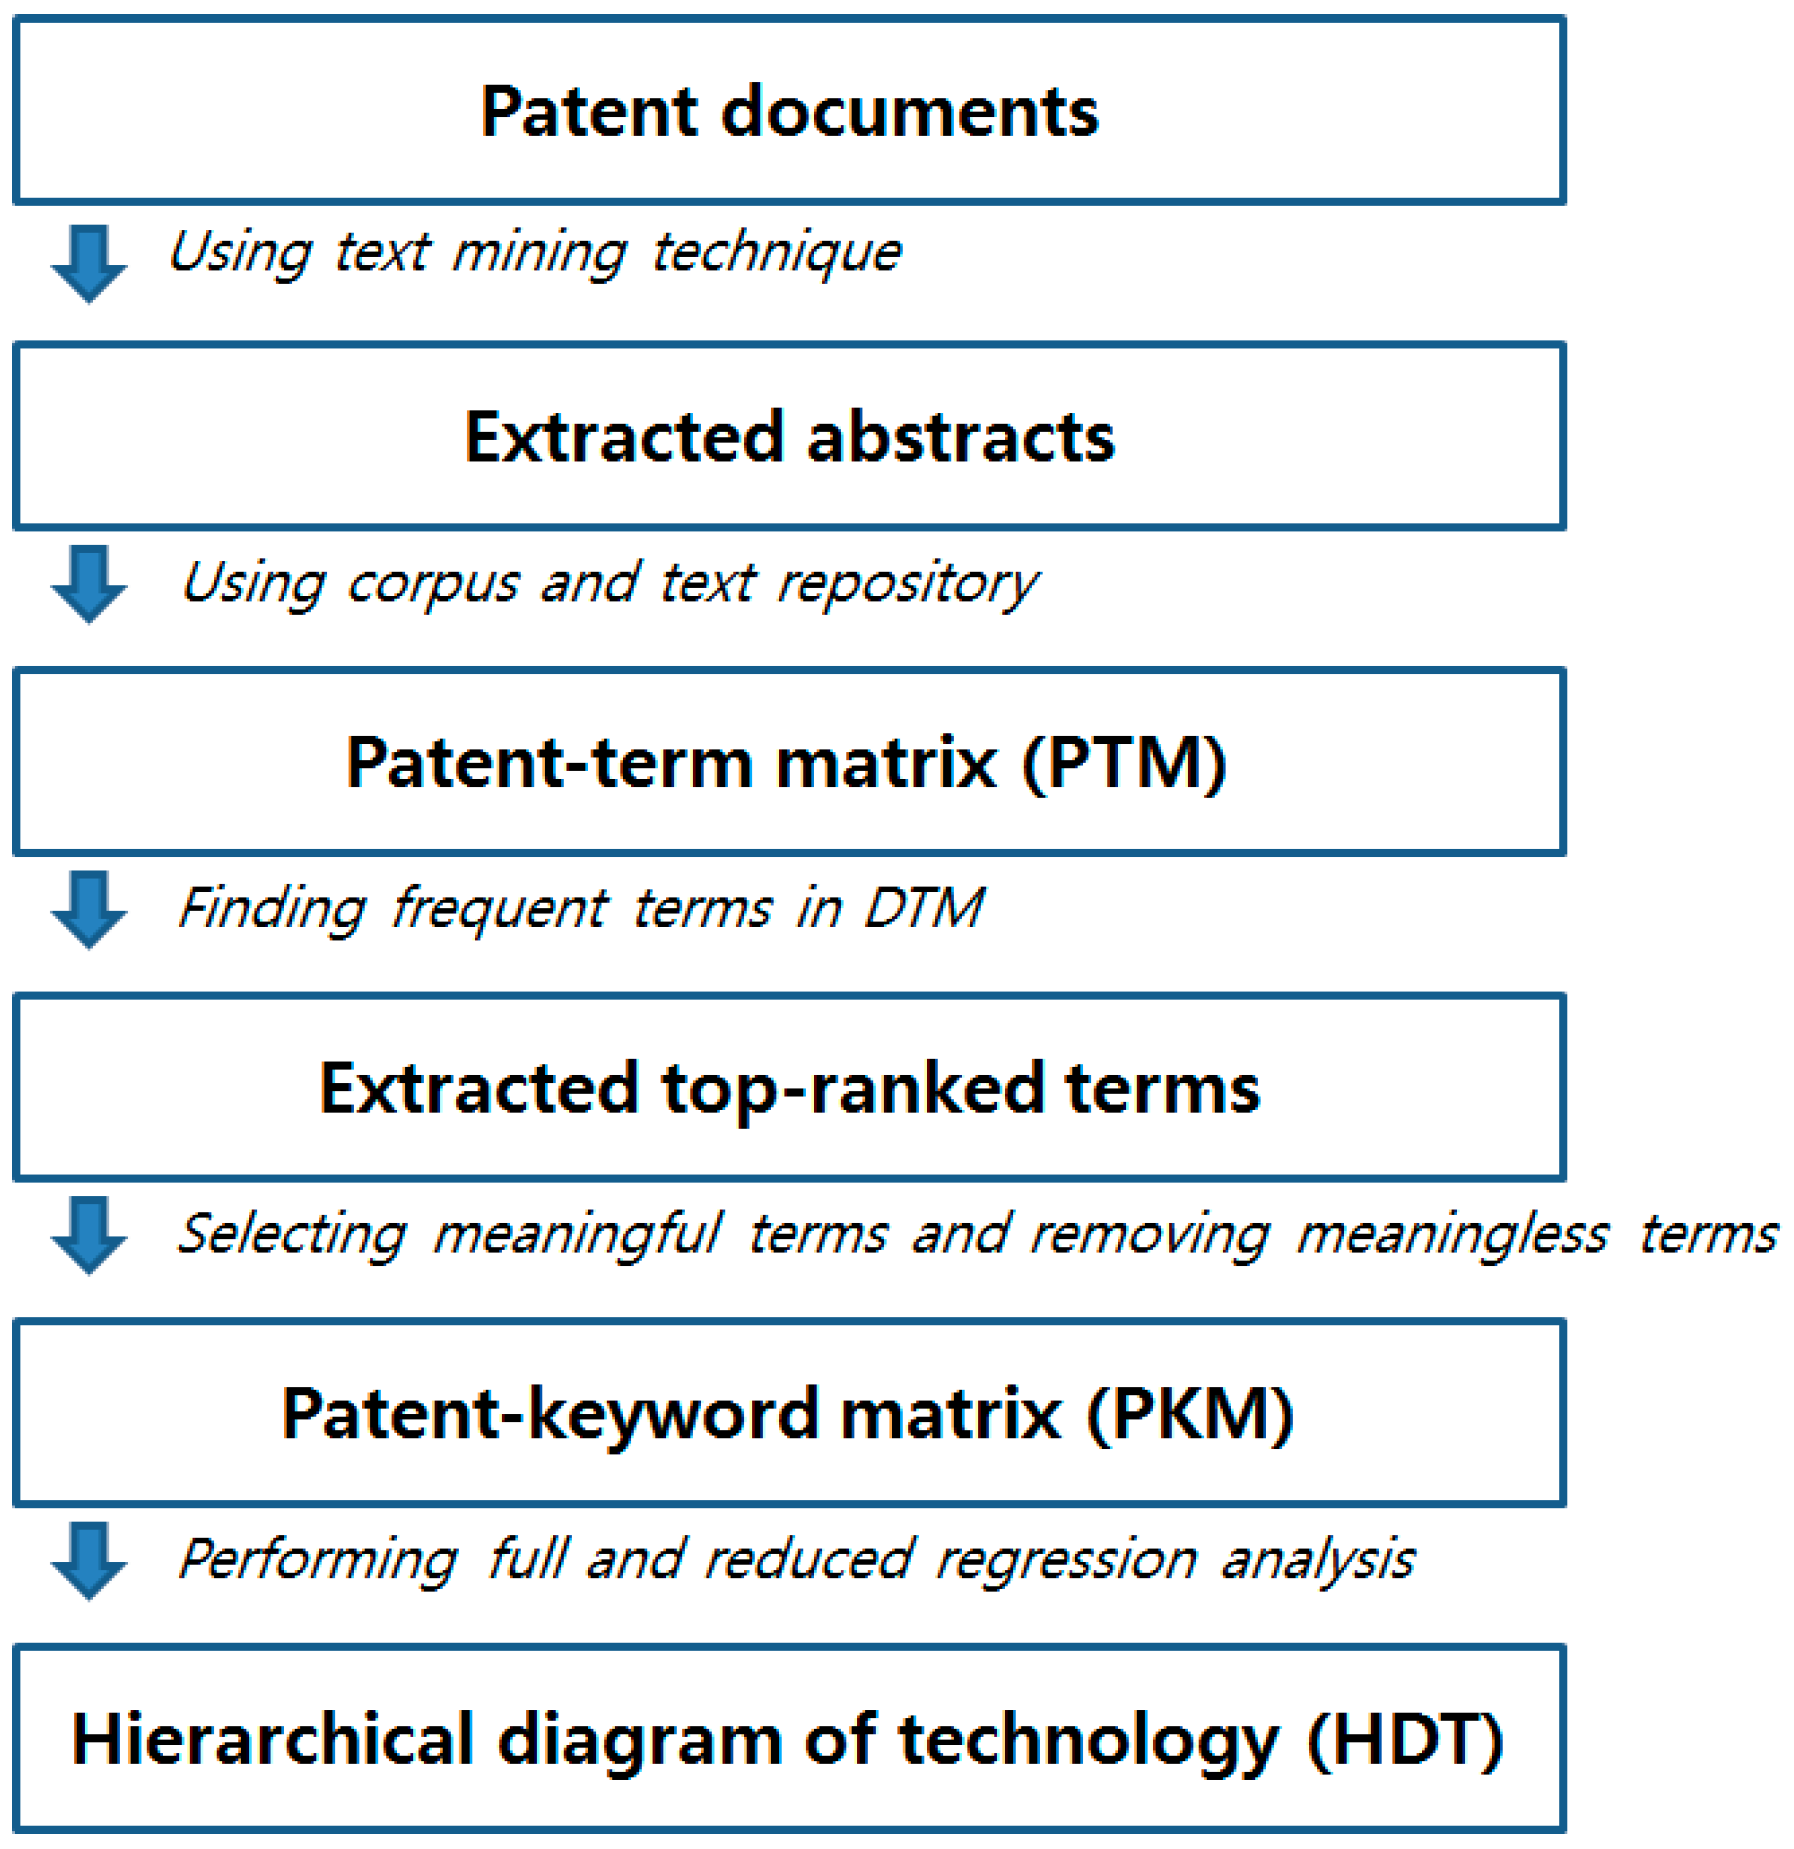
Retrieve patent documents for the given technology area
Step 2.
Construct a patent-term matrix (PTM) from the abstracts of the patent data
Step 3.
Reconstruct a patent-keyword matrix (PKM) from the PTM
(1)
Search top-ranked terms in the PTM
(2)
Remove meaningless terms
(3)
Determine the keywords using the remaining terms
(4)
Build a PKM
Step 4.
Perform hierarchical regression analysis
(1)
Perform a full regression model using all of the keywords
(2)
Perform a reduced regression model using selected keywords
(3)
Construct the complete HDT
Step 5.
Interpret the constructed HDT model for sustainable technology management
In this paper, the proposed HDT model provides a means of predicting the causal relationship between an affected technology and developed technologies for the STM. We attempt to manage the sustainable technology of a given technology using the HDT result in this paper. To show how our research can be applied to a real problem, we perform a case study of the STM for the term “telematics” in the next section.

4. Experimental Results

In this paper, we verified the performance of our research using a case study with patent documents, retrieved from KIPRIS, USPTO and the WIPS Corporation [29,30,31]. We selected telematics as the technology field used for the target technology. For this case study, our dataset consisted of telematics patents that apply in the U.S., Europe, and China. The total number of selected patent documents was 474. Figure 6 shows the number of patents by year.
The applied numbers increased remarkably from the 2000s on. So, we can consider this technology as one of the new emerging technologies. We used the title and abstracts of the retrieved patent documents to construct a PTM for SPA. The rows and columns of this matrix represent the documents and terms, respectively. Each element of the matrix shows the frequency value of the term occurrence in each document. In this experiment, we performed a hierarchical regression analysis for the HDT of telematics by analyzing this PTM. To select the variables for our path analysis, we determined the top 20 keywords that included telematics. The keywords were “center”, “communication”, “connection”, “control”, “device”, “diagnostic”, “information”, “message”, “mobile”, “network”, “receiving”, “request”, “service”, “signal”, “telematics”, “terminal”, “transmit”, “unit”, “user”, and “vehicle”. Thus, we constructed the full regression model as follows:
telematics = β 0 + β 1 c e n t e r + + β 19 v e h i c l e + ε
The dependent variable of the regression model was “telematics” because this is the target technology in our case study. All keywords except “telematics”, were used for the independent variables. Table 1 shows the results of the full regression analysis.
To overcome the scale dependencies between the variables, we constructed the standardized regression model. The beta of Table 1 shows the regression parameter of the standardized variable, and thus we can compare objectively the effects of all independent variables on the dependent variable. In other words, the beta is the change of “telematics” associated with a one-unit change (increase or decrease) in each independent variable. For example, a one-unit change of “center” increases the occurrence of “telematics” by 0.126. In addition, we found that “unit” had the biggest influence on “telematics”. The significance of an independent variable on a dependent variable is determined by its p-value. Under the 95% confidence level, we could decide the significant variables with a p-value less than 0.05. Thus, we selected “center”, “device”, “diagnostic”, “network”, “receiving”, “request”, “service”, “terminal”, “transmit”, “unit”, “user”, and “vehicle” as the independent variables for our model. Next, we constructed a reduced regression model to create the HDT for the STM of “telematics” in Table 2.
All independent variables are significant, because their p-values are less than 0.05. Among them, we selected the independent variables of the top three. The beta values of “device”, “unit”, and “terminal” are larger than those of the others. They had beta values over 0.2. Therefore, we construct the first-level HDT model as follows.
This research found that the variables of “device”, “unit”, and “terminal” directly affect “telematics”. So, we can find that the technologies based on “device”, “unit”, and “terminal” are important and meaningful for developing the telematics technology. In addition, other independent variables indirectly affect “telematics” via “device”, “unit”, and “terminal”. Therefore, we constructed three regression models of three dependent variables (i.e., device, unit, and terminal) to complete our HDT model for the “telematics” sustainable technology; the results are in Table 3.
Here, according to the three dependent variables, we selected independent variables with statistical significance for each dependent variable using statistical significance based on the p-value. Considering the p-value under 0.05 (95% confidence level), we set “center”, “network”, “receiving”, “transmit”, “user”, and “vehicle” as independent variables for “device”, because their p-values were smaller than 0.05. Similarly, we decided on the independent variables required for “unit” and “terminal” as follows.
From the result of Table 4, we know the technologies of “center”, “network”, “receiving”, “transmit”, “user”, and “vehicle” influence the development of the technology of “device”, and this development also affects the technological development of “telematics”. The cases of “unit” and “terminal” are the same to the “device” technology. Therefore, using the results of Figure 7 and Table 4, we made our complete hierarchical model for “telematics” sustainable technology as follows.
This model shows the technological connections for “telematics” sustainable technology. Each connecting weight represents the strength from the lower side to the higher side. For example, the “receiving” technology affects the “terminal” technology by a connecting strength of 0.133. In addition, this weight is significant because all p-values of this table are smaller than 0.05. The “terminal” technology continuously influences the “telematics” technology by a connecting weight of 0.422. If we want to know the direct influence of the “receiving” technology on the “telematics” technology, we must multiply two weights: that of “receiving” on “terminal” (0.133), and that of “terminal” on “telematics” (0.422). So, the “receiving” technology affects the “telematics” technology indirectly (through the “terminal” technology) by a connecting strength of 0.056 (0.133 multiplied by 0.422). The remainder of the hierarchical diagram can be similarly interpreted. Therefore, using the result of Table 5, we can manage the sustainable technology related to telematics technology for sustainable R&D planning as follows.
In Figure 8, the shorter the length of the arrow, the stronger the technological influence is. So the first rule for the STM is: receiving technology -> terminal technology -> telematics technology. Other rules are all meaningful rules for the STM. In this paper, we selected a total of 16 rules for managing the sustainable technology. In conclusion, we can apply our results to build a sustainable R&D strategy.

5. Conclusions

This paper studied the STM. In general, we can consider various approaches to manage sustainable technology. This paper dealt with the HDT based on SPA for the STM. For a given technology field, we can provide some technology rules to a company or a nation using our HDT result. They can use our result to plan their sustainable R&D strategy. To expect more efficient and effective results for sustainable R&D planning, we should collect quality patent documents from the patent databases of the world.
In this paper, we proposed an HDT model based on a hierarchical regression (SPA) using the keyword structure of patent documents, which is a new patent analysis model for TA. The retrieved patent documents were transformed into a PTM using a preprocessing method based on text mining techniques. We used the abstracts from the patent documents, because this research required representative terms for each patent document. We performed full and reduced regression methods to construct the HDT model for the STM. We determined the dependent variable (target technology) and independent variables (developed technologies) from the SPA result using all the extracted keywords. Based on the p-value criterion, we selected significant technology keywords for the final HDT. In our case study, we built the technological rules for the STM of the telematics technology. The keywords of “center”, “device”, “diagnostic”, “network”, “receiving”, “service”, “terminal”, “transmit”, “unit”, “user”, “vehicle” were selected for constructing the STM. From these, we found that “terminal”, “unit”, and “device” directly affected “telematics”. Other keywords indirectly influenced “telematics” via “terminal”, “unit”, and “device”. This research contributes to the sustainable R&D planning of MOT. In addition, a company can plan their R&D schedule for developing sustainable technology from the results of our HDT.
This paper was our first attempt to manage sustainable technology. In this paper, we only used the patent abstracts and considered regression-based models for the HDT. However, there are many patent data sources and analytical methods for the HDT of sustainability. In future works, we will use diverse information from the retrieved patent data such as date, citations, claims, international patent classification (IPC) codes, etc. In addition, more advanced methods for patent analysis will be considered to improve the performance of MOST. Therefore, we intend to develop more advanced HDT methodologies using diverse analytics based on statistical analyses and machine learning algorithms.

Author Contributions

Junhyeog Choi designed this research and collected the data set for the experiment. Sunghae Jun analyzed the data to show the validity of this paper. Sangsung Park wrote the paper and performed all the research steps. In addition, all authors have cooperated with each other for revising the paper.

Conflicts of Interest

The authors declare no conflict of interest.

References

  1. Choi, J.; Jang, D.; Jun, S.; Park, S. A Predictive Model of Technology Transfer using Patent Analysis. Sustainability 2015, 7, 16175–16195. [Google Scholar] [CrossRef]
  2. Jun, S.; Park, S.; Jang, D. Technology Forecasting using Matrix Map and Patent Clustering. Ind. Manag. Data Syst. 2012, 112, 786–897. [Google Scholar] [CrossRef]
  3. Lin, G.T.R.; Lee, Y.C. Scientific Innovation of Bioremediation Technologies. J. Sci. Ind. Res. 2015, 74, 197–201. [Google Scholar]
  4. Saraf, C.U. Elements of managing transfer of technology from laboratory to industry: Technology Transfer Management (TTM). J. Sci. Ind. Res. 2014, 73, 704–710. [Google Scholar]
  5. Roper, A.T.; Cunningham, S.W.; Porter, A.L.; Mason, T.W.; Rossini, F.A.; Banks, J. Forecasting and Management of Technology; John Wiley & Sons: Hoboken, NJ, USA, 2011. [Google Scholar]
  6. Firat, A.K.; Woon, W.L.; Madnick, S. Technological Forecasting—A Review; Composite Information Systems Laboratory (CISL), Massachusetts Institute of Technology: Cambridge, MA, USA, 2008. [Google Scholar]
  7. Jun, S.; Lee, S. Emerging Technology Forecasting Using New Patent Information Analysis. Int. J. Softw. Eng. Its Appl. 2012, 6, 107–115. [Google Scholar]
  8. Yoon, B.; Park, Y. Development of New Technology Forecasting Algorithm: Hybrid Approach for Morphology Analysis and Conjoint Analysis of Patent Information. IEEE Trans. Eng. Manag. 2009, 54, 588–599. [Google Scholar] [CrossRef]
  9. Choi, C.; Park, Y. Monitoring the Organic Structure of Technology Based on the Patent Development Paths. Technol. Forecast. Soc. Chang. 2009, 76, 754–768. [Google Scholar] [CrossRef]
  10. Wang, M.; Chang, D.; Kao, C. Identifying technology trends for R&D planning using TRIZ and text mining. R&D Manag. 2010, 40, 491–509. [Google Scholar]
  11. Choi, S.; Kim, H.; Yoon, J.; Kim, K.; Lee, J.Y. An SAO-based text-mining approach for technology roadmapping using patent information. R&D Manag. 2013, 43, 52–74. [Google Scholar]
  12. Han, E.J.; Sohn, S.Y. Patent valuation based on text mining and survival analysis. J. Technol. Transf. 2015, 40, 821–839. [Google Scholar] [CrossRef]
  13. Hunt, D.; Nguyen, L.; Rodgers, M. Patent Searching Tools & Techniques; John Wiley & Sons: Hoboken, NJ, USA, 2007. [Google Scholar]
  14. Lee, H.J.; Lee, S.; Yoon, B. Technology Clustering Based on Evolutionary Patterns: The Case of Information and Communications Technologies. Technol. Forecast. Soc. Chang. 2011, 78, 953–967. [Google Scholar] [CrossRef]
  15. Park, Y.; Lee, S.; Lee, S. Patent analysis for promoting technology transfer in multi-technology industries: The Korean aerospace industry case. J. Technol. Transf. 2012, 37, 355–374. [Google Scholar] [CrossRef]
  16. Kim, Y. From catch-up to overtaking: Competition and innovation in the semiconductor industries of Korea and Japan. Asian J. Technol. Innov. 2012, 19, 297–311. [Google Scholar] [CrossRef]
  17. Guo, B.; Chen, X. How does FDI influence industry-level knowledge production efficiency in China? Asian J. Technol. Innov. 2012, 19, 263–277. [Google Scholar] [CrossRef]
  18. Yoon, B.; Phaal, R.; Probert, D. Morphology analysis for technology roadmapping: Application of text mining. R&D Manag. 2008, 38, 51–68. [Google Scholar]
  19. Banerjee, G. Assessing Visibility of Research Organizations: A Fuzzy Analytic Network Process Approach. J. Sci. Ind. Res. 2014, 73, 283–289. [Google Scholar]
  20. Grönqvist, C. The private value of patents by patent characteristics: Evidence from Finland. J. Technol. Transf. 2009, 34, 159–168. [Google Scholar] [CrossRef]
  21. Hall, B.H. Exploring the Patent Explosion. J. Technol. Transf. 2004, 30, 35–48. [Google Scholar] [CrossRef]
  22. Kim, G.J.; Park, S.S.; Jang, D.S. Technology Forecasting using Topic-Based Patent Analysis. J. Sci. Ind. Res. 2015, 74, 265–270. [Google Scholar]
  23. Lee, S.; Lee, S.; Seol, H.; Park, Y. Using patent information for designing new product and technology: Keyword based technology roadmapping. R&D Manag. 2008, 38, 169–188. [Google Scholar]
  24. Lee, S.; Yoon, B.; Lee, C.; Park, J. Business planning based on technological capabilities: Patent analysis for technology-driven roadmapping. Technol. Forecast. Soc. Chang. 2009, 76, 769–786. [Google Scholar] [CrossRef]
  25. OuYang, K.; Weng, C.S. A new comprehensive patent analysis approach for new product design in mechanical engineering. Technol. Forecast. Soc. Chang. 2011, 78, 1183–1199. [Google Scholar] [CrossRef]
  26. Grimaldi, M.; Cricelli, L.; Di Giovanni, M.; Rogo, F. The patent portfolio value analysis: A new framework to leverage patent information for strategic technology planning. Technol. Forecast. Soc. Chang. 2015, 94, 286–302. [Google Scholar] [CrossRef]
  27. Park, S.; Lee, S.; Jun, S. A Network Analysis Model for Selecting Sustainable Technology. Sustainability 2015, 7, 13126–13141. [Google Scholar] [CrossRef]
  28. Kim, S.; Jang, D.; Jun, S.; Park, S. A Novel Forecasting Methodology for Sustainable Management of Defense Technology. Sustainability 2015, 7, 16720–16736. [Google Scholar] [CrossRef]
  29. Korea Intellectual Property Rights Information Service (KIPRIS), 2015. Available online: http://www.kipris.or.kr (accessed on 1 September 2015).
  30. The United States Patent and Trademark Office (USPTO), 2015. Available online: http://www.uspto.gov (accessed on 1 September 2015).
  31. Wipson Company Ltd. (WIPSON), 2015. Available online: http://www.wipson.com (accessed on 1 September 2015).
  32. Berthold, M.; Hand, D.J. Intelligent Data Analysis—An Introduction; Springer: Berlin, Germany, 1999. [Google Scholar]
  33. Robinson, D.K.R.; Propp, T. Multi-path Mapping for Alignment Strategies in Emerging Science and Technologies. Technol. Forecast. Soc. Chang. 2011, 75, 517–538. [Google Scholar] [CrossRef]
  34. Ng, B.; Chandran, V.G.R.; Kanagasundram, T. Technological knowledge, learning and linkages in the wooden furniture industry in Malaysia: A spatial innovation perspective. Asian J. Technol. Innov. 2012, 20, 187–200. [Google Scholar] [CrossRef]
  35. Rasiah, R.; Mohamad, M.R.B.; Sanjivee, P. Production linkages, technological intensities and economic performance: Small and medium enterprises in Malaysian manufacturing. Asian J. Technol. Innov. 2011, 19, 279–296. [Google Scholar] [CrossRef]
  36. Feinerer, I.; Hornik, K.; Meyer, D. Text Mining Infrastructure in R. J. Stat. Softw. 2008, 25, 1–54. [Google Scholar] [CrossRef]
  37. Feinerer, I. Package tm—Text Mining; CRAN R-Project: Vienna, Austria, 2015. [Google Scholar]
  38. R Development Core Team. A Language and Environment for Statistical Computing. Vienna, Austria, 2015. Available online: http://www.R-project.org (accessed on 15 July 2016).
  39. Tseng, Y.H.; Lin, C.J.; Lin, Y.I. Text Mining Techniques for Patent Analysis. Inf. Proc. Manag. 2007, 43, 1216–1247. [Google Scholar] [CrossRef]
  40. Kim, J.; Jun, S. Graphical Causal Inference and Copula Regression Model for Apple Keywords by Text Mining. Adv. Eng. Inf. 2015, 29, 918–929. [Google Scholar] [CrossRef]
  41. Ross, S.M. Probability and Statistics for Engineers and Scientists, 4th ed.; Elsevier: Amsterdam, The Netherlands, 2012. [Google Scholar]
Figure 1. Sustainable technology structure.
Sustainability 08 00688 g001
Figure 2. Hierarchical diagram structure by SPA.
Sustainability 08 00688 g002
Figure 3. HDT model.
Sustainability 08 00688 g003
Figure 4. Process for constructing HDT and sustainable R&D strategy.
Sustainability 08 00688 g004
Figure 5. Process for constructing HDT.
Sustainability 08 00688 g005
Figure 6. Number of telematics patents by year.
Sustainability 08 00688 g006
Figure 7. First-level HDT related to telematics.
Sustainability 08 00688 g007
Figure 8. Final HDT for sustainable R&D planning.
Sustainability 08 00688 g008
Table 1. Beta and probability values of the full regression model.
Independent VariableBetap-Value
center0.1260.001
communication−0.0040.857
connection−0.0090.642
control0.0370.072
device0.2860.001
diagnostic−0.0440.024
information0.0220.346
message0.0240.236
mobile0.0030.893
network0.0600.003
receiving0.0860.001
request0.0630.004
service0.1690.001
signal0.0190.440
terminal0.2190.001
transmit−0.1540.001
unit0.3210.001
user0.0670.001
vehicle0.1520.001
Table 2. Beta and probability values of the reduced regression model.
Independent VariableBetap-Value
center0.1240.001
device0.2850.001
diagnostic−0.0450.001
network0.0610.019
receiving0.1010.002
request0.0630.001
service0.1710.003
terminal0.2200.001
transmit−0.1340.001
unit0.3250.001
user0.0690.001
vehicle0.1650.001
Table 3. Beta and probability values of the three regression models.
Independent VariableDependent Variable
DeviceUnitTerminal
Betap-ValueBetap-ValueBetap-Value
center−0.0930.0010.0930.0010.0010.962
diagnostic0.0400.140−0.0930.0010.0150.579
network0.1230.0010.0190.4640.0680.011
receiving0.0600.0480.0700.0200.1310.001
request−0.0200.4840.0250.3910.0550.062
service0.0330.2530.0440.1250.1000.001
transmit0.0960.0010.0960.0010.1240.001
user0.0480.0010.1820.0010.0240.388
vehicle0.0160.0010.0790.005−0.0530.066
Table 4. Selected independent variables for the three dependent variables.
Dependent VariableSelected Independent Variable
devicecenter, network, receiving, transmit, user, vehicle
unitcenter, diagnostic, receiving, transmit, user, vehicle
terminalnetwork, receiving, service, transmit
Table 5. Complete Hierarchical Diagram of Technology (HDT) model for telematics Technology Forecasting (TF).
Telematics
FirstSecondThird
Terminal (0.422)Unit (0.352)Device (0.282)
First: user (0.195)First: vehicle (0.147)
First: receiving (0.133)Second: transmit (0.106)Second: user (0.138)
Second: transmit (0.130)Third: center (0.103)Third: network (0.125)
Third: service (0.113)Fourth: diagnostic (−0.094)Fourth: transmit (0.097)
Fourth: network (0.067)Fifth: vehicle (0.087)Fifth: center (−0.091)
Sixth: receiving (0.079)Sixth: receiving (0.063)

